Design of a Stand-Alone Photovoltaic Model for Home Lightings and Clean Environment
 Vincent Anayochukwu Ani
- Department of Electronic Engineering, University of Nigeria, Nsukka, Nigeria
This paper gives a well-documented health risk of fuel-based lighting (kerosene lamps and fuel-powered generators) and proposed a design of a stand-alone solar PV system for sustainable home lightings in rural Nigerian area. The design was done in three different patterns of electricity consumptions with energy efficient lightings (EELs) using two different battery types (Rolls Surrette 6CS25PS and Hoppecke 10 OpzS 1000) on; (i) judicious power consumption, (ii) normal power consumption, and (iii) excess power consumption; and compared them with the incandescent light bulb consumption. The stand-alone photovoltaic energy systems were designed to match the rural Nigerian sunlight and weather conditions to meet the required lightings of the household. The objective function and constraints for the design models were formulated and optimization procedures were used to demonstrate the best solution (reliability at the lowest lifecycle cost). Initial capital costs as well as annualized costs over 5, 10, 15, 20, and 25 years were quantified and documented. The design identified the most cost-effective and reliable solar and battery array among the patterns of electricity consumption with EEL options (judicious power consumption, normal power consumption, and excess power consumption).
Introduction
Access to adequate, reliable, sustainable, and affordable modern energy services facilitates basic household comforts. Electricity is an important resource to support economic and social development of any society; it is, in fact, one of the discoveries that have transformed mankind. Modern society’s reliance on electrical power is so great that it is considered a basic need (Foster et al., 2010). As there are people who cannot imagine life without electricity, there are others who have never enjoyed the beauty of electricity. To them, they cannot imagine what electricity is? In Nigeria, especially in rural areas, many villagers are not connected to national grid and it will take time for them to be connected to the grid due to great expense in grid expansion and inefficiency of the total national installed capacity. It is very unfortunate that people in rural areas and among the poorest populations have to use kerosene lamps that have very poor light. Most of the people living in rural areas of Nigeria need electricity mostly for lighting, and lighting is the dominant use of kerosene in rural areas and among the poorest populations. Although, kerosene lamps are comparatively cheaper and easier to replace and viable alternative lighting sources already exist in rural areas and among the poorest populations, they are expensive to operate. Kerosene is costly both for low income households that buy it and for governments that subsidize it. Kerosene costs make up 10–25% of household monthly budgets (Lighting Africa, 2013). Moreover, the widespread use of kerosene for lighting in households poses health risks (Lam et al., 2012a; Mills, 2012a), and these chronic exposure to pollution from kerosene lamps is thus a concern for households.
Fuel-based lighting (kerosene lamps and fuel-powered generators) contributes to climate change, which is also a health and safety risk by releasing substantial amounts of greenhouse-gas emissions (Mills, 2005) and black carbon (Lam et al., 2012a). Research has shown that kerosene lamps are significant sources of atmospheric black carbon. Combustion of kerosene emits many health-damaging pollutants, including particulate matter (PM), carbon monoxide (CO), formaldehyde (CH2O), polycyclic aromatic hydrocarbons (PAH), sulfur dioxide (SO2), nitrogen oxides (NOx), and various volatile organic carbons (VOCs) (Mills, 2012b). Kerosene lamps emit both carbon dioxide (CO2) and black carbon. Black carbon is the result of incomplete combustion of fossil fuel. Black carbon particles absorb sunlight and heat the atmosphere, increasing radiative forcing, and have a powerful but short-lived warming influence, known as a “short-lived climate pollutant” (SLCP). The particulate emissions of kerosene lanterns represent significant amounts of black carbon, strongly implicated in climate change (Zai et al., 2006; Lam et al., 2012a).
Well-documented health risks of kerosene lamps show that exposure to the lamps, which are used indoors and in close proximity to people pose significant health impacts – chronic illness resulting from inhalation of fumes; impairs lung function and increases the risk for respiratory disease, cancer, eye problems, and infectious disease, including tuberculosis, a major health issue in Nigeria (Lam et al., 2012a; Mills, 2014). Inhalation of particulates resulting from indoor combustion causes a range of adverse health effects ranging from tuberculosis to cancer (Dominici et al., 2003; Bai et al., 2007) and asthma (Lam et al., 2012b). Potentially harmful effects include impairment of ventilatory function (Behera et al., 1991) and acute lower respiratory infection (Sharma et al., 1998). Many households use kerosene for lighting (UNEP/GEF en.lighten initiative, 2013), while fuel-based lanterns are burned largely indoors and in close proximity to people, but no corresponding estimates of mortality have been made. Kerosene is highly flammable and there is a high risk of accidents, burns, and even fatalities associated with lamp use. There is no national estimate of burn-injuries attributable to fuel-based lighting. However, it is known that more than 95% of deaths nationwide from fires and all types of burns occur in the rural areas where kerosene lamps are commonly used for lighting. For instance, three multi-year reviews of admissions to Nigerian hospitals attributed approximately 30% of all burn cases to kerosene lamps (Olaitan et al., 2007; Asuquo et al., 2008; Oludiran and Umebese, 2009). Also, thousands of people are maimed each year by lamp explosions, with a 13% fatality rate (Lighting Africa, 2010). Moreover, poor light quality from kerosene lamps, which are often the sole source of lighting after daylight, limits productivity and opportunities for studying (insufficient illumination can lead to poor visual performance, fatigue, and eye strain) as shown in Figure 1.
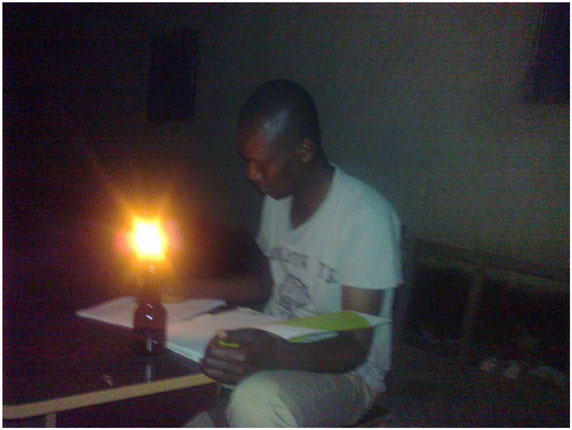
Figure 1. A student studying with kerosene lamp at night.
Another type fuel-based power generation, known as stand-alone fuel-powered generators, a common off-grid source of light, emits concentrations of CO2 and particulates per unit of power generation (Natural Resources Canada, 2008; Gilmore et al., 2010; Edenhofer et al., 2011; Ani and Emetu, 2013). Most households use fuel-based electricity generators to augment the shortfall of electricity supply, and these generators emit gaseous pollutants that negatively affect the environment. Information from Scientific Advisory Panel (2013) shows that fuel-based generators are an important source of black carbon emissions in Nigeria where public power supply lags behind electricity demand. Nationally, both stand-alone generators and kerosene lamps are significant sources of particles of black carbon, a SLCP whose contribution to total carbon emissions is particularly significant in rural areas of Nigeria. This is a growing concern to climate scientists in light of the widespread use of such generators for electrification in off-grid areas (Lam et al., 2012b; Scientific Advisory Panel, 2013). Controlling these sources (stand-alone generators and kerosene lamps) would not only reduce air pollution but also provide clear climate benefits.
Modern off-grid lighting alternative such as solar photovoltaic (PV) systems are generally safer and healthier than fuel-based lighting (kerosene lamps and fuel-powered generators), and have longer product lives, and lower lifecycle costs. Thus, alternatives to fuel-based lighting are an attractive area for achieving quick and cost-effective climate benefits. Moreover, in addition to mitigating climate change, there are major health and development co-benefits to be attained by upgrading from fuel-based to solar PV systems.
Nigeria being in equatorial region, very close to the Equator, has a very high potential of solar energy but, due to lack of awareness many villagers in rural areas do not even think of installing solar PV systems. Very few villagers have taken initiatives and installed PV systems from which they harvest electricity mostly for lighting. However, most of the projects implemented are inefficient and some unsuccessful, the main reason is the little knowledge and awareness on PV solar systems, such as load demand estimation, how to size the system, and which components are needed.
The aim of this study, therefore, is to provide a design models and guideline for a reliable, sustainable, clean, and cost-efficient stand-alone PV energy system that will replace wholly kerosene lamps and fuel-powered generators for lighting in rural areas. Three patterns of daily profile electricity consumption with energy efficient lightings (EELs) (judicious power consumption, normal power consumption, and excess power consumption), and another consumption with incandescent light bulbs, were designed and compared.
Feasibility Study of Different Patterns of Electricity Consumption on Lightings in Rural Nigerian Area
The Reference Household
From the acquired data, different lighting profiles of the household were created. These profiles consist of the household lighting (load) variations and usage patterns within the household. Figures 2A–C show the three patterns of daily profile electricity consumption with EELs (judicious power consumption, normal power consumption, and excess power consumption), whereas Figure 2D shows the consumption with incandescent light bulbs, in a household located in the rural area in Nsukka (Enugu State, Nigeria). Large quantities of electrical energy used for lightings are rarely found in solar home systems (SHSs) for a rural household application. Therefore, this household in the rural area in Nsukka is simple (three bedrooms and a living-room) and does not require large quantities of electrical energy used for lightings [interior lighting (four lighting bulbs; one bulb for each bedroom including the living-room) and exterior lighting (two lighting bulbs; one bulb for the house frontage and another one for the wash-room)]. Tables S1A–S6A in Supplementary Material show an estimation of each energy efficient bulb’s rated power, its quantity, and the hours of use by the three options of household in a single day, whereas (Tables S7A and S8A in Supplementary material) show an estimation of each incandescent bulb’s rated power, its quantity, and hours of use.
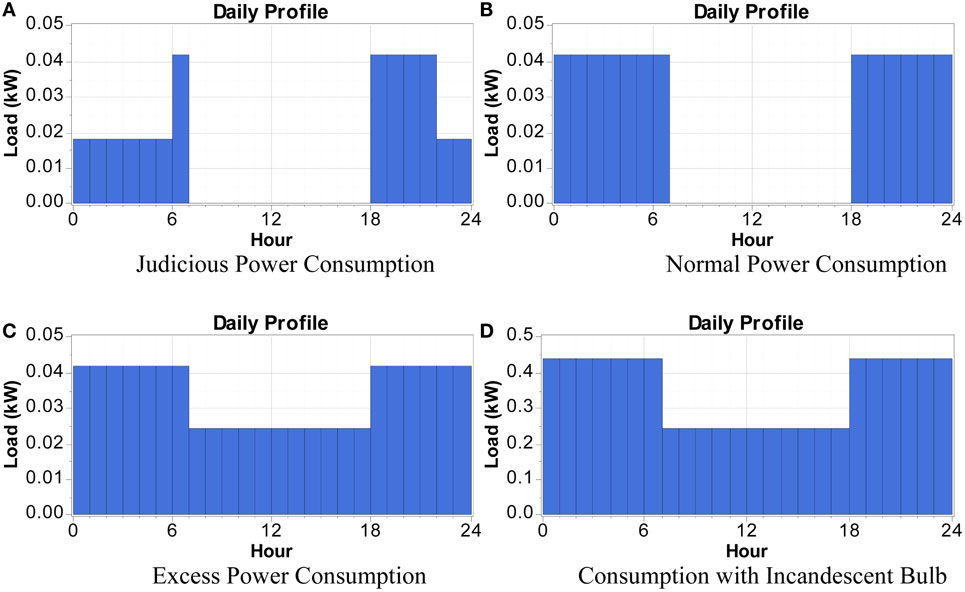
Figure 2. Daily lighting profile of the (A) judicious power consumption, (B) normal power consumption, (C) excess power consumption, and (D) consumption with incandescent bulb.
Description of Different Pattern of Electricity Consumption (Lightings) in a Household
Consumption with Energy Efficient Lightings – Judicious Power Consumption
[This can be done by switching off lightings that were not in use at any given time. Additionally, exterior lighting can be installed with motion detectors to further reduce energy consumption]. The lights in the house will always be ON as from 6.00 a.m. (06:00 h) to 06:59 a.m. (06:59 h). By 7.00 a.m., the light will go off, since the rays of light come in through the windows during day time [7.00 a.m. to 5.59 p.m. (07:00–17:59 h)]. Once it is 6.00 p.m. (18:00 h), both the exterior and the interior lights will come ON and remain ON till 9.59 p.m. (21:59 h). Once it is 10.00 p.m. (22:00 h), there will be light out only in the house (interior lights) leaving the exterior lights ON till 7.00 a.m. (07:00 h) before it goes OFF. Meanwhile, the lights in the house comes ON again by 6.00 a.m. (06:00 h) till 7.00 a.m. (07:00 h) before it goes OFF as shown in Figure 2A as well as in Tables S1A and S2A in Supplementary Material.
Consumption with Energy Efficient Lightings – Normal Power Consumption
All the lightings (both the interior and the exterior) will be ON throughout the night [18:00–06:59 h (6.00 p.m. to 6.59 a.m.)] as shown in Figure 2B as well as in Tables S3A and S4A in Supplementary Material.
Consumption with Energy Efficient Lightings – Excess Power Consumption
The lights in the house always be ON for 24 h [00:00–23:59 h (12.00 a.m. to 12.00 p.m.)], while the exterior lights will always be ON throughout the night, i.e., 12 h [18:00–06:59 h (6.00 p.m. to 6.59 a.m.)] as shown in Figure 2C as well as in Tables S5A and S6A in Supplementary Material.
Consumption with Incandescent Light Bulbs
The lights in the house (interior lights) always be ON for 24 h [00:00–23:59 h (12.00 a.m. to 12.00 p.m.)], while the exterior lights will always be ON throughout the night, i.e., 12 h [18:00–06:59 h (6.00 p.m. to 6.59 a.m.)], as shown in Figure 2D as well as in Tables S7A and S8A in Supplementary Material, which is obtainable in the rural areas of Nigeria.
Solar Potential
The solar potential of a place can be evaluated using various sources, such as solar potential maps, data from the nearest meteorological station, and data from different research institutions. From the latitude (6°51′N) and longitude (7°35′E) of the location of the household sited in Nsukka (Longitude-Latitude-Maps, 2014; The GPS Coordinates, 2014), these data for solar resource were obtained from the National Aeronautics and Space Administration (NASA) Surface Meteorology and Solar Energy web site1. As a benchmark, the monthly mean daily insolation for Nsukka is given in Figure 3, whose average is 4.92 kWh/m2/day. This means that regions, such as North-Central (Benue), Northeast (Borno), Northwest (Kano), South–South (Delta), and Southwest (Ekiti), have a mean daily solar irradiation >4.92 kWh/m2/day.
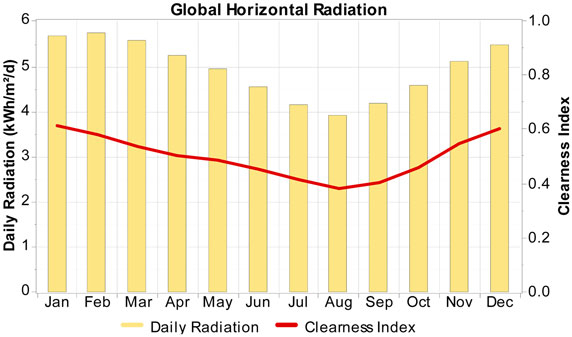
Figure 3. Nsukka monthly mean daily radiation.
Methodology
Mathematical Formulation of the Objective Function and Constraints
Hybrid optimization model for electric renewable (HOMER) software is a computer modeling tool that can evaluate different situations to determine the system configuration that will provide acceptable reliability at the lowest lifecycle cost, which is known as optimization. In the optimization procedure, the sizes of system components are decision variables, and their costs are the objective function. The objective function and constraints for the design model were defined and formulated below.
Objective Function
Objective function (costs objective function) to be minimized is the total net present cost (NPC) of the system, which includes the cost of the initial investment plus the discounted present values of all future costs throughout the total life of the installation; subjected to the Constraints which are the load to be met, maximum power wattage, and the state of charge (SOC) of battery. The life of the system is considered to be the life of the PV panels – which are the elements that have a longer lifespan. The costs taken into account are indicated as follows:
• Cost for purchasing the PV panels, the batteries, the inverter, and the charge regulator.
• Costs of replacing the components throughout the life of the system.
• Costs of operation and maintenance of components throughout the life of the system.
A more detailed description of its calculation can be found in Dufo-López and Bernal-Agustín (2005), Bernal-Agustín et al. (2006), Dufo-Lopez et al. (2007), Dufo-López (2007), and at http://www.homerenergy.com/.
Mathematical Formulation – Optimization
Mathematical calculations involve process of optimization; true meaning of optimization is to find the best answer for a particular problem. For example, problems dealing with the cost will require the best cost to be as less as possible. On the other hand, problems dealing with profit will see the maximum value as the best answer. So, “Optimum” is the word which is used to demonstrate the meaning of best, and the process of finding the best solution to a particular problem is known as the process of optimization (Antoniou and Lu, 2007; Waqas, 2011). To solve an optimization problem, an optimization algorithm is required. An optimization algorithm is the algorithm which is used to define an optimized solution for a particular function. Thus, for the stand-alone PV/battery system with constraints (load, maximum power wattage, and SOC of battery), the following optimization algorithm were derived.
Minimize
Subject to the constraints
where
= Cost of a PV module
= Cost of a battery
= Cost of a converter
= Number of PV modules
= Number of battery bank to be use
= Number of converters
= kilowatt⋅hour generated by PV module i
= Maximum output power of converter k
SOCmin = State of battery charge at minimum
SOCmax = State of battery charge at maximum
Optimal Design of PV/Battery System
Apart from correct costing and optimization, the quality and accuracy of the model and its implementation in the algorithm, greatly determines the usefulness of the simulation results.
Given that, the values of irradiation on tilted planes and the consumption patterns previously described, the system behavior can be simulated using an hourly time step. Based on a system energy balance and on the storage continuity equation, the simulation method used here is similar to that used by others (Sidrach de Cardona and Mora Lopez, 1992; Kaye, 1994). Considering the battery charger output power Pcharger(t), the PV output power Pp(t), and the load power Pl(t) on the simulation step Δt, the battery energy benefit during a charge time Δt1 is given by (Δt1 < Δt):
The battery energy loss during a discharge time Δt2 is given by (Δt2 < Δt):
The SOC of the battery is defined during the simulation time-step Δt by:
As an input of a simulation time-step Δt (taken as 1 h), several variables must be determined: PV output power, load power, and battery SOC. A battery energy balance indicates the operating strategy of the PV system: charge (energy balance positive) or discharge (energy balance negative).
Design of a Stand-Alone Photovoltaic Energy System for the Power Generation
As shown in Figure 4, a stand-alone solar PV system for a home lighting in rural Nigerian area is comprised of the following:
• Solar module(s);
• Charge controller;
• Storage system (batteries);
• Inverter; and
• AC load(s).
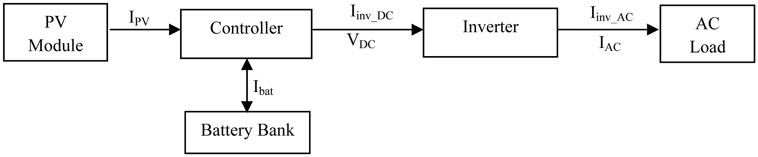
Figure 4. Model of the proposed PV-battery system (Ani and Ani, 2014).
The set-up works this way.
The PV and battery are connected to the DC bus (VDC), while the AC appliances are connected to the load bus (IAC) as shown in Figure 4. However, as the system has AC loads an inverter has to be included. An inverter (a DC-to-AC converter) is used to convert DC current (Iinv_DC) to AC current (Iinv_AC) to serve the AC load. The inverter needs to meet two needs: peak (or surge) power and continuous power. During day time (08:00–17:59 h), the PV charge the battery system, and as from 18:00 h the PV either serve the load alone and if there is extra power produced is stored in a battery system, or serve the load with the help of battery till 18:59 h when the battery will fully take over as in the case of judicious and normal power consumption, whereas in the case of energy waste and consumption with incandescent bulbs, during the day time (08:00–18:59 h), the PV serve the load as well as charge the battery system, and as from 19:00 h the battery will take over to supply to the load. Moreover, during night time, the battery is the only source of energy while the PV is off. The battery carries on all night till morning when the PV will start to charge the battery again.
Components System
Components of the Photovoltaic Energy System
Solar Module
Solar modules are made of several PV cells connected in series. Several PV cells make a module, and several modules make an array. The solar array is then a group of several modules as shown in Figure 5, connected in a series–parallel combination to generate the required current and voltage.
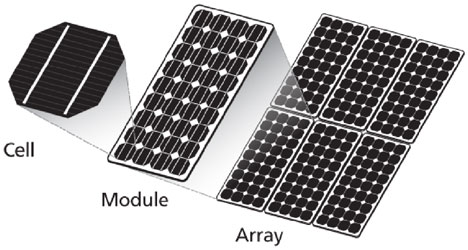
Figure 5. PV cell, module, and array (Samlex Solar, 2015).
The underlying operating principle of a PV module is the photoelectric effect, by which radiation of photons of greater energy than the bandgap of the semiconductor material excite free electrons. Higher irradiation means more photons, hence more free electrons and thus higher currents. Therefore, the current generated by a PV module is directly dependent on the number of incoming photons and thus, the solar irradiation. The components added to the module constitute the balance of system (BOS). BOS components are as follows.
Charge Controller
The success of a stand-alone solar PV system depends to a large extent on the long-term performance of the batteries. When batteries are mishandled (overcharged or over-discharged) their performance and life span reduces dramatically. Normally, a charge controller is included in a stand-alone solar PV system to serve for the following purposes:
• Battery overcharge and over-discharge protection;
• Overload protection;
• Battery SOC monitoring; and
• Maximum power point tracking (MPPT).
A charge controller regulates power from a PV module to prevent batteries from overcharging; it also functions as a low-battery voltage disconnect to prevent the batteries from over-discharging.
Storage System
A storage battery is an electrochemical device. It stores electrical energy in the form of chemical energy that can later be released as electrical energy when a load is connected. Various types of batteries can be used to store electrical energy, i.e., lead-acid batteries, lithium-ion batteries, and so on. Although most other types of batteries have advantages such as high storage density or lower self-discharge, lead-acid batteries are used mostly in PV stand-alone systems due to its lower price as batteries make up the largest component cost over the lifetime of a stand-alone solar PV system.
Battery has been one of the problems in the deployment of a stand-alone PV power system in Nigeria. Substandard batteries (batteries not meant for solar systems such as car batteries) are been used in stand-alone PV power system. A normal car battery (starter battery), for instance, is operated in buffer mode. For most of the time, it is fully charged but occasionally must deliver short-term high currents to start the engine. Things are different with a battery to be used in a stand-alone solar PV system, which is charged during sun hours, and has to withstand deep discharge during the no-sun hours; such batteries are called deep cycle batteries. A car battery is not suitable as storage in a stand-alone solar plant as it would become defective in a short period due to the cycle operation. These batteries (car) will not work well with the system because it does not have the properties of solar battery and within 2 years it starts to fail. A good solar battery will last for 8–20 years. Table S9A in Supplementary Material shows the properties of the batteries meant for backup power and off-grid home systems2. The description of the battery variables can also be found in the Tables S1A–S13A in Supplementary Material.
Types of Backup Batteries Used for the Simulation
Two types of batteries were used for the simulation. They are:
Surrette/Rolls and Hoppecke Batteries
Rolls Surrette Batteries are the top of the line choice for backup power and off-grid home. These batteries (Surrette 6CS25P) are 1,156 amp/h@100 h rate3, whereas Hoppecke Batteries are another choice for backup power and off-grid home. These batteries (Hoppecke 10 OpzS 1000) are 1,000 amp/h@100 h rate4. Their respective picture are shown below in Figures 6A,B.
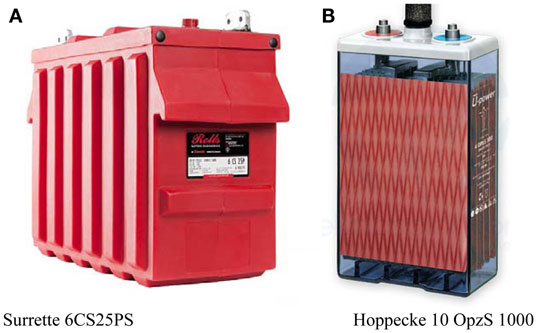
Figure 6. Picture of (A) Surrette 6CS25PS (http://www.dcbattery.com) and (B) Hoppecke 10 OpzS 1000 (http://www.biotechx.com/).
Inverter
An inverter is included in the stand-alone solar PV system to convert the DC into AC electricity.
System Economics and Constraints
The capital costs for the PV module, and the battery are based on quotes from PV system suppliers in Nigeria5. These costs are estimates based on a limited number of internet enquiries and prices conducted as at 10th of October, 2014. They are likely to vary for the actual system quotes due to many market factors. The figures used in the analysis are therefore only indicative. The replacement costs of equipment are estimated to be 20% lower than the initial costs, but because decommissioning and installation costs need to be added, it was assumed that they are the same as the initial costs. The PV array, inverter, and battery maintenance costs are estimates based on approximate time required and estimated wages for this sort of work in a remote area of Nigeria. Table 1 shows the capital cost of the energy system components used for the simulation. The project lifetime is estimated at 25 years, whereas the annual interest rate is fixed at 6%. There is no capacity shortage for the system and the operating reserve as a percentage of hourly load was 10%. Meanwhile, the operating reserve as a percentage of solar power output was 25%.
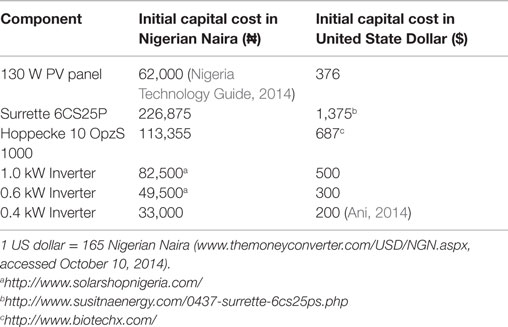
Table 1. Capital cost of the energy system components.
Configuration and Simulation of Stand-Alone Photovoltaic Energy System
The sizing of the components of energy system is done using HOMERs design software developed by the National Renewable Energy Laboratory, accurate enough to reliably predict system performance. HOMER is an optimization model, which performs many hundreds or thousands of approximate simulations in order to design the optimal system. Using HOMER in designing a PV system reduces costs, time, risks, and errors associated with preparing project prefeasibility studies; provide a low cost preliminary design method for project developers and industry, and thus increase the initiation of project studies that help to identify the best opportunities for successful PV project implementation. The system configuration is analyzed for various PV array sizes to operate in line with the storage (battery) system. The network architecture for the HOMER simulator of the completed stand-alone PV energy system for different pattern of load consumption can be seen in Figures 7A–D. The energy configuration of the household with different pattern of load consumption is shown in Tables 2 and 3.
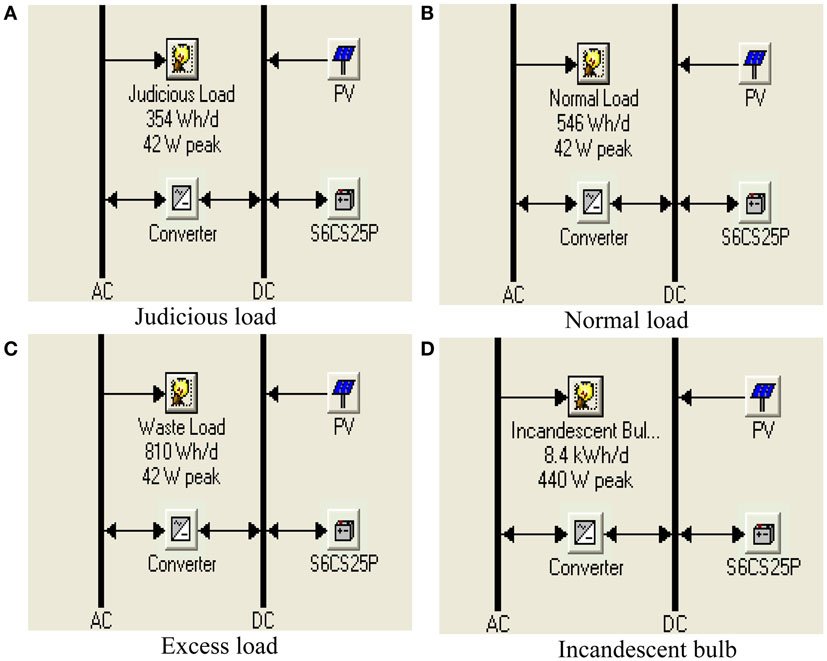
Figure 7. The network architecture for the HOMER simulator on (A) judicious load, (B) normal load, (C) excess load, and (D) incandescent bulb.
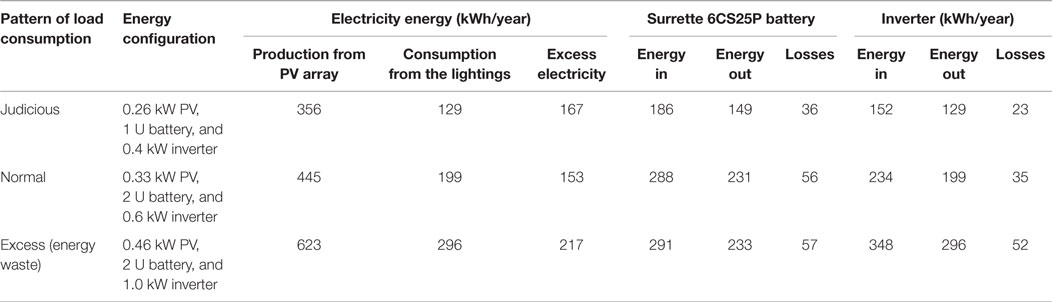
Table 2. Simulation results of electricity production, consumption, and losses (with Surrette battery).
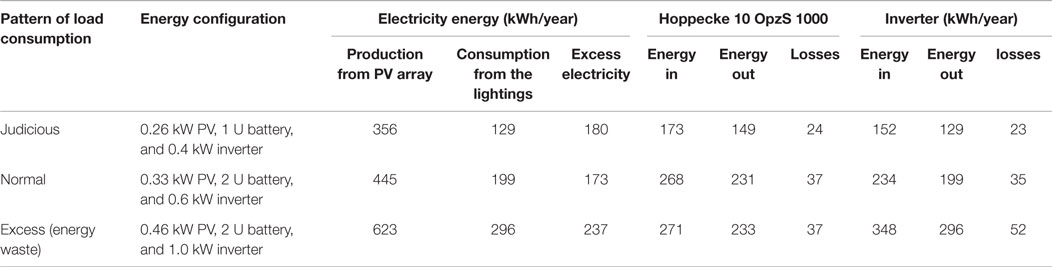
Table 3. Simulation results of electricity production, consumption, and losses (with Hoppecke battery).
Result Analyses and Discussion
An energy system is considered as an optimal solution for any pattern of electricity consumption for household lightings if it meets the required loads of the household at minimum total economic cost (NPC). Thus, the simulation results are collated and classified according to these two major factors.
1. Electric energy (kilowatt⋅hour) generated
2. Economic costs
Electric Energy Generated
Electricity Production
Energy from PV is greatly dependent on the availability of solar radiation and it differs from month to month with different pattern of load consumption as shown in Figures 8A–D. With these differences, excess electricity was observed in the months of January, February, March, November, and December. The PV array in this pattern of consumption (Judicious) generates 356 kWh of electricity per year which effectively powers the load demand of 129 kWh/year. The electrical production of PV energy system with different pattern of load consumption – with different type battery is shown in Tables 2 and 3.
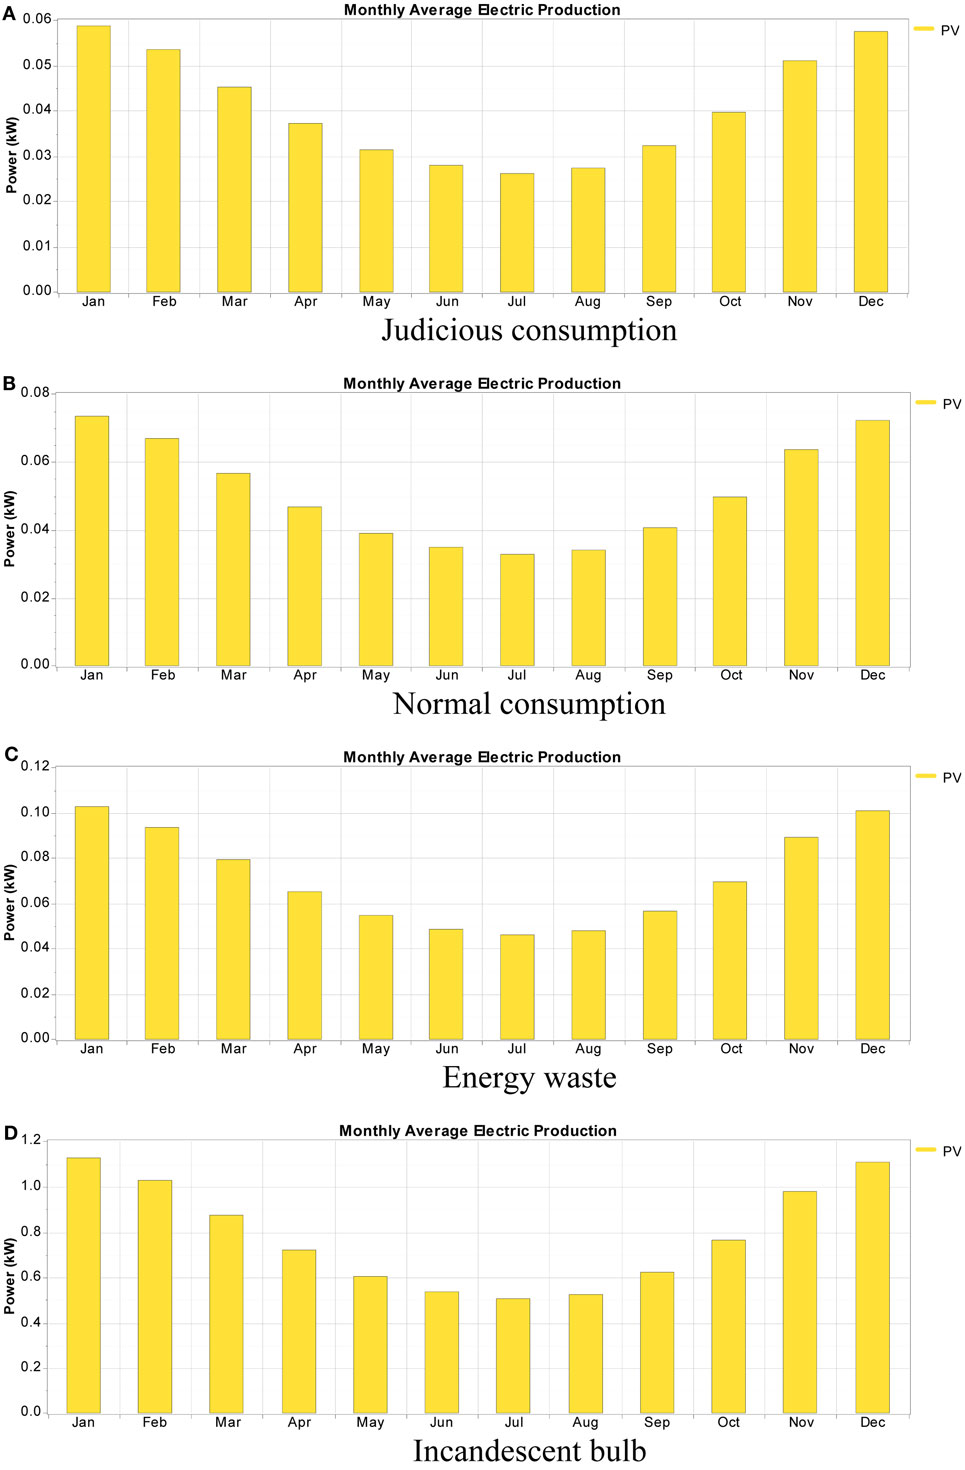
Figure 8. Electrical production of PV energy system for (A) judicious consumption, (B) normal consumption, (C) energy waste, and (D) incandescent bulb.
The patterns of load consumption studied [Judicious (J), Normal (N), and Waste (W)] has different energy configuration. These different configurations show difference in electricity production from PV array due to difference in number of modules.
Judicious Pattern
Uses two modules (2) of 130 W solar panel which produces 356 kWh of electricity per year. This PV array charges the battery effectively which powers the load (129 kWh/year). There is excess electricity of 167 kWh/year, which occurs in the day time when there is no load, and the PV only charges the battery for evening/night use. This is due to the fact that in judicious load pattern, lighting is only use in the evening/night time.
Normal Pattern
Uses two-and-halve modules (2.5) of 130 W solar panel which produces 445 kWh of electricity per year. This PV array also charges the battery effectively which powers the load (199 kWh/year) the same way as in judicious pattern. Normal and judicious appears to be somehow the same only that normal allows its interior lighting to occur in line with that of exterior lighting, whereas judicious switches off its interior lighting when they were not in use. There is excess electricity of 153 kWh/year which occurs in the day time when there is no load, and the PV only charges the battery for evening/night use.
Excess Pattern
Popularly known as “energy waste” uses three-and-halve modules (3.5) of 130 W solar panel, produces 623 kWh/year of electricity with 217 kWh/year of excess electricity. This pattern of load allows the interior lighting to be ON all day (24 h) and it is viewed as energy waste.
Energy Conservation
From the three load options studied, if one decides to go for the judicious pattern option, a conservation of 167 kWh/year will be earned when compared with the excess pattern option, while a 70-kWh/year can be conserved when compared the option (judicious pattern) with the normal pattern option. In the same comparison, if one choses to go for the normal pattern option, then a conservation of 97 kWh/year will be achieved when compared with the excess pattern option.
Battery Capacity
Battery contribute to the system design; different battery manufacturer, type, and properties (especially the battery capacity; see Table S9A in the Supplementary Material) contribute to the differences in battery charging and discharging which affects the electricity production (excess electricity) as were shown in Tables 2 and 3. Also, battery type changes (increases or decreases) the price of system configuration showing that battery makes the largest component cost in system sizing and design, and over the lifetime of a stand-alone solar PV system, as shown in Tables 4 and 5.
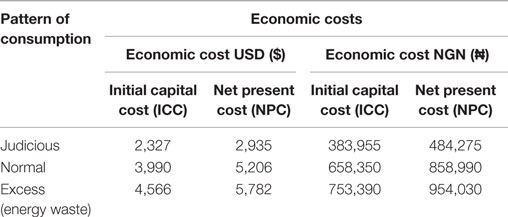
Table 4. Simulation results of economic costs (PV configuration with Surrette battery).
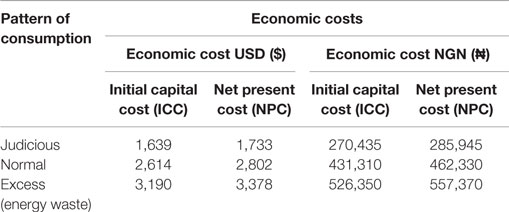
Table 5. Simulation results of economic costs (PV configuration with Hoppecke battery).
Economic Cost Analysis
One of the most important criteria for assessing an optimal solution for any particular household lightings is the economic cost of the system. The cost ratings here are discussed in terms of two major cost components: (1) the initial capital cost (ICC) and (2) the total NPC, the former being completely exclusive (i.e., ICC excludes other costs), while the latter is inclusive (i.e., includes the present value of all the costs that it incurs over its lifetime).
Initial Capital Cost
The ICC of a component is the total installed cost of that component at the beginning of the project; the initial cost results of PV configuration with Surrette battery and PV configuration with Hoppecke battery are illustrated in Tables 4 and 5, respectively. Results show that energy design cost depends mainly on the load demand and pattern of energy consumption, configuration, and the type of components chosen (such as battery) just as studied here. Unnecessary consumption of energy increases the load demand, thereby increase the energy design. The capital cost of judicious configuration is nearly two times lower than that of excess configuration, and almost less than one-half of the normal configuration. This is due to the pattern of energy consumption which increases the load demand, thereby affect the sizing and system configuration.
Total Net Present Cost
The total NPC of a system has been described as the present value of all the costs that it incurs over its lifetime, minus the present value of all the revenue that it earns over its lifetime. Costs include capital costs, replacement costs, operation and maintenance costs, and the costs of buying power from the grid. Revenues include salvage value and grid sales revenue. However, the analysis presented here considers neither the costs of buying power from the grid nor grid sales revenue, since the focus of this study is on lightings in rural areas without grid connections. Tables 4 and 5 show the NPC results for the configuration of PV system with Surrette, and Hoppecke, respectively, of different pattern of consumption. In this study, the NPC of excess option is nearly two times higher than that of judicious option as shown in Tables 4 and 5. Therefore, judicious option has the most cost-effective over time.
Quantification of Initial Capital Costs as Well as Annualized Costs Over 5, 10, 15, 20, and 25 Years
To appreciate the significance of the life cycle cost (NPC) of the energy system in the choice of energy components and pattern of energy consumption (as illustrated in Tables 4 and 5), further simulation runs were conducted at 5 years intervals (for a period of 25 years). The results of these simulations are illustrated in Figures 9A,B as well as in Tables S10A–S13A in Supplementary Material.

Figure 9. Economic cost difference in 5 years intervals for different pattern of load consumptions for energy efficient lightings with (A) PV/Surrette battery system configuration, and (B) PV/Hoppecke battery system configuration.
The simulation results for incandescent light bulbs with PV/Surrette battery system configuration is provided in Tables S1B–S4B in Supplementary Material.
Comparison of Energy Efficient Lightings with Incandescent Light Bulbs
The simulation results show that this house will conserve 2,753 W/year if EELs are used (excess option), and when configured with PV + Surrette 6CS25P battery + inverter will save $ 24 746 (₦ 4,083,090) of initial cost and $ 29 609 (₦ 4,885,485) for the NPCs, as shown in Table 6. These options [excess-energy waste (EEL) and incandescent light bulbs] were used for the comparison because they have the same energy consumption pattern; the same hour of actual utilization, but different rated power (wattage). Results also show that EEL reduces energy consumption due to lighting by as much as 90.3% (2,753 W). If judicious pattern option were used for the comparison, the conservation and the cost savings will be more.
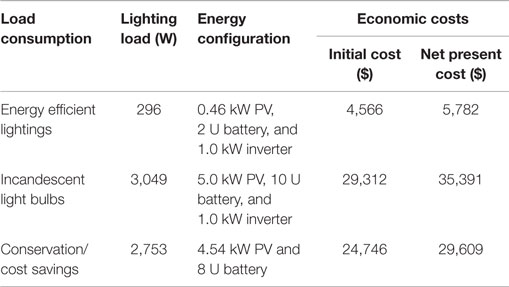
Table 6. Comparison of energy efficient lightings (excess option) with incandescent light bulbs for PV + Surrette 6CS25P battery + Inverter configuration.
Conclusion
The system configuration options were designed to run exclusively on solar power and require no diesel generator backup. It is also designed to be simple – all resulting in zero OPEX, dramatically lower CAPEX, and near zero maintenance. Results show that the patterns of load consumption studied [Judicious (J), Normal (N), and Waste (W)] has different energy configuration. From the three load options studied, results also show that a conservation of 167 kWh/year will be earned with the use of judicious pattern option when compared with the excess pattern option, while a 70-kWh/year can be conserved when compared the option (judicious pattern) with the normal pattern option. In the same comparison, a conservation of 97 kWh/year will be achieved with the use of normal pattern option when compared with the excess pattern option. Comparing the three energy efficient load options (judicious power consumption, normal power consumption, and excess power consumption) and the incandescent light bulb consumption, results show that the initial and NPC of the incandescent light bulb option (8,360 W/h) is extremely expensive ($ 29,312; $ 35,391), excess power consumption option (810 W/h) is moderately expensive ($ 4,566; $ 5,782), normal power consumption option (546 W/h) is less expensive ($ 3,990; $ 5,206) than excess power consumption option, and the judicious power consumption option (354 W/h) is the least expensive ($ 2,327; $ 2,935). In summary, the results show that energy design cost depends mainly on the load demand and pattern of energy consumption; and the best way to cut costs is through the use of energy efficient bulbs and by switching off lightings that were not in use at any given time (judicious power consumption option).
Conflict of Interest Statement
The author declares that the research was conducted in the absence of any commercial or financial relationships that could be construed as a potential conflict of interest.
Supplementary Material
The Supplementary Material for this article can be found online at https://www.frontiersin.org/article/10.3389/fenrg.2015.00054
Footnotes
- ^http://eosweb.larc.nasa.gov/ (accessed October 10, 2014).
- ^http://www.homerenergy.com/ (accessed April 23, 2014).
- ^http://www.dcbattery.com/rollssurrette_6cs25ps.html (accessed October 10, 2014).
- ^http://www.biotechx.com/
- ^http://www.solarshopnigeria.com/ (accessed October 10, 2014).
References
Ani, V. A. (2014). Feasibility and optimal design of a stand-alone photovoltaic (PV) energy system for the orphanage. J. Renew. Energy 2014, 8. doi: 10.1155/2014/379729
Ani, V. A., and Ani, E. O. (2014). Feasibility study and simulation of optimal power system for off-grid voter registration centres. Int. J. Renew. Energy Res. 4, 3. Available at: http://www.ijrer.org/ijrer/index.php/ijrer/article/view/1456
Ani, V. A., and Emetu, A. N. (2013). Simulation and optimization of photovoltaic diesel hybrid power generation systems for health service facilities in rural environments. Electron. J. Energy Environ 1, 57–70. doi:10.7770/ejee-V1N1-art521
Antoniou, A., and Lu, W. S. (2007). Practical Optimization: Algorithms and Engineering Applications. Berlin: Springer.
Asuquo, M. E., Ngim, O., and Agbor, C. (2008). A prospective study of burn trauma in adults at the University of Calabar Teaching Hospital, Calabar (South-Eastern Nigeria). Open Access J. Plastic Surg. 8, 370–376.
Bai, N., Khazaei, M., Eden, S., and Laher, I. (2007). The pharmacology of particulate matter air pollution-induced cardiovascular dysfunction. Pharmacol. Ther. 113, 16–29. doi:10.1016/j.pharmthera.2006.06.005
Behera, D., Dash, S., and Yadav, S. P. (1991). Carboxyhemoglobin in women exposed to different cooking fuels. Thorax 46, 344–346. doi:10.1136/thx.46.5.344
Bernal-Agustín, J. L., Dufo-López, R., and Rivas-Ascaso, D. M. (2006). Design of isolated hybrid systems minimizing costs and pollutant emissions. Renew. Energy 31, 2227–2244. doi:10.1016/j.renene.2005.11.002
Dominici, F., McDermott, A., Zeger, S., and Samet, J. (2003). Airborne particulate matter and mortality: timescale effects in four US cities. Am. J. Epidemiol. 157, 1055–1065. doi:10.1093/aje/kwg087
Dufo-López, R. (2007). Design and Control of Hybrid Systems Using Evolutionary Algorithms. PhD thesis, Universidad de Zaragoza, Zaragoza.
Dufo-López, R., and Bernal-Agustín, J. L. (2005). Design and control strategies of PV-diesel systems using genetic algorithms. Solar Energy 79, 33–46. doi:10.1016/j.solener.2004.10.004
Dufo-Lopez, R., Bernal-Agustín, J. L., and Contreras, J. (2007). Optimization of control strategies for stand-alone renewable energy systems with hydrogen storage. Renew. Energy 32, 1102–1126. doi:10.1016/j.renene.2006.04.013
Edenhofer, O., Pichs-Madruga, R., Sokona, Y., Seyboth, K., Matschoss, P., Kadner, S., (eds) (2011). Renewable Energy Sources and Climate Change Mitigation: Special Report of the Intergovernmental Panel on Climate Change (IPCC). Cambridge: Cambridge University Press.
Foster, R., Ghassemi, M., and Cota, A. (2010). Solar Energy: Renewable Energy and the Environment. Boca Raton, FL: CRC Press.
Gilmore, E. A., Adams, P. J., and Lave, L. B. (2010). Using backup generators for meeting peak electricity demand: a sensitivity analysis on emission controls, location, and health endpoints. J. Air Waste Manag. Assoc. 60, 523–531. doi:10.3155/1047-3289.60.5.523
Kaye, J. (1994). “Optimising the value of photovoltaic energy in electricity supply systems with storage,” in 12th EC Photovoltaic Solar Energy Conference: Proceedings of the International Conference (Amsterdam: H. S. Stephen & Associates), 431–434.
Lam, N. L., Smith, K. R., Gauthier, A., and Bates, M. N. (2012a). Kerosene: a review of household uses and their hazards in low- and middle income countries. J. Toxicol. Environ. Health Sci. 15, 396–432. doi:10.1080/10937404.2012.710134
Lam, N. L., Chen, Y., Weyant, C., Venkataraman, C., Sadavarte, P., Johnson, M. A., et al. (2012b). Household light makes global heat: high black carbon emissions from kerosene wick lamps. Environ. Sci. Technol. 46, 13531–13538. doi:10.1021/es302697h
Lighting Africa. (2010). “Solar lighting for the base of the pyramid – overview of an emerging market”, in 2nd International Business Conference & Trade Fair. (Nairobi: Lighting Africa).
Lighting Africa. (2013). Lighting Africa Market Trends Report 2012, 98. Available at: http://www.dalberg.com/documents/Lighting_Africa_Market_Trends_Report_2012.pdf (accessed September 6, 2015)
Longitude-Latitude-Maps. (2014). Longitude and Latitude in Nsukka, Enugu, Nigeria – GPS Coordinates. Available at: http://www.longitude-latitude-maps.com/city/156_701,Nsukka,Enugu,Nigeria (accessed October 10, 2014).
Mills, E. (2005). The specter of fuel-based lighting. Science 308, 1263–1264. doi:10.1126/science.1113090
Mills, E. (2012a). Health Impacts of Fuel-Based Lighting. California, CA: Lawrence Berkeley National Laboratory, University of California.
Mills, E. (2012b). Health impacts of fuel-based lighting. Working Paper Presented at the 3rd International Off-Grid Lighting Conference, 13-15 November, 2012, Dakar, Senegal.
Mills, E. (2014). Light for Life: Identifying and Reducing the Health and Safety Impacts of Fuel-Based Lighting. Nairobi: United Nations Environment Programme. Available at: http://www.enlighten-initiative.org/portals/0/documents/Resources/publications/Light%20for%20Life%20-%20Health%20and%20Safety%20Impacts%20of%20Fuel-Based%20Lighting.pdf
Natural Resources Canada. (2008). Emissions Factors for Diesel Generator Systems for Three Different Levels of Load Factor [Online]. Available at: http://www.retscreen.net/ang/emission_factors_for_diesel_generator_image.php (accessed September 6, 2015).
Nigeria Technology Guide. (2014). Solar Power Systems Components – Solar Panels Prices in Nigeria. Available at: http://www.naijatechguide.com/2008/11/solar-energy-system-components.html (accessed October 10, 2014).
Olaitan, P. B., Faidora, S. O., and Agodirin, O. S. (2007). Burn injuries in a young Nigerian teaching hospital. Ann. Burns Fire Disasters 20, 59–61.
Oludiran, O. O., and Umebese, P. F. A. (2009). Pattern and outcome of children admitted for burns in Benin City, mid-western Nigeria. Indian J. Plast. Surg. 42, 189–193. doi:10.4103/0970-0358.59279
Samlex Solar. (2015). Solar (PV) Cell Module, Array. Available at: www.samlexsolar.com/learning-center/solar-cell-module-array.aspx (accessed September 7, 2015).
Scientific Advisory Panel. (2013). Scientific Advisory Panel 2013 Annual Science Update. Paris: Climate and Clean Air Coalition to Reduce Short-Lived Climate Pollutants, United Nations Environment Programme.
Sharma, S., Sethi, G. R., Rohtagi, A., Chaudhary, A., Shankar, R., Bapna, J. S., et al. (1998). Indoor air quality and acute lower respiratory infection in Indian urban slums. Environ. Health Perspect. 106, 291–297. doi:10.1289/ehp.98106291
Sidrach de Cardona, M., and Mora Lopez, L. I. (1992). “Optimizing of hybrid photovoltaic generator systems for installations of rural electrification,” in 11th E C. Photovoltaic Solar Energy Conference: Proceedings of the International Conference (Montreux: Harwood Academic Publishers, Chur, Switzerland), 1287–1290.
The GPS Coordinates. (2014). GPS Coordinates of Nsukka, Nigeria – latitude and Longitude. Available at: www.thegpscoordinates.com/./nsukka/
UNEP/GEF en.lighten initiative. (2013). Country Lighting Assessments. Available at: http://luminanet.org/page/country-data-2# (accessed September 6, 2015).
Waqas, S. (2011). Development of an Optimisation Algorithm for Auto Sizing Capacity of Renewable and Low Carbon Energy Systems. Master of Science, Department of Mechanical Engineering, University of Strathclyde Engineering, Lanarkshire.
Keywords: energy cost, power consumption, electricity, kerosene lamps, fuel-powered generators
Citation: Ani VA (2016) Design of a Stand-Alone Photovoltaic Model for Home Lightings and Clean Environment. Front. Energy Res. 3:54. doi: 10.3389/fenrg.2015.00054
Received: 20 September 2015; Accepted: 08 December 2015;
Published: 11 January 2016
Edited by:
Joni Jupesta, Asean Centre For Energy, IndonesiaReviewed by:
Behnam Mohammadi-Ivatloo, University of Tabriz, IranPayman Dehghanian, Texas A&M University, USA
Copyright: © 2016 Ani. This is an open-access article distributed under the terms of the Creative Commons Attribution License (CC BY). The use, distribution or reproduction in other forums is permitted, provided the original author(s) or licensor are credited and that the original publication in this journal is cited, in accordance with accepted academic practice. No use, distribution or reproduction is permitted which does not comply with these terms.
*Correspondence: Vincent Anayochukwu Ani, vincent_ani@yahoo.com