Intermittent Contact Alternating Current Scanning Electrochemical Microscopy: A Method for Mapping Conductivities in Solid Li Ion Conducting Electrolyte Samples
 Samantha Raisa Catarelli
 Daniel Lonsdale
 Lei Cheng
 Jaroslaw Syzdek
 Marca Doeff
- 1Uniscan Instruments Ltd., Macclesfield, UK
- 2Energy Storage and Distribution Resources Division, Lawrence Berkeley National Laboratory, Berkeley, CA, USA
- 3Materials Sciences and Engineering Department, University of California Berkeley, Berkeley, CA, USA
- 4Bio-Logic USA LLC, Knoxville, TN, USA
Intermittent contact alternating current scanning electrochemical microscopy (ic-ac-SECM) has been used to determine the electrochemical response to an ac signal of several types of materials. A conductive gold foil and insulating Teflon sheet were first used to demonstrate that the intermittent contact function allows the topography and conductivity to be mapped simultaneously and independently in a single experiment. Then, a dense pellet of an electronically insulating but Li ion conducting garnet phase, Al-substituted Li7La3Zr2O12 (LLZO), was characterized using the same technique. The polycrystalline pellet was prepared by classical ceramic sintering techniques and was comprised of large (~150 μm) grains. Critical information regarding the contributions of grain and grain boundary resistances to the total conductivity of the garnet phase was lacking due to ambiguities in the impedance data. In contrast, the use of the ic-ac-SECM technique allowed spatially resolved information regarding local conductivities to be measured directly. Impedance mapping of the pellet showed that the grain boundary resistance, while generally higher than that of grains, varied considerably, revealing the complex nature of the LLZO sample.
Introduction
Solid electrolytes have been proposed for use in a number of battery configurations such as all solid-state lithium metal batteries (Jones and Akridge, 1993; Bates et al., 2000; Kamaya et al., 2011; Nagao et al., 2013), hybrid systems with aqueous electrolytes in which the metallic lithium electrode is protected by a solid electrolyte (Chu et al., 2002), and hybrid flow batteries with aqueous cathodes and metallic lithium anodes (Lu and Goodenough, 2011). The use of a solid electrolyte in optimized devices suppresses dendrite formation and allows reliable cycling of the lithium electrode, thereby potentially enabling higher energy densities than currently available with conventional lithium-ion battery designs.
Several classes of inorganic materials show high Li ion conductivities (Knauth, 2009) including glasses, composites, and crystalline oxides or sulfides. Some of the most promising of these, based both on good transport properties and apparent resistance to reduction by lithium metal, are garnet-structured phases related to the compound Li7La3Zr2O12 (LLZO) (Murugan et al., 2007; Cussen, 2010; Thangadurai et al., 2014; Rettenwander et al., 2015). To stabilize the cubic polymorph, which is several orders of magnitude more conductive than the tetragonal one, a small amount of Al is usually substituted for some of the lithium in LLZO compositions (Geiger et al., 2011).
To maximize ionic conductivity and ensure that shorting does not occur, very thin but dense layers of the solid electrolyte are required in electrochemical devices. The electrochemical characteristics of polycrystalline electrolytes are intimately related to details of their microstructures, including grain size, grain orientation, and the nature of the grain boundaries (Verkerk et al., 1982; Buechele et al., 1983; Ban and Choi, 2001) and profoundly affect how devices containing them function. For example, we have recently discovered that symmetrical Li/LLZO/Li cells containing small-grained samples (~20 μm) of LLZO failed later than those with larger-grained ones (~150 μm) and could sustain higher critical current densities during cycling (Cheng et al., 2015a). The effect was attributed to the presence of more low-resistance grain boundaries that could effectively dissipate currents in the small-grained samples. In contrast, current focusing at the grain boundaries in the large-grained samples resulted in rapid shorting of the symmetrical cells. While impedance measurements on the LLZO samples appeared to be consistent with this interpretation, quantitative values for grain boundary resistances could not be extracted from the data. Methods allowing direct measurements of local conductivities and correlations with topographical features would be extremely helpful in determining which microstructures exhibit the most robust behavior during electrochemical cycling in order to design more reliable high energy density batteries utilizing solid electrolytes.
Herein, we describe a technique, intermittent contact alternating current scanning electrochemical microscopy (ic-ac-SECM), which combines two previously developed methods [ic-SECM (McKelvey et al., 2010; Lazenby et al., 2013) and ac-SECM (Diakowski and Ding, 2007; Eckhard and Schuhmann, 2008; Gebala et al., 2011; Trinh et al., 2011)] that allows this correlation and demonstrate its effectiveness using several types of samples, including a large-grained LLZO pellet. This extends the growing trend of using SECM techniques to answer questions pertaining to battery materials and to energy applications at micron or greater length scales (Bertoncello, 2010; Lai et al., 2012; Bülter et al., 2014; Zampardi et al., 2015a,b). Furthermore, two recent papers describe the use of SECM to characterize solid electrolyte interfaces in batteries (Bülter et al., 2015; Ventosa et al., 2015).
Materials and Methods
Sample Preparation and Characterization
Li7La3Zr2O12 powders used for preparing dense pellets were synthesized from stoichiometric amounts of Li2CO3, La(OH)3, ZrO2, and Al2O3, as described in Cheng et al. (2014). Powders were attrition-milled to an average size of about 1 μm and then compacted into pellets. These were fired at 1100°C in a fresh LLZO powder bed for 12 h to densify them, and then dry-polished to remove a 50-μm thick layer from each side. The densified and polished pellets were approximately 1.5 mm thick and 8.0 mm in diameter.
The image of the pellet surface was obtained by SEM using a Hitachi TM-1000 tabletop microscope. Impedance measurements were obtained on dense LLZO pellets between blocking electrodes using a VMP3 multichannel potentiostat/galvanostat (Bio-Logic Science Instruments). For these experiments, a gold layer was sputtered on both sides of the pellet and Pt meshes and wires were attached and used as current collectors. Measurements were made at frequencies from 1 MHz to 0.1 Hz, and conductivities were determined from the intercepts of the arcs with the real axes in the Nyquist plots, using the equation , where Z is the impedance, L is the pellet thickness, and A is the pellet area.
Scanning Electrochemical Microscopy Experiments
A model ic-SECM470 scanning probe microscope [Bio-Logic Science Instruments (http://www.bio-logic.info/scanning-systems-scan-lab/instruments/)] was used to make measurements on LLZO samples immersed in 0.1M tetrabutylammonium perchlorate (TBA-ClO4) in propylene carbonate (PC) solutions. A 10-μm diameter Pt ultramicroelectrode (glass sheath, ratio of glass to Pt at the apex, R/G = 10) was used as the probe, with the gold layer on the back of the LLZO sample used as the counter-electrode, and a Pt sheet electrode as a pseudo-reference. For the control experiments using an insulating polytetrafluoroethylene (PTFE) blank, a Pt wire was used as the counter-electrode instead. For control experiments with the electronically conducting gold disk, which was embedded in an insulating plastic resin, experiments were performed in tap water using the Pt probe described above with a Pt counter-electrode and a standard calomel electrode (SCE) as reference, because PC dissolves the resin. These results are provided in Supplementary Material. All experiments were carried out at room temperature.
The concept of ic-SECM is similar to tapping-mode AFM. The probe vibration spectrum is recorded, a frequency slightly lower than the resonant frequency is selected, then the tip amplitude and set point are selected. The approach to the surface is executed until the tip oscillation amplitude reaches the predefined set point by probe interaction (damping of vibration) with the surface. Throughout the mapping, a constant tip amplitude is maintained, and the topography is determined through mechanical interaction, while the electrochemical measurement (dc or ac) is run independently.
Measurements on the gold disk were performed with a dc-bias of 0.0 V vs. OCP, ac-bias of 100 mV, and ac-frequency of 50 kHz. ac-SECM approach curves showed these settings allowed for noticeably different responses at the insulator and conductor. In most cases, an area scan of 150 μm by 150 μm was performed, with a step size of 10 μm and scan velocity of 20 μm/s. For the intermittent contact measurements, an oscillation frequency of 450 Hz (about 15 Hz below resonance) was applied, with an amplitude of 0.1 μm. The set point was 80% of the tip oscillation. For the height tracking experiments, the topography data from the ic-ac-SECM measurement were used to set the z-height throughout the ac-SECM experiment. As with the ic-ac-SECM measurement, the result is not convoluted by the sample topography. As the probe is not vibrating in the height tracking measurement, any possible effect of the probe vibration on the result is also ruled out.
A 250 μm × 250 μm area of the LLZO sample was mapped with a 2.5 μm step size while an ac-bias of 100 mV amplitude (sinusoidal wave) with a frequency of 100 kHz was applied to the probe. For mapping of larger areas, a 5 μm step size was used. Unlike more classical ac-SECM approaches where the impedance between the tip and a distant counter electrode is measured and the coupling between the two (or three electrodes, if a reference is used) is studied, here we are measuring the impedance through the sample (1500 μm) and a thin layer of electrolyte above it (<1 μm). The tip intermittent contact settings were: 440 Hz oscillation frequency (about 15 Hz below resonance), 100 nm of free oscillation amplitude, and 80% set point for contact amplitude. The last two parameters define the smallest time-averaged tip-sample distance of 40 nm, which is two orders of magnitude closer than a classical ac-SECM experiment would allow in a study like ours. Furthermore, given that the tip oscillation is almost three orders of magnitude slower than the ac wave applied to the tip (and sample), as well as about two orders of magnitude faster than the per-point data acquisition time, we observed no cross-talk between the topography and electrochemical measurement (each impedance measurement is semi-stationary, and they are averaged over multiple tip oscillation cycles); see Supplementary Material.
Data were processed using Gwyddion 2.40 SPM data analysis and visualization tool and presented in 3D using 3DIsoPlot® software package by Uniscan Instruments. No degradation of the garnet pellet was observed after the experiment, using a Bruker D2-Phaser diffractometer with Cu Kα radiation to determine the phase purity.
Results
Figure 1 shows scanning electron micrographs of large-grained LLZO samples made from powders having the nominal composition Li6.1Al0.3La3Zr2O12. Pellets made from attrition-milled powders, as described in Cheng et al. (2014) were 92% dense with a majority of grains about 150–200 μm across. The X-ray diffraction data, energy dispersive X-ray spectroscopy (EDS) mapping, inductively coupled plasma optical emission spectrometry (ICP-OES), and laser-induced breakdown spectroscopy (LIBS) results reported in that paper were consistent with the interpretation of a phase-pure, homogeneous garnet sample, once surface impurities were polished away. Total conductivity at room temperature of 2.3 × 10⁻⁴ S/cm was measured prior to polishing. A comparison of the ac and dc responses of cells containing LLZO with non-blocking electrodes (i.e., lithium) indicated that the conductivity is primarily ionic and is attributable to lithium transport (). Typical Nyquist plots for an Au/LLZO/Au cell at different temperatures are shown in Figure 2. In cases where the grain boundary resistance is much higher than that of the bulk, two semicircles in the Nyquist plot are frequently observed, with the lower frequency one usually assigned to the grain boundaries (Bauerle, 1969; Fleig, 2002). Their contributions to the total conductivity can then be determined based on geometric considerations [i.e., the bricklayer model (Verkerk et al., 1982)]. However, when grain boundaries are comparable to or more conductive than the bulk, the impedance spectra cannot be readily deconvoluted (Bouchet et al., 2003). At room temperature, the Nyquist plot of the LLZO cell consists of a partial semicircle at high frequency and a spike at low frequency. The diameter of the semi-circle was attributed to the total impedance of the LLZO pellet. At 48°C, as shown in Figure 2B, the semicircle diminishes, and it vanishes completely at 73°C (Figure 2C). While total conductivities of 5.4 × 10⁻⁴ and 1.4 × 10⁻³ S/cm were determined at 48 and 73°C, respectively, from this data, contributions from the grain and grain boundaries could not be separated.
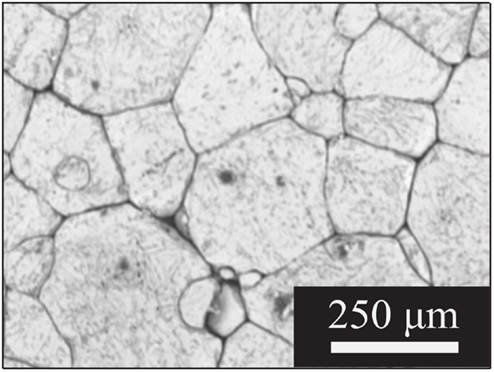
Figure 1. SEM image of the surface of a large-grained LLZO pellet used for this study.
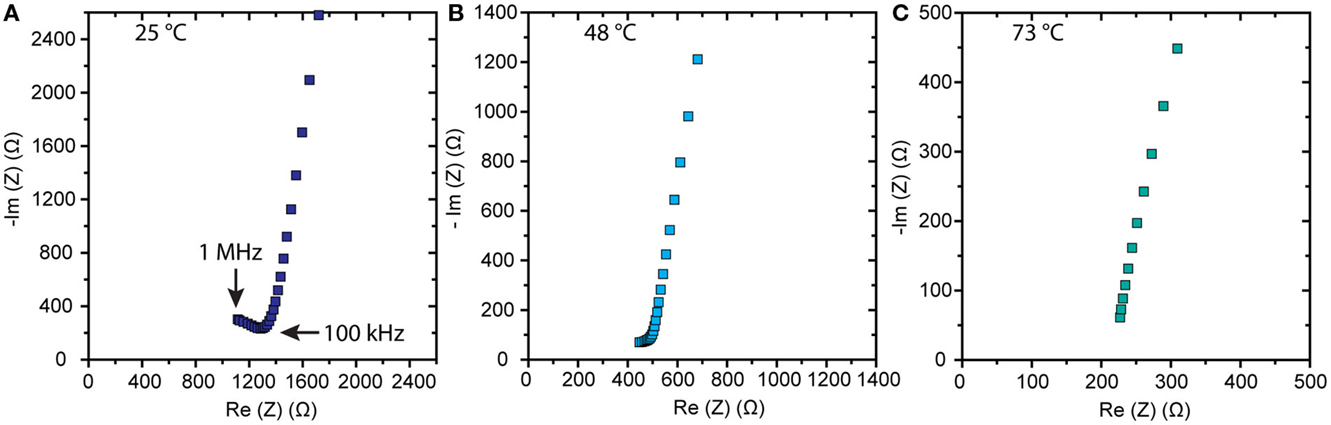
Figure 2. Nyquist plots of impedance data obtained on an Au/LLZO/Au cell at (A) 25, (B) 48, and (C) 73°C.
Several experiments were performed on control samples to verify the capability of the instrumentation to provide meaningful data for the intended characterization of the LLZO sample (e.g., to rule out the possibility of cross-talk between ac vibration and ac measurement channels or tip oscillation affecting the data). Experiments in several different modes were conducted to understand if ic-ac-SECM provided new and useful information. These include constant height ac-SECM, where the probe is scanned in x and y planes only, constant distance ic-ac-SECM, where the probe maintains partial contact with the surface by adjusting x, y, and z positions, and constant distance ac-SECM by height tracking, where the probe follows a prior recorded topography and again adjusts x, y, and z positions.
The above was first demonstrated on a conductive gold disk to demonstrate the viability of the ic-ac-SECM technique, the results of which are presented in Supplementary Material. These results confirmed that cross-talk between channels was not occurring and that tip oscillation did not influence the output. Additionally, ic-ac-SECM experiments were performed on an insulating PTFE blank in 0.1M TBA-ClO4 in PC to demonstrate the capability of the instrument to obtain topographic data separately from impedance. For this experiment, the sample was deliberately scratched. Figure 3 shows the ac current magnitude, the impedance magnitude, and the topography of the blank PTFE sample.
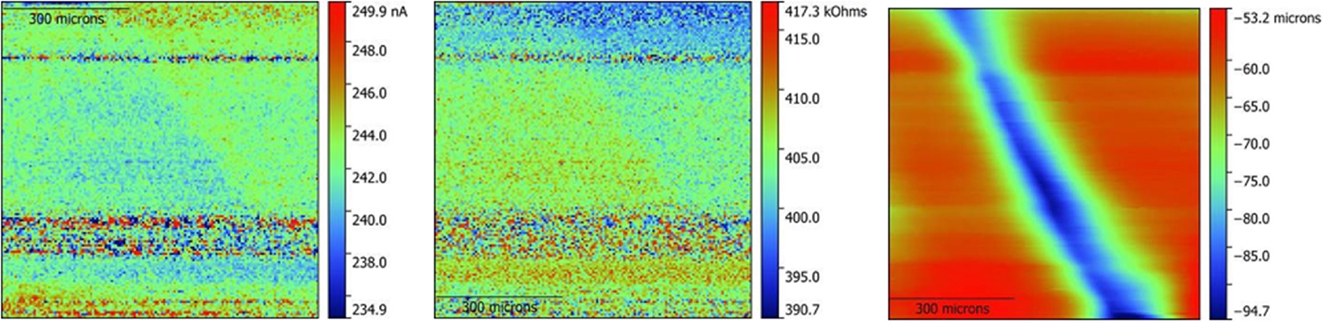
Figure 3. ic-ac-SECM results on a scratched PTFE blank in a 0.1M TBA-ClO4 PC solution. On the left, ac current magnitude, in the middle, impedance, and, on the right, topography. Note that the absolute scale of the impedance change is ~5% of the signal measured in Figure 4 (middle) and is dominated by noise in this test.
Results from ic-ac-SECM experiments over a wide area (650 μm × 650 μm) were obtained on the LLZO pellet and are shown in Figure S8 in Supplementary Material. Figure 4 shows results obtained on an unpolished pellet, which had been exposed to air for a prolonged period, over a smaller area (325 μm × 325 μm) in several different modes (ac-SECM, ic-ac-SECM, and ac-SECM mode with height tracking). In the impedance and topography maps using ic-ac-SECM mode, arrows or circles denote areas of interest, which will be discussed in the next section. Figure 5 shows the same set of experiments on a sample that was polished to remove Li2CO3 from the surface. Finally, Figure 6 shows a 250 μm × 250 μm area of the polished LLZO pellet, which shows a more detailed view.
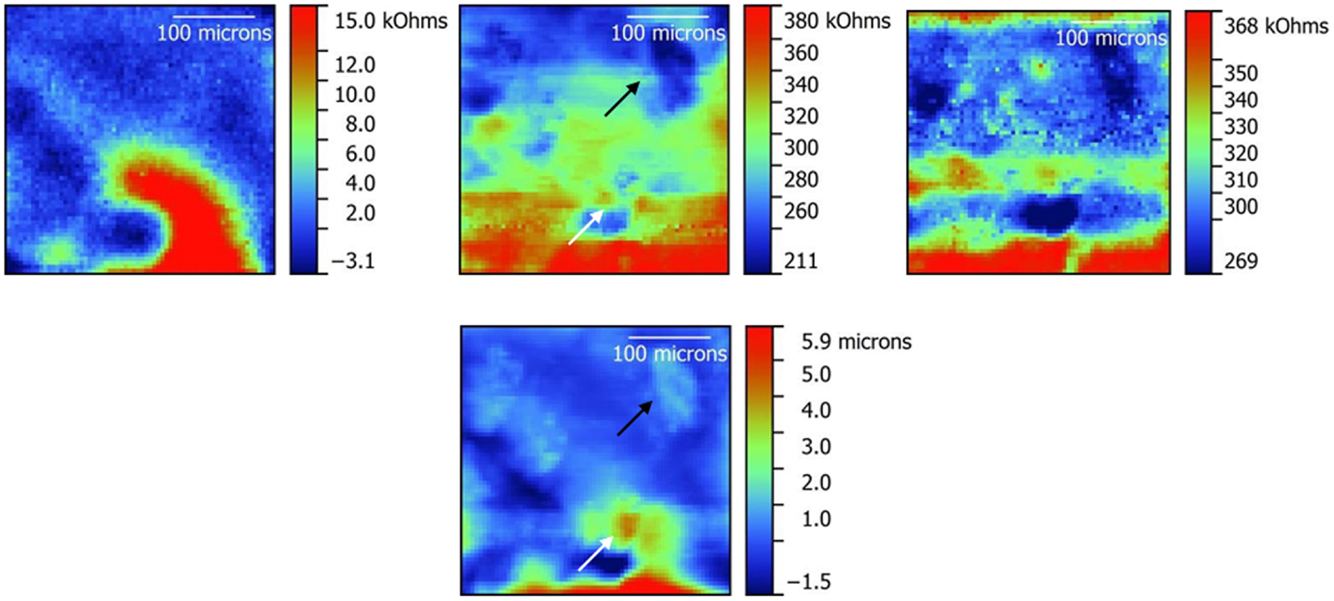
Figure 4. Impedance maps obtained on an unpolished LLZO pellet in ac-SECM mode (left), ic-ac-SECM mode (middle), and ac-SECM mode with height tracking (right). A topography map obtained from the ic-ac-SECM experiment is also shown below the ic-ac-SECM impedance map in the middle. A 325 μm × 325 μm area was studied. White and black arrows in the ic-ac-SECM impedance and topography maps point to areas of interest as explained in the text.
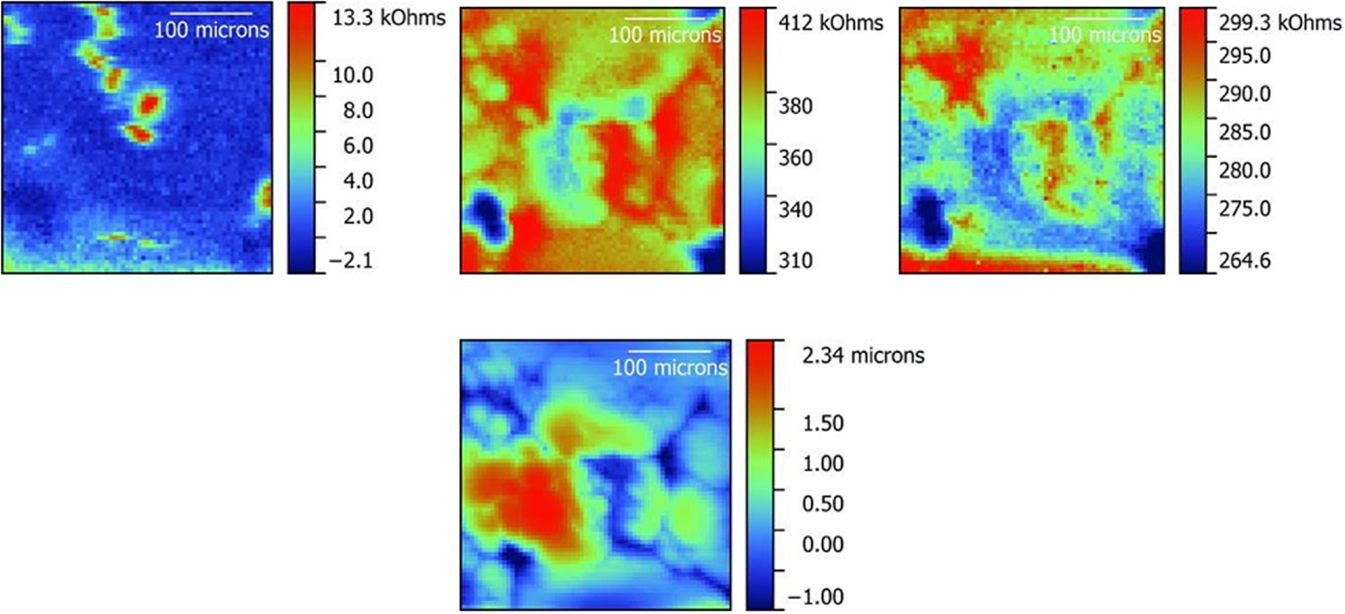
Figure 5. Impedance maps obtained on a polished LLZO pellet in ac-SECM mode (left), ic-ac-SECM mode (middle) and ac-SECM mode with height tracking (right). A topography map obtained from the ic-ac-SECM experiment is also shown below the ic-ac-SECM impedance map in the middle. A 325 μm × 325 μm area was studied.
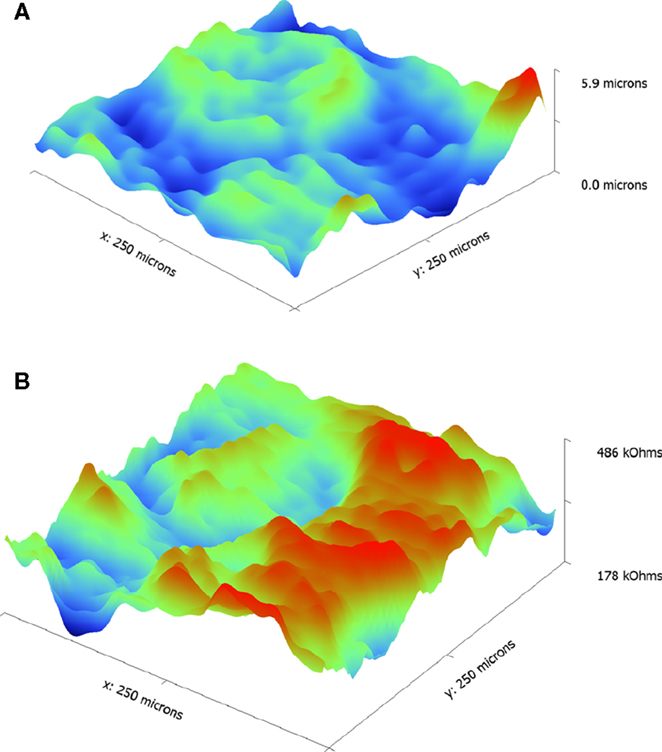
Figure 6. Topographic (A) and impedance (B) maps obtained on an LLZO pellet using ic-ac-SECM over a 250 μm × 250 μm area.
Discussion
The LLZO sample used in this study had a complex microstructure consisting primarily of large grains that varied considerably in shape and size, as shown in Figure 1. The complexity may explain why the impedance data obtained on the large-grained LLZO sample could not be readily deconvoluted into separate grain and grain boundary contributions at any of the temperatures studied, as seen in Figure 2. In fact, there have been conflicting reports as to the relative resistances of grains and grain boundaries in LLZO samples [see Tenhaeff et al. (2014) for a more complete discussion of this topic as well as the challenges of interpreting impedance data]. Variations in details of the processing and techniques used to produce dense samples may explain the seemingly contradictory evidence. For example, the properties of a large-grained LLZO sample similar to one used in this study were unlike those of one with smaller (~20 μm) grains, due to possible differences in grain boundary chemistry (Cheng et al., 2015b). This observation illustrates the importance of deeper understanding of the specific nature of the grain and grain boundaries, which may require the use of other techniques sensitive to local grain and grain boundaries besides conventional impedance analysis on the overall sample (Fleig and Maier, 1999; Fleig et al., 2000; He et al., 2011).
Direct observation of local variations in conductivity with simultaneously obtained spatial information can be carried out using SECM (Bard et al., 1989), making it ideal for the study of polycrystalline samples in which the bulk and grain boundary resistances differ. In SECM, the current response of an ultramicroelectrode tip (probe) as a function of its exact position over a substrate immersed in solution is recorded. This is a function of both the tip-sample distance and the conductivity of the sample. In ac mode, changing the conductivity of the solution or the frequency of the applied potential further alters the response. In intermittent contact (ic) mode, the probe is in intimate proximity to the sample, and that distance is kept uniform throughout the experiment removing or greatly diminishing the influence of sample topography, which is notorious for interfering with SECM measurements. Ideally, this allows information about the electrochemical response of the sample to be obtained independently of the topographical features. There are, however, many technical challenges associated with these experiments, such as the possibility that the vibration of the tip may affect the impedance, or that cross talk may occur between impedance and topography channels. To rule out such artifacts as an explanation for what was observed on the LLZO samples, several types of experiments were carried out on a gold disk and are presented in the Supplementary Material. Once these were completed, data were collected on an insulating PTFE sample, which had been deliberately scratched (Figure 3). The scratch is clearly visible in the topography image, but the ac current magnitude and impedance responses are not affected by the depth change. A noteworthy feature was the ability to clearly image topographical features only tens of microns deep and less than about 100-μm wide (see upper left of the topography image), in spite of the fact that the total size of the probe, including the encapsulating glass, is estimated to be about 100 μm across. This is possible because the intermittent-contact technique will typically use a part of the probe tip to contact the sample, depending on the exact orientation of the probe relative to the sample. The success of these control experiments lends credence to the results obtained on LLZO samples described below.
Scans in various modes were taken on unpolished (Figure 4) and polished (Figure 5) LLZO samples over 325 μm × 325 μm areas to show the different information that is obtained. Impedance maps taken in ac-SECM mode (leftmost images in the Figures) are a function of both the sample topography and local differences in impedance. Using height tracking in ac-SECM mode (rightmost images in the Figures) is more informative, but requires that the topography be obtained separately. For this type of experiment, the probe follows a prior-recorded topography, but may still suffer from effects such as sample movement and temperature drift. Finally, the data appear to be better resolved in ic-ac-SECM mode (middle images) as the images show both higher contrast and (subjectively) more detail. Maintaining intermittent contact with the sample helps to remove the interference of temperature drift or sample movement from the measurement as evidenced by the better clarity of the data in Figures 4 and 5. Additionally, ic-ac-SECM mode allows topographical information to be obtained simultaneously (bottom images in the middle). In the case of the unpolished sample (Figure 4), there is a roughly inverse correspondence between the height and the impedance of the sample at any given location; in other words, where there is a rise in the topography, the impedance appears to decrease and vice versa. For example, the light blue patch embedded in a dark blue area on the upper right side of the topography map, indicated by a black arrow, corresponds to a locally raised area with lower impedance than the surroundings. The correlation would normally raise suspicions about cross-talk, but for the fact that the match is not perfect. As one example, the raised spot indicated by the white arrow on the topography image has higher, not lower, impedance than the surroundings. In LLZO samples like this one, grains are raised compared to the grain boundaries; thus, the correlation of raised areas with lower impedance seems to suggest that the grains are more conductive than the grain boundaries, were it not for the anomalous feature pointed out by the white arrow. This feature is much smaller than the grains shown in Figure 1. However, large-grained samples of LLZO are somewhat air sensitive and react to form lithium carbonate (Li2CO3), particularly when moisture is present (Cheng et al., 2015b). It is likely that the raised spot corresponds to a particle of resistive lithium carbonate on the surface of the unpolished LLZO pellet.
When the LLZO sample was polished to remove lithium carbonate, a clearer picture emerges from the ic-ac-SECM experiment (middle images in Figure 5). The topography (bottom, middle in Figure 5) is reduced by around 65% compared to Figure 4, but still indicates that there are several large raised areas roughly the size of the grains in Figure 1, separated by lower narrow regions in dark blue, which could be grain boundaries. Again, there is a rough inverse correspondence between height and impedance despite the reduced topography, with the narrow low regions showing higher impedance compared to the larger higher regions. While the match is not perfect, this suggests that the grain boundaries are more resistive than the grains.
For a more detailed view, a smaller area (250 μm × 250 μm) of a polished sample was studied using a smaller step size. These results are presented in Figure 6. A large raised portion about 200 μm across is evident in the topographical map, which is most likely a large grain. This roughly corresponds to the region of lower impedance seen in Figure 6B. This grain is surrounded by boundaries of higher impedance. There is, however, significant variation in the impedance of these boundaries with some regions much higher than in others, where it is close in value to that of the grain itself. Several research groups have observed that there is Al enrichment at the grain boundaries of LLZO samples similar to the one in this study (Jin and McGinn, 2011; Li et al., 2012, 2014; Cheng et al., 2014; Ren et al., 2015). Grain boundary conductivities may also vary in polycrystalline samples due to a distribution of grain misorientation angles. Highly mismatched grain boundaries are energetically unstable and can lead to large structural and compositional deviations, as has been observed recently in samples of lithium lanthanum titanate (LLTO) and lithium aluminum titanium phosphate (LATP) (Gellert et al., 2012; Ma et al., 2014). In general, ion transport is more favorable when mismatches are less severe. Synchrotron microdiffraction experiments on the large-grained LLZO sample indicate that the grain boundary misorientation angles are distributed with a mean value of 39.4° ± 13.6° (Cheng et al., 2015a). Thus, it is not unreasonable to observe that the sample contains grain boundaries with different characteristics, a fact that is not revealed using macroscopic impedance analysis, which can only provide averaged information.
Conclusion
Deconvolution of impedance data to determine grain and grain boundary contributions to total conductivities of polycrystalline solid electrolytes is not always possible. Furthermore, it can only give averaged information on these samples, which may be very complex in nature (multiple conductive phases and orientation-dependence). In contrast, ic-ac-SECM allows direct observation of both topography and impedance, simultaneously. In this work, it was used to characterize a large-grained LLZO pellet, which showed significant variation not only between grain and grain boundary resistances, but also among the grain boundaries themselves. This is attributed to the distribution of grain misorientation angles in the sample, which lead to differences in the grain boundary structures and chemistries.
Author Contributions
LC made LLZO samples and characterized them by SEM and impedance analysis. SC carried out SECM experiments, DL interpreted results and suggested additional SECM experiments, and SC, JS, and DL carried out data analysis. MD supervised the portion of the work carried out at Lawrence Berkeley National Laboratory. All co-authors contributed to the writing of the paper.
Disclaimer
This document was prepared as an account of work sponsored by the United States Government. While this document is believed to contain correct information, the United States Government or any agency thereof, or the Regents of the University of California, or any of their employees, makes any warranty, express or implied, or assumes any legal responsibility for the accuracy, completeness, or usefulness of any information, apparatus, product, or process disclosed, or represents that its use would not infringe privately owned rights. Reference herein to any specific commercial product, process, or service by its trade name, trademark, manufacturer, or otherwise, does not necessarily constitute or imply its endorsement, recommendation, or favoring by the United States Government or any agency thereof, or the Regents of the University of California. The views and opinions of authors expressed herein do not necessarily state or reflect those of the United States Government or any agency thereof or the Regents of the University of Californi.
Conflict of Interest Statement
SC and DL work for Uniscan Instruments, Ltd., the company that makes the commercial ic-ac-SECM instrumentation described in this work. JS works for Bio-Logic USA, which markets this instrument. LC and MD declare no competing interests.
Acknowledgments
This work was supported by the Assistant Secretary for Energy Efficiency and Renewable Energy, Office of Vehicle Technologies of the U.S. Department of Energy under contract no. DE-AC02-05CH11231. SECM measurements were carried out by SC using Uniscan – Bio-Logic equipment at the Uniscan facility in the United Kingdom.
Supplementary Material
The Supplementary Material for this article can be found online at https://www.frontiersin.org/article/10.3389/fenrg.2016.00014
References
Ban, C. W., and Choi, G. M. (2001). The effect of sintering on the grain boundary conductivity of lithium lanthanum titanates. Solid State Ionics. 140, 285–292. doi: 10.1016/S0167-2738(01)00821-9
Bard, A. J., Fan, F.-R. F., Kwak, J., and Lev, O. (1989). Scanning electrochemical microscopy. Introduction and principles. Anal. Chem. 61, 132–138. doi:10.1021/ac00177a011
Bates, J. B., Dudney, N. J., Neudecker, B., Ueda, A., and Evans, C. D. (2000). Thin film lithium and lithum-ion batteries. Solid State Ionics. 135, 33–45. doi:10.1016/S0167-2738(00)00327-1
Bauerle, J. E. (1969). Study of solid electrolyte polarization by a complex admittance method. J. Phys. Chem. Solids 30, 2657–2670. doi:10.1016/0022-3697(69)90039-0
Bertoncello, P. (2010). Advances on scanning electrochemical microscopy (SECM) for energy. Energy Environ. Sci. 3, 1620–1630. doi:10.1039/c0ee00046a
Bouchet, R., Knauth, P., and Laugier, J.-M. (2003). Theoretical analysis of IS of polycrystalline materials with blocking or conducting grain boundaries: from microcrystals to nanocrystals. J. Electrochem. Soc. 150, E348–E354. doi:10.1149/1.1580151
Buechele, A. C., De Jonghe, L. C., and Hitchcock, D. (1983). Degradation of sodium β”-alumina: effect of microstructure. J. Electrochem. Soc. 130, 1042–1049. doi:10.1149/1.2119881
Bülter, H., Peters, F., Schwenzel, J., and Wittstock, G. (2014). Spatiotemporal changes of the solid electrolyte interphase in lithium-ion batteries detected by scanning electrochemical microscopy. Angew. Chem. 53, 10531–10535. doi:10.1002/anie.201403935
Bülter, H., Peters, F., Schwenzel, J., and Wittstock, G. (2015). Comparison of electron transfer properties of the SEI on graphite composite and metallic lithium electrodes by SECM at OCP. J. Electrochem. Soc. 162, A7024–A7036. doi:10.1149/2.0031513jes
Cheng, L., Chen, W., Kunz, M., Persson, K., Tamura, N., Chen, G., et al. (2015a). Effect of surface microstructure on electrochemical performance of garnet solid electrolytes. ACS Appl. Mater. Interfaces 7, 2073–2081. doi:10.1021/am508111r
Cheng, L., Wu, C. H., Jarry, A., Chen, W., Ye, Y., Zhu, J., et al. (2015b). Interrelationships among grain size, surface composition, air stability, and interfacial resistance of Al-substituted Li7La3Zr2O12 solid electrolytes. ACS Appl. Mater. Interfaces 7, 17649–17655. doi:10.1021/acsami.5b02528
Cheng, L., Park, J. S., Hou, H., Zorba, V., Chen, G., Richardson, T., et al. (2014). Effect of microstructure and surface impurity segregation on the electrical and electrochemical properties of dense Al-substituted Li7La3Zr2O12. J. Mater. Chem. A 2, 172–181. doi:10.1039/C3TA13999A
Chu, M. Y., Visco, S., and De Jonghe, L. C. (2002). Plating Metal Negative Electrodes under Protective Coatings. U.S. Patent No. 6402795, Washington, DC: U.S. Patent and Trademark Office.
Cussen, E. J. (2010). Structure and ionic conductivity in lithium garnets. J. Mater. Chem. 20, 5167–5173. doi:10.1039/b925553b
Diakowski, P. M., and Ding, Z. (2007). Novel strategy for constant-distance imaging using alternating current scanning electrochemical microscopy. Electrochem. commun. 9, 2617–2621. doi:10.1016/j.elecom.2007.08.010
Eckhard, K., and Schuhmann, W. (2008). Alternating current techniques in scanning electrochemical microscopy (ac-SECM). Analyst 133, 1486–1497. doi:10.1039/b806721j
Fleig, J. (2002). The grain boundary impedance of random microstructures: numerical simulations and implications for the analysis of experimental data. Solid State Ionics. 150, 181–193. doi:10.1016/S0167-2738(02)00274-6
Fleig, J., and Maier, J. (1999). Microcontact impedance measurements of individual highly conductive grain boundaries: general aspects and application to AgCl. Phys. Chem. Chem. Phys. 1, 3315–3320. doi:10.1039/a902839k
Fleig, J., Rodewald, S., and Maier, J. (2000). Spatially resolved measurements of highly conductive and highly resistive grain boundaries using microcontact impedance spectroscopy. Solid State Ionics. 13, 905–911. doi:10.1016/S0167-2738(00)00522-1
Gebala, M., Schuhmann, W., and La Mantia, F. (2011). A new ac-SECM mode: on the way to high-resolution local impedance measurements in SECM. Electrochem. commun. 13, 689–693. doi:10.1016/j.elecom.2011.04.010
Geiger, C. A., Alekseev, E., Lazic, B., Fisch, M., Armbruster, T., Langner, R., et al. (2011). Crystal chemistry and stability of “Li7La3Zr2O12” garnet: a fast lithium-ion conductor. Inorg. Chem. 50, 1089–1097. doi:10.1021/ic101914e
Gellert, M., Gries, K. I., Yada, C., Rosciano, F., Volz, K., and Roling, B. (2012). Grain boundaries in a lithium aluminum titanium phosphate-type fast lithium ion conducting glass ceramic: microstructure and nonlinear ion transport properties. J. Phys. Chem. C 116, 22675–22678. doi:10.1021/jp305309r
He, Q., Kusoglu, A., Lucas, I. T., Clark, K., Weber, A. Z., and Kostecki, R. (2011). Correlating humidity-dependent ionically conductive surface area with transport phenomena in proton-exchange membranes. J. Phys. Chem. B 115, 11650–11657. doi:10.1021/jp206154y
Jin, Y., and McGinn, P. J. (2011). Al-doped Li7La3Zr2O12 synthesized by a polymerized complex method. J. Power Sources 196, 8683–8687. doi:10.1016/j.jpowsour.2011.05.065
Jones, S. D., and Akridge, J. (1993). A thin-film solid-state microbattery. J. Power Sources 4, 505–513. doi:10.1016/0378-7753(93)80196-V
Kamaya, N., Homma, K., Yamakawa, Y., Hirayama, M., Kanno, R., Yonemura, M., et al. (2011). A lithium superionic conductor. Nat. Mater. 10, 682–686. doi:10.1038/nmat3066
Knauth, P. (2009). Inorganic solid Li ion conductors: an overview. Solid State Ionics. 180, 911–916. doi:10.1016/j.ssi.2009.03.022
Lai, S. C. S., Macpherson, J. V., and Unwin, P. R. (2012). In situ scanning electrochemical probe microscopy for energy applications. MRS Bull. 37, 668–674. doi:10.1557/mrs.2012.146
Lazenby, R. A., McKelvey, K., and Unwin, P. R. (2013). Hopping intermittent contact-scanning electrochemical microscopy (HIC-SECM): visualizing interfacial reactions and fluxes from surfaces to bulk solution. Anal. Chem. 85, 2937–2944. doi:10.1021/ac303642p
Li, Y., Han, J.-T., Wang, C.-A., Xie, H., and Goodenough, J. B. (2012). Optimizing Li+ conductivity in a garnet framework. J. Mater. Chem. 22, 15357–15361. doi:10.1039/c2jm31413d
Li, Y., Wang, Z., Li, C., Cao, Y., and Guo, X. (2014). Densification and ionic-conduction improvement of lithium garnet solid electrolytes by flowing oxygen sintering. J. Power Sources 248, 642–646. doi:10.1016/j.jpowsour.2013.09.140
Lu, Y., and Goodenough, J. B. (2011). Rechargeable alkali ion flow battery. J. Mater. Chem. 21, 10113–10117. doi:10.1039/c0jm04222f
Ma, C., Chen, K., Liang, C., Nan, C.-W., Ishikawa, R., More, K., et al. (2014). Atomic-scale origin of the large grain-boundary resistance in perovskite Li-ion-conducting solid electrolytes. Energy Environ. Sci. 7, 1638–1642. doi:10.1039/c4ee00382a
McKelvey, K., Edwards, M. A., and Unwin, P. R. (2010). Intermittent contact-scanning electrochemical microscopy (IC-SECM): a new approach for tip positioning and simultaneous imaging of interfacial topography and activity. Anal. Chem. 82, 6334–6337. doi:10.1021/ac101099e
Murugan, R., Thangadurai, V., and Weppner, W. (2007). Fast lithium ion conduction in garnet-type Li7La3Zr2O12. Angew. Chem. Int. Ed. 46, 7778–7781. doi:10.1002/anie.200701144
Nagao, M., Kitaura, H., Hayashi, A., and Tatsumisago, M. (2013). High rate performance, wide temperature operation and long cyclability of all-solid-state rechargeable lithium batteries using Mo-S chevrel-phase compound. J. Electrochem. Soc. 160, A819–A823. doi:10.1149/2.058306jes
Ren, Y., Deng, H., Chen, R., Shen, Y., Lin, Y., and Nan, C.-W. (2015). Effects of Li source on microstructure and ionic conductivity of Al-contained Li6.75La3Zr1.75Ta0.25O12 ceramics. J. Eur. Ceram. Soc. 35, 561–572. doi:10.1016/j.jeurceramsoc.2014.09.007
Rettenwander, D., Welzl, A., Cheng, L., Fleig, J., Musso, M., Suard, E., et al. (2015). Synthesis, crystal chemistry, and electrochemical properties of Li7-2xLa3Zr2-xMoxO12 (x=0.1-0.4): stabilization of the cubic garnet polymorph via substitution of Zr4+ by Mo6+. Inorg. Chem. 54, 10440–10449. doi:10.1021/acs.inorgchem.5b01895
Tenhaeff, W. E., Rangasamy, E., Wang, Y., Sokolov, A. P., Wolfenstine, J., Sakamoto, J., et al. (2014). Resolving the grain boundary and lattice impedance of hot-pressed Li7La3Zr2O12 garnet electrolytes. ChemElectroChem Commun. 1, 375–378. doi:10.1002/celc.201300022
Thangadurai, V., Narayanan, S., and Pinzaru, D. (2014). Garnet-type solid-state fast Li ion conductors for Li batteries: critical review. Chem. Soc. Rev. 43, 4714–4727. doi:10.1039/c4cs00020j
Trinh, D., Keddam, M., Novoa, X. R., and Vivier, V. (2011). Alternating-current measurements in scanning electrochemical microscopy, part 1: principle and theory. Chemphyschem 12, 2169–2176. doi:10.1002/cphc.201001084
Ventosa, E., Zampardi, G., Flox, C., La Mantia, F., Schuhmann, W., and Morante, J. R. (2015). Solid electrolyte interphase in semi-solid flow batteries: a wolf in sheep’s clothing. Chem. Commun. 51, 14973–14976. doi:10.1039/C5CC04767F
Verkerk, M. J., Middelhus, B. J., and Burggraaf, A. J. (1982). Effect of grain boundaries on the conductivity of high-purity ZrO2-Y2O3 ceramics. Solid State Ionics. 6, 159–170. doi:10.1016/0167-2738(82)90083-2
Zampardi, G., Ventosa, E., La Mantia, F., and Schuhmann, W. (2015a). Scanning electrochemical microscopy applied to the investigation of lithium (de-) insertion in TiO2. Electroanalysis 27, 1017–1025. doi:10.1002/elan.201400613
Keywords: intermittent contact alternating current scanning electrochemical microscopy, solid electrolyte, lithium lanthanum zirconium oxide, garnet, grain boundaries
Citation: Catarelli SR, Lonsdale D, Cheng L, Syzdek J and Doeff M (2016) Intermittent Contact Alternating Current Scanning Electrochemical Microscopy: A Method for Mapping Conductivities in Solid Li Ion Conducting Electrolyte Samples. Front. Energy Res. 4:14. doi: 10.3389/fenrg.2016.00014
Received: 09 January 2016; Accepted: 21 March 2016;
Published: 31 March 2016
Edited by:
Jeff Sakamoto, University of Michigan, USAReviewed by:
Venkataraman Thangadurai, University of Calgary, CanadaCharles A. Geiger, Salzburg University, Austria
Copyright: © 2016 Catarelli, Lonsdale, Cheng, Syzdek and Doeff. This is an open-access article distributed under the terms of the Creative Commons Attribution License (CC BY). The use, distribution or reproduction in other forums is permitted, provided the original author(s) or licensor are credited and that the original publication in this journal is cited, in accordance with accepted academic practice. No use, distribution or reproduction is permitted which does not comply with these terms.
*Correspondence: Marca Doeff, mmdoeff@lbl.gov