Structure and Ionic Conductivity of Li2S–P2S5 Glass Electrolytes Simulated with First-Principles Molecular Dynamics
 Takeshi Baba
 Yoshiumi Kawamura*
- Toyota Motor Corporation, Shizuoka, Japan
Lithium thiophosphate-based materials are attractive as solid electrolytes in all-solid-state lithium batteries because glass or glass-ceramic structures of these materials are associated with very high conductivity. In this work, we modeled lithium thiophosphates with amorphous structures and investigated Li+ mobilities by using molecular dynamics calculations based on density functional theory (DFT-MD). The structures of xLi2S–(100 − x)P2S5 (x = 67, 70, 75, and 80) were created by randomly identifying appropriate compositions of Li+, , and S2− and then annealing them with DFT-MD calculations. Calculated relative stabilities of the amorphous structures with x = 67, 70, and 75 to crystals with the same compositions were 0.04, 0.12, and 0.16 kJ/g, respectively. The implication is that these amorphous structures are metastable. There was good agreement between calculated and experimental structure factors determined from X-ray scattering. The differences between the structure factors of amorphous structures were small, except for the first sharp diffraction peak, which was affected by the environment between Li and S atoms. Li+ diffusion coefficients obtained from DFT-MD calculations at various temperatures for picosecond simulation times were on the order of 10−3–10−5 Å2/ps. Ionic conductivities evaluated by the Nernst–Einstein relationship at 298.15 K were on the order of 10−5 S/cm. The ionic conductivity of the amorphous structure with x = 75 was the highest among the amorphous structures because there was a balance between the number density and diffusibility of Li+. The simulations also suggested that isolated S atoms suppress Li+ migration.
Introduction
The possibility of producing all-solid-state lithium-ion batteries (LIBs) has attracted much attention because the replacement of an organic liquid electrolyte with an inorganic solid electrolyte (SE) would simplify battery design, increase energy density, and make batteries safer and more durable. Realization of such batteries is critical for practical applications such as electric vehicles and plug-in hybrid electric vehicles. A major obstacle to the development of all-solid-state LIBs is that the ionic conductivity of SEs at room temperature (RT) is too low to achieve high-rate charging and discharging. In recent years, inorganic ceramics with high ionic conductivity have been widely studied (Knauth, 2009; Fergus, 2010; Takada, 2013; Ren et al., 2015). Sulfide SEs with the same level of conductivity as conventional liquid electrolytes have been discovered. For example, crystalline thiophosphate with thio-LIthium Super Ionic CONductor (thio-LISICON) have high ionic conductivity. The ionic conductivity of a Li10GeP2S12 crystal, in particular, is 1.2 × 10⁻² S/cm (Kamaya et al., 2011). Argyrodite-type crystals with the stoichiometry Li6PS5X (X = Cl, Br, or I) also have high ionic conductivity (>10−3 S/cm) (Deiseroth et al., 2008; Rao and Adams, 2011; Boulineau et al., 2012). In addition, the conductivities of some glasses, including 30Li2S–26B2S3–44LiI (Wada et al., 1983), 50Li2S–17P2S5–33LiBH4 (Yamauchi et al., 2013), and 63Li2S–36SiS2–1Li3PO4 (Aotani et al., 1994), have been reported to be as high as 1.5–1.7 × 10⁻³ S/cm.
The focus of this study was on the binary Li2S–P2S5 system. An additional advantage of the Li2S–P2S5 system is that no metallic elements, such as Ge and Si, are needed. The electrochemical stability of an electrolyte with no metallic element might be relatively high because metals might easily be reduced or oxidized during electrochemical reactions. Sulfide SEs are classified into three categories based on their structural characteristics: crystalline, amorphous (glass), and partially crystalline (glass-ceramic), all of which are known to be fast ionic conductors. Among the crystalline SEs, metastable Li7P3S11 (Yamane et al., 2007; Minami et al., 2010) and nanoporous β-Li3PS4 (Liu et al., 2013) have high conductivities, 3 × 10⁻³ and 1.6 × 10⁻⁴ S/cm, respectively. Much research has been conducted since the first report that the glass and glass-ceramic phases are fast ionic conductors (Zhang and Kennedy, 1990). At present, the maximum conductivity occurs at 70–80 mol% Li2S (i.e., 30–20 mol% P2S5), depending on the conditions during preparation (Minami et al., 2006; Mizuno et al., 2006). In general, it is difficult to prepare sulfide glasses with higher Li concentrations because crystallization occurs easily during the cooling process. The glasses are therefore prepared by mechanical milling technique or by twin-roller rapid-quenching technique. Glass ceramics are prepared by heating mechanically milled glass to a moderately high temperature. Crystals are prepared using solid-state reactions or with the same approach used to prepare glass ceramics. Crystallization of glasses usually results in a lowering of conductivities because the conductivities of the crystals that precipitate out are low. However, the ionic conductivity of Li2S–P2S5 glass ceramics is enhanced by the precipitation of metastable phases with high conductivities. These metastable phases are analogous to crystalline Li7P3S11 and Li3PS4. However, the role of metastable crystalline phases in glass ceramics is still unclear. In order to understand the mechanism responsible for the high conductivities of the binary Li2S–P2S5 system experimentally, several groups have studied the Li+ diffusion profiles using 6/7Li solid-state nuclear magnetic resonance spectroscopy (NMR) measurements (Graf et al., 2013; Hayamizu and Aihara, 2013; Hayamizu et al., 2014; Murakami et al., 2015). NMR is a powerful tool and provides many findings such as the rate of ionic motion. However, because the obtained signals are limited to the space-averaged information, it is difficult to clarify the origin of the Li+ diffusion only by the NMR study.
Since computational studies facilitate analysis of the Li diffusion process at the atomic scale, several researches based on the density functional theory (DFT) calculation have recently been reported. Holzwarth and co-workers have performed the DFT calculations on several crystal structures of the Li2S–P2S5 system, including Li7P3S11 and γ- and β-Li3PS4. They used the nudged elastic band method to estimate the activation energy for Li+ migration in the crystal and obtained results in good agreement with experiments (Holzwarth et al., 2011; Lepley and Holzwarth, 2012; Lepley et al., 2013). Holzwarth and co-workers suggested that the process of vacancy-interstitial pair formation contributes to superionic conductivities. Yang and Tse (2015) used DFT-based molecular dynamics (DFT-MD) calculations to investigate the mechanisms of Li+ transport in both the nanoporous and the crystalline phases of β-Li3PS4. One of the advantages of DFT-MD studies is that Li+ diffusivity can be simulated directly without use of a parametric force field. Mori et al. (2013) used the reverse Monte Carlo method with X-ray and neutron diffraction data to model the structures of Li2S–P2S5 glasses as well as Li7P3S11 crystals. Mori et al. used bond valence sum (BVS) analysis (Adams and Swenson, 2004, 2005; Hall et al., 2004) to analyze Li+ migration pathways. Mori et al. classified the pathways to the Li+ stable and metastable regions and found that the size of latter region was an indicator of Li+ diffusivity. However, they also stated that the quantitative relationship between the BVS results and the activation energy of ion migration still remained to be ascertained. Because static analysis is limited in terms of quantification, dynamical considerations must be taken into account to understand the high conductivities of glass SEs.
In the present work, we used DFT-MD calculations to investigate both the structure and the ionic conductivity of the binary Li2S–P2S5 glass. The glass structures were modeled in an ab initio fashion, that is, without adjustments to take into account experimental information. To investigate ionic conductivity, we adopted an approach similar to that of the DFT-MD study of Yang and Tse (2015). Section “Computational Methods” briefly describes the simulation frameworks. Section “Results and Discussion” presents the simulated structures of the SEs and then compares the corresponding mass density and experimental diffraction data. The dynamical properties, such as the diffusion coefficients and ionic conductivities, are then presented. The relationship between the compositions of glasses and the dynamical properties are also discussed. Section “Conclusion” consists of a summary and some conclusions.
Computational Methods
In this work, the amorphous phases of lithium sulfide with compositions of xLi2S–(100 − x)P2S5, where x = 67, 70, 75, or 80, were studied. In order to obtain a realistic model of amorphous structures, we used a melt-and-quench MD method, which is the common computational method for disordered materials (Massobrio et al., 2015). In the melt-and-quench technique, the choice of an initial coordinate is categorized into two types: a structure of the known crystal and a fully random coordinate of component atoms. We could not use the former because crystal structures with the same composition of the amorphous structure with x = 67 and 80 are unknown. Whereas the latter is applicable to any compound, a major issue is that the generated structures are far from the reasonable structures. Specifically, covalent bonding between P and S are missing. Indeed, in our preliminary examination, the convergences of the wavefunction optimization, which is the first part of DFT-MD simulations, were slow and sometimes failed. To circumvent this issue, the ionic units, such as Li+, tetrahedral , di-tetrahedral , and S2−, are located randomly. In order to pack bulky units in a cell efficiently, we used the Amorphous Cell module in the BIOVIA Materials Studio program (by Dassault Systèmes, BIOVIA Corp.). During the model construction, close contacts between atoms were minimized while ensuring realistic distributions (Allen and Tildesley, 1989) using the COMPASS II force field (Sun, 1998). Stoichiometric compositions were maintained for x = 67, 70, and 75, i.e., 4 × Li+ and ; 7 × Li+, , and ; and 3 × Li+ and respectively. The amorphous structures with x = 80 were composed of eight Li+, two and one S2−. For each amorphous structure, ∼130 atoms were placed in a cubic box. The initial volume sizes were defined by setting the volumetric mass density to 2 g/cm3, which corresponds to the experimental density for Li3PS4 and Li7P3S11 crystals.
Starting from the initial coordinates, the amorphous structures were annealing by the melt-and-quench procedure in a framework of DFT-MD simulations. All the systems were heated to 1000 K and then cooled to 667, 500, 400, and 300 K in a stepwise manner. The structures were kept at each temperature for ca. 2.8 ps before going to the next temperature. The cooling rate was ca. 48 K/ps, which is a typical value of the DFT-MD study (Massobrio et al., 2015). In all case, variable-cell, Car–Parrinello dynamics (Car and Parrinello, 1985; Laasonen et al., 1993; Bernasconi et al., 1995) were performed by using the CP module in the Quantum ESPRESSO program package (Giannozzi et al., 2009). A fictitious electronic mass of 400 a.u. and a time step of 6 a.u. (ca. 0.14 fs) were applied. The electronic and ionic motions were propagated by a standard Verlet algorithm (Verlet, 1967). Cell dynamics were simulated by use of a damped Parrinello–Rahman method (Parrinello and Rahman, 1981). The ionic and cell temperatures were controlled by a Nosé thermostat (Nosé, 1984; Hoover, 1985; Martyna et al., 1992). Periodic boundary conditions were applied, and only the axis length was allowed to change (i.e., the angles were kept constant). DFT calculations were performed using the Perdew–Burke–Ernzerhof exchange-correlation functional for solids (PBEsol) (Perdew et al., 2008) with Vanderbilt-type ultrasoft pseudopotentials (Vanderbilt, 1990). The energy cutoff of the plane wave basis set was set to 30 Ry (408 eV). Only one k-point of 1 × 1 × 1 was sampled.
After equilibration, DFT-MD calculations at each temperature were accumulated for at least 10 ps for a so-called production step. The computational settings of the DFT and MD components were the same as those described in the previous paragraph. In order to reduce the statistical inaccuracy, at least three simulations of this sequence were performed independently for each amorphous structure. Averaged data were used for the analysis. Furthermore, to validate the duration of equilibration (ca. 2.8 ps) and production (ca. 10 ps) steps, additional 30–40 ps of DFT-MD calculations were performed for some amorphous structures at 500 and 300 K.
Results and Discussion
Amorphous Structures
Figure 1 shows geometrical snapshots of DFT-MD simulations in the final production steps at 300 K for xLi2S–(100 − x)P2S5 amorphous structures with x = 67, 70, 75, and 80. In almost all amorphous structures, unit structures, such as tetrahedral and di-tetrahedral , were maintained and were distributed randomly. It is noteworthy that no decomposition or segregation of the units was observed in almost all trajectories, whereas rearrangement of the units, such as 2P2S7 → PS4 + P3S10, occurred for only one amorphous structure model with x = 67.
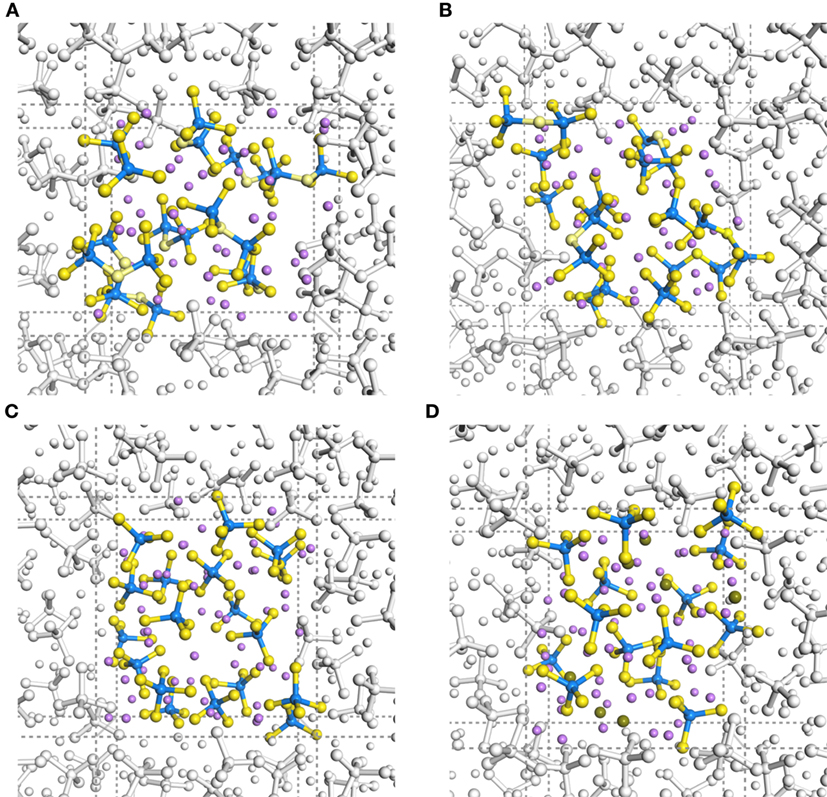
Figure 1. Trajectory snapshots in DFT-MD simulations at 300 K of (A) 67Li2S–33P2S5, (B) 70Li2S–30P2S5, (C) 75Li2S–25P2S5, and (D) 80Li2S–20P2S5 amorphous structures. Purple, blue, and yellow spheres indicate Li, P, and S atoms, respectively. Sticks with standard bond distances represent P–S bonds.
In order to examine the effect of the simulation duration, the energy, the cell volume, and the atomic orientation with respect to the time evolution were investigated. Figure 2A shows the time evolution of the relative stability and the volumetric mass density for amorphous structure with x = 75 at 300 K simulation. The relative stability was defined as the energy difference between the amorphous structure and the crystal with the same composition (γ-Li3PS4) and normalized by the molecular weight. The relative stabilities averaged over first 10 ps and total 40 ps were 0.159 and 0.144 kJ/g, respectively. The mass densities averaged over the first and total duration were 1.789 and 1.788 g/cm3, respectively. In both cases, the difference was relatively small. We investigated the pair correlation function (PCF) between Li and S and that between S and S belongs to the other units. To clarify the duration effect, the PCF averaged over each ca. 10 ps are shown in Figure 2B. There were no significant differences in the sampling period for both PCFs. Therefore, the procedure that consists of equilibration (ca. 2.8 ps) and production (10 ps) steps is enough to discuss the amorphous structures.
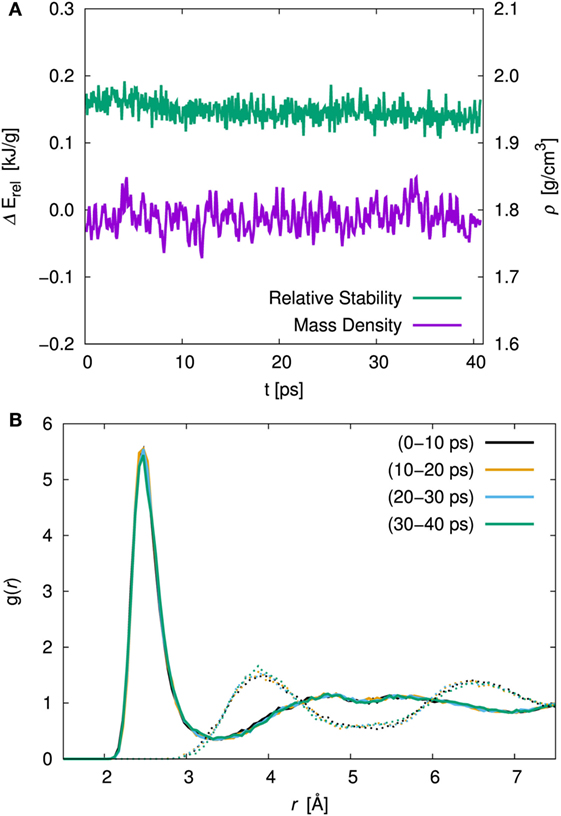
Figure 2. (A) Time evolution of the relative stability, ΔErel, and the volumetric mass density, ρ, and (B) pair correlation function (PCF), g(r) of Li–S (solid line) and inter-thiophosphate S–S (dotted line) for the 75Li2S–25P2S5 amorphous structure at 300 K simulation. The averaged PCF were sampled every 10 ps.
Figure 3A shows the volumetric mass densities simulated by the DFT-MD at each temperature. As temperature decreased, the densities increased monotonically. Regardless of composition, the difference of the density between high (1000 K) and low (300 K) temperatures was ca. 0.15 g/cm3, which corresponds to approximately a 1.5% variation of each lattice length. Thus, our calculation simulated a trend of lattice expansion with increasing temperature, which is considered to be an important factor for Li+ migration.
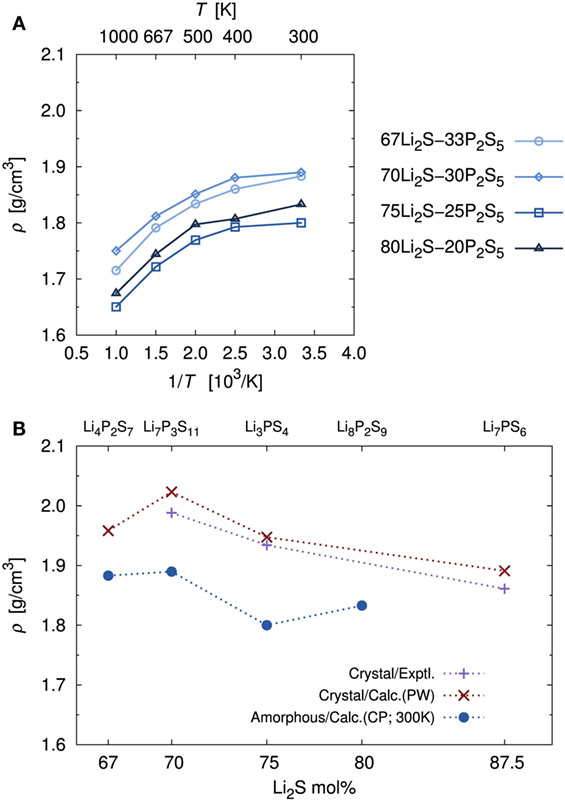
Figure 3. (A) Temperature dependence of mass densities, ρ, of amorphous structures determined by DFT-MD simulations and (B) comparisons with experimental and calculated crystal mass densities. Crystal calculations were performed with the PW module in the Quantum ESPRESSO package using the same functional and pseudopotential as the CP module. The major difference was the number of k-point meshes. Note that because the Li4P2S7 crystal structure is unknown, the known Li4P2O7 crystal structure (P) was used as an initial geometry. This approach is the same one used in a previous computational study (Holzwarth et al., 2011). The Li7PS6 (corresponding to 87.5Li2S–12.5P2S5) crystal structure, which has been reported, was added to address the accuracy of the calculation.
The calculated density of the amorphous structures decreased in the order x = 70, 67, 80, and 75, which is not the same as the order of the molecular ratios. Experimental densities for amorphous structures have not been measured, to the best of our knowledge. Thus, Figure 3B provides a comparison of the calculated densities of amorphous structures and the experimental densities of the crystals (Yamane et al., 2007; Onodera et al., 2010; Homma et al., 2011). In addition, Figure 3B shows comparisons with the density of crystal obtained by geometrical optimization of the usual DFT calculation. Crystals with x = 80, for which the stoichiometric composition is Li8P2S9, are also unknown, to our knowledge. To assess the accuracy of the calculation, we added the known Li7PS6 (corresponding to 87.5Li2S–12.5P2S5) crystal (Kong et al., 2010). For the crystals, the calculated densities were in good agreement with the experimental ones. In general, the densities of the amorphous structure were lower than those of the corresponding crystals. This pattern is common in silica and alumina glasses (Benoit et al., 2000). The pattern with respect to molecular ratios, as mentioned above, is also similar between amorphous and crystalline structures.
To investigate stability of the amorphous structure, we compared the relative stabilities as defined above. The stability for x = 80 was not examined because there is no reference crystal, as mentioned in the previous paragraph. The averaged relative stabilities of amorphous structures with x = 67, 70, and 75 were 0.035, 0.121, and 0.155 kJ/g, respectively. A positive value means that the amorphous structure is less stable than the corresponding crystal. Our analysis thus indicates that the amorphous structures were metastable.
The simulated amorphous structures can be compared directly to experimental results by calculating the static structure factor, S(Q), obtained from X-ray and neutron diffraction studies. Figure 4 shows the X-ray structure factor SX(Q) for each amorphous structure. The neutron diffraction results SN(Q) are shown in Supplementary Material. The calculated results were analyzed for trajectories by a DFT-MD simulation at 300 K using the ISAACS program (Le Roux and Petkov, 2010). We determined the experimental data based on the previous work of Ohara et al. (2016). Whereas the calculated results show the fluctuations due to our limited sampling, the agreement between our results and the experimental data is good for large values of Q, and the agreement is still good for small values of Q with respect to the positions of maxima and minima. In both the DFT-MD-simulated and experimental results, the first sharp diffraction peaks (FSDP) were observed at ca. 1.3 1/Å. The appearance of FSDP is a fundamental characteristic of amorphous structures. There was little difference between the structure factors of the amorphous structures, except for the FSDP. Although there was no sharp peak at 1.3 1/Å for the amorphous structure with x = 67, the peak heights of the FSDPs of the amorphous structures with x = 70 and 75 were in good agreement with the experimental ones. This peak is thought to mainly reflect the environment between Li and S, and it was enhanced as the Li concentration increased for x = 67, 70, and 75. However, the amorphous structure with x = 80 resulted in a smaller peak than the other amorphous structures. The implication is that the environment between Li and S is not uniform. The amplitudes of the second peaks (SSDPs) at ca. 2.1 1/Å were smaller than the experimental amplitudes. Further refinement of the spectrum will require a system at least 10 times as large as the system used in the previous study of Mori et al. (2013).
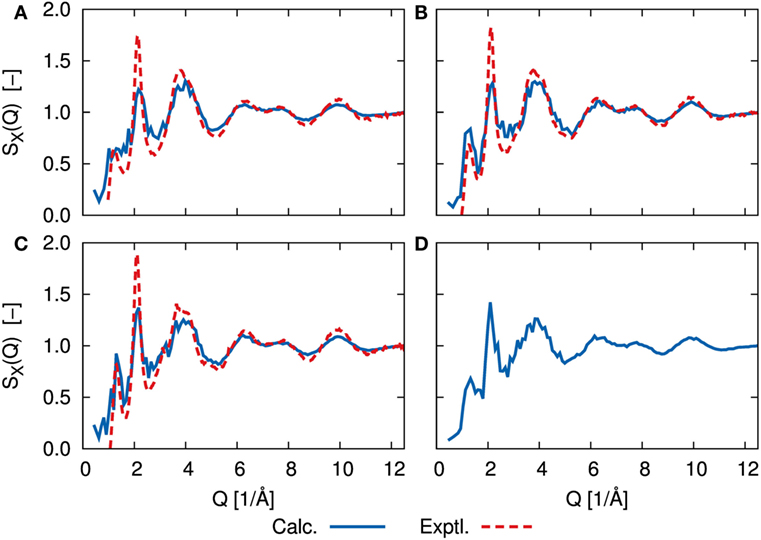
Figure 4. X-ray structure factor, SX(Q), determined by DFT-MD simulations (solid blue line) and scattering experiments (dashed red line) of (A) 67Li2S–33P2S5, (B) 70Li2S–30P2S5, (C) 75Li2S–25P2S5, and (D) 80Li2S–20P2S5 amorphous structure. Experimental measurements are lacking for 80Li2S–20P2S5. Neutron scattering results, SN(Q), are shown in Supplementary Material.
Diffusion Properties
As is usual in a MD study, we used the production steps of trajectories to investigate the diffusion profile. The diffusion coefficient was calculated from the slope of the average mean square displacement (MSD) of Li atoms over time. Before evaluating the diffusion coefficient, we examine the effect of the simulation duration as the previous section. Figure 5 shows the MSD as a function of lag-time among short (ca. 10 ps) and long (ca. 50 ps) duration for the amorphous structure with x = 75 and 80 at 500 K. The plots obtained from short duration coincide with those obtained from the long duration. To assess the individual Li mobilities, the root-MSD (RMSD) were evaluated. Figure 6 shows the relative frequency distributions of RMSD after 10 ps for amorphous structures with x = 75 at 1000, 667, 500, 400, and 300 K temperature, respectively. The time evolutions of RMSD for all Li in one model are shown in Supplemental Material. At 300 K, almost all (99.1%) of Li moved within 2.5 Å. It means most of Li were unable to reach the nearest neighbor Li sites in the amorphous structures. At 400 K, 11.9% of Li moved over 2.5 Å from the initial coordinate after 10 ps. A few (1.6%) Li also migrated over 4.5 Å, which corresponds to the distance to the second nearest neighbor site. More Li migrated at higher temperature (9.5, 36.5, and 85.2% of Li migrated over 4.5 Å at 500, 667, and 1000 K, respectively). Certainly our simulation time was much shorter than typical setting in the classical MD method, but the electronic environment around Li, which was obtained by the DFT method accurately, was important to define the flexibility of Li as discussed later. Thus, we used the sampling over 10-ps duration to analyze the diffusion property for each amorphous structure, although the results for 300 K were removed from the consideration. Figure 7 shows the Arrhenius plot of the calculated diffusion coefficients for the amorphous structures with temperatures from 400 to 1000 K. The relationship for each amorphous structure was linear in this region. Whereas the diffusion coefficients for amorphous structures with x = 67, 70, and 75 were similar, the diffusion coefficient for x = 80 was slightly lower than the others. The implication is that the diffusivity of only the amorphous structure with x = 80 was low. It would be confirmed by the comparison of the distribution of RMSD between amorphous structures with x = 75 and 80 (shown in the inset figure in Figure 6). This difference will be discussed later.
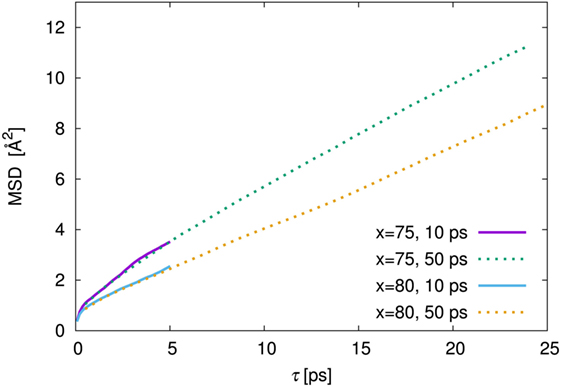
Figure 5. Mean square displacement (MSD) against lag time, τ, among 10 ps (solid line) and 50 ps (dotted line) of production steps for the amorphous structures with 75Li2S–25P2S5 (x = 75) and 80Li2S–20P2S5 (x = 80) amorphous structures at 500 K simulation. The MSD of 10 and 50 ps were derived from the independent trajectories.
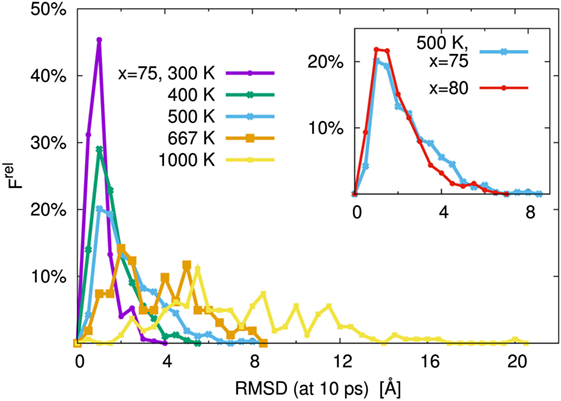
Figure 6. Relative frequency distribution, Frel, of root mean square displacement (RMSD) after 10 ps for Li. The main figure was the distributions for the 75Li2S–25P2S5 amorphous structure at T = 300, 400, 500, 667, and 1000 K, respectively. The inset figure was comparison of 75Li2S–25P2S5 (x = 75) and 80Li2S–20P2S5 (x = 80) amorphous structures at 500 K distribution. The bin width was 0.5 Å.
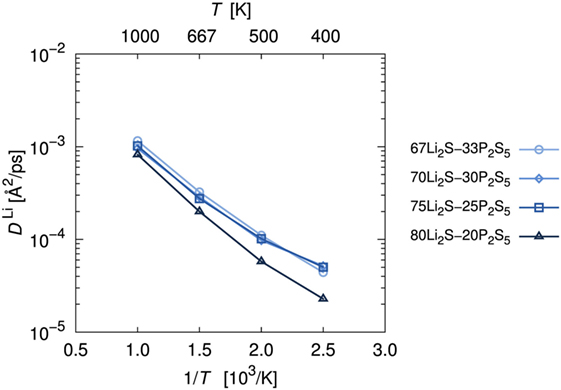
Figure 7. Arrhenius plot of lithium diffusion coefficients, DLi. Diffusion coefficients were estimated by averaging the mean square displacement of Li atoms at each trajectory.
To estimate the ionic conductivity, σ, we used the Nernst– Einstein relationship:
where N, Z, e, kB, T, and D are the number density of transported species, the charge of the transported species, the elementary charge, the Boltzmann constant, the target temperature, and the diffusion coefficient of the transported species, respectively. The target temperature is set to the RT (298.15 K) to compare the computational results with experimental ones. Because the transported species was the Li+ in this study, N is the concentration of Li atoms in each amorphous structure calculated by using the number of Li atoms in a unit cell and the average simulated volume at 300 K, which is close to the target temperature. For Li+, Z = 1. D is the diffusion coefficient of Li+ at the target temperature. Because the diffusion coefficients obtained from 300 K trajectories were less accurate for small movements in our simulations, we used values of D extrapolated from the diffusion coefficients between 1000 and 400 to 298.15 K.
Table 1 summarizes the estimated σ values as well as the N and D values. The calculated and experimental (Mizuno et al., 2005) σ versus the composition of the amorphous structures are shown in Figure 8. The fact that the highest calculated ionic conductivity of an amorphous structure corresponded to x = 75 is consistent with experimental results. Whereas the calculated diffusion coefficient of the amorphous structure was lower for x = 75 than for x = 70, the ionic conductivity of the amorphous structure was higher for x = 75 than for x = 70. These results explain why the percentage difference was larger for number densities than for diffusion coefficients. The ionic conductivity of the amorphous structure was lower for x = 67 than for x = 70 and 75 because both the number density and the diffusion coefficient were lower for x = 67. However, the number density of the amorphous structure with x = 80 was the highest, but the calculated ionic conductivity was the lowest. The explanation is that the diffusion coefficient was significantly lower for the x = 80 structure than for the other structures. These results suggest that a relatively high number density of conductive species enhances conductivity, but only up to a certain density. In other words, the balance between the number density and diffusion coefficient is important.
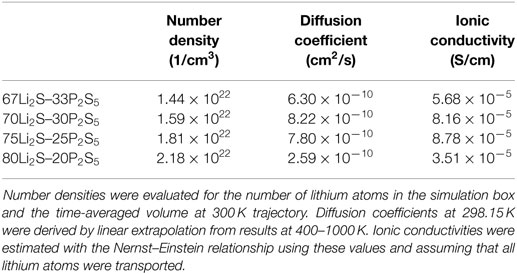
Table 1. Number densities, diffusion coefficients, and ionic conductivities of lithium at the RT for xLi2S–(100 − x)P2S5 amorphous structures.
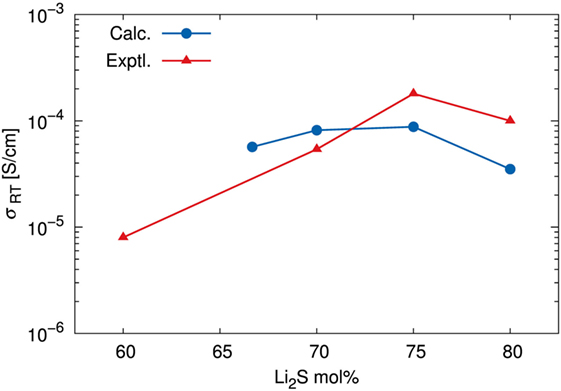
Figure 8. Ionic conductivity σ at room temperature (298.15 K). Calculated results were estimated by using the Nernst–Einstein relationship, an extrapolated diffusion coefficient, and the number density of Li determined by DFT-MD simulations. Experimental data are adapted from Mizuno et al. (2005).
It might seem that the agreement between the calculated and experimental conductivity was only semiquantitative. Indeed, we averaged sampling results among only a few independent models for each amorphous structure. We would have to increase the number of samples and/or cell size to achieve higher accuracy, as was apparent in the discussion of structure factors. It is noteworthy that Mo et al. (2012) argued for the limitation of the DFT-MD study due to the statistical uncertainty associated with fitting a curve to the MSD versus time data. Therefore, it seems reasonable to conclude that our simulations correctly determined the order of magnitude of the ionic conductivity and represented the diffusion properties of amorphous structures as a function of their composition.
Let us now turn to the argument that only the diffusivity of the amorphous structure with x = 80 was low. To reveal the environment around Li+, we examined the PCF of Li and S. Figure 9 shows the PCF for the amorphous structure with x = 80 over production steps at 300 K (the results for the other amorphous structures are shown in Supplementary Material). Note that we distinguished the bond type of S atoms, i.e., isolated S atoms for which the formal bond number is zero, and that of S atoms in a PS4 unit, for which the bond number is one. We denoted the latter as “non-bridged S.” The total PCFs were divided between PCFs involving Li and isolated S and the PCF of Li and non-bridged S. Interestingly, the position of the first peak was slightly different; the statistically stable distances between Li and S atoms of the former and latter were 2.36 and 2.45 Å, respectively. The results mean that isolated S attracts Li atoms more than non-bridged S does.
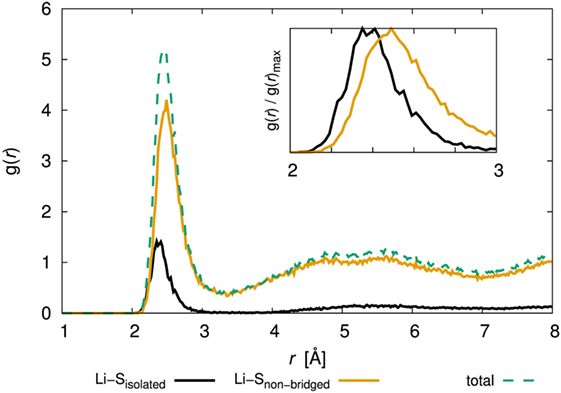
Figure 9. Pair correlation function, g(r), of Li–S for the 80Li2S–20P2S5 amorphous structure determined by DFT-MD simulation. The inset figure shows an enlarged view of 2–3 Å and normalized maximum values. The results for the other amorphous structures are shown in Supplementary Material.
Further evidence relevant to the Li–S attraction comes from the difference of atomic charges. Table 2 summarizes the average atomic populations based on a Bader charge analysis (Bader, 1990; Tang et al., 2009). Because bond numbers of S atom are distinguished in a way similar to the method discussed in the previous paragraph to characterize bond types, we have denoted the S atoms for which the bond number is two, namely, the S atoms in the P2S7 unit (i.e., S of –P–S–P–) in our models, as “bridged S.” The atomic charge distributions of Li, 0.88–0.89, were very similar among the amorphous structures (Table 2). The deviations were very small. The atomic charge distributions of P atom were also similar among the amorphous structures and fell within the range of 1.24–1.28, but the deviations were an order of magnitude larger for P than for Li atom. The atomic charge distribution of isolated S was −1.70, those of non-bridged S varied from −0.99 to −0.91, and those of bridged S ranged from −0.61 to −0.59. The deviations were relatively modest. It is clear that the bond type defines the charge distributions of S. In the case of the amorphous structure with x = 80, the isolated S had approximately twice the negative charge of the non-bridged S. In other words, an isolated S with a relatively large negative charge may more strongly attract positive Li+ electrostatically. This conclusion is consistent with the above discussion of PCF. The implication with respect to diffusibility is that the attraction of Li to isolated S suppresses the migration of Li+, and this suppression accounts for the fact that the amorphous structure with x = 80 has the lowest diffusion coefficient among the amorphous structures.
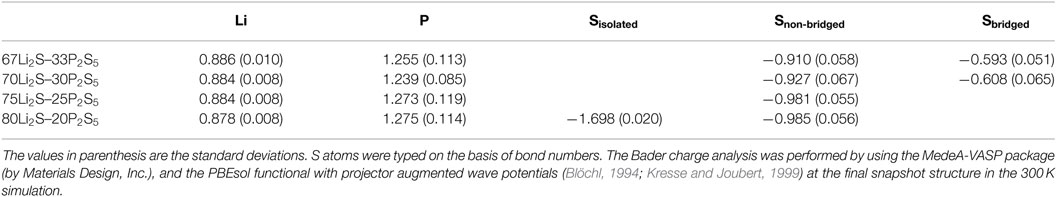
Table 2. Average atomic charge distributions for xLi2S–(100 − x)P2S5 amorphous structures determined by Bader analyses.
To briefly summarize these results, the ionic conductivities of amorphous structures based on lithium sulfide depend on both the number density and the diffusibility of Li+. A higher number density enhances conductivity. However, when the ratio of S to P atom is above the stoichiometric ratio (S/P > 4), the residual S atoms interfere with the migration of Li+. Because isolated S is derived from Li2S, the conditions under which the amorphous structure is synthesized are quite important. What is needed is an environment in which all the S atoms from Li2S react. Such an environment is characterized not only by the most appropriate relative amounts of Li2S and P2S5 but also by the process conditions, such as the mechanical milling techniques. Although our modeling involves several assumptions and limitations, including ideal compositions, a single phase of amorphous structures, model size, and sampling steps, the DFT-MD simulations provided important insights that were based on accurate descriptions of the electronic states and atomic interactions.
Conclusion
In this study, we used DFT-MD calculations to investigate the structural and dynamical properties of glass sulfide SEs. We initiated the study by modeling the glass structures in ab initio fashion. The structures of xLi2S–(100 − x)P2S5 (x = 67, 70, 75, and 80) were created by randomly identifying appropriate compositions of Li+, , and S2− and then annealing them with DFT-MD calculations. Because the calculated mass densities as a function of composition corresponded to the mass densities of crystals and because the calculated structure factors were also in good agreement with experimental structures, the model seemed appropriate for simulating the characteristics of sulfide glass.
Second, Li+ diffusion coefficients were obtained from the DFT-MD calculations at various temperatures for picosecond simulation times. Ionic conductivities evaluated by the Nernst–Einstein relationship at 298.15 K were in the order of 10−5 S/cm. The ionic conductivity of the amorphous structure with x = 75 was the highest because there was a balance between the number density and the diffusibility of Li+. The simulations also suggested that isolated sulfur suppresses Li+ migration.
Our computational methodology is clearly applicable to not only sulfide glasses but also to crystalline phases. In other words, although the size of the model was limited, the study established the efficacy of the method for evaluating the properties of various SEs. Further computational studies may lead to better understanding of the so-called lithium superionic conductors.
Author Contributions
All calculations were performed by TB. Analysis and discussion were performed by TB and YK. Manuscript was written by TB and revised by YK.
Conflict of Interest Statement
The authors declare that the research was conducted in the absence of any commercial or financial relationships that could be construed as a potential conflict of interest.
Acknowledgments
We thank Akio Mitsui for helpful discussions about structure factors.
Supplementary Material
The Supplementary Material for this article can be found online at https://www.frontiersin.org/article/10.3389/fenrg.2016.00022
References
Adams, S., and Swenson, J. (2004). Structure conductivity correlation in reverse Monte Carlo models of single and mixed alkali glasses. Solid State Ionics 175, 665–669. doi: 10.1016/j.ssi.2004.08.038
Adams, S., and Swenson, J. (2005). Bond valence analysis of reverse Monte Carlo produced structural models; a way to understand ion conduction in glasses. J. Phys. Condens. Matter 17, S87. doi:10.1088/0953-8984/17/5/010
Allen, M. P., and Tildesley, D. J. (1989). Computer Simulation of Liquids. New York: Oxford University Press.
Aotani, N., Iwamoto, K., Takada, K., and Kondo, S. (1994). Synthesis and electrochemical properties of lithium ion conductive glass, Li3PO4-Li2S-SiS2. Solid State Ionics 68, 35–39. doi:10.1016/0167-2738(94)90232-1
Benoit, M., Ispas, S., Jund, P., and Jullien, R. (2000). Model of silica glass from combined classical and ab initio molecular-dynamics simulations. Eur. Phys. J. B 13, 631–636. doi:10.1007/s100510050079
Bernasconi, M., Chiarotti, G., Focher, P., Scandolo, S., Tosatti, E., and Parrinello, M. (1995). First-principle-constant pressure molecular dynamics. J. Phys. Chem. Solids 56, 501–505. doi:10.1016/0022-3697(94)00228-2
Blöchl, P. E. (1994). Projector augmented-wave method. Phys. Rev. B 50, 17953–17979. doi:10.1103/PhysRevB.50.17953
Boulineau, S., Courty, M., Tarascon, J.-M., and Viallet, V. (2012). Mechanochemical synthesis of Li-argyrodite Li6PS5X (X = Cl, Br, I) as sulfur-based solid electrolytes for all solid state batteries application. Solid State Ionics 221, 1–5. doi:10.1016/j.ssi.2012.06.008
Car, R., and Parrinello, M. (1985). Unified approach for molecular dynamics and density-functional theory. Phys. Rev. Lett. 55, 2471–2474. doi:10.1103/PhysRevLett.55.2471
Deiseroth, H.-J., Kong, S.-T., Eckert, H., Vannahme, J., Reiner, C., Torsten, Z., et al. (2008). Li6PS5X: a class of crystalline Li-rich solids with an unusually high Li+ mobility. Angew. Chem. Int. Ed. 47, 755–758. doi:10.1002/anie.200703900
Fergus, J. (2010). Ceramic and polymeric solid electrolytes for lithium-ion batteries. J. Power Sources 195, 4554–4569. doi:10.1016/j.jpowsour.2010.01.076
Giannozzi, P., Baroni, S., Bonini, N., Calandra, M., Car, R., Cavazzoni, C., et al. (2009). QUANTUM ESPRESSO: a modular and open-source software project for quantum simulations of materials. J. Phys. Condens. Matter 21, 395502. doi:10.1088/0953-8984/21/39/395502
Graf, M., Kresse, B., Privalov, A. F., and Vogel, M. (2013). Combining 7Li field-cycling relaxometry and stimulated-echo experiments: a powerful approach to lithium ion dynamics in solid-state electrolytes. Solid State Nucl. Magn. Reson. 5, 25–30. doi:10.1016/j.ssnmr.2013.01.001
Hall, A., Adams, S., and Swenson, J. (2004). The nature of conduction pathways in mixed alkali phosphate glasses. Ionics 10, 396–404. doi:10.1007/BF02378000
Hayamizu, K., and Aihara, Y. (2013). Lithium ion diffusion in solid electrolyte (Li2S)7(P2S5)3 measured by pulsed-gradient spin-echo 7Li NMR spectroscopy. Solid State Ionics 238, 7–14. doi:10.1016/j.ssi.2013.02.014
Hayamizu, K., Aihara, Y., and Machida, N. (2014). Anomalous lithium ion migration in the solid electrolyte (Li2S)7(P2S5)3; fast ion transfer at short time intervals studied by PGSE NMR spectroscopy. Solid State Ionics 259, 59–64. doi:10.1016/j.ssi.2014.02.016
Holzwarth, N., Lepley, N., and Du, Y. A. (2011). Computer modeling of lithium phosphate and thiophosphate electrolyte materials. J. Power Sources 196, 6870–6876. doi:10.1016/j.jpowsour.2010.08.042
Homma, K., Yonemura, M., Kobayashi, T., Nagao, M., Hirayama, M., and Kanno, R. (2011). Crystal structure and phase transitions of the lithium ionic conductor Li3PS4. Solid State Ionics 182, 53–58. doi:10.1016/j.ssi.2010.10.001
Hoover, W. G. (1985). Canonical dynamics: equilibrium phase-space distributions. Phys. Rev. A 31, 1695–1697. doi:10.1103/PhysRevA.31.1695
Kamaya, N., Homma, K., Yamakawa, Y., Hirayama, M., Kanno, R., Yonemura, M., et al. (2011). A lithium superionic conductor. Nat. Mater. 10, 682–686. doi:10.1038/nmat3066
Knauth, P. (2009). Inorganic solid Li ion conductors: an overview. Solid State Ionics 180, 911–916. doi:10.1016/j.ssi.2009.03.022
Kong, S. T., Gun, O., Koch, B., Deiseroth, H. J., Eckert, H., and Reiner, C. (2010). Structural characterisation of the Li argyrodites Li7PS6 and Li7PSe6 and their solid solutions: quantification of site preferences by MAS-NMR spectroscopy. Chem. Eur. J. 16, 5138–5147. doi:10.1002/chem.200903023
Kresse, G., and Joubert, D. (1999). From ultrasoft pseudopotentials to the projector augmented-wave method. Phys. Rev. B 59, 1758–1775. doi:10.1103/PhysRevB.59.1758
Laasonen, K., Pasquarello, A., Car, R., Lee, C., and Vanderbilt, D. (1993). Car-Parrinello molecular dynamics with Vanderbilt ultrasoft pseudopotentials. Phys. Rev. B 47, 10142–10153. doi:10.1103/PhysRevB.47.10142
Le Roux, S. É., and Petkov, V. (2010). ISAACS – interactive structure analysis of amorphous and crystalline systems. J. Appl. Crystallogr. 43, 181–185. doi:10.1107/S0021889809051929
Lepley, N. D., and Holzwarth, N. A. W. (2012). Computer modeling of crystalline electrolytes: lithium thiophosphates and phosphates. J. Electrochem. Soc. 159, A538–A547. doi:10.1149/2.jes113225
Lepley, N. D., Holzwarth, N. A. W., and Du, Y. A. (2013). Structures, Li+ mobilities, and interfacial properties of solid electrolytes Li3PS4 and Li3PO4 from first principles. Phys. Rev. B 88, 104103. doi:10.1103/PhysRevB.88.104103
Liu, Z., Fu, W., Payzant, E. A., Yu, X., Wu, Z., Dudney, N. J., et al. (2013). Anomalous high ionic conductivity of nanoporous β-Li3PS4. J. Am. Chem. Soc. 135, 975–978. doi:10.1021/ja3110895
Martyna, G. J., Klein, M. L., and Tuckerman, M. (1992). Nose-Hoover chains: the canonical ensemble via continuous dynamics. J. Chem. Phys. 97, 2635–2643. doi:10.1063/1.463940
Massobrio, C., Du, J., Bernasconi, M., and Salmon, P. S. (2015). Molecular Dynamics Simulations of Disordered Materials. Switzerland: Springer International Publishing.
Minami, K., Hayashi, A., and Tatsumisago, M. (2010). Preparation and characterization of superionic conducting Li7P3S11 crystal from glassy liquids. J. Ceram. Soc. Jpn. 118, 305–308. doi:10.2109/jcersj2.118.305
Minami, T., Hayashi, A., and Tatsumisago, M. (2006). Recent progress of glass and glass-ceramics as solid electrolytes for lithium secondary batteries. Solid State Ionics 177, 2715–2720. doi:10.1016/j.ssi.2006.07.017
Mizuno, F., Hayashi, A., Tadanaga, K., and Tatsumisago, M. (2005). New, highly ion-conductive crystals precipitated from Li2S-P2S5 glasses. Adv. Mater. 17, 918–921. doi:10.1002/adma.200401286
Mizuno, F., Hayashi, A., Tadanaga, K., and Tatsumisago, M. (2006). High lithium ion conducting glass-ceramics in the system Li2S-P2S5. Solid State Ionics 177, 2721–2725. doi:10.1016/j.ssi.2006.04.017
Mo, Y., Ong, S. P., and Ceder, G. (2012). First principles study of the Li10GeP2S12 lithium super ionic conductor material. Chem. Mater. 24, 15–17. doi:10.1021/cm203303y
Mori, K., Ichida, T., Iwase, K., Otomo, T., Kohara, S., Arai, H., et al. (2013). Visualization of conduction pathways in lithium superionic conductors: Li2S-P2S5 glasses and Li7P3S11 glass-ceramic. Chem. Phys. Lett. 584, 113–118. doi:10.1016/j.cplett.2013.08.016
Murakami, M., Shimoda, K., Shiotani, S., Mitsui, A., Ohara, K., Onodera, Y., et al. (2015). Dynamical origin of ionic conductivity for Li7P3S11 metastable crystal as studied by 6/7Li and 31P solid-state NMR. J. Phys. Chem. C 119, 24248–24254. doi:10.1021/acs.jpcc.5b06308
Nosé, S. (1984). A unified formulation of the constant temperature molecular dynamics methods. J. Chem. Phys. 81, 511–519. doi:10.1063/1.447334
Ohara, K., Mitsui, A., Mori, M., Onodera, Y., Shiotani, S., Koyama, Y., et al. (2016). Strucutral and electronic features of binary Li2S-P2S5 glasses. Sci. Rep. 6, 21302. doi:10.1038/srep21302
Onodera, Y., Mori, K., Otomo, T., Hannon, A. C., Kohara, S., Itoh, K., et al. (2010). Crystal structure of Li7P3S11 studied by neutron and synchrotron X-ray powder diffraction. J. Phys. Soc. Jpn. 79SA, 87–89. doi:10.1143/JPSJS.79SA.87
Parrinello, M., and Rahman, A. (1981). Polymorphic transitions in single crystals: a new molecular dynamics method. J. Appl. Phys. 52, 7182–7190. doi:10.1063/1.328693
Perdew, J. P., Ruzsinszky, A., Csonka, G. I., Vydrov, O. A., Scuseria, G. E., Constantin, L. A., et al. (2008). Restoring the density-gradient expansion for exchange in solids and surfaces. Phys. Rev. Lett. 100, 136406. doi:10.1103/PhysRevLett.100.136406
Rao, R. P., and Adams, S. (2011). Studies of lithium argyrodite solid electrolytes for all-solid-state batteries. Phys. Status Solidi A 208, 1804–1807. doi:10.1002/pssa.201001117
Ren, Y., Chen, K., Chen, R., Liu, T., Zhang, Y., and Nan, C.-W. (2015). Oxide electrolytes for lithium batteries. J. Am. Ceram. Soc. 98, 3603–3623. doi:10.1111/jace.13844
Sun, H. (1998). COMPASS: an ab initio force-field optimized for condensed-phase applications – overview with details on alkane and benzene compounds. J. Phys. Chem. B 102, 7338–7364. doi:10.1021/jp980939v
Takada, K. (2013). Progress and prospective of solid-state lithium batteries. Acta Mater. 61, 759–770. doi:10.1016/j.actamat.2012.10.034
Tang, W., Sanville, E., and Henkelman, G. (2009). A grid-based Bader analysis algorithm without lattice bias. J. Phys. Condens. Matter 21, 084204. doi:10.1088/0953-8984/21/8/084204
Vanderbilt, D. (1990). Soft self-consistent pseudopotentials in a generalized eigenvalue formalism. Phys. Rev. B 41, 7892–7895. doi:10.1103/PhysRevB.41.7892
Verlet, L. (1967). Computer “Experiments” on classical fluids. I. Thermodynamical properties of Lennard-Jones molecules. Phys. Rev. 159, 98–103. doi:10.1103/PhysRev.159.98
Wada, H., Menetrier, M., Levasseur, A., and Hagenmuller, P. (1983). Preparation and ionic conductivity of new B2S3-Li2S-LiI glasses. Mater. Res. Bull. 18, 189–193. doi:10.1016/0025-5408(83)90080-6
Yamane, H., Shibata, M., Shimane, Y., Junke, T., Seino, Y., Adams, S., et al. (2007). Crystal structure of a superionic conductor, Li7P3S11. Solid State Ionics 178, 1163–1167. doi:10.1016/j.ssi.2007.05.020
Yamauchi, A., Sakuda, A., Hayashi, A., and Tatsumisago, M. (2013). Preparation and ionic conductivities of (100 – x)(0.75Li2S⋅0.25P2S5)⋅xLiBH4 glass electrolytes. J. Power Sources 244, 707–710. doi:10.1016/j.jpowsour.2012.12.001
Yang, J., and Tse, J. S. (2015). First-principles molecular simulations of Li diffusion in solid electrolytes Li3PS4. Comput. Mater. Sci. 107, 134–138. doi:10.1016/j.commatsci.2015.05.022
Keywords: lithium sulfide glass, solid electrolyte, first-principles molecular dynamics, structure factor, ionic conductivity
Citation: Baba T and Kawamura Y (2016) Structure and Ionic Conductivity of Li2S–P2S5 Glass Electrolytes Simulated with First-Principles Molecular Dynamics. Front. Energy Res. 4:22. doi: 10.3389/fenrg.2016.00022
Received: 01 February 2016; Accepted: 19 May 2016;
Published: 02 June 2016
Edited by:
Shyue Ping Ong, University of California San Diego, USACopyright: © 2016 Baba and Kawamura. This is an open-access article distributed under the terms of the Creative Commons Attribution License (CC BY). The use, distribution or reproduction in other forums is permitted, provided the original author(s) or licensor are credited and that the original publication in this journal is cited, in accordance with accepted academic practice. No use, distribution or reproduction is permitted which does not comply with these terms.
*Correspondence: Yoshiumi Kawamura, yoshiumi_kawamura@mail.toyota.co.jp