Record solar UV irradiance in the tropical Andes
 Nathalie A. Cabrol
 Uwe Feister
 Donat-Peter Häder
 Helmut Piazena
 Edmond A. Grin1
  Andreas Klein
- 1The SETI Institute Carl Sagan Center/NASA Ames Research Center, Moffett Field, CA, USA
- 2Meteorological Observatory Lindenberg - Richard-Aßmann-Observatory, German Meteorological Service, Lindenberg, Germany
- 3Department of Biology, Friedrich-Alexander-Universität Erlangen-Nürnberg, Erlangen, Germany
- 4Medical Photobiology Group, Charité – Universitätsmedizin Berlin, Berlin, Germany
- 5Research and Development, German Meteorological Service, Offenbach, Germany
High elevation, thin ozone layer, and clear sky produce intense ultraviolet (UV) radiation in the tropical Andes. Recent models suggest that tropical stratospheric ozone will slightly decrease in the coming decades, potentially resulting in more UV anomalies. Data collected between 4300 and 5916 m above sea level (asl) in Bolivia show how this trend could dramatically impact surface solar irradiance. During 61 days, two Eldonet dosimeters recorded extreme UV-B irradiance equivalent to a UV index (UVI) of 43.3, which is the highest ground value ever reported. If they become more common, events of this magnitude may have societal and ecological implications, which make understanding the process leading to their generation critical. Our data show that this event and other major UV spikes were consistent with rising UV-B/UV-A ratios in the days to hours preceding the spikes, trajectories of negative ozone anomalies (NOAs), and radiative transfer modeling.
Introduction
In the past decades, stratospheric ozone loss attributed to man-made chlorofluorocarbons has led to the penetration of increasing amounts of UV-B in the atmosphere, raising concern about the levels of biologically-damaging radiation reaching the ground. However, assessing the role of ozone fluctuations in UV trends is often challenged by limited conditions of atmospheric clarity (Herman and Keating, 2008; NOAA, 2008; Lee-Taylor et al., 2010; WMO, 2011).
Column ozone is naturally thinner over the tropics, and UV increases with elevation, clear skies, and low aerosols (Blumthaler et al., 1997). As a result, the tropical Andes represent a particularly valuable study area for quantifying the amount of biologically damaging radiation (UV-A, UV-B) reaching the ground (Piazena, 1996), and its wavelength dependence on ozone in a naturally occurring extreme environment.
The Andes form the highest mountain range outside Asia with over 100 peaks above 6000 m asl. They have an extreme aridity index between 18 and 28°S with no residual glaciers even above 6700 m (Bradley et al., 2006).
Between 2003 and 2004, two European Light Dosimeter Network (Eldonet) dosimeters (Häder and Lebert, 2006) were deployed in Bolivia near the Tropic of Capricorn at the summit of Licancabur (22.48°S/67.47°W, 5917 m asl) and at Laguna Blanca (22.50°S/67.53°W, 4340 m asl) (Figure 1) to monitor PAR (400–700 nm), UV-A (315–400 nm), and UV-B (280–315 nm) (Cabrol et al., 2009). The data collected during this survey revealed extreme UV-B irradiance. The following sections describe data results, modeling, and envision plausible causes for what are the highest UV-B irradiance values (and resulting UV Index) ever recorded on Earth to date.
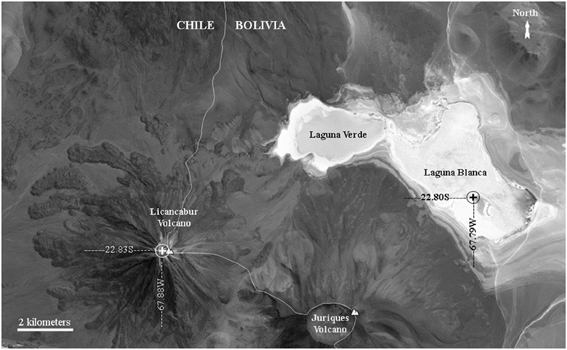
Figure 1. Localization map. The positions of the Eldonet UV dosimeters are indicated by the white cross on top of the Licancabur volcano and the black cross on the peninsula of Laguna Blanca. ASTER image—Terra Satellite.
Instruments and Data
Eldonets are proven dosimeters that have been functional since 1999 as part of an international network of UV and visible radiation monitoring in the three biologically-relevant wavelength bands used in this study. The network is based on more than 100 stations distributed over five continents, allowing measurement of the latitudinal and longitudinal light climate distribution. In addition to the European sites, several instruments are active in South America (including those of the present study), New Zealand, India, Africa, and China. The absolute calibration of the instruments was tested in an intercomparison of several radiometers in Garmisch-Partenkirchen (Southern Germany) (Häder et al., 1999). Another international intercomparison took place 2006 at the Physikalisch-Meterologisches Observatorium in Davos, Switzerland). The absolute spectral irradiance is traceable to the primary irradiance standard of the Physikalisch-Technische Bundesanstalt (PTB, Braunschweig, Germany, through the transfer standards F34, F324, F364, and F376. For the Eldonet instrument participating in the test a calibration coefficient C of 1.0044 has been calculated (certificate number 2006/BB14/1).
Challenging environmental conditions in the high Andes resulted in ~35% data loss, but recovered data were consistent between sites and over time. In average ozone conditions (250 Dobson Units, DU) UV-B maxima were 1.3 W/m2 in winter and 4.1 W/m2 in summer. The instruments also recorded significantly higher values between November 25, 2003 and January 25, 2004. Correlated values of UVI reached 20–29 in eight instances, consistent with observations recently published for Mediterranean sites. Jacovides et al. (2009) UVI peaked at 43.3 on December 29, 2003, and reached 31.7, 29.8, and 32.6 on January 10, 15, and 17, respectively. These are the highest values ever recorded anywhere on Earth. Each major event was preceded by several days of rising UV-B/UV-A ratio, with the highest value (0.129) recorded on December 29, 2003 (Figure 2A). While all UVI events >29 were observed at Licancabur, similar UV patterns with somewhat lower UVI were observed at Laguna Blanca 10 km away.
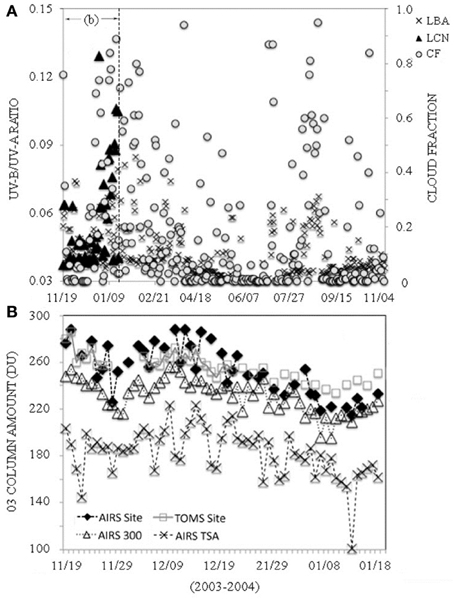
Figure 2. UV-B/UV-A ratio daily maxima. (A) The highest values were consistently associated with increased cloud fraction; (B) ozone depletion, and NOAs. Ozone data are from the Aqua Atmospheric Infrared Sounder (AIRS), and the Earth Probe—Total Ozone Mapping Spectrometer (TOMS) instruments. The cloud fraction (CF) is from AIRS. AIRS (Site) gives the daily O3 average over Licancabur (LCN) and Laguna Blanca (LBA) during the 61 days overlap of the two instruments. TOMS Site shows data over a 1.0 × 1.25° cell, and AIRS (300 km) and TSA (Tropical South America) are the daily minimum O3 value within 300 km of Licancabur and over the tropical South America.
Additional data collected through November 2004 at Laguna Blanca further showed 53 days of maximum UV-B/UV-A ratio exceeding 0.05, 15 days over 0.06, and two over 0.08. The highest value was reached on January 25, 2004, with UVI = 26.2.
When trying to identify the causes of these events, repetitive patterns were found, including increasing UV-B/UV-A ratios in the days to hours preceding the spikes, decreasing column ozone amount (Figure 2B), and the presence of NOAs.
The relationship between the concentration of ozone layer in the stratosphere and increase the UV radiant flux levels (mainly the UV-B, 280–315 nm) reaching the Earth's surface—including strong hourly to daily variations in the UV-B/UV-A ratio—has long been established (e.g., McKenzie et al., 1991; Madronich et al., 1995; Siani et al., 2002; Kudish et al., 2005; Kazadzis et al., 2009), and their ecological and societal impact are continuously being reassessed (e.g., Kerr et al., 2002).
Here, ratios over 0.05 were also regularly associated with the intermittent presence of cumulus clouds leading to high diurnal UV variability, particularly during the wet season (November–March), and later in the year, during winter storms at Laguna Negra (Figure 2A).
Modeling Approach
Measured UV values were compared with clear-sky radiative transfer model calculations. Spectral UV irradiance reaching the ground with clear sky was simulated by the radiative transfer model LibRadtran (Mayer and Kylling, 2005; Mayer et al., 2008) with 16 streams and a tropical standard atmosphere with ground-surface pressure values at the respective elevations above sea level. Resulting spectral transmission was scaled to spectral irradiance in W m−2 nm−1 using a high-resolution extraterrestrial solar spectrum (Kurucz, 1992). Other input values included a 0.97 aerosol single scattering albedo and a 0.71 asymmetry parameter that are typical for continental conditions (Hess et al., 1998). A rural aerosol profile was assumed to be valid with background aerosol values above 2000 m. The aerosol profile was scaled to a very small aerosol optical depth of 0.032 at 340 nm. Ozone absorption cross sections were taken from Bass and Paur (1985). A constant water vapor column amount of 3 kg/m2 typical for dry atmospheric conditions was applied, which is close to satellite-based MODIS data1. Values of spectral surface albedo were selected for gravel and loam at all elevations (Feister and Grewe, 1995). Spectral irradiances calculated at wavelength steps of 1 nm covered 280–700 nm and were convoluted with a triangular slit function having a full bandwidth of 1 nm. Spectral irradiance was integrated within the 280–315 nm, 315–400 nm, and 400–700 nm ranges. Erythemal effective irradiance was calculated by weighting spectral irradiance data with the erythemal action spectrum by CIE (McKinlay and Diffey, 1987).
The January 17, 2004 Case
Figure 3 illustrates the January 17, 2004 case. UV-A increased in the morning to values that reached or exceeded clear-sky irradiance for a few minutes, possibly partly due to cloud edge scattering as satellite imagery shows a high-reaching cloud field passing the site from the northwest. UV-B and UV-A may have been, thus, temporarily enhanced by cloud scattering. Comparatively, UV-B showed a substantially higher relative increase that lasted for over 2 h. Measured UV-B was then 2.4-fold that of clear-sky irradiance at a typical column ozone value of 240 DU. It peaked at ~8.15 W m−2, exceeding modeled clear-sky of UV-B = 6.4 W m−2, UVI = 66 for a modeled column ozone of 75 DU at 14:30 UTC (SZA = 30.5°). Peak height and duration could not, thus, be only explained by radiation scattered from cloud edges. Values dropped for 2 h as the clouds passed, then UV-A increased again. UV-B remained below 1 W m−2, which is explained if scattering with optically thick clouds enhanced the absorption by tropospheric ozone, thereby contributing to the pronounced drop in UV-B and reduced UV-B/UV-A ratios (Feister et al., 2011).
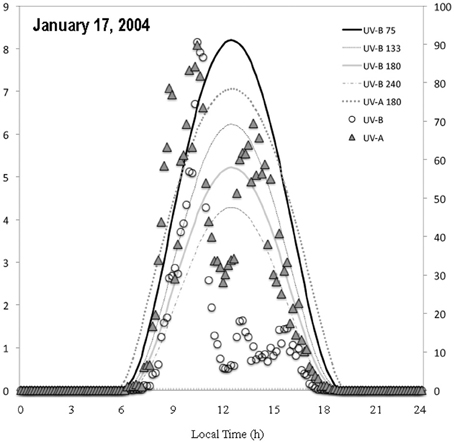
Figure 3. UV irradiance at Licancabur. Measured UV-A and UV-B on January 17, 2004 at Licancabur compared to results of clear-sky model calculations using LibRadtran with column ozone of 75 DU, 133 DU, 180 DU, and 240 DU (lines).
Common to all extreme cases was also the rapid east to west air flow in the middle to upper stratosphere. The sources and paths of air parcels reaching Licancabur during those events were determined using the Deutscher Wetterdienst (DWD) trajectory model for tropospheric and stratospheric pressure levels up to 7 days prior to each of the UV-B peak events (Figures 4A–D). The model is based on archived three-dimensional pressure and wind fields derived by the DWD global model GME (Kottmeier and Fay, 1998; Fay et al., 2004), and was applied to 14 atmospheric pressure levels between the middle troposphere at 500 hPa (5.5 km) and the middle stratosphere at 5 hPa (36 km).
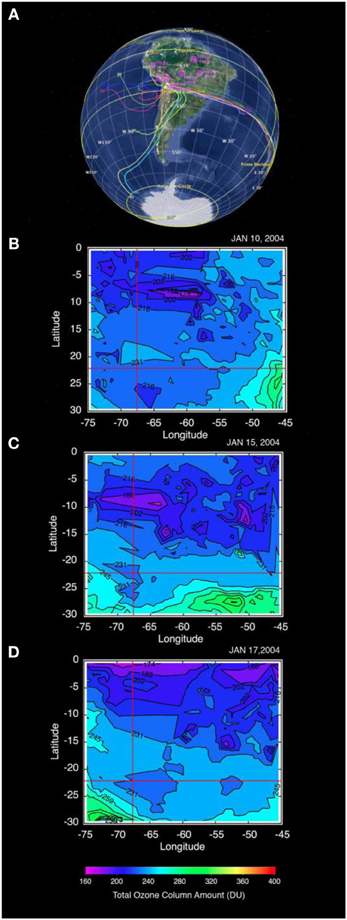
Figure 4. Trajectory reconstruction and NOAs. (A) Backward trajectories of air at 500 to 5 hPa atmospheric pressure levels (~ 6-36 km asl) over the sites on January 17, 2004 at 14:30 UTC (9:30 am local). Starting points of the trajectories are seven days prior arrival. Three NOAs directly connect with the path of the stratospheric (100, 50, and 5 hPa) and mid-tropospheric (500 hPa) trajectories; (B–D) Daily ozone maps for tropical South America showing the status of the ozone in the atmosphere at the time of the UV spikes of January 10, 15, and 17, 2004. The intersection of the two red lines mark the position of the sites. Ozone data—AIRS and TOMS.
On January 10, 2004, air parcels at 5 hPa originated from the subtropical/tropical eastern Indian Ocean and reached Licancabur within 7 days. During the same period, lower tropospheric air masses started over the hot and humid Amazon rainforest, and were forced up- and downward several times between 3 and 14 km in the middle and upper troposphere when passing over the high Andes (≥5000 m asl). Air parcels between 100 and 80 hPa (16.5–18 km) moved with speed up to 190 km/h from the Central Tropical Pacific (9°S/110°W), slowed down to ~20 km/h to finally start an anti-clockwise circular motion as they approached South America. They were forced up by the Andes further east, passed over Licancabur on January 12, moved westward before returning east over the site on January 17, 2004 at 9:00 am. Trajectories at higher elevations of 80–90 hPa were comparable although somewhat shifted south. They showed air parcels lifted upward once and reaching higher elevations up to 17.6 km altitude, possibly entering the lower stratosphere.
Differing from the upper troposphere, lower stratosphere trajectories between 60 and 65 hPa (19.5–21 km) showed meridional paths. They started 500 km off the Antarctic coast in the Southern Pacific (70°S/120–140°W) at 95 and 115 hPa. Although the ozone hole was well developed in the 2003 southern spring, ozone had risen back to 250–275 DU (TOMS) by January 2004. Transport of ozone-poor air from Antarctica at that time of the year is unlikely. However, it is worth noting that the air reaching Licancabur originated in the Antarctic stratosphere. Its composition of trace gases (e.g., ClO(x), BrO(x)), particularly those with medium to long lifetimes could have been transferred to the tropical Andes (Montzka and Reimann, 2011).
Discussion and Conclusions
Overall, the regional satellite observations and trajectory modeling are consistent with the in situ measurements of record solar irradiance. Converging lines of evidence include: (a) both ozone depletion, and the number and amplitude of NOAs strongly increased over the tropical South America between December 29, 2003 and January 17, 2004 with measured daily UV-B/UV-A ratio maxima increasing accordingly. Although no NOA below 150 DU was observed in the orbital datasets directly over Licancabur, this may only reflect the limitation of orbital daily data, which only provide an average snapshot of atmospheric events. NOAs between 101 and 150 DU were present in the tropical Andes in a timeframe compatible with the observed UV spikes; (b) some of the NOAs connected to the path of the mid-stratospheric air current carrying ozone–poor air, and to that of the mid-tropospheric 500 hPa air parcel trajectory from the north. Those, too, may have contributed to the spikes; and (c) two instruments spatially separated by 10 km showed consistent data (Figure 5).
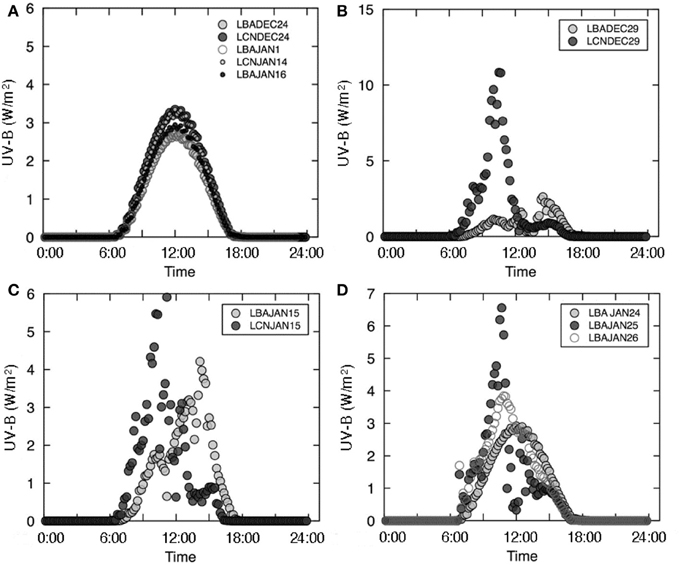
Figure 5. Comparison of UV-B profiles at both sites. Located 10 km apart, the two dosimeters recorded consistent data. Difference in UV-B amplitude are explained by elevation differences, and by local weather at the summit of Licancabur. (A) Before, between, and after major UV-B spikes, both instruments showed normal UV profiles; (B) The December 29, 2003 event was unique to Licancabur. Cloud fraction and UV profile at Laguna Blanca show cloudy conditions. (C) On January 15, both dosimeters high values; and (D) Between January 24 and 26, the LBA instrument shows a succession of normal day, atypical spike, and return to normal conditions with a residual late morning peak. From this, we are confident that instrument malfunction can be ruled out, and that profile shapes during events are, instead, diagnostic of the conditions leading to the generation of these record values.
While trajectories show horizontal and vertical traces of air parcels, they cannot reveal changes in ozone concentration due to dynamics and photochemistry along their travel paths. Deep convection in high-reaching clouds, particularly forced uplifting of tropospheric air approaching high mountain ranges, can lead to overshooting of tropospheric air into the lower stratosphere by crossing the high and cold tropopause. This air may contain ozone-destroying gases such as bromine compounds and nitrogen species (Gettelman et al., 2009), and may contribute to NOA formation and intensification.
Deep convection and high peaks in the Andes have also been shown to trigger gravity waves that propagate upwards into the stratosphere and create convectively unstable conditions between 23 and 35 km altitude (Spiga et al., 2008). Wave-breaking or dissipation provides a drag force directly over the topography. Mountain waves with shorter horizontal wavelengths show a westward propagation direction in compliance with NOA movement, longer vertical wavelengths, and larger momentum fluxes than waves further south and downstream of the mountains (Alexander and Teitelbaum, 2011). Due to decreasing air pressure with height, waves grow in strength, leading to changes in temperature and circulation, thus affecting ozone transport in the Brewer Dobson circulation. A wave-generated temperature decrease in the lower to mid-stratosphere would also tend to decrease ozone by enhancing photochemical ozone loss.
Other contributing factors may also include elevated levels of water transported from the troposphere into the stratosphere at very low temperatures in January (<200 K) (Voemel et al., 2002). They can swell and dilute sulfate aerosols, and increase the rate of heterogeneous activation of chlorine from chlorine reservoirs such as ClONO2 and HCl, thus accelerating ozone destruction (Anderson et al., 2012). MODIS Aqua and Terra satellite data collected by the Fire Information for Resource Management System (FIRMS, 2013) show abundant fire locations west and north of Licancabur in the week preceding January 17, 2004. From those, additional particulate sulfate aerosol and sulfur compounds such as OCS, SO2, and SO2−4 may have been transported and uplifted, further contributing to the ozone loss (Rasch et al., 2008; Bruehl et al., 2012).
Finally, although the evidence is circumstantial, an X45 class solar flare also took place on November 4, 2003, becoming the largest event ever recorded with instruments (Thomson et al., 2004). Heightened solar activity lasted over 5 months with additional events in the X10-17.2 class range between October 2003 and March 2004. Solar particle events have been shown to affect atmospheric chemistry (NOy and HOx) and foster ozone depletion (Woods et al., 2004). Our instruments were deployed 2 weeks after the X45 flares and showed the most extreme UV variability between the time of their deployment and the end of March 2004. The coincidental timing of the historical solar activity with seasonal UV maximum, and weather pattern that brings atmospheric instability over the Andes may have been additional factors that could have contributed to the generation of these unprecedented record UVI values.
Solar UV radiation is a major stress factor for the biota compromising the health of humans, terrestrial and aquatic ecosystems. Short-wavelength UV-B radiation damages DNA, affects photosynthesis, and decreases viability in eggs and larval stages of terrestrial and aquatic animals (Häder et al., 2011). Even though the high Andes are only sparsely populated by humans, their health can be affected by these record UV-B episodes. Therefore it is paramount that systematic monitoring in these wavelengths be undertaken including at lower elevations to understand the nature, extent, and significance of these high UV-B radiation events for human health and activity as well as for ecosystems.
Conflict of Interest Statement
The authors declare that the research was conducted in the absence of any commercial or financial relationships that could be construed as a potential conflict of interest.
Acknowledgments
This study was funded by the NASA Astrobiology Institute SETI Institute team grant #NNA04CC05A. It was supported in the field by the Corporacion Nacional Forestal (CONAF) and the Universidad Católica del Norte, Antofagasta, in Chile, and the Servicio Nacional de Areas Protegidas (SERNAP) in Bolivia.
Footnotes
References
Alexander, M. J., and Teitelbaum, H. (2011). Three-dimensional properties of Andes mountain waves observed by satellite: a case study. J. Geophys. Res. 116, D23110. doi: 10.1029/2011jd016151
Anderson, J. A., Wilmouth, D. M., Smith, J. B., and Sayres, D. S. (2012). Increased risk of ozone loss from convectively injected water vapor. Science 337, 835–839. doi: 10.1126/science.1222978
Bass, A. M., and Paur, R. J. (1985). “The ultraviolet cross-sections of ozone: I. The measurements,” in Atmospheric Ozone. Proceedings of the Quadrennial Ozone Symposium, eds C. S. Zerefos and A. Ghazi (Dordrecht; Boston; Lancaster: Reidel), 606–616.
Blumthaler, M., Ambach, W., and Ellinger, R. (1997). Increase of solar UV radiation with altitude. J. Photochem. Photobiol. B Biol. 39, 130–134. doi: 10.1016/S1011-1344(96)00018-8
Bradley, R. S., Vuille, M., Diaz, H. F., and Vergara, W. (2006). Threats to water supplies in the tropical Andes. Science 312, 1755–1756. doi: 10.1126/science.1128087
Bruehl, C., Lelieveld, J., Crutzen, P. J., and Tost, H. (2012). The role of carbonyl sulphide as a source of stratospheric sulphate aerosol and its impact on climate. Atmos. Chem. Phys. 12, 1239–1253. doi: 10.5194/acp-12-1239-2012
Cabrol, N. A., Grin, E. A., Chong, G., Minkley, E., Hock, A. N., Yu, Y., et al. (2009). The high-lakes project. J. Geophys. Res. 114, G00D06. doi: 10.1029/2008JG000818
Fay, B., Glaab, H., Jacobsen, I., and Klein, A. (2004). Air pollution forecasts of the German Weather Service for IMIS. Kerntechnik 69, 209–213. doi: 10.3139/124.100211
Feister, U., and Grewe, R. (1995). Spectral albedo measurements in the UV and visible region over different types of surfaces. Photochem. Photobiol. 62, 736–744. doi: 10.1111/j.1751-1097.1995.tb08723.x
Feister, U., Laschewski, G., and Grewe, R.-D. (2011). UV index forecasts and measurements of health-effective radiation. J. Photochem. Photobiol. B 102, 55–68. doi: 10.1016/j.jphotobiol.2010.09.005
FIRMS. (2013). Fire Information for Resource Management System [Online]. Available online at: http://firms.modaps.eosdis.nasa.gov/firemap/
Gettelman, A., Lauritzen, P. H., Park, M., and Kay, J. E. (2009). Processes regulating short-lived species in the tropical tropopause layer. J. Geophys. Res. 114, D13303. doi: 10.1029/2009jd011785.
Häder, D.-P., Helbling, E. W., Williamson, C. E., and Worrest, R. C. (2011). Effects of UV radiation on aquatic ecosystems and interactions with climate change. Photochem. Photobiol. Sci. 10, 242–260. doi: 10.1039/C0PP90036B
Häder, D.-P., and Lebert, M. (2006). “ELDONET - European light dosimeter network,” in Environmental UV Radiation: Impact on Ecosystems and Human Health and Predictive Models, eds F. Ghetti, G. Checcucci, and J. F. Bornman (Heidelberg: Springer), 95–108.
Häder, D.-P., Lebert, M., Marangoni, R., and Colombetti, G. (1999). ELDONET - European Light Dosimeter Network hardware and software. J. Photochem. Photobiol. B 52, 51–58. doi: 10.1016/S1011-1344(99)00102-5
Herman, J. R., and Keating, R. (2008). “Trends in emissions of ozone-depleting substances, ozone layer recovery, and implications for ultraviolet radiation exposure,” in A Report by the U.S. Climate Change Science Program and the Subcommittee on Global Change Research, eds A. R. Ravishankara, M. J. Kurylo, and C. A. Ennis (Asheville, NC: Department of Commerce, NOAA's National Climatic Data Center), 240.
Hess, M., Koepke, P., and Schult, I. (1998). Optical properties of aerosols and clouds: the software package OPAC. Bull. Am. Meteorol. Soc. 79, 831–844. doi: 10.1175/1520-0477(1998)079<0831:OPOAAC>2.0.CO;2
Jacovides, D. O., Tymvios, F. S., Asimakopoulos, D. N., Kaltsounides, N. A., Theoharatos, G. A., and Tsitouri, M. (2009). Solar global UVB (280-315 nm) and UVA (315-380 nm) radiant fluxes and their relationships with broadband global radiant flux at an eastern Mediterranean site. Agr. Forest Met 149, 1188–1200. doi: 10.1016/j.agrformet.2009.02.009
Kazadzis, S., Bais, A., Arola, A., Krotkov, N., Kouremeti, N., and Meleti, C. (2009). Ozone Monitoring Instrument spectral UV irradiance products: comparison with ground based measurements at an urban environment. Atmos. Chem. Phys. 9, 585–594. doi: 10.5194/acp-9-585-2009
Kerr, J. B., Seckmeyer, G., Bais, A. F., Bernhard, G., Blumthaler, M., Diaz, S. B., et al. (2002). “Surface ultraviolet radiation: Past and future,” in Scientific Assessment of Ozone Depletion: Chapter 5 (ed.) G.O.R.a.M.P (Geneva: World Meteorological Organization), 5.1–5.46.
Kottmeier, C., and Fay, B. (1998). Trajectories in the Antarctic lower troposphere. J. Geophys. Res. 103, 10947–10959. doi: 10.1029/97JD00768
Kudish, A. I., Lyubansky, V., Evseev, E. G., and Ianetz, A. (2005). Inter-comparison of the solar UVB, UVA and global radiation clearness and UV indices for Beer Sheva and Neve Zohar (Dead Sea), Israel. Energy 30, 1623–1641. doi: 10.1016/j.energy.2004.04.033
Kurucz, R. L. (1992). “Synthetic infrared spectra,” in Infrared Solar Physics, IAU Symposium, eds D. M. Rabin and J. T. Jefferies (Norwell, MA: Kluwer, Acad.).
Lee-Taylor, J. M., Madronich, S., Mayer, B., and Fischer, C. (eds.). (2010). UV Radiation in Global Climate Change: Measurements, Modeling and Effects on Ecosystems. Heidelberg: Springer-Verlag and Tsinghua University Press.
Madronich, S., McKenzie, R. L., Caldwell, M. M., and Björn, L. O. (1995). Changes in ultraviolet radiation reaching the Earth's surface. Ambio 24, 143–152.
Mayer, B., and Kylling, A. (2005). Technical note: the LibRadtran software package for radiative transfer calculations – description and examples of use. Atmos. Chem. Phys. 5:1855. doi: 10.5194/acp-5-1855-2005
Mayer, B., Kylling, A., Hamann, U., and Emde, C. (2008). LibRadtran. Library for Radiative Transfer Calculations. Edn 1.0. LibRadtran version 1.4. Available online at: www.libradtran.org
McKenzie, R. L., Matthews, W. A., and Johnston, P. V. (1991). The relationship between erythemal UV and ozone, derived from spectral irradiance measurements. Geophys. Res. Lett. 18, 2269–2272. doi: 10.1029/91GL02786
McKinlay, A. F., and Diffey, B. L. (1987). “A reference action spectrum for ultraviolet induced erythema in human skin,” in Human Exposure to Ultraviolet Radiation: Risks and Regulations, eds W. R. Passchier and B. F. M. Bosnjakovic (Amsterdam: Elsevier), 83–87.
Montzka, S. A., and Reimann, S. (2011). “Ozone-depleting substances (ODSs) and related chemicals,” in Scientific Assessment of Ozone Depletion: 2010 World Meteorological Organization: Global Ozone Research and Monitoring Project Repost – Report No. 52 (Geneva).
NOAA. (2008). “Trends in emissions of ozone-depleting substances, ozone layer recovery, and implications for ultraviolet radiation exposure,” in U. S. Climate Change Science Program: Final report, Synthesis and Assessment Product 2.4, eds A. R. Ravishankara, M. J. Kurylo, and C. A. Ennis (Asheville, NC: Department of Commerce, NOAA's National Climatic Data Center).
Piazena, H. (1996). The effect of altitude upon the solar UV-B and UV-A irradiance in the tropical Chilean Andes. Solar Energy 57, 133–140. doi: 10.1016/S0038-092X(96)00049-7
Rasch, P. J., Tilmes, S., Turco, R. P., Robock, A., Oman, L., Chen, C. C., et al. (2008). An overview of geo-engineering of climate using stratospheric sulphate aerosols. Philos. Trans. A Math. Phys. Eng. Sci. 366, 4007–4037. doi: 10.1098/rsta.2008.0131
Siani, A. M., Casale, G. R., and Galliani, A. (2002). An investigation on a low ozone episode at the end of November 2000 and its effect on ultraviolet radiation. Opt. Eng. 41, 3082–3089. doi: 10.1117/1.1516821
Spiga, A., Teitelbaum, H., and Zeitlin, V. (2008). Identification of the sources of inertia-gravity waves in the Andes Cordillera region. Ann. Geophys. 26, 2551–2568. doi: 10.5194/angeo-26-2551-2008
Thomson, N. R., Rodger, C. J., and Dowden, R. L. (2004). Ionosphere gives size of greatest solar flare. Geophys. Res. Lett. 31, L06803. doi: 10.1029/2003GL017345
Voemel, H., Oltmans, S. J., Johnson, B. J., Hasebe, F., Shiotani, M., Fujiwara, M., et al. (2002). Balloon-borne observations of water vapor and ozone in the tropical upper troposphere and lower stratosphere. J. Geophys. Res. 107, D14. doi: 10.1029/2001JD000707
Keywords: record solar UV irradiance, negative ozone anomaly, UV index
Citation: Cabrol NA, Feister U, Häder D-P, Piazena H, Grin EA and Klein A (2014) Record solar UV irradiance in the tropical Andes. Front. Environ. Sci. 2:19. doi: 10.3389/fenvs.2014.00019
Received: 18 April 2014; Accepted: 19 May 2014;
Published online: 08 July 2014.
Edited by:
Peter Rolf Richter, Friedrich-Alexander-University, GermanyReviewed by:
Rajeshwar P. Sinha, Banaras Hindu University, IndiaMarek Krywult, University of Bielsko-Biala, Poland
Copyright © 2014 Cabrol, Feister, Häder, Piazena, Grin and Klein. This is an open-access article distributed under the terms of the Creative Commons Attribution License (CC BY). The use, distribution or reproduction in other forums is permitted, provided the original author(s) or licensor are credited and that the original publication in this journal is cited, in accordance with accepted academic practice. No use, distribution or reproduction is permitted which does not comply with these terms.
*Correspondence: Nathalie A. Cabrol, Space Science Division, The SETI Institute Carl Sagan Center/NASA Ames, MS 245-3, Moffett Field, CA 94035-0001, USA e-mail: nathalie.a.cabrol@nasa.gov