Mission to Mars. Reliable method for liquid solutions diagnostics
 Vladimir F. Krapivin
 Costas A. Varotsos
 Vladimir Y. Soldatov
- 1Laboratory of Applied Mathematics, Informatics Department, Institute of Radioengineering and Electronics, Russian Academy of Sciences, Moscow, Russia
- 2Department of Environmental Physics and Meteorology, Faculty of Physics, University of Athens, Athens, Greece
Manned mission to Mars aims at solving many problems associated with operational diagnostics of liquid solutions (including drinking water), medical issues, and liquid fuels. This paper mainly proposes a new method to solve these problems both during the flight and the stay on the surface of the planet. The proposed method consists of a database development of spectral images of liquid solutions supplied by a multiple-channel spectroellipsometer and the diagnostics of liquid solutions using this database. In addition, the process of learning and the expert system for adaptive recognition of liquid solutions is described. Finally, the test of the expert system is demonstrated for a series of liquid solutions.
Introduction
The NASA Marshall Spaceflight Center, European Space Agency, China National Space Administration and Russian Space Agency have a long-term vision of sending a manned mission to Mars in the very near future. For this campaign many unresolved technical and social problems still remain, such as the creation of favorable conditions for human health during the flight and accommodation on the planet. In this context, negative health effects can be caused by both drinking water with distorted characteristics and medical products (e.g., solutions) with altered properties. Ensuring the reliable operational control of these vitally important elements is one of the main stages during the preparation for the manned mission to Mars. Such control of liquid solutions in the environment of Mars during ancient years will be an important stage in the exploration and life support.
Martian drinking water is concentrated in the frozen phase into the soil and as ice formations. Today, it is known that water on Mars exists almost exclusively as ice, with a small amount present in the atmosphere as vapor. Results from a recently published research suggest that the soil of the Martian surface contains water about 2% by weight. Drinking water extracted from soil or surface ice needs the preliminary investigation and continuous monitoring in time. The implementation of this procedure is feasible by means of optical methods developed for the Earth conditions without chemical analysis (Krapivin et al., 2012).
Krapivin et al. (2013) showed that the development of multichannel polarization optical instruments and the use of spectroellipsometric technology are very important for real-time ecological monitoring of aquatic environment. It should be mentioned that efficient solution of this multi-parametric problem greatly depends on the precision and simplicity of ellipsometric devices. Recently, considerable successes achieved in this area (Krapivin and Shutko, 2012; Mkrtchyan et al., 2013; Nitu et al., 2013a,b), notably:
• A technology of combined use of spectroellipsometry and algorithms of identification and recognition that allow the set-up of a standard integral complex consisting of instrumental, algorithmic, modular and software tools for the collection and processing of data about the quality of aquatic environment with forecasting and decision—making functions.
• A compact measuring—information multichannel spectroellipsometric system (device) for monitoring the quality of aquatic environment, that is based on the combined use of spectroellipsometry and training, classification, and identification algorithms (IA). This spectroellipsometric system differs from the modern existing analogs by the use of a new and very promising method of ellipsometric measurements, an original element base of polarization optics and a complex mathematical approach to estimate the quality of a water object subjected to anthropogenic influence. Unlike analogs, the above-mentioned system has no rotating polarization elements. This allows one to increase the signal-to-noise ratio and the long-term stability of measurements, to simplify and reduce the price of multichannel spectroellipsometers. This system is trainable to the recognition of the pollutants of aquatic environment.
The Method Description
The detection and identification of water quality, especially of drinking water, is being addressed by many scientists (Sun et al., 2013). For example, the US National Water-Quality Assessment Program (NAWQA) provides an understanding of water-quality conditions; whether conditions are getting better or worse over time; and how natural features and human activities affect those conditions. In the Earth conditions, water quality assessment is defined depending on many environmental factors connected with the environmental management from pollution sinks and sources. Martian conditions make additional unknown amendments in the task of reliable evaluation of drinking water that can be extracted on the Mars. Therefore, method of the drinking water assessment does not depend on the environment. Such a method can be based on the spectral analysis of water mass in the optical range (Krapivin et al., 2008).
The recently developed technology of an adaptive identification of the environmental elements from measurements in the visible spectral region permits to synthesize an expert system for an adaptive identification of the liquid solutions (ESAILS) that is shown in Figures 1, 2. This system is based on combined use of spectral measurements and algorithms for their processing. Spectral measurements are realized by means a compact multi-channel spectroellipsometer (MCS). The ESAILS includes information interface with computer (IIC), computer software (CS), and extending database (ED) of spectral etalons (SE). The CS offers a number of algorithms to process the data fluxes from MCS and provides service functions for visualization and control of the regime of measurements. The ED is formed during learning procedure when spectral images of liquid solutions are entered in ED as standard samples of the SE. The multi-dimensional vector space of SE is synthesized to be used for the recognition of unknown spectral images delivered by MCS. IA carry out the task of liquid solution assessment.
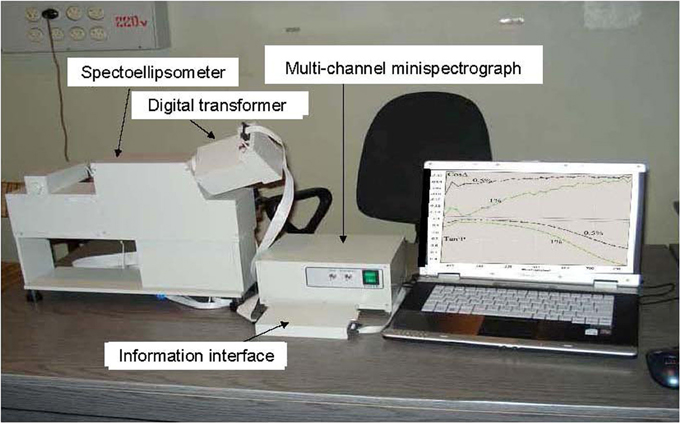
Figure 1. General view of the multi-channel spectroellipsometric system (MCSS) as a base of the ESAILS for the water quality assessment in real time regime. Instrumental characteristics of the MCSS are represented in Table 1.
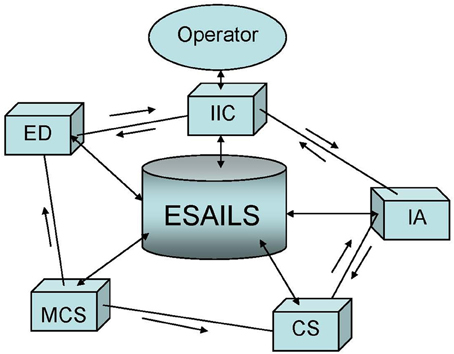
Figure 2. The ESAILS model.
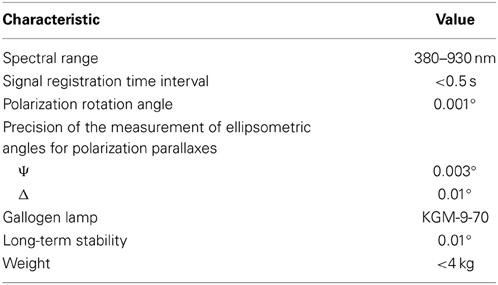
Table 1. Characteristics of the MCSS.
The principle of the ESAILS functioning is based on fixation of changes of the light flux at the MCS output and their transformation into a digital code. Further processing of these data with respect to their efficiency is determined by the CS composition containing various algorithms of recognition of 2D objects. The adaptability of the recognition procedure is determined by the level of accumulated knowledge about special features of intensity fluctuations and polarizing properties of the light reflected or dispersed in liquid solution. The CS includes the means that make it possible, in case of uncertain identification of the liquid solution, to make an expert decision based on the visual analysis of its spectral image. This procedure is implemented in the mode of dialog with ESAILS, and if decision is made, the operator can fix it in the database in the form of a standard for subsequent situations of an appearance of similar liquid objects. The ESAILS function that gives the possibility to expand the ED will help to continue the system education in Martian conditions.
The CS units define a variety of possible procedures for the processing spectral images depending on the criterion that determines the precision level for the solution quality assessment. One of basic CS units is recognition algorithm of two simple hypotheses: a null hypothesis H0 (liquid solution is normal) and an alternative hypothesis H1 (liquid solution is defective) are stated. Cluster analysis is used for these hypotheses testing and choosing between them. The CS units include traditional algorithms for signal recognition. The MCS delivers two signals simultaneously. The algorithms of signal recognition can be different. This choice is realized by the ESAILS operator.
The CS algorithms have more sweeping functions allowing the more detailed diagnostics of liquid solutions. These algorithms are based on cluster analysis and recognition of spectral images using special indicators. Recognition of liquid solution structure or receive of content of chemical elements is possible after creation of SE in the ED. This stage can be realized in the Earth conditions and on orbital space station taking into consideration knowledge about weightlessness effects on liquid solution.
Mathematical morphology proposes an idea of filters for the recognition operations based on structural analysis of digital spectral image. Special informative indicator for every spectrum is created to be used for optical spectral signals recognition. Indicator structure has the vector form A = {A1, …, An} where Ai (i = 1, …, n) is the one of spectrum characteristic. The CS algorithm of indicator structure formalization realizes the following evaluations of the spectrum parameters:
• A1 is the area occupied by the spectral curve;
• A2 and A3 is the maximal and minimal value of spectral curve, respectively;
• A4 is the maximal distance between the abscissas of maximal and minimal values of spectral curve;
• A5 and A6 are the maximal first and second derivatives of spectral curve, respectively;
• A7 is the number of maxima of spectral curve;
• A8 and A9 are the values of spectral curve for λ = λ * and λ = λ**, respectively, where λ * and λ** are free parameters selected with the condition of maximal probability of the spectral image recognition; and
• A10 is the ratio of bandwidth portions located astride of spectral curve maximum (if not exists A10 = 0).
Spectral image identification of the liquid solution under consideration is implemented by means of the comparison of its vector images ΞΔ(X1, …, Xn) and ΞΨ (Y1, …, Yn) delivered by spectroellipsometer with series of etalons in ED. Here ΞΔ is the light intensity in photo detector and ΞΨ is the tangent of relative shift angle of phases for two orthogonal polarized components. Components Xi and Yi (i = 1, …, n) characterize forms of spectral images received for two polarized light signals. Space of spectral images is formed during the learning procedure with the use of spectroellipsometric or spectrophotometer system. This procedure is performed in laboratory conditions when spectral images and chemical analysis are realized at the same time.
Liquid solution identification is realized by means of search of SE {ΞsΔ, ΞsΨ} in the ED that have minimal distance from spectrum {ΞxΔ, ΞyΨ} of this solution. Distance between the vector identifiers is calculated by means the following average value:
Liquid solution can be single-component or multi-component. The procedure (1) allows:
• The recognition of liquid solution and to assess chemical element concentration, when it is single-component; and
• The binary classification of liquid solution as “normal” or “abnormal.”
As it is shown below the use of criterion (1) gives better result in comparison with the application of other known criteria of closeness between spectral curves. That is why, in this case, there is minimal risk to miss the situation with dangerous water solution. In common case, the following three methods are usually employed:
• Cluster analysis. In this case two types of clusters are formed for CosΔ and TanΨ.
• Algorithm of discrepancy between spectra. Assessment of the average distance between the ordinates for both spectra. The decision is made taking into account minimal value of this distance.
• Algorithm of discrepancy between etalon vectors. In this case decision is made taking into considered minimal value δ.
In the case of multi-component liquid solution, the determination of the chemical element concentration is possible by means of the following algorithm. Let's suppose that the proper emission of the liquid solution can be measured simultaneously with the help of n-channel spectroellipsometer, each channel of which operating at a fixed wavelength λj (j = 1, …, n). As a result, the output of each channel reach the fixed values Zij (i = 1, …, M), so that Zij = Tj + ξij, where Tj is the brightness registered at the wavelength λj, and ξij is the random value (noise) with the zero mean and dispersion σ2j.
Let's assume that the correlation between the brightness and m parameters of the liquid solution is linear. Then:
where aij are the coefficients determined in the regime of learning procedure when concentrations of chemical elements {xi} are known. The x*i parameter should be estimated for the x0i parameters so that, first, the average x*i to coincide with the accurate solution of the system (2), that is, (i = 1, …, m), and second, a dispersion of the x*i estimate to be at a minimum, that is, D [x*i] ≤ D [], where is the estimate of the x0i parameter obtained by any other method. The system of linear algebraic Equation (2) is the over-determined (m > n) or undetermined (m < n) system, a solution of which gives the concentration of chemical elements.
The Implementation Method
One of the ESAILS versions was tested during US/Russian hydrochemical expedition in 19951996 to study the pollution level of the Angara-Yenisey river system. Learning procedure was realized by the Analytical Services Center of Ecology and Environment, Inc. (an EPA certified laboratory) and the Irkutsk Medical Inspection Service. On-site measurements are realized in Siberia's Angara and Yenisey Rivers near Irkutsk, Angarsk, Bratsk, and the Angara-Yenisy junction. At all locations of samples, an increase in heavy metal and oil hydrocarbon concentration levels was detected in comparison with previous Russian measurements (Phillips et al., 1997).
Other ESAILS version was tested during Vietnamese/Russian hydrochemical expeditions in 2001–2013 when water quality was studied in different reservoirs and rivers (Panas et al., 2013). It was shown that ESAILS allows the operative assessment of water quality detecting a wide spectrum of chemical elements with precision in range from 0.5 to 5 percents depending on the water objects (Mkrtchyan and Krapivin, 2013).
At present paper, the ESAILS control is realized by means of diagnostics of different liquid solutions with preliminary education. Specific liquid solution is prepared with concentration sampling equaled to 5% from maximal level when its transparence was 15%. This value is defined under the assumption that drinking water and medical solutions mainly satisfy this condition. Figures 3, 4 demonstrate typical example of visual results of spectral measurements realized by means of a 35-channels spectroellipsometer as device of the ESAILS.
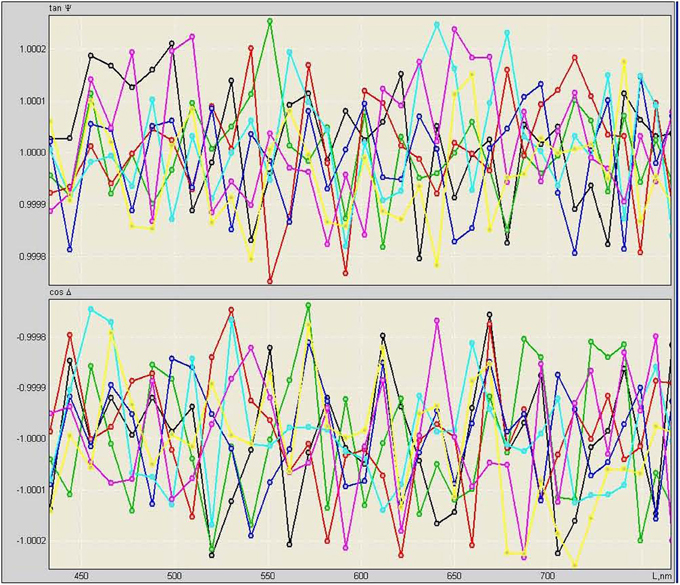
Figure 3. Fragment of the ESAILS extending database. Spectral CosΔ and TanΨ are spectroellipsometric parameters where Δ and Ψ are spectroellipsometric angles (Perov et al., 1994).
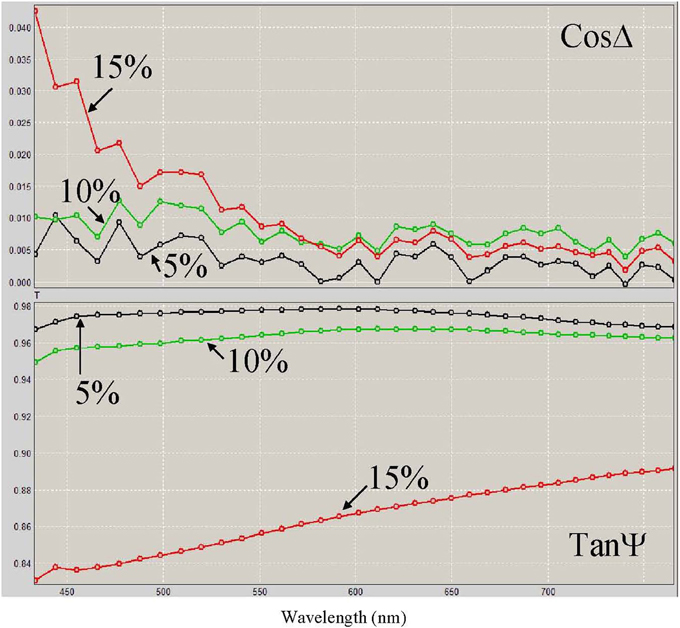
Figure 4. Real results of spectral measurements of ZnSO4 dissolved in water as retrieved by the ESAILS. Concentrations of zinc sulfate are shown on the curves.
The set of spectrum characteristics {ΞxΔ, ΞyΨ} can be extended. Spectroellipsometric measurements deliver two spectra for each liquid solution. Table 2 gives an example of coupled spectral image registered by means of a 35-channel spectroellipsometer.
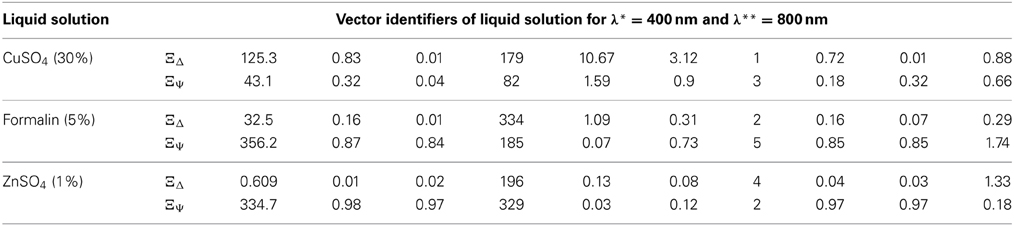
Table 2. Fragments of the ESAILS database.
Table 3 characterizes the precision of different algorithms that can be used for the liquid solution assessment and identification. These results are given for identification of liquid solutions with small concentration. Realization of the identification procedure for different liquid solutions has shown that the identification precision is a function of the solution concentration. As it seen from Figure 5 this precision is decreased with the liquid solution increase.
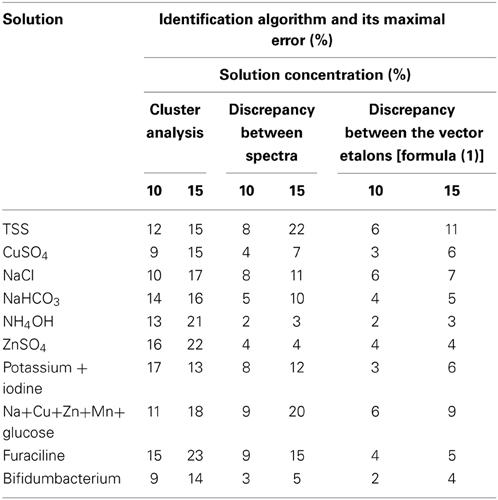
Table 3. Comparative assessment of the identification algorithms used by the PLSI unit.
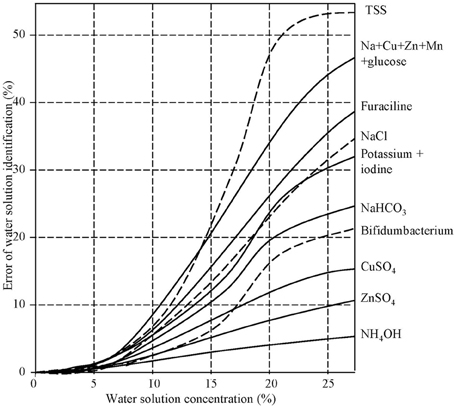
Figure 5. Dependence of spectral image identification error on the solution concentration. Notation: TSS—total suspended solids.
Conclusion
The discussion above showed that the ESAILS technology version can carry out the task of liquid solution diagnostics in conditions where the use of chemical analysis is not feasible. Such situation occurs both on Earth and in the space. This version is performed in the context of concrete assumptions. It is shown that the actual use of the diagnosis of the liquid solution during the Mars mission requires detailed investigations.
In particular, the possible change of the liquid solution in the absence of gravity (“Zero Gravity”) has not been studied until now. For instance, under zero gravity conditions the changes in incompressibility, elasticity, convective heat exchange, hydrostatic pressure, and other physical parameters of the solution can influence its spectral properties in the optical range.
The weightlessness effects in many natural processes including those in the liquid phase can lead to disturbances of living conditions. The above proposed technology can help to detect such effects well in advance. In particular, stop of engine can lead to change of flight path. We discussed above the fact that the operative spectral control of fuel solution can be realized by means of the ESAILS adapted to this area.
The ESAILS employement as a specific onboard device for space expeditions is possible considering the following actions:
• Definition of liquid solutions that could be diagnosed by using the ESAILS tools;
• Realization of the learning procedure in the Earth conditions to form database of spectral images for these liquid solutions and assessment of the ESAILS efficiency;
• Realization of the recognition procedure for separate liquid solutions on the International Space Station and assessment of the weightlessness influence on spectral images of liquid solutions;
• The ESAILS modernization taking into account the assessments obtained; and
• Production of the ESAILS as onboard device for space campaigns.
Conflict of Interest Statement
The authors declare that the research was conducted in the absence of any commercial or financial relationships that could be construed as a potential conflict of interest.
References
Krapivin, V. F., Mkrtchyan, F. A., Klimov, V. V., and Soldatov, V. Y. (2013). “Adaptive spectroellipsometric technology for aquatic environment diagnostics,” in Proceedings of the International Symposium Engineering Ecology-2013, Vol. VII (Moscow: Institute of Ecoinformatics), 26–33.
Krapivin, V. F., Mkrtchyan, F. A., Kovalev, V. I., and Klimov, V. V. (2008). “An adaptive system to identify the spots of pollutants on the water surface,” in Proceedings of the Eighth International Symposium “Ecoinformatics Problems” (Moscow: The Moscow Sciences Engineering A.S. Popov Society for Radio, Electronics and Communication), 35–46.
Krapivin, V. F., and Shutko, A. M. (2012). Information Technologies for Remote Monitoring of the Environment. Chichester: Springer/Praxis.
Krapivin, V. F., Shutko, A. M., and Nitu, C. (2012). The GIMS-based research remote sensing platforms. Bull. AGIR V.XVII, 1224–1228.
Mkrtchyan, F. A., and Krapivin, V. F. (2013). An adaptive monitoring system for identify of the spots of pollutants on the water surface. World Environ. 3, 165–169.
Mkrtchyan, F. A., Krapivin, V. F., Klimov, V. V., and Kovalev, V. I. (2013). “Hardware–software system of the water environment monitoring with use of microwave radiometry and spectroellipsometry means,” in Proceedings of the 28-th International Symposium on Okhotsk Sea and Sea Ice (Mombetsu: The Okhotsk Sea & Cold Ocean Research Association), 104–109.
Nitu, C., Krapivin, V. F., and Soldatov, V. Y. (2013a). Information-Modeling Technology for Environmental Investigations. Bucharest: Matrix Rom.
Nitu, C., Krapivin, V. F., Soldatov, V. Y., and Dobrescu, A. S. (2013b). “A device to measure the geophysical and hydrophysical parameters,” in Proceedings of the 19th International Conference on Control Systems and Computer Science—CSCS19 (Bucharest: University “Politechnika”), 281–284.
Panas, A. I., Nguyen, X. M., Krapivin, V. F., Mkrtchyan, F. A., Potapov, I. I., and Soldatov, V. Y. (2013). Science-technical collaboration between Russian Academy of Sciences and Vietnamese Academy of Science and Technology under the study of biological resources, geochemical and geophysical processes in coastal zone of South-China Sea. Prob. Environ. Nat. Res. 12, 98–120.
Perov, P. I., Kovalev, V. I., Rukovishnikov, A. I., Rossukanyi, N. M., and Johnson, W. H. (1994). New high precision and high speed automatic ellipsometer with polarization switching for in situ control in semiconductor device technologies. Int. J. Electr. 76, 797–803.
Phillips, G. W., August, R. A., Cherepenin, V. A., Harper, M. J., King, S. E., Krapivin, V. F., et al. (1997). Radionuclear pollutants in the Angara and Yenisey rivers of Siberia. Radioprotection-Colloques 32, 299–304
Keywords: Mars mission, drinking water, liquid fuel, diagnostics, liquid solution, spectroellipsometer, spectral image, recognition
Citation: Krapivin VF, Varotsos CA and Soldatov VY (2014) Mission to Mars. Reliable method for liquid solutions diagnostics. Front. Environ. Sci. 2:21. doi: 10.3389/fenvs.2014.00021
Received: 07 April 2014; Paper pending published: 02 May 2014;
Accepted: 27 May 2014; Published online: 19 June 2014.
Edited by:
Juergen Pilz, Alpen-Adria Universitaet Klagenfurt, AustriaReviewed by:
Guennady Ougolnitsky, Southern Federal University, RussiaIrina Melnikova, St. Petersburg State University, Russia
Copyright © 2014 Krapivin, Varotsos and Soldatov. This is an open-access article distributed under the terms of the Creative Commons Attribution License (CC BY). The use, distribution or reproduction in other forums is permitted, provided the original author(s) or licensor are credited and that the original publication in this journal is cited, in accordance with accepted academic practice. No use, distribution or reproduction is permitted which does not comply with these terms.
*Correspondence: Vladimir F. Krapivin, Laboratory of Applied Mathematics, Informatics Department, Institute of Radioengineering and Electronics, Russian Academy of Sciences, Vvedensky sq. 1, Moscow 141190, Russia e-mail: vkrapivin_36@mail.ru