Fresh groundwater for Wajir—ex-ante assessment of uncertain benefits for multiple stakeholders in a water supply project in Northern Kenya
 Eike Luedeling1,2*
  Arjen L. Oord3
  Boniface Kiteme4 Sarah Ogalleh4
  Maimbo Malesu1
  Keith D. Shepherd1
  Jan De Leeuw1
- 1Land Health Decisions, World Agroforestry Centre (ICRAF), Nairobi, Kenya
- 2Centre for Development Research, University of Bonn, Bonn, Germany
- 3Acacia Water, Gouda, Netherlands
- 4Centre for Training and Integrated Research in ASAL Development, Nanyuki, Kenya
Decision-making in development rarely considers uncertainty in project benefits and costs and the risk of project failure. Lack of appropriate tools for ex-ante analysis under conditions of data scarcity constrains the ability of decision-makers to anticipate project outcomes. Business analysis techniques can help in such situations, but they have rarely been applied in development contexts. We use the principles of Applied Information Economics to develop a decision model for a water supply intervention. In the proposed Habaswein-Wajir Water Supply Project in Northern Kenya, water is to be extracted from a major aquifer near Habaswein and piped to the city of Wajir. A team of eight experts developed a model including all costs, benefits, and risks considered important for project success. After estimation training, these experts expressed their uncertainty for about 100 variables in the model with probability distributions. We used Monte Carlo simulation to project decision outcomes, and Partial Least Squares (PLS) regression to identify critical uncertainties affecting the decision. The project was found to be risky for most stakeholders, mainly due to the risk of political interference caused by water supply concerns in Habaswein and due to unclear profitability of the water supply business. Uncertainties about how to value decreasing infant mortality and reduction in water-borne disease incidence were also critical. The greatest hydrological risk was salt water intrusion into the aquifer. Careful well design, inclusive project planning and benefit sharing could raise the chance of project success. The analysis improved understanding of the decision by all stakeholders, some of which changed their opinions on the pipeline, requested more measurements, or proposed alternative water supply options. Decision analysis can help clarify decision uncertainties and outcome expectations and thereby improve decision-making processes, especially in data-scarce areas.
Introduction
Historically, decisions about which development interventions to pursue have been based mainly on their perceived technical and economic feasibility. It is now generally acknowledged, however, that ex-ante evaluation of development decisions should also consider impacts on the wider natural and social environment. Such an inclusive approach is critical for ensuring that the consequences of the intervention are environmentally sustainable, economically viable, and socially just. Consequently, many countries have developed legislative instruments requiring ex-ante environmental and social impact assessments for major interventions (Jay et al., 2007).
Despite the recognition that holistic impact assessment is highly desirable in intervention planning, a number of limitations hinder its application in practice. First, available data is often insufficient for arriving at unambiguous conclusions about the impacts of an intervention (Peterman and Anderson, 1999; Regan et al., 2005). This is a particular problem in data-scarce environments such as Sub-Saharan Africa, but data on some aspects, such as social and off-site environmental impacts, tend to be limiting everywhere. Second, even where some information is available, decision-makers often lack appropriate tools for integrating different types of information into a context-specific forecast of decision outcomes (Peterman and Anderson, 1999). Third, decision-makers lack appropriate tools for adequately addressing uncertainties of individual variables and the effects of their accumulation in the decision making process. In cost-benefit analyses, uncertain variables describing costs and benefits are often substituted by precise best-bet estimates, which only represent one possible value out of a larger population of plausible values. Fourth, as a result of this, intervention planning often fails to assess risks that could jeopardize success of an intervention or compromise its performance.
In day-to-day practice decisions are frequently made without attempt to address these limitations. Consequently, when risks remain unconsidered, there is a high chance that decision outcomes will not meet stakeholder expectations.
Aware of the above limitations, decision-makers often commission measurements or detailed scientific studies to close perceived knowledge gaps. However, decisions on which knowledge gaps should be closed or narrowed are rarely guided by a structured analysis of information value, or which uncertainties most affect project outcomes (Clapp et al., 2013; Hubbard, 2014). In the absence of such prioritization, commissioned research will tend to follow intuitive preference for information that is readily available or easy to generate, leading to what Hubbard (2014) describes as the “measurement inversion.” Sometimes, the knowledge gaps that most strongly constrain the capacity to make informed decisions include variables that are difficult to quantify or not easily measured, such as the future market price of a commodity or cultural acceptability of an innovation. Such variables are easily overlooked in project feasibility studies. Interestingly, reducing uncertainty on such variables can be quite cheap and easy, given that little work has often been done on them. For example, if cultural acceptability of a new crop is an uncertainty in project planning, a small number of interviews may suffice for establishing whether this crop has a chance of success. In comprehensive decision evaluation, this evidence can easily produce a higher gain in certainty about the project's prospective outcomes than a large-scale soil survey or detailed modeling of crop performance. Since time and resources for decision-relevant research are normally limited, structured prioritization of knowledge gaps can make a critical contribution to the effectiveness of decision-support research.
In this study, we propose a holistic decision analysis approach that allows comprehensive integration of all relevant variables, even those with uncertain and missing information, and that considers risk factors that may jeopardize project success or affect project performance. The proposed approach also allows users to identify and prioritize those knowledge gaps that should most urgently be narrowed in order to improve certainty about decision outcomes.
Decision Modeling
The approach taken in this study is inspired by the principles of Applied Information Economics outlined by Hubbard (2014). We start by thoroughly framing the decision to be modeled, followed by identification of all relevant stakeholders (Figure 1). We then identify a small group of experts with a good understanding of the decision in question as well as the local environmental and socioeconomic context of the target area and population. It is desirable that this expert group also includes the decision-makers or their close advisors and other major stakeholders, because their personal involvement in the modeling team may help them refine their understanding of the implications of their decision and ensure that study results are duly considered in the decision-making process.
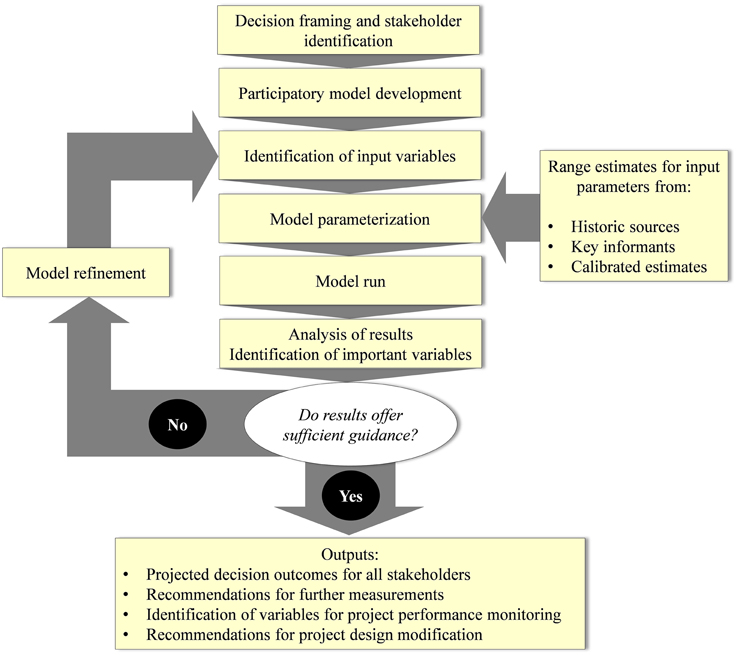
Figure 1. Sequence of activities in the decision modeling approach.
The expert group then engages in participatory model development, in which an impact pathway for the decision is constructed based on the experts' expectations of decision impacts. In this step, the group aims at including all relevant costs and benefits of the proposed intervention. They also thoroughly explore and list all plausible risks that may affect project success and outcomes. At this stage, high levels of mechanistic detail in considering particular costs, benefits, or risks are not needed and not desirable. It is also not important that the group has a detailed plan for measuring any of the variables that they introduce into the model. Instead, they should aim at capturing all relevant issues in the initial model. If any of these variables emerge as key uncertainties, they can be disaggregated at a later stage of the process. The key focus in the initial model building is on generating a conceptual model that represents the “big picture” of the decision at hand. This model is then translated into a set of equations that represent the group's understanding of the decision's impact pathway.
Once a comprehensive quantitative model has been developed, which basically represents the decision's impact pathway, members of the group of experts are requested to provide probability distributions of all input variables based on their uncertainty about the parameters used. At the simplest level, these can be provided as confidence intervals, i.e., as a set of two values of which the expert is 90% sure that they bracket the real value of the variable. They also select a probability distribution. This can be a normal distribution or a distribution with a different shape, if experts feel confident that this is more appropriate. To prepare experts for the estimation exercise, they undergo calibration training (Hubbard, 2014) before making estimates. During this training, they are instructed in a number of estimation techniques that measurably improve people's ability to estimate distributions (Hubbard, 2014). In consultation with the modeling team, estimates from the various experts are then consolidated into one single probability distribution for each variable.
Next, the model is run a large number of times as a probabilistic Monte Carlo simulation, each time fed with a different set of random draws from the defined distributions for each variable (Rosenstock et al., 2014). The result is a distribution of outcomes that are plausible given the experts' current state of uncertainty. In some cases, this outcome distribution may already suffice for deciding on a rational course of action for the decision (Peterman and Anderson, 1999). In most cases, however, decisions have a wide spread of potential outcomes, including negative ones. The width of the range of outcomes results from the uncertainty in the individual variables. Reduction of uncertainty of some influential variables will help reduce the range of overall outcomes, with a possibility of thus reducing the likelihood of negative outcomes. For such situations, mathematical procedures exist to explore the sensitivity of the model outputs to variation in the input variables and determine the value of information of every single variable (Hubbard, 2014). The value of information allows identification of those variables that most strongly affect uncertainty of the overall outcome and thus constrain the capacity to identify a preferable course of action. The variables that emerge with the highest information value can be interpreted as priorities for measurements to be undertaken to narrow the uncertainty around the decision.
Where particular variables emerge as priorities for measurement, additional measurements can be taken and the modeling procedure repeated (Figure 1). In some cases, simply decomposing a variable into a subset of variables that is easier to estimate may produce sufficient gain in certainty about decision outcomes. If the preferable course of action is not yet clear, the process can be used to guide further measurements and to successively reduce uncertainties about intervention outcomes, until sufficient confidence about which decision course is appropriate has been gained. Intervention designs can also be improved by directing attention to areas that pose greatest risk.
We next illustrate this approach with a case study we conducted in Wajir County in Northern Kenya. The procedures outlined above were used to simulate the outcomes of the proposed Habaswein-Wajir Water Supply Project, which aims to supply Wajir town with clean and reliable water.
The Habaswein-Wajir Water Supply Project
Target Area
We analyzed the risks around the development of groundwater resources in the Habaswein Division of Wajir County to supply the town of Wajir with water, mainly for domestic and industrial use. Wajir (1.75°N; 40.1°E) is the largest town in Wajir County in the former Northeastern Province of Kenya (Figure 2). The climate is arid with an average annual rainfall of 250 mm. The official population estimates for Wajir were 42,207 in 1999 and 82,800 in 2009, reflecting a 6.7% increase per year, but these numbers have been contested and real population numbers are likely much higher. We consider that the true size of the population today (2015) is not well known and might be anywhere between 120,000 people, a conservative estimate based on the 2009 census and a 6.7% annual increase since then, and approximately 300,000, which was considered more realistic by local experts.
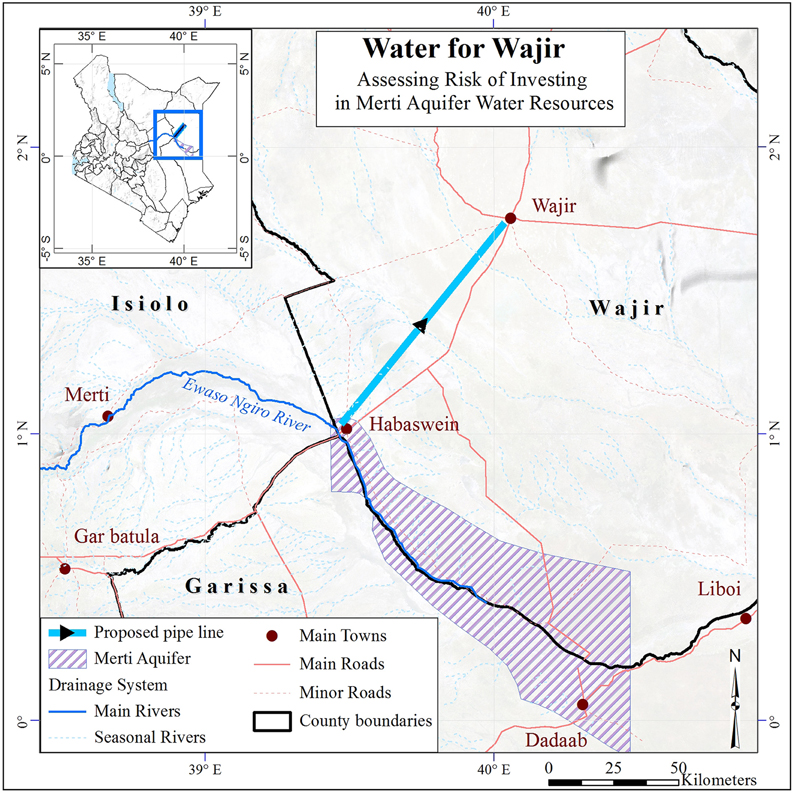
Figure 2. Geographic context of the proposed Habaswein-Wajir Water Supply Project.
The growing population complicates the continued provision of water through shallow wells, which have supplied the people of Wajir with water up to now. First of all, over-abstraction may lower the groundwater level so much that shallow wells can no longer function (Apaydın, 2012). Secondly, the biological quality of the water in these shallow wells is increasingly poor due to contamination with human and livestock excreta (Osman, 2012). Consequently, the national and county governments, who have identified the need for additional water of better quality, have developed a plan for a more sustainable solution to abstract water from the Merti aquifer, a rich body of groundwater located 110 km to the south (Mumma et al., 2011; De Leeuw et al., 2012).
The Planned Project
The plan for what is formally known as the Habaswein-Wajir Water Supply Project envisages the establishment of a well field with 12 deep wells in the vicinity of Habaswein (Figure 2), designed to allow for an abstraction of 2.2 million m3 of fresh groundwater per year. This water is to be transported through a pressurized pipeline to Wajir, where it will be stored in reservoirs and distributed throughout the city via a reticulation system that is yet to be built. The project will also provide initial support to the water company that will operate and maintain this infrastructure and supply water to customers in Habaswein, Wajir and in settlements along the pipeline (Kanjara, Boji Yare, and Leheley).
In October 2010 the Ministry for Development of Northern Kenya and other Arid Lands (MDONK) applied through the Kenyan Treasury for a grant of € 37.7 million from the Dutch Facility for Infrastructure Development (ORIO). If approved, ORIO will donate 35% of the costs and provide a soft loan for the remainder. As a first step, ORIO approved a € 0.796 million project development phase grant in March 2012, and contracts for studies were established in April 2012. While several studies had been completed by the start of our research in November 2013, other studies were still pending, including social and environmental impact studies and a financial feasibility study. The research described in this article therefore overlapped with the decision-making process on the Habaswein-Wajir Water Supply Project.
The political approval process for the Habaswein-Wajir Water Supply Project has been complicated by a constitutional reform and devolution of authority in Kenya in 2012, which passed substantial decision-making power from central government to the county level (Kramon and Posner, 2011). While central government initiated and still formally leads the project, the devolution process has shifted the initiative toward the county government, which now plays an important role in decision-making. During the initial planning stages, the central government did not involve many of the stakeholders who stand to be affected by the project. These stakeholders remain poorly informed, and some groups have voiced concerns about the project (Ogalleh, 2015). These concerns are particularly strong among residents of Habaswein, who fear for the reliability of their water supply, which comes from boreholes tapping the Merti aquifer. Residents of Wajir town tend to be more in favor of the project, but some have also expressed reservations, caused for example by the prospect of having to pay a higher price for water in the future (Ogalleh, 2015).
Hydrogeological Setting
The most relevant water-related risks for the Merti Aquifer are drying up of wells in the proposed well field and deterioration of water quality as a result of increasing salinity of the abstracted water. While the newly proposed national water policy, which is currently under discussion in parliament, states the importance of ensuring inter-generational sustainability of groundwater use, inadequate information about basic aquifer parameters and limited practical experience with deep groundwater extraction hamper the application of this principle. In fact, lack of data and high uncertainty are typical features of many deep aquifers, particularly in Sub-Saharan Africa. Although the Merti aquifer is a vital source of fresh water in the region, relatively little is known about the extent of the aquifer, its hydrogeological parameters and groundwater recharge.
The Merti aquifer is defined by permeable water-bearing layers located within the Anza Rift (Bosworth and Morley, 1994). Generally, groundwater in the aquifer is confined and found at depths between 110 and 180 m below ground level (m bgl). Successful wells tap the more permeable zone of the Merti Formation commonly between 105 and 150 m bgl (GIBB Africa Ltd., 2004). Several attempts have been made to define the extent of the aquifer (e.g., Swarzenski and Mundorff, 1977; GIBB Africa Ltd., 2004). In these studies, the aquifer is believed to be limited by the presence of adjacent saline water bodies. Most studies agree that the main freshwater aquifer extends from Habaswein into Somalia at Liboi and beyond (see Figure 2). There is no comprehensive information that defines the aquifer's vertical extent. GIBB Africa Ltd. (2004) reports a likelihood that salinity of the groundwater increases with depth. The vertical extent of the freshwater aquifer is either limited by impervious layers, or the presence of saline groundwater.
Another source of substantial uncertainty is aquifer recharge. This has been a topic of debate among hydrogeologists, since knowledge of aquifer recharge is critical for designing a sustainable long-term groundwater use strategy. Mumma et al. (2011) report that groundwater abstraction comes from fossil water, with limited annual recharge (~3.3 million m3 yr−1) and major recharge events (~30 million m3) occurring at intervals of thousands to tens of thousands of years. GIBB Africa Ltd. (2004), however, suggests the possibility of a much higher recharge rate of 33 million m3 yr−1.
Mumma et al. (2011) consider that most of the aquifer is currently under insignificant depletion stress, although very little data is available. The main groundwater abstractions take place in Habaswein and in the refugee camps of the Dadaab area (Figure 2). Influx of refugees into the Dadaab refugee camps has led to a sharp increase of groundwater abstraction from ~1 million m3 in 2002 to ~3 million m3 in 2011 (Mumma et al., 2011; Oord, 2011). In consequence, water quality in the Dadaab refugee camps has deteriorated over time, mainly due to increasing salinity, and also in Habaswein evidence exists of some salinization as a result of long term abstraction (Mumma et al., 2011). These observations strengthen the plausibility that a saline groundwater body underlies the freshwater aquifer.
Study Objectives
The objectives of the present study were two-fold: (1) to serve as a proof of concept that the Applied Information Economics approach, which has so far been applied predominately in single-decision-maker business decision settings, can improve decision-making processes in multiple stakeholder decision-making in a development context; (2) to comprehensively assess the Habaswein-Wajir Water Supply project, considering all relevant costs, benefits and risks, in order to provide holistic decision support on the preferable course of action. To account for the fact that most stakeholders perceived groundwater supply and quality as the main risks to the project, the hydrology of the aquifer was also evaluated with models that considered uncertainty about aquifer parameters.
Methods
Participatory Model Development
A decision model was constructed using the framework outlined in the Decision Modeling section. The decision we modeled—whether to implement plans for the Habaswein-Wajir Water Supply project—was clearly defined and under consideration by national government and local authorities in Wajir County at the time of our research. Efforts for decision framing were therefore limited to clarification of design details of the proposed intervention. Stakeholders in the project, who were carefully identified through consultations with people familiar with the project and the target area, were then invited to an inception workshop. This workshop was held on November 4th 2013 and attended by approximately 30 stakeholder representatives, including potentially affected groups of water users, local government, water management authorities, the research community, and practical hydrogeologists with experience in the proposed project area. Stakeholder expectations of project outcomes and attitudes toward the project were explored through open-ended discussions, and a small team of eight experts was selected from among the workshop participants to contribute to the participatory model building process. To become part of the model building team, participants had to be available during the 2 days following the workshop and knowledgeable about the proposed project, the study area or the hydrology of the region. Care was also taken to ensure that the team included members from Wajir and Habaswein, who were well-respected by these communities and by local government.
The development of the quantitative impact model was initiated by brainstorming on all major benefits and costs expected to arise from the project, as well as on all the risks that might threaten project success. Relationships between these variables were then established through group discussions, aided by flow diagrams that were iteratively developed by the modeling team. In these diagrams, cost and benefit items were decomposed into their constituent parts, until members of the modeling team felt confident that all variables could be estimated. In addition, the group identified risks that might impact project outcomes and illustrated causal impact pathways in diagrams for each risk. The conceptual drawings were then translated into equations describing project outcomes and coded in R language (R Development Core Team, 2011). The resulting code is provided as supplementary material. Separate impact models were constructed for seven different stakeholders: (1) the donor, (2) the residents of Wajir, (3) the residents of Habaswein, (4) the residents of communities along the pipeline, (5) the water company that will run the water supply system, (6) downstream areas, and (7) upstream areas. All stakeholder outcomes were added up to produce a total estimate of the project's overall outcome prospects.
A list of all input variables to the model was assembled and annotated to facilitate the quantitative estimation process for the modeling team members. All team members were subjected to “calibration training” (Hubbard, 2014), a process that aims at enhancing the capacity of participants involved in model development to estimate probability distributions. The training involves instruction in techniques such as the exclusion of impossible values (Hubbard, 2014), the equivalent bet approach (Hubbard, 2014) and Klein's premortem (Klein, 2007). It also includes several iterations of estimating probability distributions for trivia questions, which aim at assessing the level of overconfidence or underconfidence displayed by participants. These errors of judgment manifest themselves in estimated ranges that are either too wide (underconfidence) or too narrow (overconfidence—the more common case), so that they do not accurately reflect the estimators' true level of confidence. Providing such feedback to estimators has been shown to greatly improve the accuracy of their estimates (Hubbard, 2014). Accuracy in this context should not be confused with precision. Instead of estimating narrow ranges or even single values for a variable (which would be very precise), the estimation process aims at obtaining an interval with a 90% chance of including the correct value. Where estimators have little knowledge about a variable, intervals should be wider than those provided by experts on the variable in question, but in both cases, estimators should be 90% certain that their intervals include the “correct” value.
Estimates of all variables were elicited from all experts, and five sets of estimates were returned. These were then consolidated by the main analyst into probability distributions that reflected the uncertainty of the entire team (Supplementary Table 3). Doing this required some additional discussion with experts about the ranges they chose, as well as some subjective credibility judgments by the analyst. For example, stakeholders from the target area were considered more credible sources of information for site-specific parameters, while hydrogeologists were given more credence for hydrological variables. A validation workshop was also convened with some of the experts in November 2013. Estimates on risks were collected for two scenarios:
Scenario 1: “All Risks”
In the “all risks” scenario, all risks to the project received full consideration. This can be considered as a forecast of intervention outcomes.
Scenario 2: “Cooperation”
In the “cooperation” scenario, political risks were assumed to have been overcome, and only biophysical and economic risks were considered. This scenario aimed at illustrating the general desirability of the pipeline project from the perspective of the different stakeholders and to inform stakeholders' expectations of project prospects.
Simulation Modeling
Once distributions had been defined for all uncertain variables (provided as Table 3 in the Supplementary Materials), these were used to run the decision model as a Monte Carlo simulation. In this simulation, the model was run 10,000 times for each scenario (“all risks” and “cooperation”), using random draws of all variables from the specified distributions. For some sets of variables that were likely to be correlated, values were drawn such that they met certain correlation requirements, expressed by prescribed coefficients of variation. These procedures were implemented in the MonteCaRlo package written in R (Luedeling, unpublished). This package produces estimates of the project's Net Present Value (NPV) for each stakeholder, which express the monetized net benefits of the project, while adjusting for time preference, i.e., the observation that most people assign lower values to benefits arising in the future than to immediate benefits. The analysis also conducts an assessment of the extent to which the various uncertainties affect the precision of project outcome estimates. In other words, we identified the key uncertainties in the decision-making process on the project. This was achieved through Partial Least Squares (PLS) regression (Wold, 1995; Wold et al., 2001; Luedeling and Gassner, 2012), which was used to correlate the various outcome variables (i.e., net present values for each stakeholder) to all input variables. A key output of the PLS procedure is the Variable-Importance-in-the-Projection (VIP) statistic, which provides a quantitative estimate of the degree to which uncertainty of each of the individual variables contributes to the uncertainty in the overall project outcome. A value of this statistic above 0.8 is considered to signify that the respective variable is important (Wold et al., 2001). The procedure also produces a coefficient indicating the direction of this effect, i.e., whether the variable is positively or negatively correlated with the outcome. We computed both statistics and combined them into variable-importance plots showing the VIP values and indicating the direction of the correlation by a color code. The main outputs of the modeling procedure are thus the projected outcome distributions for all stakeholders as well as the VIP plots.
When interpreting the VIP plots, it is important to remember that scores reflect the degree to which variation in the input variables is correlated with variation in the simulated outcomes. Variables with high variable importance scores are those variables that are most responsible for our inability to make precise forecasts of decision outcomes. In other words, if measurements can be undertaken to reduce uncertainty about some variables, they are most effective if they target variables with high variable importance scores, because these are the greatest sources of uncertainty about outcomes. It is also worth mentioning that even major risks to project success may not register high variable importance scores, if they are known with high precision.
Hydrogeological Modeling
The uncertainties related to the ability of the well-field to provide sustainable, high-quality water were studied in more detail in a hydrogeological assessment. For this, process-based hydrogeological models were combined with stochastic methods (Monte Carlo simulations) to calculate the expected drop in groundwater levels or drawdown (potentially leading to drying up of wells) and saline water intrusion, potentially leading to deteriorating water quality.
BAM International et al. (2012) estimated a total water demand of 6200 m3 day−1 for the Habaswein-Wajir Water Supply Project. The proposed abstraction rate from the Habaswein-Dilmanyale aquifer is 5945 m3 day−1. They recommended a total number of 12 wells, with a minimum spacing of 700 m and a projected safe yield of 24 m3 per hour per well. The model simulations were run for a well field of 12 wells, as well as 14 wells, to incorporate a scenario where the abstraction is distributed over a larger number of wells.
Wells Falling Dry
The widely used three-dimensional finite-difference groundwater model MODFLOW-2005 (Harbaugh, 2005) was applied to adequately represent the complexity of the aquifer. To determine the specific drawdown at the location of the wells, the MODFLOW model was extended with an analytical approach, using the Theis equation (Theis, 1935), which describes transient flow of water to a single pumping well in a confined aquifer. We used the principle of superposition to calculate the combined effect of multiple wells, and we introduced image wells to incorporate the influence of aquifer boundaries (Reilly et al., 1984). The Merti aquifer, which is mainly confined (Mumma et al., 2011), matches the conditions for application of the analytical approach described by Kruseman and de Ridder (1990). Conceptualizing the aquifer as homogenous is justified, since the effect of variation in aquifer properties is addressed by the Monte Carlo approach.
To evaluate whether calculated drawdown leads to drying of wells, we determined a drawdown threshold. At the time of writing, a well field design was not yet available. Therefore, the threshold was based on common well design limitations, aquifer characteristics, recommendations from BAM International et al. (2012) and the consideration that in the Merti Aquifer the static water level in wells is generally several meters above the top of the aquifer. Based on these figures, a threshold value for drawdown of 10–12 m was selected. With a Monte Carlo approach an ensemble of simulations was performed to establish the uncertainty range of the groundwater drawdown exceeding the threshold value. In these simulations the relevant aquifer parameters and geometry (i.e., conductivity, vertical anisotropy, storativity, effective porosity and aquifer thickness) were varied randomly within their probability distributions. A summary of the aquifer properties used in the simulation is given in the supplementary materials.
Salinity of the Abstracted Water
Groundwater abstraction from aquifers containing saline water can lead to deteriorating quality of the water supply. The most relevant process in this case is upconing, the upward movement of saline water (with a higher density) from deeper layers as a result of reduced pressure around the well. Given the low flow velocity of the groundwater (according to BAM International et al., 2012 in the order of several meters per year) and the distance to the saline fringes of the aquifer (more than 10 km), lateral intrusion of saline water into the well-field was considered unlikely within a 30-year time frame.
To establish the chance of the upward movement of saline water resulting in pumping of saline water, we extended the MODFLOW model with the SWI2 package, which allows simulation of a three-dimensional vertically integrated variable-density groundwater flow (Bakker et al., 2013). The SWI2 package incorporates density effects into MODFLOW-2005, without the need to solve a separate advective-dispersive transport equation. Furthermore, aquifers can be represented by a limited number of modeled layers. This results in substantial model run-time savings, making the SWI2 package very suitable for stochastic modeling, in comparison to more computationally intensive approaches, such as SEAWAT (Langevin et al., 2008).
A limitation of the numerical approach used in the SWI2 package is that it does not account for diffusion and dispersion (i.e., it takes a sharp-interface approach). These processes can lead to the formation of a transition zone along the fresh-saline groundwater interface (Paster and Dagan, 2008). The width of such a zone increases during the upconing process and can lead to increased salinity of the abstracted water, before the initial interface between fresh and saline water reaches the well (Diersch et al., 1984). The reported increase of salinity in wells over time in the Merti Aquifer indicates that such a transition zone may be present underneath the freshwater aquifer. For practical applications it is customary to limit the pumping rate, when sharp-interface calculations are used for design purposes (Diersch et al., 1984). A safety factor can be introduced to ensure that salinity of the pumped water does not increase. Following the analytical approach reviewed by Diersch et al. (1984), a safety factor of 0.4–0.6 was introduced to determine the threshold value for the upward movement of the fresh-saline water interface. Increased salinity in the abstracted water was assumed to occur when the fresh-saline interface has risen to 40–60% of the original depth below the well-field.
The probability of 30 years of pumping leading to increased salinity was determined by using the model described above, combined with Monte Carlo simulations. The mixing zone was simulated by introducing separate brackish and saline layers into the model. The depth of the saline water below the top of the aquifer, as well as the density of saline water, was varied in the Monte Carlo simulations, in addition to relevant aquifer properties and geometry. Aquifer properties used in the simulations are given in the supplementary materials (Supplementary Table 1).
Results
The Decision Model
The modeling team members identified 14 separate types of benefits, 10 types of costs and 15 risk factors that they deemed important enough for inclusion in the model (Table 1). Risks were classified into five categories: some risk factors, such as the risk of political interference, could prevent the pipeline from being built, in which case the project would never produce any benefits. Project cancellation could also happen later, e.g., if wells run dry or water quality declines due to upconing of saline water. In these cases, benefit accrual was assumed to end as soon as the respective events occur. Benefits could also fail in some years only, e.g., if regional conflict disrupts operation of the pipeline temporarily. Such risks were captured by setting benefits to zero for individual years but allowing them to resume in the following year. In addition to risks that lead to permanent or temporary failure of the project to deliver benefits, there were also risk factors that merely reduced benefits. Such reductions could occur permanently, starting from the beginning of the project, if the water supply system is poorly designed. For other factors, reduction in benefits would vary from year to year, e.g., for poor maintenance and operation or illegal abstractions. A diagram showing how risks were considered is provided in the supplementary materials (Figure S3). The model had 102 variables for the “all risks” scenario, and 99 for the “cooperation” scenario (including risk, cost and benefit factors, as well as some technical model parameters).
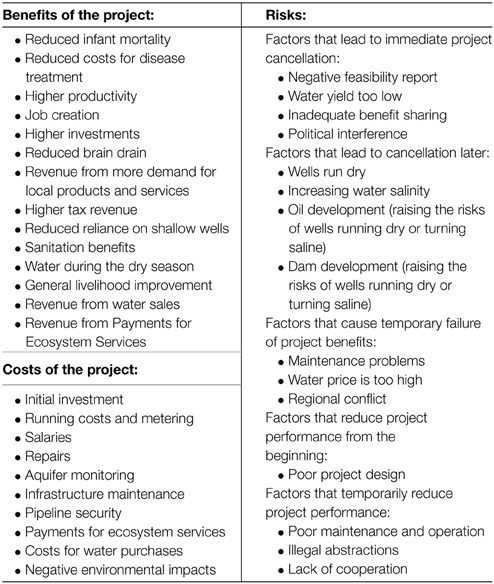
Table 1. Relevant benefits, costs and risks of the pipeline project, as identified by members of the modeling team.
The general structure of the decision model is shown in Figure 3. It consists of all costs and benefits accruing to the various stakeholders and considers the impact of the risk factors on these costs and benefits. More detailed illustrations of model components that address the different items shown in gray in Figure 3 are provided in the supplementary materials (Figures S1–S3). The programming code in the supplementary materials (Section R Code used to run analyses) provides all equations of the model.
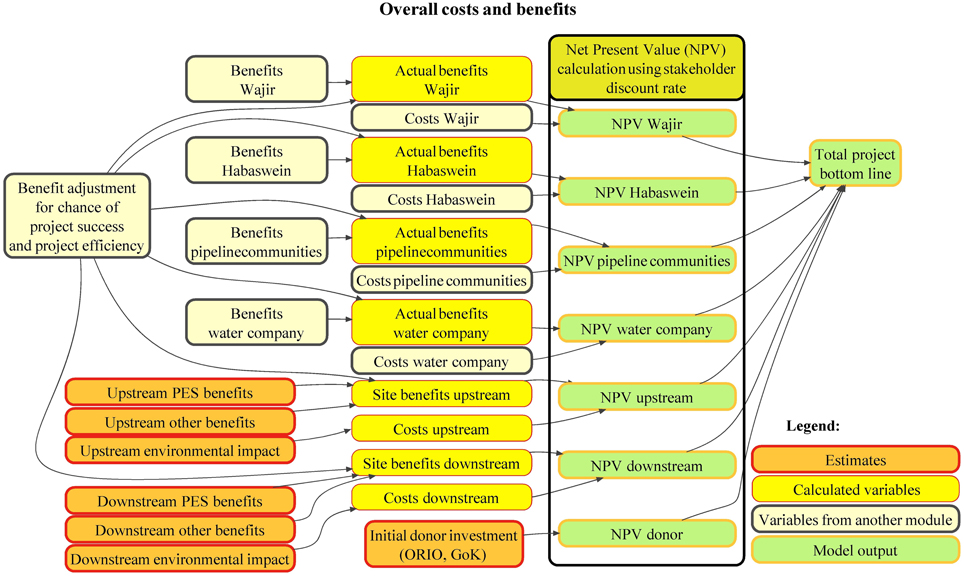
Figure 3. Overall structure of the decision model.
Projected Project Outcomes
Based on the 10,000 model runs for each of the two scenarios, probability distributions of likely outcomes for all stakeholders could be estimated (Figure 4). Members of the modeling team expected that water from the pipeline would reach between 80,000 and 300,000 people in Wajir, 20,000–100,000 in Habaswein, and 1500–50,000 along the pipeline (Supplementary Table 3). For all stakeholders, expected net present values varied widely, and in almost all cases, positive and negative outcomes were predicted, in both scenarios. In the “all risks” scenario (top panel of Figure 4), chances were high (41.7%) that the pipeline would fail to materialize. Logically, financial outcomes for the donor consortium were negative for both scenarios, because the donors are not expected to benefit financially. They may of course still be interested in supporting the project, because of their interest in benefits to their target population. That such benefits would arise is not clear, however. In particular for the residents of Wajir, net benefits are not guaranteed, and negative outcomes emerged more frequently (34.0% of model runs) from the model runs than positive outcomes (24.3%; all remaining model runs produced neither net benefits nor net returns for Wajir, because the project failed). For Habaswein, the general prospects were more positive, with 51.3% positive outcomes and a 7.0% chance of net losses. Communities along the pipeline were also more likely to gain (43.0%) than to lose (15.3%). Effects on downstream and upstream areas were relatively small, but predominantly negative for downstream areas (95% chance of losses up to 80.4 million USD, and only a 2.9% chance of net gains up to 0.4 million USD), and balanced between positive and negative outcomes for upstream areas (49.7% chance of losses up to 0.5 million USD and 48.4% chance of gains up to 4.2 million USD). The water company faced substantial risks in the “all risks” scenario. Net losses emerged from model runs slightly more frequently (51.4%) than net gains (48.6%), though plausible gains were higher than plausible losses (as judged by the 10th and 90th percentiles, respectively, which were at a loss of 109.3 million USD and a gain of 447.7 million USD). Overall, negative outcomes from the project were slightly more probable (55.9%) than positive outcomes (44.1%), with total net present values likely between −192.3 and 302.2 million USD (the 10th and 90th percentiles of the distribution).
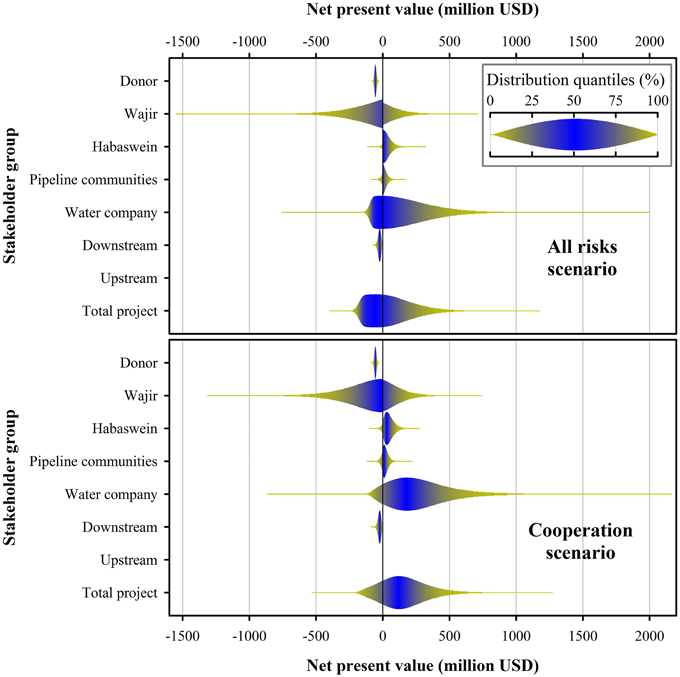
Figure 4. Projected probability distribution of net present value for all stakeholders and the project as a whole, considering a scenario that includes all project risks (top) and a scenario in which all political resistance has been overcome (bottom).
Assuming that political resistance can be overcome (the “cooperation” scenario) changed outcomes toward more positive prospects for most stakeholders (bottom panel of Figure 4). While the donor's outlook did not change, the chances of net gains for Habaswein, communities along the pipeline and the water company rose to 83.0, 70.3, and 79.0%, respectively. While a sizeable chance of net losses (21.0%) remained for the water company, there was a 75% chance of net gains of more than 26.3 million USD (and reaching 564.7 million USD at the 90th percentile). For the residents of Wajir, however, the chance of net losses from the project increased to 53.6%. These losses could be substantial, with a 25% chance of exceeding 176.6 million USD and a 10% chance of surpassing 348.2 million USD. Changes for downstream and upstream areas were relatively small. The overall outcome of the project looked more positive in the “cooperation” scenario, although a 25.9% chance of negative NPV remained. The most likely outcomes were between -115.9 million USD (the 10th percentile) and 404.8 million USD (the 90th percentile). Overall, simulation results showed that the potential net benefits, or net costs, of the water project could amount to a multiple of the sum that is to be invested.
Key Uncertainties
Analysis of the VIP scores revealed that the most influential variable introducing uncertainty in overall project outcome was the value attached to an additional surviving infant. This was the case for both the “all risks” scenario (Figure 5) and the “cooperation” scenario (Figure 6). VIP scores for this variable were considerably higher than for all other variables, flagging this as a key issue for further exploration. In both scenarios, the second-most important uncertainty was the risk of poor project design, followed by the number of additional surviving infants in Wajir, the largest community involved in the project. In the “all risks” scenario, political risks emerged as the next important issue, with the risks of political interference and inadequate benefit sharing also assigned high VIP scores. These risks were correlated with the degree to which Payments for Ecosystem Services (PES) are used to overcome political resistance, hence the PES rate was also found to correlate strongly with project outcomes. PES are transfer payments from the water users (i.e., Wajir or the water company) to stakeholders in upstream areas (i.e., upstream communities and Habaswein) as compensation for foregone opportunities or additional risks related to water abstraction. PES could also be used to compensate stakeholders downstream from Habaswein, but this was considered implausible by all experts. Other uncertainties of importance were again related to benefits from the project, namely the value of a disease treatment, the number of disease treatments that cleaner water would render unnecessary at Wajir and the number of additional surviving infants at Habaswein (and also for communities along the pipeline in the “cooperation” scenario). The discount rate used for the water company, and for the “cooperation” scenario also for the residents of Wajir, also featured in the list of important uncertainties. Further important uncertainties common to both scenarios were the risk of losses due to illegal abstractions, the risk of poor maintenance and operation, and salaries paid by the water company. In the “all risks” scenario, the initial investment by the donor, downstream environmental impacts and running costs of the water company also emerged as important uncertainties. Comparing the two scenarios showed that most of the key uncertainties were similar, even though projected outcome distributions differed substantially (insets in Figures 5, 6). Adding risks of political resistance to the projections strongly reduced the chance of positive project outcomes.
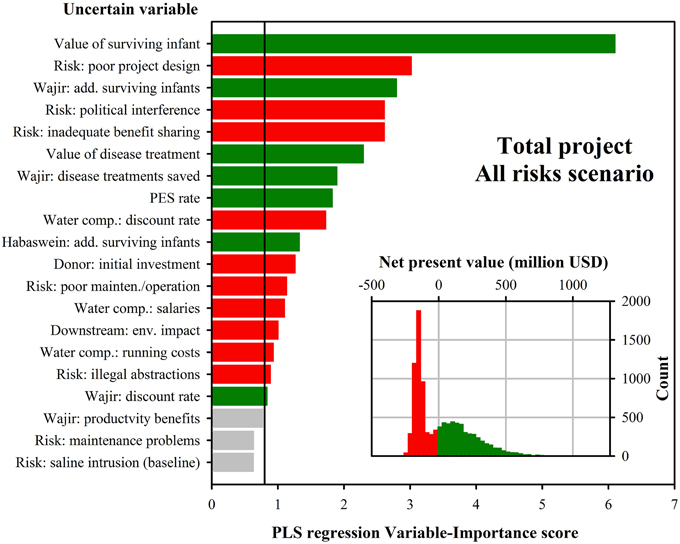
Figure 5. Key sources of uncertainty in projecting outcomes of the overall project for the “all risks” scenario, as identified by Partial Least Squares (PLS) regression. Bars show the Variable-Importance-in-the-Projection statistic, with high values indicating that uncertainty about the variable is a major source of uncertainty in model outputs. Green bars in the VIP plot indicate that the variable is positively correlated to outcomes, while red bars signify a negative correlation. The inset shows projected project outcomes as the distribution of net present value among 10,000 model runs of a Monte Carlo simulation. In this plot, red bars indicate negative values, and green bars signify positive outcomes.
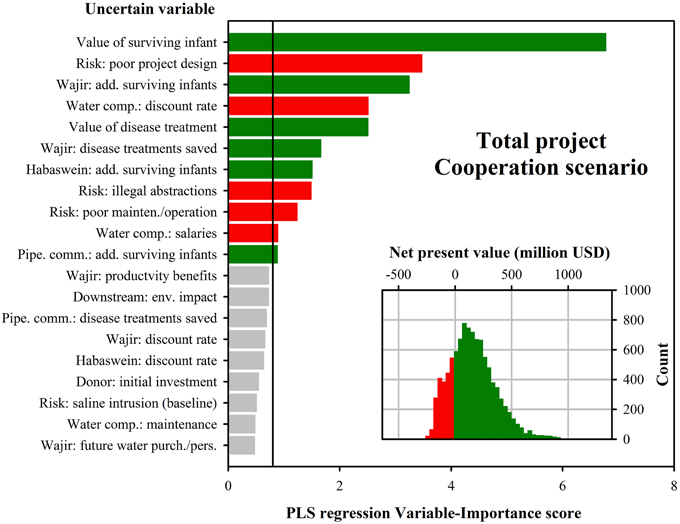
Figure 6. Key sources of uncertainty in projecting outcomes of the overall project for the “cooperation” scenario, as identified by Partial Least Squares (PLS) regression. For a detailed description of the plots, see legend to Figure 5.
Besides prospects for the entire project, we also evaluated likely outcomes for different stakeholders. For all major stakeholders, political risks, in particular the risks of political interference and inadequate benefit sharing, featured strongly among the key uncertainties. When assuming that these risks can be overcome, prospects for the residents of Wajir depended primarily on the economics of water sales, with future water purchases per person and future water price emerging as key uncertainties (Figure 7). The values and numbers of additional surviving infants and disease treatments came next in term of importance, followed by the water revenue trend for the water company, which closely reflects water price developments, and the risk of losses due to poor project design.
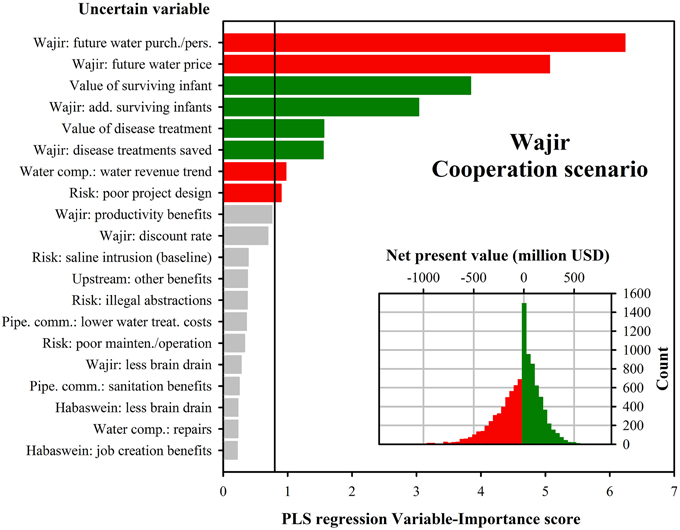
Figure 7. Key sources of uncertainty in projecting outcomes for the residents of Wajir for the “cooperation” scenario, as identified by Partial Least Squares (PLS) regression. For a detailed description of the plots, see legend to Figure 5.
Key uncertainties for the residents of Habaswein were the value and number of additional surviving infants, followed by the amount of water purchased per person in the future (Figure 8). Number and value of disease treatments rendered unnecessary, as well as the discount rate applied for the residents of Habaswein followed in terms of importance. The risk of losses due to poor project design, the future water price and the number of water users were also identified as key uncertainties.
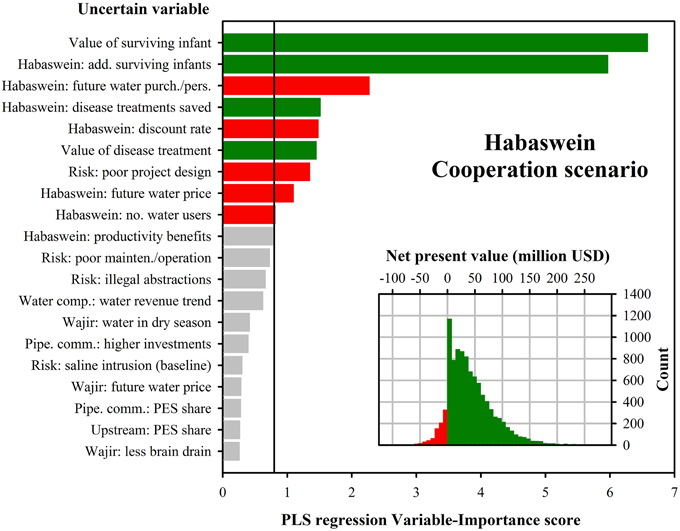
Figure 8. Key sources of uncertainty in projecting outcomes for the residents of Habaswein for the “cooperation” scenario, as identified by Partial Least Squares (PLS) regression. For a details description of the plots, see legend to Figure 5.
For the water company, key uncertainties revolved around the core of their business operations, placing particular importance on the future amount of water purchased per person in Wajir, as well as the future water price there (Figure 9). The discount rate applied by the company was also a major source of outcome uncertainty. Further uncertainties of importance were the risk of poor project design, the water revenue trend, water purchases per person in Habaswein and salaries paid by the water company. The risk of saline intrusion into the aquifer and losses from illegal abstractions were also key uncertainties. It is important to note that while certain variables like the water price and the amount of water purchased per person emerged as key uncertainties for both the water company and residents of Wajir, Habaswein and the communities along the pipeline, correlations between these variables and project outcomes were of opposite signs. While, e.g., a high water price was related to positive project outcomes for the water company, it led to negative outcomes for those purchasing the water.
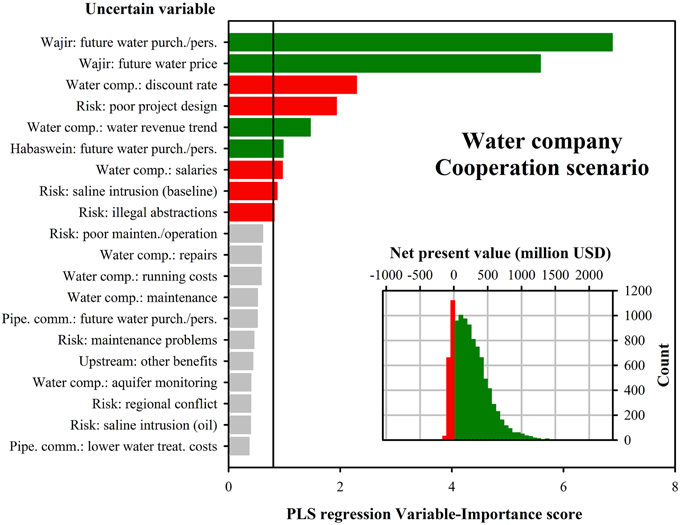
Figure 9. Key sources of uncertainty in projecting outcomes for the water company for the “cooperation” scenario, as identified by Partial Least Squares (PLS) regression. For a details description of the plots, see legend to Figure 5.
Hydrogeological Modeling
Based on Monte Carlo simulations using the Theis equation, plausible drawdowns after a 30-year period ranged from 5.4 m (10th percentile) to 13.7 m (90th percentile) with a median drawdown of 8.0 m in a well field using 12 wells (Figures 10A,B). In a well field using 14 wells, drawdown ranged from 5.2 m (10th percentile) to 13.3 m (90th percentile) with a median of 7.8 m. The difference between the 12 and 14 well design was relatively small (Figures 10C,D). Due to the small distance between wells, the total drawdown at a well was mainly caused by the combined effect of surrounding wells. From the probability-based calculations we concluded that the chance of wells running dry after 30 years was 15–30%, assuming that 10–12 m drawdown would cause wells to fall dry. The chance of failure due to deteriorating water quality was 25–55%, depending on the safety factor for critical uprising (0.4–0.6) and the number of wells (12–14).
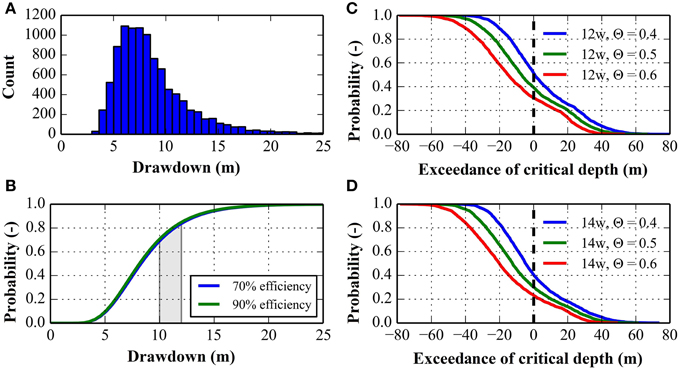
Figure 10. Results of the hydrogeological assessment. (A) Histogram of calculated drawdown values, (B) cumulative probability distribution of calculated drawdown, (C) cumulative probability distribution of the fresh-saline water interface exceeding the critical depth in a field of 12 wells, using different safety factors (Θ)—positive values represent exceedance of the threshold, (D) cumulative probability distribution of the fresh-saline water interface exceeding the critical depth in a field of 14 wells.
Discussion
The Winners and the Losers
Contrary to the expectations of most workshop attendees, the greatest net losses were likely to accrue at Wajir, while residents of Habaswein appeared likely to gain. Stakeholders from Habaswein especially had previously voiced concerns about the proposed abstractions, which they felt could put their currently reliable water supply at risk. Residents of Wajir appeared to be more positively disposed toward the project, even though nuanced views were also recorded there (Ogalleh, 2015). Among the projected winners were also the communities along the pipeline, the water company and upstream areas, while downstream regions and—unsurprisingly—the donor were among the likely losers. The distribution of projected outcomes of the overall project looked substantially more favorable in the “cooperation” scenario than in the “all risks” scenario, with only Wajir having greater losses when political resistance could be overcome. This shows the benefits of including all stakeholders in project planning and ensuring fair benefit sharing among affected parties, which is likely to dissipate resistance against the intervention. Such resistance was very prevalent at the time of the study, but it became clear from site interviews that this was often based on very limited information (Ogalleh, 2015). Measures to build awareness and disseminate information might help overcome this situation. The predominantly negative outcomes for Wajir were an unexpected finding that is explained to a large degree by the expectation that residents there will have to pay higher prices for their future water supply than they are paying at present. This may lead to financial losses for many residents. It should be considered, however, that the current water supply system is unlikely to be sustainable in the long run because of rising population and increasing contamination of the shallow aquifer. Continuation of these trends may even lead to disease epidemics or famines, which can only be avoided if new sources of freshwater are secured. Preserving the status quo may therefore not be a viable option. In hindsight, it would have been prudent for the model building team to explicitly include into the model the risk of crises related to food security or public health in the event that no additional water sources become available.
Key Uncertainties and Implications for Measurements and Project Design
For almost all stakeholders, it remained unclear whether they would gain or lose from a pipeline. This was due to a number of key uncertainties that emerged from the variable importance calculations. One set of uncertainties concerned benefits expected to arise from the project. Probably the most controversial among these are related to reduced infant mortality due to the provision of cleaner water. At present, official statistics on infant mortality in Wajir list 9.8% as the countywide figure (www.wajirgovernment.com). Better sanitation and cleaner water would almost certainly reduce this number. While uncertainty about the number of additional infants that would survive because of the project could probably be reduced through some targeted study, the value judgment of what expenses are justified for saving the life of an infant is very controversial. A number of studies have used human behavior to derive such values, basing estimates of the value of a life on people's willingness to invest in measures to reduce their chance of death (Dardis, 1980; Hubbard, 2014). Premiums paid to workers in risky professions have also been used (Viscusi and Aldy, 2003). In most cases, such studies result in estimates in the millions of USD. Applying these techniques in Wajir, however, is quite difficult because the desire for a long life that many people may have is not backed by money, i.e., people do not have resources to invest in greater safety. Focusing specifically on Africa, Deaton et al. (2009) used a number of techniques and lines of evidence to argue that the perceived value of a life in Africa is very low, although they shy away from providing concrete numbers. It is also worth keeping in mind that the uncertain variable in question refers to the valuation of a life by the decision maker, rather than the people affected. The value a decision maker attaches to a human life must be decided on in the context of scarce resources and competing objectives. Many governments have undergone a formal process to define the value of a life, leading U.S. Agencies to work with figures between 2 and 20 million USD (Hubbard, 2014). Multiplying values of a Disability-Adjusted Life Year (DALY) defined in the Copenhagen Consensus, which aimed at evaluating the cost of terrorism (Sandler et al., 2008), by the average life expectancy in Kenya results in values between approximately 60,000 and 300,000 USD for the value of a statistical life. Even such values seemed high to members of the modeling team, because, even though many premature deaths in northeastern Kenya could be avoided with relatively little effort, this effort is often not made, because funds are lacking or needed elsewhere. The resulting range of estimates (200–100,000 USD) is thus considerably lower than what has been used in other contexts. This will make further reduction of this range difficult, unless it could rely on a formal definition of the value of a life by the decision-makers themselves.
Other uncertain variables are more amenable to reductions of uncertainty. The value of a disease treatment, for example, should be relatively easy to measure, and epidemiological studies should be able to provide good estimates of the number of treatments that would no longer be necessary with a reliable clean water supply. It should also be possible to reduce uncertainty about future water prices and the number of water users, which could be derived from a comprehensive financial feasibility study undertaken for the water company. Such a study has not yet been done, explaining the prominence of items related to water business economics among the uncertain variables. Risk factors surrounded by important uncertainties were primarily the benefit losses due to poor project design and the risk of political interference. These risks could be measured by investigating in detail the project plans and gaining clarity on the stance different stakeholders have taken toward the project, but they can also be influenced by improvements to the proposed intervention. Adequate investment in project planning, including thorough risk assessment and measures to safeguard against risks wherever possible would improve likely project outcomes. Similarly, a more inclusive process during the planning stage, which considers the interests of all stakeholder groups and ensures fair sharing of benefits, could help overcome political resistance. Even though such measures would naturally require additional investments during the planning phase, they would likely prove cost-effective given the potential of these risk factors to undermine project success.
Hydrogeology
The initial intuitive stance of stakeholders for or against the project appeared to be determined mainly by stakeholders' perceptions of hydrogeological risks. Wajir looked to gain water, hence supported the project, while Habaswein would be giving up part of “their” water, making them take an opposing stance. While such a focus on water is understandable in the arid northeast of Kenya, stakeholders seemed to overlook other important issues, such as the viability for the water company of the business case for selling piped water or the risk of political interference. These emerged as the greater risks, and also as those whose magnitudes were least well known. This is not to say that hydrogeological risks were not important. In fact, there was a substantial chance of saline water upconing (25–55%), and also the chance of wells running dry was not negligible (15–30%), as indicated by the probabilistic simulation over the entire 30-year time frame. The reason why hydrogeological risks did not feature strongly in the important variable lists for any stakeholders (except the water company in the “cooperation” scenario) was that a small body of research already existed on this topic, and more work was undertaken in the course of the present study. These previous studies provided greater certainty about project hydrogeology than about many other project aspects that had not been studied. Uncertainty about aquifer properties was still high, but much lower than for some of the other variables, for which virtually no data was available.
Negative hydrological effects could probably be overcome by drilling additional wells and risks could be mitigated by choosing an appropriate well field design, the costs of which would be justified in light of the large potential benefits of the project. Measurements about the thickness of the freshwater layer which would allow to more precisely assess the risk of upconing saline water and careful long-term monitoring of the aquifer are also absolutely recommended. It should be noted that there is currently no basis for ruling out adverse consequences for the long-term water supply stability at Habaswein. We therefore recommend more specific research on this subject.
Regarding the hydrogeological modeling undertaken in the present study, the use of simplified stochastic-deterministic models proved a practical way to assess the risks as a result of hydrogeological limitations in a data-scarce environment. Given current uncertainties about aquifer characteristics, uncertainty in the estimated risks was relatively low. These estimates highlighted a mismatch between stakeholder perception and model outputs: the risk of drying wells was the stakeholders' main hydrogeological concern, while the model showed a higher risk of upconing and deteriorating water quality. The probability-based approach greatly enhanced understanding of the aquifer's response to abstraction. The relative importance of parameters can easily be evaluated for different parameter ranges, which can help in planning field-research and support the technical design, even in data-scarce environments. Such considerations revealed a higher annual probability for the risk of saline water upconing (1.0–2.5% per year) than for wells running dry (0.5–1.2%). While the annual risks may seem low, they correspond to risks of 25–55% and 15–30% over the 30 year time frame considered by the model.
Outcomes of the Decision Modeling Process
The decision modeling process clearly enhanced stakeholder understanding of the proposed project, as stated by several workshop participants. Regardless of the results from the model runs, delineating the project's impact pathway for various stakeholders, reflecting on the risks that the project faces, and making estimates for uncertain variables improved the team members' capacity to evaluate the pipeline plans. Attendees of the larger stakeholder workshops, including an outreach workshop in Isiolo in September 2014, also gained such understanding. Although this did not go quite as far as for those directly involved in the model building, several workshop participants notably changed their attitudes toward the project. One senior water management professional stated during the final workshop that exposure to model results had made him more skeptical toward the project. On the other hand, an email survey of workshop attendees revealed that the views of several people became more favorable toward the pipeline. An evaluation survey of the local stakeholders in a recent workshop (Ogalleh, 2015) also found that exposure to decision analysis results made workshop participants more favorable toward the project. When informed about identified risks to the project during the workshop, participants also advised to explore alternative water supply options for Wajir, which might be less risky than the pipeline from Habaswein. Whether these alternatives, which included a greater focus on rainwater harvesting and tapping another aquifer to the north, are feasible is difficult to judge without further investigation, but we were encouraged by the reemergence of a debate about solutions to Wajir's water problems, which might eventually put more options on the table. We are thus confident that our approach has enriched the project planning process and raised the chances of positive outcomes of whichever project design is ultimately chosen.
Methodological Limitations
There is no guarantee that the model accurately captured all important aspects of the project. The development of the model was driven by stakeholders, and most of them had had no formal training in anticipating the impacts of development interventions. Nevertheless, the model that emerged appeared quite comprehensive and included variables that are easily overlooked when technical experts are charged with model development. Examples of such variables are the risk of political interference or the benefits arising from higher demand for local services. Project-related studies that had been commissioned before our modeling activities had focused exclusively on hydrogeological risks. They had not paid much attention to project economics or environmental, social and health impacts of the project, which our results highlighted as priorities. We are not suggesting that a stakeholder-driven modeling approach can replace technical studies, but it can complement them and provide guidance on what types of technical studies are most urgently needed.
Another concern about the approach was the ability of stakeholders to accurately estimate probability distributions for uncertain variables. While all those who provided estimates received calibration training, many variables remained difficult to fathom. Estimators were encouraged to provide wide ranges whenever they were highly uncertain, but they may still have been wrong in some cases. For some variables, estimated ranges by different experts did not overlap, which means that at least one of the experts was wrong. We are confident that the consolidated estimates that were distilled from the different expert assessments were accurate in most cases, but with the large number of uncertain variables in the model (102 for the “all risks” scenario and 99 for the “cooperation” scenario), chances are high that some of them may have been wrong. It is difficult to evaluate the implications of such erroneous estimates.
The difficulty of evaluating the implications of potentially missing variables and inaccurate estimates partly arises from the challenge of validating our model. Our decision model concerns a situation that has not arisen yet, so that no data for validation is available. But even in the future, after project impacts have unfolded, validation will remain difficult because of the probabilistic nature of our model outputs. There is a wide range of outcomes that could be realized without falsifying our model. It is of course possible to determine in retrospect how probable a realized project outcome would have been according to ex-ante projections, but this can only give a weak indication of model validity, and it is only available after the project has been implemented. In this context, however, it is important to recall the objective of the modeling process: to improve the decision-making process over what is currently practiced. At present, development decisions are often largely based on “gut feelings” or use of data that addresses only part of the decision problem. In contrast, we followed a structured analysis process, which helped stakeholders and decision-makers make their expectations and assumptions about the project's impact pathway explicit. Using such a model should thus constitute an improvement over current processes, even though—as every model—it remains an imperfect and possibly incomplete reflection of reality.
Implications for Development Planning
Many development decisions are made without structured ex-ante analysis of decision outcomes. We are therefore convinced that the methods used in this study, or similar approaches, can contribute greatly to improving decision-making processes and raising the returns on investments in development projects. Even with such methods, of course, making decisions in uncertain and data-scarce environments will remain risky and difficult. But holistic impact projections for the various decision alternatives can improve the robustness and transparency of decision-making processes. It can make use of both available data and expert knowledge, and it can provide guidance on what measurements are most urgently needed for improving a particular decision. The approach used here is a structured and unbiased method to prioritize those variables most urgently requiring additional measurement. Not all variables will likely be amenable to reduction of uncertainty, and other arguments such as feasibility of further measurement will often guide the selection of candidate variables for further research. However, initiating this process with a structured and unbiased approach opens opportunities for spending resources on variables that matter most. While more work undoubtedly needs to be done to adjust decision analysis methods to the context of multi-stakeholder decisions in the developing world, these methods open opportunities for the kind of holistic decision-support analysis that is needed for enhancing the outcomes of development initiatives.
Conclusions
The town of Wajir needs to improve its water supply to ensure acceptable standards of living for its growing number of residents. Results from our study indicate that better water will not be free, and may not even produce net benefits, but since the current situation may not remain viable in the future, there is little alternative to innovation in the water sector. In this context, the proposed project may be acceptable to the county government of Wajir, even if it leads to additional expenses for the residents of the county's capital.
Regardless of these considerations, certain measurements would increase certainty about project outcomes. The financial viability of operating the water supply system should be clarified, because it is essential for the sustainability of the investment. Information on project benefits should also be collected, including better appraisal of the number of additional infants that can be expected to survive and reductions in disease treatment costs due to better water quality. Regarding technical aspects of the project, careful project design emerged as a key priority, along with the necessity to implement a fair benefit sharing mechanism that ensures that all stakeholders receive benefits and reduces the risk of political interference. Our results indicate that this should be possible, because plausible negative impacts in downstream and upstream areas, in Habaswein and the communities along the pipeline are relatively small compared to the profits that could be reaped from running the system. Payments for Ecosystem Services and financial mechanisms to compensate those who expect net losses from the project may thus be a promising approach for breaking the resistance of important stakeholders. Investing in such measures may well pay off, since it greatly raises the chance of positive project outcomes. Regarding hydrogeological aspects of the project, a few deep test drills to determine the thickness of the freshwater aquifer should be undertaken before the project is approved, and well design should be optimized to reduce the risk of both saline water upconing and wells running dry. Lastly, it will be critical to carefully monitor the aquifer, so that adverse developments can be detected early and undesirable processes halted before they become irreversible.
Overall, the participatory modeling process and the probabilistic model runs based on uncertain information produced very encouraging results. Stakeholders took the study results very seriously and many changed their expectations about project outcomes and desirable measurements to be taken. This provided evidence that inclusion of decision-makers and other stakeholders in the research enhances the likelihood that study results will be given full consideration in development processes. It also showed that even with imperfect knowledge about a system, it is possible to provide useful guidance for project development, if uncertainties are fully considered in project impact projections. We conclude that the Applied Information Economics approach can effectively be applied beyond single-stakeholder business decisions. It can make a valuable contribution to supporting risky decisions in development, in the face of imperfect information and considering the potentially conflicting interests of multiple stakeholders.
Conflict of Interest Statement
The authors declare that the research was conducted in the absence of any commercial or financial relationships that could be construed as a potential conflict of interest.
Acknowledgments
We acknowledge funding by UKAID (NERC UPGRO grant no NE/L00206X/1: Assessing Risks of Investment in Groundwater Resources in Sub-Saharan Africa) and support from the CGIAR Research Program on Water Land and Ecosystems (WLE). Furthermore, we are grateful to all members of the modeling team and to all participants of our workshops for invaluable insights into the Habaswein-Wajir Water Supply Project. We thank Lieselotte Tolk, Katherine Homewood, Alex Oduor, Evanson Njuguna, Benson Macharia and Elsabijn Koelman for their contribution during manuscript preparation. We are also grateful to Douglas Hubbard and Matthew Millar of Hubbard Decision Research for guidance on decision modeling.
Supplementary Material
The Supplementary Material for this article can be found online at: http://www.frontiersin.org/journal/10.3389/fenvs.2015.00016/abstract
References
Apaydın, A. (2012). Dual impact on the groundwater aquifer in the Kazan Plain (Ankara, Turkey): sand–gravel mining and over-abstraction. Environ. Earth Sci. 65, 241–255. doi: 10.1007/s12665-011-1087-8
Bakker, M., Schaars, F., Hughes, J. D., Langevin, C. D., and Dausman, A. M. (2013). Documentation of the Seawater Intrusion (SWI2) Package for, MODFLOW. Reston, VA: USGS.
BAM International, G. I., BAM, Balteau, and Vitens Evides, International. (2012). Development Phase Wajir/Habaswein Water Supply Project: Hydrological Report (Revision 1). Ministry Of State For Development Of Northern Kenya And Other Arid Lands, The Hague.
Bosworth, W., and Morley, C. K. (1994). Structural and stratigraphic evolution of the Anza rift, Kenya. Tectonophysics 236, 93–115.
Clapp, A., DauSchmidt, N., Millar, M., Hubbard, D., and Shepherd, K. (2013). A Survey and Analysis of the Data Requirements for Stakeholders in African Agriculture. World Agroforestry Centre (ICRAF), Nairobi.
Dardis, R. (1980). The value of a life: new evidence from the marketplace. Am. Econ. Rev. 70, 1077–1082.
Deaton, A., Fortson, J., and Tortora, R. (2009). Life (Evaluation), HIV/AIDS, and Death in Africa. Cambridge, MA: National Bureau of Economic Research.
De Leeuw, J., Said, M. Y., Kifugo, S., Musyimi, Z., Mutiga, J. K., and Peden, D. (2012). Benefits of riverine water discharge into the Lorian Swamp, Kenya. Water 4, 1009–1024. doi: 10.3390/w4041009
Diersch, H.-J., Prochnow, D., and Thiele, M. (1984). Finite-element analysis of dispersion-affected saltwater upconing below a pumping well. Appl. Math. Model. 8, 305–312.
GIBB Africa Ltd. (2004). UNICEF Kenya Country Office - Study of the Merti Aquifer - Technical Report ISsue 2.0.
Harbaugh, A. W. (2005). MODFLOW-2005, the US Geological Survey Modular Ground-Water Model: The Ground-Water Flow Process. Reston, VA: US Department of the Interior, US Geological Survey.
Hubbard, D. W. (2014). How to Measure Anything - Finding the Value of Intangibles in Business. Hoboken, NJ: Wiley and Sons.
Jay, S., Jones, C., Slinn, P., and Wood, C. (2007). Environmental impact assessment: retrospect and prospect. Environ. Impact Assess. Rev. 27, 287–300. doi: 10.1016/j.eiar.2006.12.001
Klein, G. (2007). Performing a project premortem. Harv. Bus. Rev. 85, 18. Available online at: https://hbr.org/2007/09/performing-a-project-premortem
Kramon, E., and Posner, D. N. (2011). Kenya's new constitution. J. Democracy 22, 89–103. doi: 10.1353/jod.2011.0026
Kruseman, G. P., and de Ridder, N. A. (1990). Analysis and Evaluation of Pumping Test Data. Wageningen: International Institute for Land Reclamation and Improvement Publication 47.
Langevin, C., Thorne Jr, D., Dausman, A., Sukop, M., and Guo, W. (2008). SEAWAT Version 4: A Computer Program for Simulation of Multi-Species Solute and Heat Transport. Reston, VA: US Geological Survey.
Luedeling, E., and Gassner, A. (2012). Partial least squares regression for analyzing walnut phenology in California. Agric. Forest Meteorol. 158, 43–52. doi: 10.1016/j.agrformet.2011.10.020
Mumma, A., Lane, M., Kairu, E., Tuinhof, A., and Hirji, R. (2011). Kenya: Groundwater Governance Case Study. Washington, DC: The World Bank Group. Available online at: http://documents.worldbank.org/curated/en/2011/06/16583819/kenya-groundwater-governance-case-study
Ogalleh, S. (2015). ARIGA Social Survey Report. Centre for Training and Integrated Research in ASAL Development (CETRAD), Nanyuki.
Oord, A. L. (2011). Droogte in de Hoorn van Afrika Ontwikkeling van de Merti aquifer in noordoost Kenia. Stromingen 16, 5–13. Available online at: http://edepot.wur.nl/314538
Osman, A. D. (2012). Groundwater Quality in Wajir (Kenya) Shallow Aquifer: An Examination of the Association Between Water Quality and Water-Borne Diseases in Children. Ph.D. thesis, La Trobe University, Bundoora. Available online at: http://hdl.handle.net/1959.9/308716
Paster, A., and Dagan, G. (2008). Mixing at the interface between two fluids in aquifer well upconing steady flow. Water Resour. Res. 44:W05408. doi: 10.1029/2007WR006510
Peterman, R. M., and Anderson, J. L. (1999). Decision analysis: a method for taking uncertainties into account in risk-based decision making. Hum. Ecol. Risk Assess. 5, 231–244.
R Development Core Team. (2011). R: A Language and Environment for Statistical Computing. Vienna: R Foundation for Statistical Computing.
Regan, H. M., Ben-Haim, Y., Langford, B., Wilson, W. G., Lundberg, P., Andelman, S. J., et al. (2005). Robust decision-making under severe uncertainty for conservation management. Ecol. Appl. 15, 1471–1477. doi: 10.1890/03-5419
PubMed Abstract | Full Text | CrossRef Full Text | Google Scholar
Reilly, T. E., Franke, O. L., and Bennett, G. D. (1984). The Principle of Superposition and its Application in Ground-Water Hydraulics. Reston, VA: US Geological Survey.
Rosenstock, T. S., Mpanda, M., Rioux, J., Aynekulu, E., Kimaro, A. A., Neufeldt, H., et al. (2014). Targeting conservation agriculture in the context of livelihoods and landscapes. Agric. Ecosyst. Environ. 187, 47–51. doi: 10.1016/j.agee.2013.11.011
Sandler, T., Arce, D. G., and Enders, W. (2008). Copenhagen Consensus 2008 Challenge Paper: Terrorism. Copenhagen: Copenhagen Consensus Center. Retrieved July, 29: 2011.
Swarzenski, W. V., and Mundorff, M. J. (1977). Geohydrology of North Eastern Province. Washington, DC: US Geological Survey Water-Supply Paper 1757-N.
Theis, C. V. (1935). The Relation between the Lowering of the Piezometric Surface and the Rate and Duration of Discharge of a Well Using Ground Water Storage. Washington, DC: US Department of the Interior, Geological Survey, Water Resources Division, Ground Water Branch.
Viscusi, W. K., and Aldy, J. E. (2003). The value of a statistical life: a critical review of market estimates throughout the world. J. Risk Uncertain. 27, 5–76. doi: 10.1023/A:1025598106257
Wold, S. (1995). “PLS for multivariate linear modeling,” in Chemometric Methods in Molecular Design: Methods and Principles in Medicinal Chemistry, ed H. van der Waterbeemd (Weinheim: Verlag-Chemie), 195–218.
Keywords: pipeline, risk, uncertainties, stakeholder, decision-making, dryland, Merti aquifer
Citation: Luedeling E, Oord AL, Kiteme B, Ogalleh S, Malesu M, Shepherd KD and De Leeuw J (2015) Fresh groundwater for Wajir—ex-ante assessment of uncertain benefits for multiple stakeholders in a water supply project in Northern Kenya. Front. Environ. Sci. 3:16. doi: 10.3389/fenvs.2015.00016
Received: 31 October 2014; Accepted: 20 February 2015;
Published: 11 March 2015.
Edited by:
Luuk Fleskens, University of Leeds, UKReviewed by:
Hai-Linh Tran, Inha University, South KoreaMongi Sghaier, Institute of Arid Land, Tunisia
Copyright © 2015 Luedeling, Oord, Kiteme, Ogalleh, Malesu, Shepherd and De Leeuw. This is an open-access article distributed under the terms of the Creative Commons Attribution License (CC BY). The use, distribution or reproduction in other forums is permitted, provided the original author(s) or licensor are credited and that the original publication in this journal is cited, in accordance with accepted academic practice. No use, distribution or reproduction is permitted which does not comply with these terms.
*Correspondence: Eike Luedeling, Centre for Development Research, University of Bonn, Walter-Flex-Str. 3, 53113 Bonn, Germany e.luedeling@cgiar.org