Climate regimes, El Niño-Southern oscillation and konzo epidemics
 Olusegun S. A. Oluwole
- Neurology Unit, College of Medicine, University of Ibadan, Ibadan, Nigeria
Epidemics of konzo have occurred during severe droughts in parts of east, central, and southern Africa since the 1920s. Occurrence is attributed to exposure to cyanide from poorly processed cassava foods, the sole source of calories when other food crops fail. El Niño, the warm phase of the El Niño-Southern Oscillation (ENSO), induces severe droughts in the geographical areas of Africa where epidemics of konzo occur. Climate regimes are determined by modes of Pacific Decadal Oscillation (PDO), which modulates the ENSO. Study was done to determine the relationship of konzo epidemics to climate regimes and phases of ENSO, and to propose a model to explain while konzo epidemics do not occur in all drought affected areas. Data of all konzo epidemics in the past century and in DR Congo from 1974 to 1996, and indices of ENSO and PDO from 1915 to 2014 were obtained. Konzo epidemics were mapped to phases of ENSO and PDO. Wavelet spectral and wavelet spectral coherence analysis of climate indices and konzo epidemics were done. All konzo epidemics of the past century occurred during warm climate regimes. Of 19 warm phases of ENSO from 1974 to 1996 in DR Congo, 17 were coupled to konzo epidemics, while of 4 cold phases of ENSO, 1 was coupled to konzo epidemic, odds ratio 26 (95% CI, 2–378). Global spectral of ENSO and konzo showed dominant periodicity of 5 years, while spectrograms showed significant periodicities and coherence between 3 and 6 years. Spatial distribution of konzo is restricted to the area of maximal impact of El Niño on precipitation in Africa. El Niño is the underlying cause of konzo epidemics. Control of konzo epidemics requires management of the impact of El Niño on agriculture in areas where the population depends on cassava as sole source of calories during droughts. There is the need to develop forecast models of changes in cassava production to predict likely periods of konzo epidemics.
Introduction
Konzo is a neurological syndrome of spastic paraparesis or quadriparesis, dysarthria, impaired visual acuity, and nystagmus (Ministry of Health Mozambique, 1984; Howlett et al., 1990). Its onset, which is usually abrupt in previously healthy subjects (Howlett et al., 1990), reaches maximum disability within 3 days (Tylleskar et al., 1991). Disabling spastic paraparesis is the residual deficit in most subjects (Ministry of Health Mozambique, 1984). Major konzo epidemics occurred during severe droughts from the late 1920s to late 1940s (Trolli, 1939; Vileu, 1942; Lucasse, 1952), and from the late 1970s to early 2000s (World Health Organisation, 1982; Ministry of Health Mozambique, 1984; Tylleskar et al., 1991; Ciglenečki et al., 2011; Mlingi et al., 2011). Interannual konzo cases occurred, however, between epidemics (Tylleskar et al., 1991; Cliff, 1994). Cassava (Manihot Esculenta Crantz), a drought resistant and cyanogenic food crop, was the main or only source of calories during konzo epidemics. Exposure to cyanide, which is directly related to intake of cassava food, was present in all subjects. Production of cassava in konzo communities, which is high during low precipitation (Oluwole, 2014), has been shown to correlate with El Niño activity (Oluwole, 2015a). Although konzo epidemics also occur during low precipitation (Oluwole, 2015b), interannual changes in precipitation alone will not explain the absence of major konzo epidemics between the 1950s and mid-1970s.
Occurrence of severe droughts in east and southern Africa has been linked to El Nino-Southern Oscillation (Nicholson and Kim, 1997), which impacts on climate of all regions of the earth through teleconnections (Ropelewski and Halpert, 1987). ENSO varies predominantly on interannual timescale, but also on interdecadal and multidecadal timescales, while the Pacific Decadal Oscillation, which modulates the ENSO, varies predominantly on interdecadal and multidecadal timescales. Paleoclimate data show that climate regimes shifted from cold to warm in 1925, back to cold in 1945, and again to warm in 1976 (Mantua and Hare, 2002). The objectives of this study were to determine the relationship of konzo epidemics to climate regimes and phases of ENSO, and to propose a model to explain why konzo epidemics occur only in restricted geographical areas, but not in all areas where severe droughts occur.
Materials and Methods
ENSO and PDO Data
Multivariate El Niño-Southern Oscillation Index (MEI) data, which were derived from sea-level pressure, zonal and meridional components of the surface wind, sea surface temperature, surface air temperature, and total cloudiness fraction of the sky of the South Pacific Ocean from 1950 to 2014 (Wolter and Timlin, 1998) were downloaded from the website of National Oceanic and Atmospheric Administration (NOAA), USA, http://www.esrl.noaa.gov/psd/enso/mei/table.html, while MEI extension, from 1900 to 1949, was downloaded from http://www.esrl.noaa.gov/psd/enso/mei.ext/table.ext.html. Pacific Decadal Oscillation Index was downloaded from the JISAO's Arctic Oscillation website, http://jisao.washington.edu/pdo/PDO.latest. Ranks of El Niños in the past century were downloaded from http://www.esrl.noaa.gov/psd/enso/mei.ext/rank.ext.html
Konzo Epidemics Data
Years of occurrence of all konzo epidemics in the past century in DR Congo (Trolli, 1939; Vileu, 1942; Lucasse, 1952; World Health Organisation, 1982; Tylleskar et al., 1991; Bonmarin et al., 2002; Chabwine et al., 2011), Mozambique (Ministry of Health Mozambique, 1984; Cliff, 1994; Ernesto et al., 2002; Cliff et al., 2011), Tanzania (Howlett et al., 1990; Howlett et al., 1990, 1992; Mlingi et al., 2011), and Central African Republic (Ciglenečki et al., 2011) were obtained from published studies. Cycle plots of ENSO and PDO timeseries from 1915 to 2014 were drawn to show the warm and cold phases. Konzo epidemics were mapped on the cycle plots of ENSO and PDO to show the interdecadal variations of occurrence of the epidemics. Since historical konzo epidemics were not systematically collected as time series, statistical tests of interdecadal relationship of the epidemics and modes of ENSO and PDO were not performed.
Continuous annual occurrences of konzo were documented in DR Congo (Tylleskär et al., 1991; Banea et al., 1997) for 23 years, in Tanzania (Howlett et al., 1992) for 11 years, and in Mozambique (Cliff, 1994) for 13 years, but only that of DR Congo is of sufficient duration for time series analysis. The phases of ENSO that preceded all epidemics of konzo in DR Congo (Tylleskär et al., 1991; Banea et al., 1997) between 1974 and 1996 were determined. Konzo epidemic must occur within 2 years of the warm phase of ENSO for them to be coupled. This was to ensure that the epidemic occurred within the observed duration of the effects of El Niño (Nicholson and Kim, 1997) or of droughts (Howlett et al., 1990; Tylleskär et al., 1994) on agriculture. Contingency table of phases of ENSO and konzo epidemics was created, and odds ratio was calculated using the Wald's method with correction.
Time Series and Wavelet Analysis
Annual time series were fitted to ENSO and PDO data from 1915 to 2014, and to konzo data in DR Congo from 1974 to 1996. Lag plots, autocorrelation, and partial autocorrelation functions were used to exclude white noise, while unit root test was performed to test for stationarity.
Wavelet analyses of indices of ENSO and PDO were done to describe their frequency-time spectra of the past century. Wavelet spectral and wavelet spectral coherence of ENSO, PDO, and konzo epidemics from 1974 to 1996 were also done to compare the frequency-time spectra of climate indices with that of konzo epidemics. Wavelet methods were as described for epidemiological (Torrence and Compo, 1998; Grinsted et al., 2004), human (Issartel et al., 2014), and environmental data (Cazelles et al., 2007; 2013) time series. The Morlet wavelet (Torrence and Compo, 1998; Grinsted et al., 2004) was used to transform the time series to time-frequency. The Morlet wavelet was defined as
where ω0 is dimensionless frequency, and η is dimensionless time. The continuous wavelet transform of time series (xn, n = 1,…,N)
with uniform time steps δt, was defined as the convolution of xn with the scaled and normalized wavelet (Torrence and Compo, 1998; Grinsted et al., 2004). The cross wavelet transform (Torrence and Compo, 1998; Grinsted et al., 2004)
where Zv(p) was the confidence level associated with probability p, and Pxk and Pyk were the power spectra. The wavelet coherency phase was as defined (Torrence and Compo, 1998; Grinsted et al., 2004)
The global wavelet spectra, the equivalent of the Fourier power spectrum smoothed by the Morlet wavelet function (Farge, 1992; Grinsted et al., 2004) was
Significance was set at 95% confidence level (5% significance).
Spatial Distribution and Model of Distribution
All countries where konzo epidemics have occurred were plotted on the map of Africa. DR Congo, Mozambique, and Tanzania, where occurrence of konzo epidemics is high were highlighted black, while Central African Republic, Angola, and Cameroon, where occurrence of konzo epidemics is low were highlighted gray. The proposed model to explain the restricted spatial occurrence of konzo within wider areas of severe droughts was drawn.
Statistics
Wavelet analyses were done with the biwavelet package of R Statistical Programming and Environment (R Core Team, 2014). Other statistical analysis, graphical plots, and maps were produced using appropriate packages of R Statistical Programming and Environment (R Core Team, 2014).
Results
The warm and cold climate regimes of ENSO and PDO from 1915 to 2014 are shown in Figure 1. Warm regime of ENSO occurred from 1925 to 1941, followed by cold regime which ended in 1975, and warm regime since then, while for PDO, warm regimes occurred from 1923 to 1944 and 1976 to 2006. Konzo epidemics of late 1920s to late 1940s and of 1978–2005 all occurred during the warm regimes of PDO and ENSO, while no epidemics were documented during the cold regime from 1942 to 1975.
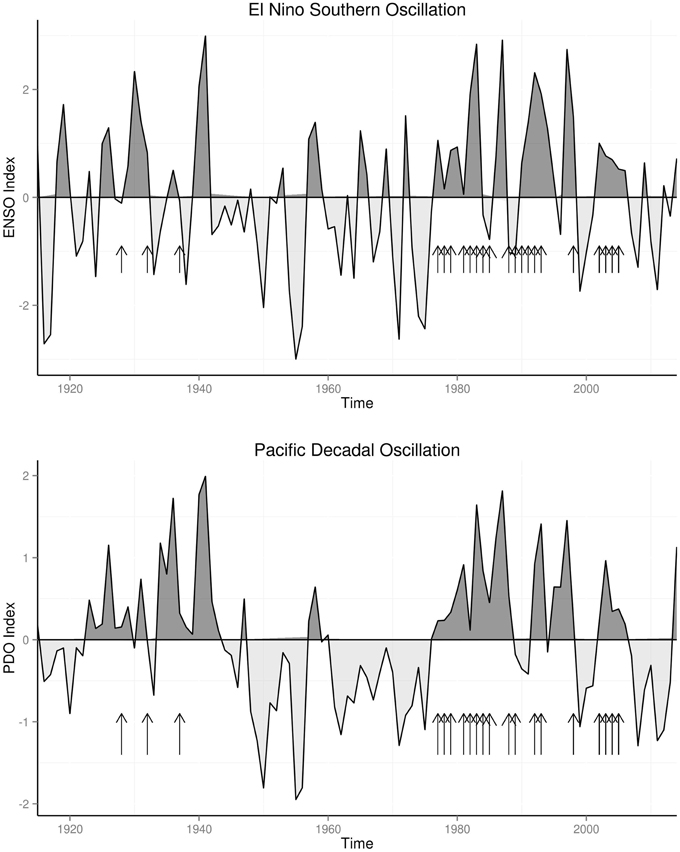
Figure 1. Konzo Epidemics and Climate Regimes.
Of 19 warm phases of ENSO from 1974 to 1996, 17 preceded konzo epidemics for no longer than 2 years, while of 4 cold phases of ENSO, 1 was followed by konzo epidemic, odds ratio 26 (95% CI, 2–378).
From 1915 to 2014 global spectral of ENSO showed dominant periodicity of 5 years, but lower peaks at 12 and 30 years, while dominant periodicity of PDO was 20 years, but lower peaks at 5 and 10 years (Figure 2). Spectrogram of ENSO and PDO both showed time-varying periodicities of 3–8 years.
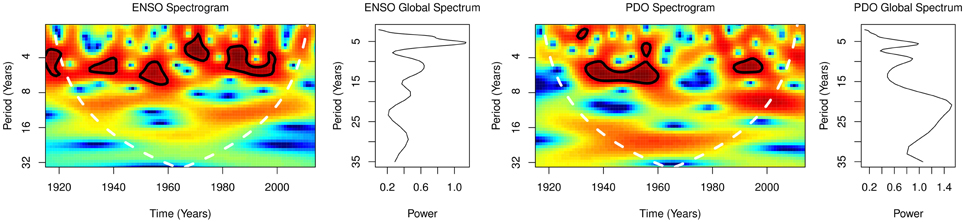
Figure 2. ENSO and PDO.
From 1974 to 1996, global spectral of konzo and of ENSO and PDO showed dominant periodicity of 5 years, while their spectrograms showed significant periodicities of 3–6 years for ENSO and konzo, but 4–6 years for PDO (Figure 3). Coherence squared of cross wavelet spectra of ENSO and konzo, as well as PDO and konzo, were at 5 years (Figure 3). Cross wavelet spectrogram showed coherence at periodicities of 3–6 years for ENSO and konzo, and 4–6 years for PDO and konzo (Figure 3). Coherence was >0.9. The periods of coherency of ENSO and konzo epidemics were also the periods of high amplitude El Niños.
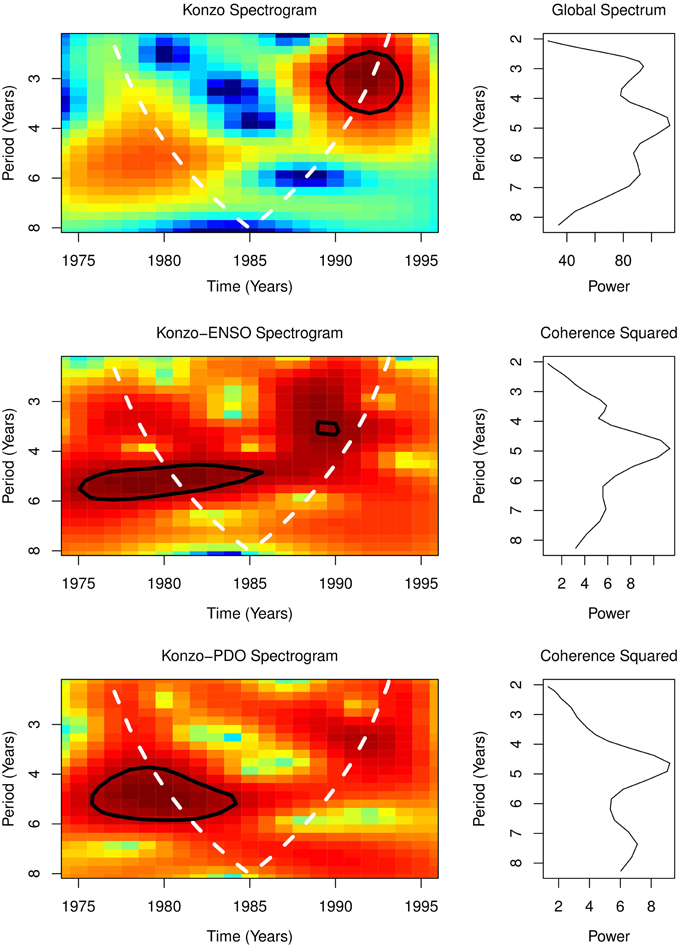
Figure 3. Spectral Coherence.
Six countries that have reported konzo epidemic are shown in (Figure 4). All the affected countries are in the area of maximal effect of El Niño in Africa. The model of spatial distribution of konzo, which described the cascade of events from food shortages to occurrence of konzo, and absence of konzo in some areas is shown in (Figure 5).
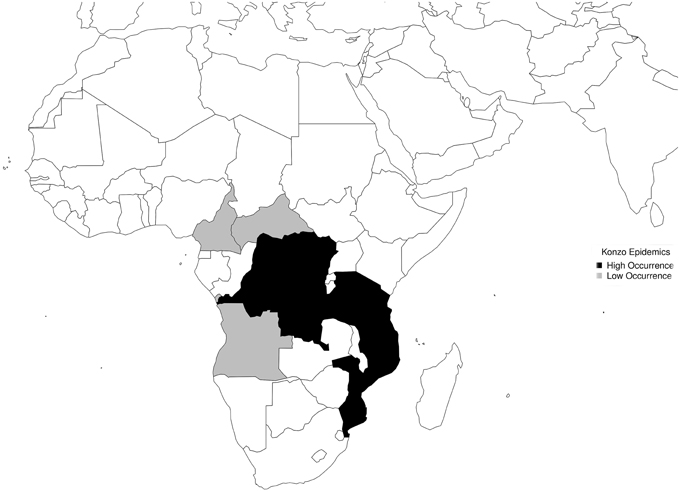
Figure 4. Spatial Distribution.
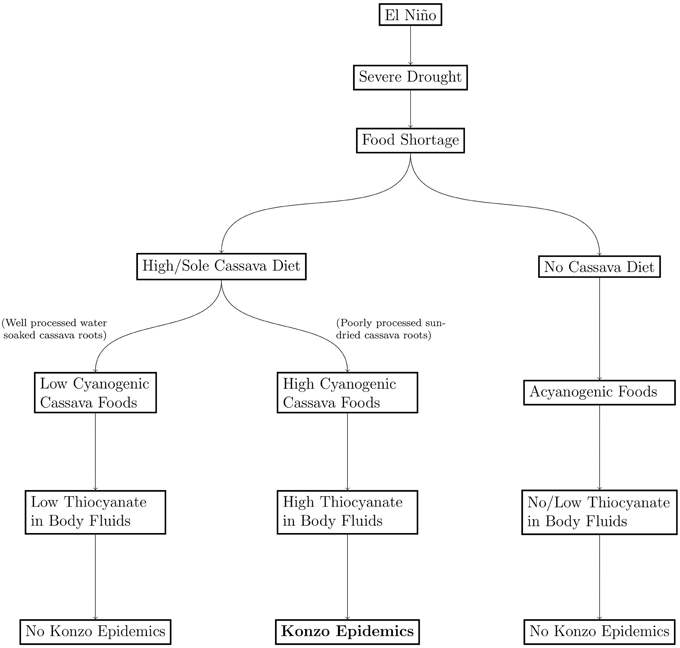
Figure 5. Models of Geospatial Distribution of Konzo.
Discussion
Konzo epidemics of the past century, from the late 1920s to late 1940s (Trolli, 1939; Vileu, 1942; Lucasse, 1952) and from the late 1970s to present time (World Health Organisation, 1982; Ministry of Health Mozambique, 1984; Howlett et al., 1992; Mlingi et al., 2011) occurred during warm climate regimes (Figure 1). Anomalies of the north Pacific Ocean surface temperature and pressure (PDO), which modulate global climate, persist in the same mode for two to three decades before shifting to another mode. In the past century PDO was in warm mode (Mantua et al., 1997) from 1915 to 1945 and from 1977 to 1998, while it was in the cold mode from 1945 to 1977. As shown in Figure 1, konzo epidemics occurred only during the warm modes of the PDO. Warm mode of PDO, which has been associated with more frequent and persistent El Niños since the climate shift of 1976, will explain the high frequency of konzo epidemics between 1976 and 2005. The upsurge of konzo epidemics (World Health Organisation, 1982) in 1978, which started 2 years after the climate shifted to warm regime in 1976, and in 1928, which started 3 years after the climate shifted to warm regime in 1925, illustrates the strong relationship of konzo epidemics to shifts in climate regimes. Thus, occurrence of all konzo epidemics only during warm climate regimes of the past century, indicate that the epidemics are related to climate variability.
Konzo occurs annually during dry season between major epidemics in DR Congo (Tylleskär et al., 1991; Banea et al., 1997), Mozambique (Cliff, 1994), and Tanzania (Howlett et al., 1992). Interannual variations of occurrence in DR Congo, which has been shown to be cyclical (Oluwole, 2015b), correlated with changes in precipitation. The relationship of interannual variations of konzo in DR Congo in this study, which shows that konzo is 26 times more likely during warm than cold phases of ENSO, indicate that the impact of El Niño activities on precipitation and food crop production induce interannual variations of occurrence of konzo. Thus, annual low occurrence of konzo is also related to the impact of El Niño.
The strength of El Niño activities has been shown to vary greatly in the past century. Studies of the strengths of El Niños (Quinn and Neal, 1987; Wolter and Timlin, 1998) have shown that high amplitude El Niños occurred in 1932, 1940–1941, 1982–1983, 1986–1987, and 1997–1998. All these strong El Niños were followed by konzo epidemics (Trolli, 1939; Vileu, 1942; Ministry of Health Mozambique, 1984; Howlett et al., 1990, 1992; Mlingi et al., 2011), Figure 1. High amplitude El Niños are associated with severe droughts and food shortages. This agrees well with the documented observation of occurrence of konzo epidemics following severe droughts in the past century (Trolli, 1939; World Health Organisation, 1982; Mlingi et al., 2011). Thus, all the major konzo epidemics of the past century occurred after strong El Niños.
Wavelet analysis, which unlike Fourier analysis, permits time-frequency analysis of timeseries (Wang and Wang, 1996), has contributed immensely to the understanding of variations of ENSO and PDO activities. While ENSO varies predominantly on interannual timescale, it also varies on interdecadal and multidecadal timescales (Zhang et al., 1997). PDO, however, varies predominantly on interdecadal and multidecadal timescales (Mantua and Hare, 2002), but also on interannual timescale. Thus, global wavelet spectral of 5 years for ENSO (Figure 2) and of 20 years for PDO show differences in the timescale of ENSO and PDO variability. The periodicity and amplitude of ENSO have, however, been changing since the late 19th century (Wang and Wang, 1996). Periodicity of ENSO, which was 3–4 years from 1872 to 1910, was 5–7 years from 1911 to 1960, but 5 years from 1970 to 1992 (Wang and Wang, 1996). Thus, the unpredictability of times of droughts and of konzo epidemics are due to the varying intensities of ENSO.
Between 1974 and 1996 the global spectral of ENSO, PDO, and konzo occurrence in DR Congo, which showed dominant periodicity of 5 years, indicate that cyclical changes of ENSO, PDO, and konzo have similar periodicity. The spectrograms, which showed periodicities of 3–6 years for ENSO and konzo, but 4–6 years for PDO, indicate that variations on interannual timescale of the three variables are similar. Coherence of the spectral of ENSO and konzo indicate that both are coupled (Figure 3). Coupling of interannual variations of PDO with konzo also indicate the strong impact of climate variability on konzo occurrence. Since ENSO covary with changes in precipitation (Wang et al., 2013), its strong coherence with konzo epidemics in this study, >0.9, indicate that the teleconnection of ENSO with the climate of the konzo affected areas is strong. Thus, coupling of ENSO and konzo epidemics on interannual timescale will explain the time-varying epidemics of konzo.
Spatial Distribution of Konzo and Causal Chain
Although the frequency and intensity of epidemics of konzo are higher in DR Congo, Tanzania, and Mozambique than in Central African Republic, Cameroon, and Angola (Figure 4), occurrence is spatially restricted in each country. While drought, which is in the causal chain of konzo epidemics, affects relatively large areas in East and Central Africa, factors that promote exposure to cyanide from cassava foods are not evenly distributed in these areas during drought. These factors include cyanogenicity of cassava cultivars, severity of shortage of water which is needed to process cassava roots, and relative scarcity of other foods.
Cassava roots requires extensive processing to reduce the concentration of cyanogens, which increases during droughts due to water stress. The efficiency of removal of cyanogens from cassava roots, however, depends largely on how much cyanogenesis occurs during processing rather than the duration of processing (Oluwole, 2002). Linamarin, the cyanogen in cassava roots, decomposes during processing to acetone cyanohydrin, which decomposes at pH > 4.0 or temperatures > 30°C to acetone and hydrogen cyanide (McMahon et al., 1995). Methods of processing which involve soaking cassava roots in water accelerate disruption of cassava tissues and promote enzymatic decomposition of linamarin (Oluwole et al., 2002), while methods which sun-dry whole cassava roots retain most of the cyanogens (Banea et al., 1992). Seasonal variations in methods of processing in konzo-affected communities, where cassava roots are soaked in water during raining season, but are sun-dried without soaking during dry seasons (Mlingi et al., 2011) show that shortage of water during droughts contributes significantly to the production of highly cyanogenic foods. Further, seasonal changes in the concentrations of thiocyanate, the biomarker of exposure to cyanide, which were high during the dry season but low during raining season in the same locality (Banea-Mayambu et al., 1997), show that climate variability contributes to exposure to cyanide from cassava foods. Communities where cassava foods are absent, as well as communities where cassava is processed to low cyanogenic products are free of konzo epidemics. Thus, dependence of population on cassava roots during drought is critical for occurrence of konzo epidemics rather than the severity of the drought.
Occurrence of El Niño, the drought and food shortages it induces, are not the direct causes of konzo epidemics. While exposure to cyanide is high in konzo affected population, it is, however, not considered the neurotoxicant of konzo (Spencer, 1999) because the neuropathology of cyanide is limited to the basal ganglia (Sarikaya et al., 2006), but not the neuronal cells that are damaged in konzo. Experimental studies with cassava cyanogens, linamarin (Rivadeneyra-Dominguez and Rodriguez-Landa, 2014), and acetone cyanohydrin (Soler-Martin et al., 2010), and with minor metabolites of cyanide, 2-imino-thiazolidine-4-carboxylic acid (Bitner et al., 1995) and cyanate (Tor-Agbidye et al., 1999), did not induce neuronal lesions that are consistent with konzo. Currently, thiocyanate, the major metabolite of cyanide, which facilitates excitatory amino neurotransmission, is considered the most likely neurotoxicant of konzo (Spencer, 1999; Oluwole, 2015b). Thus, El Niño induces drought, which initiates the cascade of events that lead to konzo epidemics (Figure 5).
Public Health Management of Konzo Epidemics
Over 182 million people, about 21% of total African population, live in konzo affected countries. Thus, massive social and economic consequences, and reduced educational achievements of children caused by konzo epidemics make konzo a major public health problem in Africa. Preventive strategies, which are key to control konzo epidemics should, therefore, focus on management of the impact of El Niños, which have become more frequent and intense in the past 35 years, rather than on anthropogenic factors.
Since dependence on cassava during drought is necessary for konzo epidemics to occur, forecast models for periods of high cassava production will be of public health value to predict periods of relative scarcity of other food crops. Time series forecast models like seasonal ARIMA and seasonal vector autoregressive models (Gujarati, 2004) have not been found to predict crop production well, because of the complex interplay of variables affecting crop yield (Newlands et al., 2014). Methods, which employ Markov-Chain Monte Carlo based simulation and random forest-tree machine learning techniques have been shown to robustly select the best predictors within spatial subregions (Newlands et al., 2014). Space-time models may, however, not be feasible because data of cassava production are available for country rather than regional levels. Autoregressive models to forecast konzo epidemics is also attractive, but lack of surveillance data is a major limitation. Models, which predict times of major El Niños, may in the interim be the easiest option, but the lag before the effects of El Niños on crop production should be taken into consideration.
Conclusion
Limitations of this study include the relatively short duration of konzo time series that was used for wavelet analysis, and the spatial restriction of cases to a geographical area of DR Congo. This area is, however, representative of the risk factors, since konzo was first described from there, and it experiences severe droughts and depends on cassava for calories during droughts. Another limitation is the availability of annual, but not monthly time series, which prevents analysis of seasonality. This limitation will, however, not impact negatively on the analysis since ENSO varies on interannual timescale.
In conclusion it is shown that konzo epidemics and ENSO are coupled on interannual and multidecadal timescales. Konzo epidemics are absent during cold climate regime. Konzo is spatially distributed in areas of maximal impact of El Niño activity in Africa where food shortages occur during droughts, and cassava is the food security crop. Thus, El Niño is the determinant of konzo epidemics. Public health control of konzo should include management of impact of El Niño on agriculture in susceptible areas, and development of forecast models for changes in cassava production to predict times of konzo epidemics.
Conflict of Interest Statement
The authors declare that the research was conducted in the absence of any commercial or financial relationships that could be construed as a potential conflict of interest.
References
Banea, M., Poulter, N. H., and Rosling, H. (1992). Shortcuts in cassava processing and risk of dietary cyanide exposure in Zaire. Food Nutr. Bull. 14, 137–143.
Banea, M., Tylleskar, T., and Rosling, H. (1997). Konzo and Ebola in Bandundu region of Zaire. Lancet 349:621.
Banea-Mayambu, J. P., Tylleskar, T., Gitebo, N., Matadi, N., Gebre-Medhin, M., and Rosling, H. (1997). Geographical and seasonal association between linamarin and cyanide exposure from cassava and the upper motor neurone disease konzo in former Zaire. Trop. Med. Int. Health 2, 1143–1151.
Bitner, R. S., Kanthasamy, A., Isom, G. E., and Yim, G. K. W. (1995). Seizures and selective CA-1 hippocampal lesions induced by an excitotoxic cyanide metabolite, 2-Iminothiazolidine-4-carboxylic acid. Neurotoxicology 16, 115–122.
Bonmarin, I., Nunga, M., and Perea, W. (2002). Konzo outbreak, in the South-West of the Democratic Republic of Congo. J. Trop. Pediatr. 48, 234–238. doi: 10.1093/tropej/48.4.234
Cazelles, B., Chavez, M., de Magny, G. C., Guegan, J. F., and Hales, S. (2007). Time-dependent spectral analysis of epidemiological time-series with wavelets. J. R. Soc. Interface 4, 625–636. doi: 10.1098/rsif.2007.0212
Cazelles, B., Cazelles, K., and Chavez, M. (2013). Wavelet analysis in ecology and epidemiology: impact of statistical tests. J. R. Soc. Interface 11:20130585. doi: 10.1098/rsif.2013.0585
Chabwine, J. N., Masheka, C., Balol'ebwami, Z., Maheshe, B., Balegamire, S., Rutega, B., et al. (2011). Appearance of konzo in South-Kivu, a wartorn area in the Democratic Republic of Congo. Food Chem. Toxicol. 49, 644–649. doi: 10.1016/j.fct.2010.07.050
Ciglenečki, I., Eyema, R., Kabanda, C., Taafo, F., Mekaoui, H., and Urbaniak, V. (2011). Konzo outbreak among refugees from Central African Republic in Eastern region, Cameroon. Food Chem. Toxicol. 49, 579–582. doi: 10.1016/j.fct.2010.05.081
Cliff, J., Muquingue, H., Nhassico, D., Nzwalo, H., and Bradbury, J. H. (2011). Konzo and continuing cyanide intoxication from cassava in Mozambique. Food Chem. Toxicol. 49, 631–635. doi: 10.1016/j.fct.2010.06.056
Cliff, J. L. (1994). Cassava safety in times of war and drought in Mozambique. Acta Hortic. 375, 373–378.
Ernesto, M., Cardoso, A. P., Nicala, D. E., Massaza, F., Cliff, J., Haque, M., et al. (2002). Persistent konzo and cyanogen toxicity from cassava in northern Mozambique. Acta Trop. 82, 357–362. doi: 10.1016/S0001-706X(02)00042-6
Farge, M. (1992). Wavelet transforms and their applications to turbulence. Annu. Rev. Fluid Mech. 24, 395–457.
Grinsted, A., Moore, J. C., and Jevrejeva, S. (2004). Application of the cross wavelet transform and wavelet coherence to geophysical time series. Nonlinear Proc. Geophys. 11, 561–566. doi: 10.5194/npg-11-561-2004
Howlett, W. P., Brubaker, G., Mlingi, N., and Rosling, H. (1992). A geographical cluster of konzo in Tanzania. J. Trop. Geogr. Neurol. 2, 102–108.
Howlett, W. P., Brubaker, G. R., Mlingi, N., and Rosling, H. (1990). Konzo, an epidemic upper motor neuron disease studied in Tanzania. Brain 113, 223–235.
Issartel, J., Bardainne, T., Gaillot, P., and Marin, L. (2014). The relevance of the cross-wavelet transform in the analysis of human interaction - a tutorial. Front. Psychol. 5:1566. doi: 10.3389/fpsyg.2014.01566
Lucasse, C. (1952). Le “Kitondji”, synonyme le “Konzo”, une paralysie spastique. Ann. Soc. Belg. Med. Trop. 33, 393–401.
Mantua, N. J., and Hare, S. R. (2002). The Pacific decacal oscillation. J. Oceanogr. 58, 35–44. doi: 10.1023/A:1015820616384
Mantua, N. J., Hare, S. R., Zhang, Y., Wallace, J. M., and Francis, R. C. (1997). A Pacific Interdecadal climate oscillation with impacts on salmon production. Am. Meteorol. Soc. 78, 1069–1079.
McMahon, J. M., White, W. L. B., and Sayre, R. T. (1995). Cyanogenesis in cassava (Manihot esculenta Crantz). J. Exp. Bot. 46, 731–741.
Ministry of Health Mozambique (1984). Mantakassa: an epidemic of spastic paraparesis associated with chronic cyanide intoxication in a cassava staple area in Mozambique. 1. Epidemiology and clinical and laboratory findings in patients. Bull. World Health Organ. 62, 477–484.
Mlingi, N. L. V., Nkya, S., Tatala, S. R., Rashid, S., and Bradbury, J. H. (2011). Recurrence of konzo in Southern Tanzania: rehabilitation and prevention using the wetting method. Food Chem. Toxicol. 49, 673–677. doi: 10.1016/j.fct.2010.09.017
Newlands, N. K., Zamar, D. S., Kouadio, L. A., Zhang, Y., Chipanshi, A. P., Toure, S., et al. (2014). An integrated, probabilistic model for improved seasonal forecasting of agricultural crop yield under environmental uncertainty. Front. Environ. Sci. 2:17. doi: 10.3389/fenvs.2014.00017
Nicholson, S. E., and Kim, J. (1997). The relationship of the El Nino-Southern Oscillation to African rainfall. Int. J. Climatol. 17, 117–135.
Oluwole, O. S. A. (2002). Endemic Ataxic Polyneuropathy in Nigeria. Ph.D. thesis. Stockholm: Karolinska Institutet.
Oluwole, O. S. A. (2014). Climate change, seasonal changes in cassava production and konzo epidemics. Int. J. Global Warming 6. (in press).
Oluwole, O. S. A. (2015b). Cyclical konzo epidemics and climate variability. Ann. Neurol. 77, 371–380. doi: 10.1002/ana.24334
Oluwole, O. S. A. (2015a). El Nino-southern oscillation and cassava production in Tanzania and Brazil. Clim. Change. doi: 10.1007/s10584-015-1386-2. (in press).
Oluwole, O. S. A., Onabolu, A. O., Cotgreave, I. A., Rosling, H., Persson, A., and Link, H. (2002). Low prevalence of ataxic polyneuropathy in a community with high exposure to cyanide from cassava foods. J. Neurol. 249, 1034–1040. doi: 10.1007/s00415-002-0779-0
Quinn, W. H., and Neal, V. T. (1987). El Nino occurrence over the past four and a half centuries. J. Geophys. Res. 92, 14449–14461.
R Core Team (2014). R: A Language and Environment for Statistical Computing. Vienna: R Foundation for Statistical Computing.
Rivadeneyra-Dominguez, E., and Rodriguez-Landa, J. F. (2014). Motor impairments induced by microinjection of linamarin in the dorsal hippocampus of Wistar rats. Neurologia doi: 10.1016/j.nrl.2014.10.018. [Epub ahead of print].
Ropelewski, C. F., and Halpert, M. S. (1987). Global and regional scale precipitation patterns associated with the El Nino Southern Oscillation. Mon. Weather Rev. 115, 1606–1626.
Sarikaya, I., Apaydin, H., Topal, U., and Karaoglan, O. (2006). Cyanide-induced Parkinsonism and F-18 FDG PET/CT findings. Clin. Nucl. Med. 31, 363–364. doi: 10.1097/01.rlu.0000219168.92370.77
Soler-Martin, C., Riera, J., Seoane, A., Cutillas, B., Ambrosio, S., Boadas-Vaello, P., et al. (2010). The targets of acetone cyanohydrin neurotoxicity in the rat are not the ones expected in an animal model of konzo. Neurotoxicol. Teratol. 32, 289–294. doi: 10.1016/j.ntt.2009.11.001
Spencer, P. S. (1999). Food toxins, AMPA receptors, and motor neuron diseases. Drug. Metab. Rev. 31, 561–587.
Tor-Agbidye, J., Palmer, V. S., Spencer, P. S., Craig, A. M., Blythe, L. L., and Sabri, M. I. (1999). Sodium cyanate alters glutathione homeostasis in rodent brain: relationship to neurodegenerative diseases in protein-deficient malnourished populations in Africa. Brain Res. 820, 12–19.
Torrence, C., and Compo, G. P. (1998). A Practical guide to wavelet analysis. Bull. Amer. Meteor. Soc. 79, 61–78.
Tylleskar, T., Banea, M., Bikangi, N., Fresco, L., Persson, L. A., and Rosling, H. (1991). Epidemiological evidence from Zaire for a dietary etiology of konzo, an upper motor neuron disease. Bull. World Health Organ. 69, 581–589.
Tylleskär, T., Banea, M., Bikangi, N., Fresco, L., Persson, L. A., and Rosling, H. (1991). Epidemiological evidence from Zaire for a dietary etiology of konzo, an upper motor neuron disease. Bull. World Health Organ. 69, 581–589.
Tylleskär, T., Légué, F. D., Peterson, S., Kpizingui, E., and Stecker, P. (1994). Konzo in the Central African Republic. Neurology 44, 959–961.
Vileu, A. F. (1942). Contribution a la discussion de la paraplegie spastique epidemique du Kwango. Ann. Soc. Belg. Med. Trop. 22, 309–317.
Wang, B., and Wang, Y. (1996). Temporal structure of the southern oscillation as revealed by waveform and wavelet analysis. J. Clim. 9, 1586–1589.
Wang, B., Liu, J., Kim, H. J., Webster, P. J., Yim, S. Y., and Xiang, B. (2013). Northern hemisphere summer monsoon intensified by megal-El Nino/southern oscillation and Atlantic multidecadal oscillation. Proc. Natl. Acad. Sci. U.S.A. 110, 5347–5352. doi: 10.1016/j.ntt.2009.11.001
Wolter, K., and Timlin, M. S. (1998). Measuring the strength of ENSO events: how does 1997/98 rank? Weather 53, 315–324.
World Health Organisation (1982). Surveillance of peripheral neuropathies. Wkly. Epidemiol. Rec. 57:213.
Keywords: konzo, El Niño, epidemics, climate, drought, cassava, cyanide
Citation: Oluwole OSA (2015) Climate regimes, El Niño-Southern oscillation and konzo epidemics. Front. Environ. Sci. 3:40. doi: 10.3389/fenvs.2015.00040
Received: 09 March 2015; Accepted: 20 May 2015;
Published: 03 June 2015.
Edited by:
Rob Swart, Alterra, NetherlandsReviewed by:
Nathaniel K. Newlands, Government of Canada, CanadaSelvaraj Kandasamy, Xiamen University, China
Copyright © 2015 Oluwole. This is an open-access article distributed under the terms of the Creative Commons Attribution License (CC BY). The use, distribution or reproduction in other forums is permitted, provided the original author(s) or licensor are credited and that the original publication in this journal is cited, in accordance with accepted academic practice. No use, distribution or reproduction is permitted which does not comply with these terms.
*Correspondence: Olusegun S. A. Oluwole, Neurology Unit, College of Medicine, University of Ibadan, PMB 5116 Ibadan, Nigeria, osaoluwole@hotmail.com