Linking Bayesian and agent-based models to simulate complex social-ecological systems in semi-arid regions
 Aloah J. Pope
 Randy Gimblett
- School of Natural Resources and the Environment, College of Agriculture and Life Sciences, University of Arizona, Tucson, AZ, USA
Interdependencies of ecologic, hydrologic, and social systems challenge traditional approaches to natural resource management in semi-arid regions. As a complex social-ecological system, water demands in the Sonoran Desert from agricultural and urban users often conflicts with water needs for its ecologically-significant riparian corridors. To explore this system, we developed an agent-based model to simulate complex feedbacks between human decisions and environmental conditions in the Rio Sonora Watershed. Cognitive mapping in conjunction with stakeholder participation produced a Bayesian model of conditional probabilities of local human decision-making processes resulting to changes in water demand. Probabilities created in the Bayesian model were incorporated into the agent-based model, so that each agent had a unique probability to make a positive decision based on its perceived environment at each point in time and space. By using a Bayesian approach, uncertainty in the human decision-making process could be incorporated. The spatially-explicit agent-based model simulated changes in depth-to-groundwater by well pumping based on an agent's water demand. Changes in depth-to-groundwater feedback to influence agent behavior, as well as determine unique vegetation classes within the riparian corridor. Each vegetation class then provides varying stakeholder-defined quality values of ecosystem services. Using this modeling approach allowed us to examine effects on both the ecological and social system of semi-arid riparian corridors under various scenarios. The insight provided by the model contributes to understanding how specific interventions may alter the complex social-ecological system in the future.
Introduction
As complex social-ecological systems, water demands in semi-arid deserts from agricultural and urban users often conflicts with water needs for its ecologically significant riparian corridors. Riparian corridors in semi-arid regions are oases of biological diversity; however, their appealing features also attract urban and agricultural developments. River diversions and groundwater pumping have significantly induced riparian vegetation change, altered agricultural and urban behaviors, as well as diminished ecosystem services.
Traditional approaches to modeling semi-arid systems use hydrogeological models, water balance equations, and simplified water demand functions. Only recently has dynamic human behavior been incorporated into groundwater models through agent-based modeling (Feuillette et al., 2003; Pertoghese et al., 2013). Agent-based models (ABMs) are simulations of autonomous entities (agents) that respond heterogeneously to their environment (patches). Since agent-based modeling is a bottom-up approach, researchers can explore how intricacies in micro-scale behavior can influence macro-scale patterns (Schlüter et al., 2012). Agent-based modeling provides an excellent conduit in which to study coupled social-ecological systems since they are capable of addressing issues that make traditional approaches to studying social-ecological systems difficult, such as spatial and temporal complexity, non-linearity, and uncertainty (Schlüter et al., 2012). This is especially true for common pool resources, such as groundwater, since dynamic change is the result of interactions between social and physical systems.
A remaining concern in social-ecological system modeling is that uncertainty in social systems was not being addressed (Schlüter et al., 2012). One approach to address social uncertainty is the use of Bayesian cognitive mapping for modeling human decision-making. Drawing from the fields of Bayesian probability theory and cognitive mapping, Bayesian cognitive mapping attempts to create a probability of the likelihood a certain decision will be made (Sedki and de Beaufort, 2012). Cognitive mapping, or developing a network-based representation of an expert's cognition, produces a qualitative and static representation of decisions (Eden et al., 1992). Bayesian networks use probability theory to represent expert knowledge in situations in which knowledge is ambiguous or incomplete (Spiegelhalter et al., 1993). By embedding cognitive maps with probabilities, researchers can create a quantitative acyclic graph of the decision-making process, in which each decision relationships between components are expressed as conditional probabilities. By employing a Bayesian cognitive map as a decision model, researchers can incorporate inference and uncertainty in the complex decision-making process.
Linking Bayesian cognitive mapping with agent-based modeling techniques is a new approach in social-ecological system modeling. To understand how future climatic conditions may influence both social and physical systems, we developed a hybrid model of ranchers' livelihoods in Sonora, Mexico, where conflict over water use is a debated topic. A great unknown is how ranchers will react and adapt to challenges associated with impending climate change in the region.
Materials and Methods
Case Study
The Rio Sonora is a semi-arid watershed with north-south drainage among transverse mountains. Precipitation varies widely both annually and seasonally, averaging around 500 mm annually (Lizarrago-Celaya et al., 2010). Most of the precipitation occurs during the monsoon season in the form of thunderstorms in July and August. The remaining rain is dropped during winter as small events. Between the winter and monsoon rain events lies a dry, hot summer period. The basin experiences large variability in climate, with periods of drought and pluvial that can last several years to decades (Sheppard et al., 2002). While general circulation models predict a more arid climate in the future (Seager et al., 2007; Diffenbaugh et al., 2008), a dynamically downscaled model predicts increased precipitation (Robles-Morua et al., 2014), highlighting the uncertainties surrounding the effects of climate change for the Rio Sonora Basin.
Within the Rio Sonora's riparian corridor lay the lushest vegetation in the region, predominately cottonwoods and fodder crops. Outside the riparian corridor, the landscape is marginal (Liverman, 1990), including cacti, desert shrubs, and mesquite trees. In a harsh semi-arid climate with limited water resources, ranching remains one of the few remaining options to support livelihoods (West, 1993). The Rio Sonora Watershed produces one of the greatest volumes of livestock, primarily cattle, in Mexico. The carrying capacity, or number of cattle per hectare a rancher can successfully produce on his land, depends on the composition of its vegetation. Lush riparian vegetation can sustain more cattle per hectare than desert shrubs, while variation in precipitation can significantly alter the amount of natural fodder produced within a land cover type. In a drought year, reduced rainfall results in reduced carrying capacity. In such a case, a rancher must make decisions to prevent cattle loss, such as selling off cattle early or purchasing additional feed.
Water resources are an important component to ranching operations. In the past 30 years, groundwater has become vital, producing water when rainwater is limited. During that time however, overexploitation has reduced the groundwater so much that many wells have gone dry. If water is in short supply and forage is minimal on the range, a rancher may be forced to sell part of his herd. Under more favorable water and forage conditions, a rancher can wait to sell his cattle until prices peak in the beef market. The method a rancher adopts to manage his herd is one of many decisions heavily influenced by both water and money. In an uncertain political and environmental climate, concern rises about the future of the valued subculture of ranching in Mexico (Jordan, 1993).
As a case study for the Rio Sonora Watershed, a series of workshops were held in the city of Rayon, Sonora, Mexico. Founded in 1638, Rayon is one of the largest towns in the San Miguel River basin (Figure 1), a sub-basin of the Rio Sonora, with a population of approximately 1600 people (INEGI, 2010). For the city of Rayon, ranching is the most important component of the local economy. The purpose of this study was to assess the effects of rancher decision-making on groundwater pumping, depth-to-groundwater, riparian vegetation and ecosystem services along a 21 km stretch of the Rio San Miguel using a hybrid modeling approach.
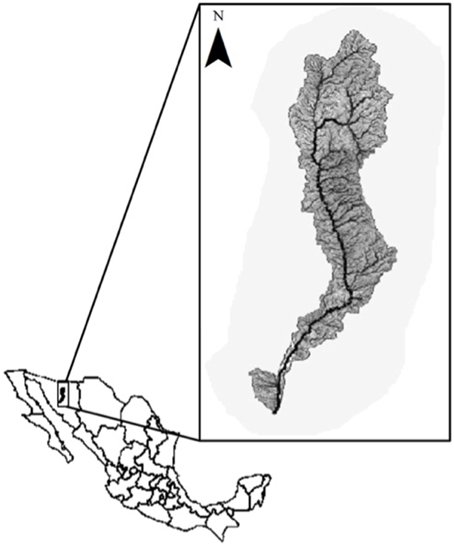
Figure 1. The Rio Sonora Watershed lies within the Mexican state of Sonora.
Description of the Decision Model
Bayesian causal networks are composed of three features: nodes, links, and probabilities. Nodes represent system variables and can be either discrete or continuous. For example, a discrete amount of rainfall could be below average, average, or above average whereas a continuous amount of rainfall can be binned across a full range of rainfall values. Links represent causal relationships between two nodes. A link, for example, from rainfall to crop yield would describe the effect of crop yield caused by the amount of rainfall. In Bayesian networks, the “effect” node is described as a child of the parent “cause” node. Within each node lies a set of probabilities that defines the relationships between parents and their children. A unique probability specifies the likelihood a child will be in a certain state for each combination of parent states. The set of probabilities are called conditional probability tables (CPTs). The incorporation of conditional probabilities tables transforms the structure into a functioning Bayesian network. By changing the state of a parent node, one can observe the model updating the probabilities of all decisions throughout the network using Bayes' theorem. Bayes' theorem is stated as the following equation:
where A and B are events. P(A) and P(B) are the probabilities of A and B without regard to one another, P(A|B) is the conditional probability of A given that B is true, and P(B|A) in the conditional probability of B given that A is true. Because perfect knowledge of a parent's state is rare, probability distributions across a parent's state can be used as input in Bayesian cognitive maps, incorporating additional uncertainty.
The construction of a Bayesian cognitive map requires stakeholder involvement in two steps: development of an acyclic graph structure and data collection (Cain, 2001). A Bayesian cognitive map was developed in two stakeholder workshops (January 2013, 2014) held in Rayon, Sonora, Mexico after informed consent and Institutional Review Board (IRB) approval.
Development of the acyclic graph starts by choosing key variables. Among ranchers in Sonora, Mexico, the two critical issues are livelihood sustainability (profit) and water security (water availability). Next, states must be chosen for key variables. In this model, we chose below normal, normal, and above normal states for nodes “Profit” and “Water Availability” to encompass the entire range of conditions a stakeholder may perceive each year. For each key variable, children nodes were identified by stakeholders through unstructured surveys as important decisions affected by changing profit and water availability: “Purchase Additional Feed,” “Change Herd Size,” “Change Careers,” “Increase Water Efficiency,” or “Apply to Dig a New Well.” An additional child node, “New Well Approved,” was created to assess whether the National Water Commission would approve the new well application. Stakeholders were also asked to define what influenced their state of profit and water availability. Low profit was defined as when natural forage production was so low they must invest and purchase additional feed, while normal and high profit were defined by average and above average productivity of forage, respectively. Stakeholders defined low water availability when rainfall was below average, normal water availability when rainfall was average, and high water availability when rainfall was above average. High water availability was also perceived when wells were deeper than the depth-to-groundwater. Based on these responses, parent nodes of “Invest,” “Rainfall,” and “Well water” were added to the acyclic graph. With this information, we have the completed acyclic graph structure of Sonoran Ranchers decisions.
In order to populate the conditional probability table, a structured survey was distributed to ranchers to assess the likelihood a positive decision would be made within each iteration of contributing variables (below average/average/above average) along a Likert scale, from “Not At All Likely” to “Completely Likely.” Each response on the Likert scale then translated to a probability from 0 to 100%. The average probability within each iteration of contributing variables was used to calculate the conditional probability table for each decision. Once compiled, the Bayesian cognitive map automatically calculates the probability a positive decision will be made based on user-input on parent nodes “Invest,” “Rainfall,” and “Well water.” The resulting Bayesian cognitive map from rancher experiencing unknown profit, average rainfall, and a dry well is demonstrated in Figure 2. More detail on the development of the rancher Bayesian Cognitive map can be found in Pope and Gimblett (in press). The Bayesian cognitive models were developed using GeNIe (GeNIe, 2013), a Bayesian network software tool (http://genie.sis.pitt.edu/).
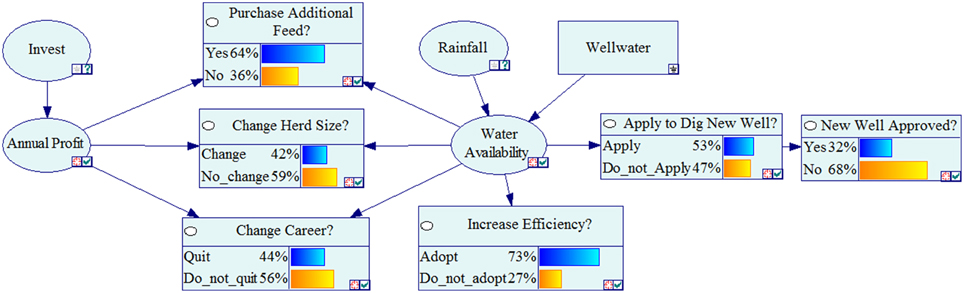
Figure 2. Bayesian cognitive map of important decisions when an individual rancher's annual profit is unknown, his well is dry, and potential rainfall is under normal conditions (Pope and Gimblett, in press).
Bayesian cognitive maps represent a snapshot in time. If we are concerned about the future of a coupled natural-human system, we must find a way to incorporate temporal dynamics. One way to do so is to apply the same Bayesian cognitive map to consecutive years, but allow the variables at the top of the network to change. This could be natural change in a coupled natural-human system, such as fluctuating rainfall patterns, or changing node states based on the results of the Bayesian cognitive map from the previous time step.
Since our Bayesian cognitive map was developed from participation with individual ranchers, each agent in our agent-based model will also represent an individual rancher. Our Bayesian cognitive map also tells us that each rancher's value of water availability, annual profit, and herd size is independent of other ranchers. These variables are defined as rancher attributes. Each of these rancher attributes can be in three states: below normal, normal, and above normal. Value of water availability is determined by a combination of rainfall and well conditions. The conditions of the “Rainfall” node as well as the “Well water” node are used as inputs into the Bayesian cognitive map. If a rancher decides to dig a new well, the node “Well water” switches to below water table and the resulting new probabilities are calculated. The value of annual profit is determined by the output of the previous time step. If water availability is considered below normal and a rancher agent chooses to purchase feed, annual profit is set to below normal. The new value of profit is used as input into the next year's Bayesian cognitive map. Herd size is determined by the output of the Bayesian cognitive map. If a rancher decides to change herd size and water availability is below normal, herd size drops to below normal. If a rancher decides to change herd size and water availability is above normal, herd size improves to above normal. Each time an agent state changes, the Bayesian cognitive map updates to calculate new probabilities. All attributes are set to normal at initialization of the model.
The output of the Bayesian cognitive maps are used as the probability of approving the following decisions in the model: purchasing additional feed, changing herd size, and digging a new well. In order to incorporate uncertainty via Bayesian probabilities, all decisions use the following equations:
IF PR < PD , THEN D = 1;
IF PR > PD , THEN D = 0;
where PR equals a random probability between 0 and 100 and PD equals the calculated probability from the Bayesian cognitive map for making decision D. If the model calculates D = 1, a positive decision has been made.
Description of the Agent-based Model
The agent-based model consists of three interacting sub-models: social, hydrological, and ecological. The social sub-model includes urban, farmer, and rancher decision-making. The hydrological sub-model simulates spatial changes in depth-to-groundwater. The ecological sub-model demonstrates changes in riparian vegetation and subsequently, ecosystem services, along the Rio San Miguel. The ABM was developed in Netlogo, a multi-agent programmable modeling environment, because it is freely available and user-friendly for non-modelers (Wilensky, 1999, http://ccl.northwestern.edu/netlogo/).
Social Sub-model
Water demand is calculated for each agent type. Social agents function under the same basic formula:
Number X Per Capita Water Use = Water Demand,
wherein number equals the number of cattle and people for rancher and urban agents, respectfully; however, the calculation of each input differs.
In rancher agents, number of cattle, or herd size, is estimated by calculating the stocking rate of an agent's pasture. In order to make this calculation, we need three pieces of information: a land cover map, spatially-delineated pastures, and local values of animal unit months. A land cover map, or a categorical map of the physical material at the surface of the earth, was previously developed for 2004 by Hunt et al. (2004). Categories of land cover and land use are water, bare soil, shrubland, grassland, riparian mesquite, riparian woodland, sparse woodland, evergreen, subtropical shrub, and agriculture. Since spatial data on individual pastures in Rayon is not available, Theissen polygons were created in open ranchland surrounding wells that were designated for livestock use. Although a rough approximation, this approach allows us to estimate that spatial distribution of herd sizes across the landscape. Within each polygon, the total area of each land cover type was calculated using ArcGIS (ESRI, 2011). The total area of each land cover type was then multiplied its annual animal unit month, or the number of animal units (1000 lb cow) a land cover type can sustain in a year, to calculate the total number of cows each different land cover area can support (Cuningham and Sampson, 2000; California: Forest and Range Assessment, 2003). Adding the number of cattle that should be stocked for each land cover type calculates the herd size of each pasture. Departure from the calculated herd size will be determined by the results of the Bayesian decision model. Herd size was multiplied with per capita water demand (12 gallons/head/day), and the number of days in each time period to estimate the total water demand for each rancher agent in each time period.
In urban agents, number is the population size (1599) of Rayon (INEGI, 2010). Population growth projections are used to simulate changes in population size over time. In Rayon, the last 10 years has seen a minimal change in population size (average annual growth rates = 0.03%). Population size was multiplied by per capita water demand and the number of days in each time period to estimate the total water demand in each time period.
In farmer agents, the number of hectares of farmland was calculated by digitizing fields in ArcGIS (ESRI, 2011). Individual fields were divided amongst wells that were designated for farmland based on proximity. Field area was multiplied by water demand/acre (1–4 acre ft/yr), percentage of the field that was irrigated, and the total number of days in each time period to estimate the total water demand by the field. Based on stakeholder interviews, farmers cease irrigation if there is little to no rainfall in the second half of the year. Therefore, farmer agents have no water demand if rainfall is modeled as “below average” in the second half of the year.
Hydrological Sub-model
Water demands calculated from the social sub-model are then used as inputs into the hydrological sub-model. The hydrological model uses this information to adjust the depth-to-groundwater in patches using the Theis (1935) equations:
where s is the drawdown, u is a dimensionless time parameter, Q is the pumping rate of the well, T and S are the transmissivity and storativity of the aquifer, r is the distance from the pumping well, t is time since pumping began, and W(u) is the exponential integral. Hydrologic coefficients were parameterized to the Rio San Miguel Watershed. By using the Theis equation, the model can simulate the change in depth-to-groundwater for each agent's well within its radius of influence, or the spatial extent of influence from the pumping well. If the depth-to-groundwater falls below the depth of a well, the well becomes inactive and agents can no longer pump.
Ecological Sub-model
Changes in depth-to-groundwater calculated in the hydrological sub-model were used as inputs into the ecological sub-model. The relationships between depth-to-groundwater and riparian land-cover classes based on rooting depth were used to predict which riparian vegetation class could exist under changing patch conditions (Hough et al., in preparation). Specifically, marsh vegetation could be found if depth-to-groundwater was < 1 m, young cottonwood in < 3 m, adult cottonwood in < 6 m, Tamarisk in < 10 m, and mesquite in < 53 m.
Although most research on habitat degradation has focused on ecological impacts, literature on human impacts has shown an increasing trend. Dubbed ecosystem services, human and ecological benefits from natural systems can be an instrumental influence on decision-making (Millennium Ecosystem Assessment, 2005; Reyers et al., 2009). Human-caused land-cover change has been recognized as one of the most important drivers of ecosystem change (Vitousek et al., 1997); however, little is known on how land-cover change influences quality of ecosystem services locally. In order to assess changes in ecosystems services, data was collected in a series of stakeholder workshops (January 2013; 2014). During the first stakeholder workshop, individuals listed important ecosystem services. From this list, the three most common responses that could be assessed on a cell-by-cell basis were chosen to be modeled in the ABM: agriculture, recreation, and aesthetics. At the second workshop, stakeholders ranked the quality of each ecosystem service on a five point Likert scale, five being the highest, for each riparian vegetation class (Table 1).
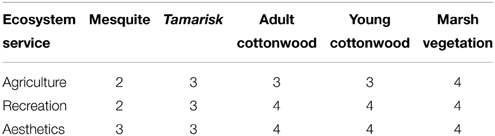
Table 1. Quality ranking (1–5) of the top three ecosystems services for each riparian vegetation class.
Initialization of the ABM
Initialization of the model creates the spatial environment for the social-ecological system model (Figure 3). Initial conditions of the spatial distribution of depth-to-groundwater were interpolated using 13 sample sites collected in December 2008. The riparian corridor is defined as a 120 m buffer along the Rio San Miguel. At the beginning of the simulation, the riparian corridor consisted of 4948.2 ha of mesquite, 281.7 ha of Tamarisk, and 434.7 ha of old cottonwood. Each pumping wells' attributes include location, well depth, the type of water user, the water user's water demand equation, and their water concession, or the maximum amount of water that can be pumped from that well (Public Registry of Water Rights, Mexico.) At the initialization of the model, 10.3% of wells were dry.
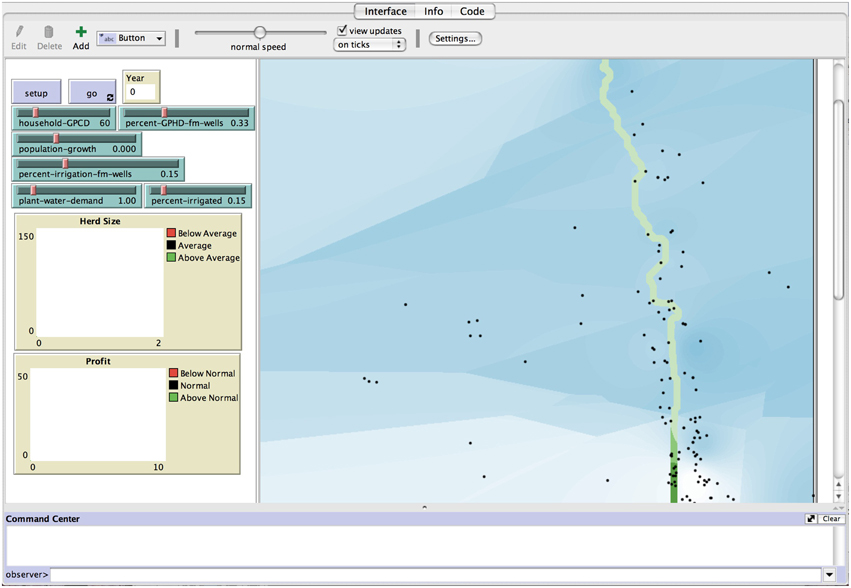
Figure 3. Initialization of the social-ecological system model. Spatial distribution of depth-to-groundwater (light blue-shallowest, dark blue-deepest), riparian vegetation (light green-Mesquite, medium green-Tamarisk, dark green-Old Cottonwood), and pumping wells (black circles). Sliders bar present potential scenarios for stakeholder exploration of the system.
Variations in rainfall were measured at the Rayon rain gauge for 1974–2012. Rainfall values that fell within the first quartile of the long-term rainfall dataset were considered “below average,” while those that fell within the fourth quartile were considered “above average.” Rainfall conditions were always considered “below average” for the first half of the year, since minimal rainfall combined with high evapotranspiration rates result in little to no infiltration before August.
The ABM has a spatial resolution of 30 × 30 m and a temporal resolution of 6 months.
Scenarios
Since the future of the local climate, specifically water security, is one of the greatest concerns in the region, the agent-based model is used to test how a potential extended drought may impact riparian vegetation and its ecosystem services. Using Netlogo's BehaviorSpace Tool, a total of 10 repetitions were simulated for two treatment scenarios: a period of average rainfall and a period of below average rainfall. The model was initialized at the end of 2008 and used measured rainfall values until the end of 2012, followed by 6 years of the treatment conditions. The effects of the social-ecological system model on rancher well-being was also monitored. At the end of the simulation, the distribution of profit and herd size (below average/average/above average) and the number of dry wells were recorded.
Results
Ecological
At the end of the simulation, the compositions of riparian vegetation classes were significantly different between rainfall scenarios (Table 2). The total of mesquite was significantly greater in the average rainfall scenario (5050.9 ± 2.8 ha) than in the below average scenario (4980.5 ± 6.3; p < 0.01). Likewise, the total are of Tamarisk was also greater in the average rainfall scenario (448.7 ± 2.3 ha) than in the below average scenario (410.2 ± 10.5 ha; p < 0.01). Significantly greater area of adult cottonwood was found in the below average scenario (273.9 ± 12.6 ha) than in the average rainfall scenario (164.8 ± 1.6 ha; p < 0.01). No riparian area was observed with either young cottonwood or marsh vegetation (Figure 4).
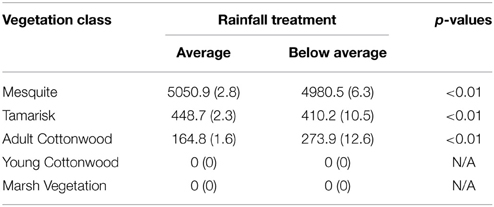
Table 2. Total area (ha) of riparian vegetation classes produced in the average and below average rainfall treatment scenarios.
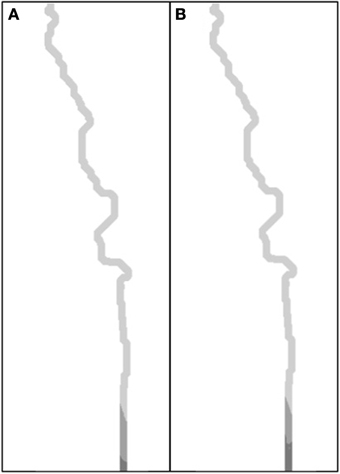
Figure 4. Spatial distribution of riparian vegetation classes, Mesquite (light grey), Tamarisk (medium grey), and Old Cottonwood (dark grey), along the Rio San Miguel for average (A) and below average (B) rainfall treatments.
Social
The rainfall scenarios also had a significant effect on ecosystem service quality (1-lowest, 5-greatest; Table 3). Although both rainfall scenarios only produced below average (2) to average (3) quality agricultural area, the total area (ha) of average quality agricultural area was significantly greater in the below average rainfall scenario (684.1 ± 6.3 ha) than in the average scenario (613.6 ± 2.7 ha; p < 0.01). The total area of below average quality was significantly greater in the average rainfall scenario (5050.9 ± 2.8) than in the below average scenario (4980.5 ± 6.3 ha; p < 0.01). Recreation area was found in below average (2), average (3), and above average (4) quality in both rainfall scenarios. The total area of above average quality of recreation was significantly greater in the below average rainfall scenario (273.9 ± 12.6 ha) than in the average rainfall scenario (164.8 ± 1.6 ha; p < 0.01). Significantly greater area of average quality recreation area was found in the average rainfall scenario (448.7 ± 2.3 ha) than in the below average scenario (410.2 ± 10.5 ha; p < 0.01). Significantly greater area of average quality recreation area was also found in the average rainfall scenario (4980.5 ± 6.3 ha) than in the below average scenario (5050.9 ± 2.8 ha; p < 0.01). Both rainfall scenarios produced average (3) and above average (4) quality of aesthetic area. Total area of above quality of aesthetics was significantly greater in the below average rainfall scenario (273.9 ± 12.6 ha) than in the average rainfall scenario (164.8 ± 1.6 ha, p < 0.01). Significantly greater area of average aesthetic quality was found in the average rainfall scenario (5499.7 ha ± 1.6) than in the below average scenario (5390.7 ± 12.6; p < 0.01).
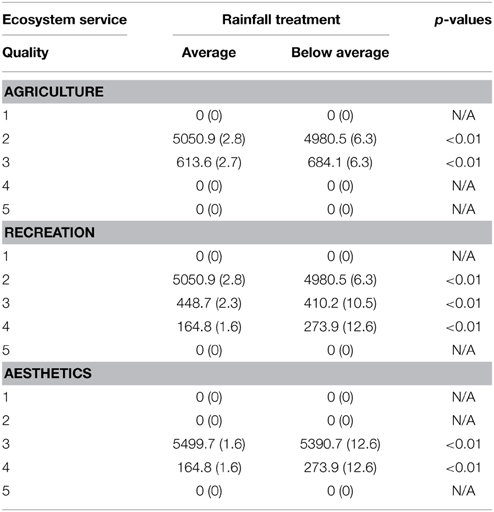
Table 3. Total area (ha) of differing quality values (1-lowest, 5-greatest) for agriculture, recreation, and aesthetics ecosystem services produced in the average and below average rainfall treatment scenarios.
At the end of the simulation, a significantly greater percentage of wells in the average rainfall period (40.2%) than in the below average rainfall period (34.3%) were dry (p < 0.01). Herd sizes of ranchers between the below average and average rainfall scenarios were significantly different (Figure 5A). A significantly greater number of ranchers experienced below average herd sizes in the below average rainfall scenario (27.1 ± 1.1) than in the average rainfall scenario (13.5 ± 0.7; p < 0.01). Average herd sizes in the average rainfall scenario (48.1 ± 1.8) were significantly greater than in the below average rainfall scenario (44.5 ± 0.8; p < 0.05). Above average herd sizes in the average rainfall scenario (21.4 ± 1.4) were also significantly greater than in the below average rainfall scenario (11.4 ± 1.1; p < 0.01).
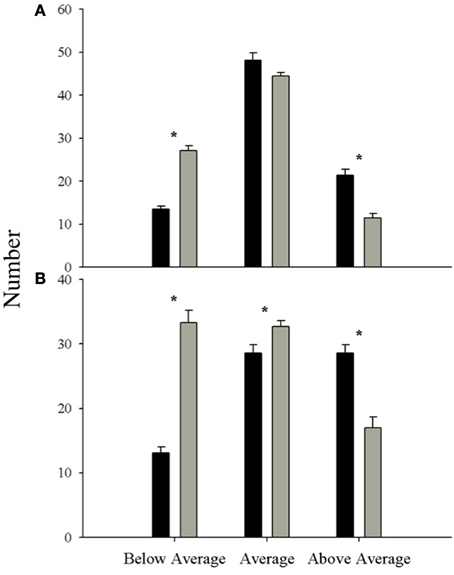
Figure 5. Number of ranchers who observed below normal, normal, or above normal states of (A) herd size and (B) profits for a decade of average (black bars) and below average (gray bars) conditions (*p < 0.05).
Profit of ranchers between the below average and average rainfall scenarios were significantly different (Figure 5B). A significantly greater number of ranchers experienced below average profit in the below average rainfall scenario (33.3 ± 1.9) than in the average rainfall scenario (13.1 ± 0.7; p < 0.01). Average profit in the below average rainfall scenario (32.7 ± 0.9) was also significantly greater than in the average rainfall scenario (28.6 ± 1.3; p < 0.05). Above average profit in the average rainfall scenario (28.6 ± 1.3) was significantly greater than in the below average rainfall scenario (17 ± 1.7; p < 0.01).
Model Validation
In December 2012, depth-to-groundwater was collected at 12 sample sites. A Chi-squared Goodness of Fit test was used to compare modeled depth-to-groundwater with measured depth-to-groundwater at these sites. No significant difference was observed between modeled and measured depth-to-groundwater values (χ2 = 10.96, p > 0.05).
Discussion
The preservation of more hydrophilic riparian vegetation classes during a dryer period compared to a period of normal rain is counterintuitive. Traditional thinking suggests that in a dryer period of time, a farmer would increase irrigation on his land to maintain productivity. Conversely, farmers in Rayon cease irrigation if rainfall is unsubstantial because their crop is unsalvageable. The decreased irrigation efforts resulted in reduced pumping near river, maintaining sufficient depth-to-groundwater for hydrophilic vegetation. Although the model found a dry period to be beneficial to riparian vegetation, the same results may not be true at a geologic timescale since rains are needed for groundwater recharge. Limited irrigation resulting in fewer effects on the water table coincides with previous work conducted downstream (Palma et al., 2015). It should be highlighted however that in either scenario, the total area of old cottonwood decreased, while xeric vegetation classes of mesquite and Tamarisk increased.
Following a similar trend to the changes observed in riparian vegetation composition, all three ecosystem services experienced a greater shift to lower quality after normal rainfall compared to low rainfall. The purpose of translating riparian vegetation composition to ecosystem services is to demonstrate to stakeholders the effects of scenarios, in this case rainfall patterns, on the system with an anthropocentric unit. This model can be a much more powerful tool if a stakeholder can see how their decisions can feedback to impact themselves, either through the drying of wells or reduction in quality of agriculture. According to the stakeholders, most of the agricultural area in the riparian corridor is already below average. Continued deterioration of the riparian corridor could be disastrous for a community that relies on agriculture as its main economic activity.
Unlike the positive effect a dry period had on vegetation composition and ecosystems services, we found that a dry period resulted in an increased percentage of dry wells, a shift toward smaller herd sizes and an increased number of ranchers with below average profit. As is common with many other ecological problems, the model exposes a potential conflict with a scenario that benefits the environment at the expense of rancher well-being. Ideally, this model could be used to explore multiple scenarios, such as policy decisions, that either minimize or eradicate this conflict.
A novel approach in this study was the development of a hybrid model that utilized a Bayesian cognitive map as the decision model in the agent-based model. Instead of a traditional deterministic decision model, the Bayesian Cognitive Map elicited different probabilities of making a positive decision, which allowed us to incorporate real-world uncertainty of the human decision-making process in the agent-based model. This paper attempted to simulate the dynamic nature between water users and the water table by developing a tightly-coupled agent-based model of groundwater pumping by ranchers, farmers, and municipal water users. Since external stressors and internal conflicts are likely to worsen if current trends of increasing water demand and decreasing water supply in semi-arid regions continue, these types of models can be extremely useful tools for decision-makers, increasing the ability to make more-informed decisions to improve resilience of their systems.
Conflict of Interest Statement
The authors declare that the research was conducted in the absence of any commercial or financial relationships that could be construed as a potential conflict of interest.
Acknowledgments
We would like to thank the staff, students, and PIs of The University of Arizona, Universidad de Sonora, Colegio de Sonora, and University of Copenhagen working on the “Strengthening the Resilience of Arid Region Riparian Corridors” project. We particularly thank Dr. Alan Navarro, América Lutz, and Ryan Lee for help with stakeholder workshop coordination and execution, and Dr. Miguel Rangel Medina and Anho Antonio Taylor for help with developing the depth-to-groundwater map. This research was sponsored by a NSF Dynamics of Coupled Human-Natural Systems grant (DEB-1010495).
References
Cain, J. (2001). Planning Improvements in Natural Resources Management; Guidelines for using Bayesian Networks to Manage Development Projects. Wallingford: Institute of Hydrology.
California Department of Forestry Fire Protection, Forest Range Assessment Program. (2003). The Changing California: Forest and Range 2003 Assessment. Sacramento, CA: State of California Resources Agency.
Cuningham, G. L., and Sampson, M. W. (2000). Grasshopper Integrated Pest Management user Handbook. 1st. Edn. Washington, DC: USDA Animal and Plant Health Inspection Service.
Diffenbaugh, N. S., Giorgi, F., and Pal, J. S. (2008). Climate change hotspots in the United States. Geophys. Res. Lett. 35, L16709. doi: 10.1029/2008GL035075
Eden, C., Ackermann, F., and Cropper, S. (1992). The analysis of cause maps. J. Manag. Stud. 29, 309–323. doi: 10.1111/j.1467-6486.1992.tb00667.x
Feuillette, S., Bousquet, F., and Goulven, P. L. (2003). SINUSE: a multi-agent model to negotiate water demand management on a free access water table. Environ. Model. Softw. 18, 213–427. doi: 10.1016/S1364-8152(03)00006-9
GeNIe. (2013). GeNIe. Decision Systems Laboratory, University of Pittsburgh. Available online at: http://genie.sis.pitt.edu/
Hunt, E. R. Jr. Jackson, T. J., and Yilmaz, M. T. (2004). SMEX04 Land Cover Classification for Arizona. Sonora.
INEGI. (2010). INEGI Censo General de Poblacion y Vivienda, Sonora: Instituto Nacional de Estadistica, Geografia e Informatica.
Jordan, T. (1993). North American Cattle Ranching Frontiers: Origins, Diffusion and Differentiation. Alberquerque, NM: University of New Mexico Press.
Liverman, D. (1990). Drought Impacts in Mexico: Ritual, Capital, and Environmental Degradation in the Cordillera of Northern Luzon, 1900-1986. Berkley, CA: University of California Press.
Lizarrago-Celaya, C., Watts, C., Rodrigues, J., Garatuza-Payan, J., Scott, R., and Saiz-Hernandez, J. (2010). Spatio-temperal variations in surface characteristics over the North American Monsoon region. J. Arid Environ. 74, 540–548. doi: 10.1016/j.jaridenv.2009.09.027
Millennium Ecosystem Assessment. (2005). Ecosystems and Human Well-being: Synthesis. Washington, DC: Island Press.
Palma, A., Gonzalez, F., and Cruickshank, C. (2015). Manageed aquifer recharge as a key element in Sonora River Basin management, Mexico. J. Hydrol. En. 20, B4014004. doi: 10.1061/(ASCE)HE.1943-5584.0001114
Pertoghese, I., D'Agostino, D., Giordano, R., Scardigno, A., Apollonio, C., and Vurro, M. (2013). An integrated modeling tool to evaluate the acceptability of irrigation constraint measure for groundwater protection. Environ. Model. Softw. 46, 90–113. doi: 10.1016/j.envsoft.2013.03.001
Pope, A., and Gimblett, R. (in press). “Linking participatory, Bayesian, agent-based modeling techniques to simulate coupled natural-human system: a case study with ranchers in Sonora Mexico,” in Environmental Modeling with Stakeholders: Theory, Methods Applications, eds S. A. Gray, M. J. Paolisso, S. R. J. Gray R. C Jordan (New York, NY: Springer Public Registry of Water Rights).
Reyers, B., O'Farrell, P. J., Cowling, R. M., Egoh, B. N., Le Maitre, D. C., and Vlok, J. H. J. (2009). Ecosystem services, land-cover change, and stakeholders: finding a sustainable foothold for a semiarid biodiversity hotspot. Ecol. Soc. 14:38. Available online at: http://www.ecologyandsociety.org/vol14/iss1/art38/
Robles-Morua, A., Che, D., Mayer, A. S., and Vivoni, E. R. (2014). Hydrologic assessment of proposed reservoirs in the Sonora River Basin, Mexico, under historical and future climate scenarios. Hydrol. Sci. J. 60, 50–66. doi: 10.1080/02626667.2013.878462
Schlüter, M., McAllister, R., Arlinghaus, R., Bunnefeld, N., Eisenack, K., Hölker, F., et al. (2012). New horizons for managing the environment: a review of coupled social-ecological systems modeling. Nat. Res. Model. 25, 219–272. doi: 10.1111/j.1939-7445.2011.00108.x
Seager, R., Ting, M., Held, I., Kishnir, Y., Lu, J., Vecchi, G., et al. (2007). Model Projections of an imminent transition to a more arid climate in southwestern North America. Science 316, 1181–1184. doi: 10.1126/science.1139601
Sedki, K., and de Beaufort, L. (2012). “Cognitive maps and Bayesian networks for knowledge representation and reasoning,” in 24th International Conference on Tools with Artificial Intelligence (Greece).
Sheppard, P. R., Comrie, A. C., Packin, G. D., Angersbach, K., and Hughes, M. K. (2002). The climate of the US Southwest. Clim. Res. 21, 219–238. doi: 10.3354/cr021219
Spiegelhalter, D., Dawid, A., Lauritzen, S., and Cowell, R. (1993). Bayesian analysis in expert systems. Stat. Sci. 8, 219–247.
Theis, C. V. (1935). The relation between the lowering of the piezometric surface and the rate and duration of discharge of a well using groundwater storage. Am. Geophys.Union Trans. 165, 519–524. doi: 10.1029/TR016i002p00519
Vitousek, P., Mooney, H., Lubechenco, J., and Melillo, J. (1997). Human domination of earth's ecosystems. Science 277, 494–499. doi: 10.1126/science.277.5325.494
Wilensky, U. (1999). NetLogo. Evanston, IL: Center for Connected Learning and Computer-Based Modeling, Northwestern University. Available online at: http://ccl.northwestern.edu/netlogo/
Keywords: Bayesian cognitive mapping, agent-based modeling, sonoran desert, social-ecological systems, hybrid modeling
Citation: Pope AJ and Gimblett R (2015) Linking Bayesian and agent-based models to simulate complex social-ecological systems in semi-arid regions. Front. Environ. Sci. 3:55. doi: 10.3389/fenvs.2015.00055
Received: 23 April 2015; Accepted: 20 July 2015;
Published: 07 August 2015.
Edited by:
Lael Parrott, The University of British Columbia, CanadaReviewed by:
Saumitra Mukherjee, Jawaharlal Nehru University, IndiaGunter Spöck, Alpen Adria Universität Klagenfurt, Austria
Copyright © 2015 Pope and Gimblett. This is an open-access article distributed under the terms of the Creative Commons Attribution License (CC BY). The use, distribution or reproduction in other forums is permitted, provided the original author(s) or licensor are credited and that the original publication in this journal is cited, in accordance with accepted academic practice. No use, distribution or reproduction is permitted which does not comply with these terms.
*Correspondence: Aloah J. Pope, School of Natural Resources and the Environment, College of Agriculture and Life Sciences, University of Arizona, 1064 E Lowell St., Tucson, AZ 85719, USA, aloahpope@gmail.com