Flood-Controlled Excess-Air Formation Favors Aerobic Respiration and Limits Denitrification Activity in Riparian Groundwater
 Simone Peter
 Lars Mächler3
  Bernhard Wehrli
- 1Department of Environmental Systems Science, Institute of Biogeochemistry and Pollutant Dynamics, ETH Zurich, Zurich, Switzerland
- 2Department Surface Waters, Eawag, Swiss Federal Institute of Aquatic Science and Technology, Kastanienbaum, Switzerland
- 3Department Water Resources and Drinking Water, Eawag, Swiss Federal Institute of Aquatic Science and Technology, Dübendorf, Switzerland
- 4Department of Earth Sciences, Institute of Geochemistry and Petrology, ETH Zurich, Zurich, Switzerland
The saturated riparian zones of rivers act as spatially and temporally variable biogeochemical reactors. This complicates the assessment of biogeochemical transport and transformation processes. During a flood event, excess-air formation, i.e., the inclusion and dissolution of air bubbles into groundwater, can introduce high amounts of dissolved O2 and thereby affect biogeochemical processes in groundwater. With the help of a field-installed membrane-inlet mass-spectrometer we resolved the effects of flood induced excess-air formation on organic carbon (OC) and nitrogen transformations in groundwater of different riparian zones of a restored section of the River Thur, Switzerland. The results show that the flood event triggered high aerobic respiration activity in the groundwater below a zone densely populated with willow plants. The flood introduced high concentrations of O2 (230 μmol L−1) to the groundwater through the formation of excess air and transported up to ~400 μmol L−1 OC from the soil/root layer into groundwater during the movement of the water table. A rapid respiration process, quantified via the measurements of O2, CO2, and noble-gas concentrations, led to fast depletion of the introduced O2 and OC and to high CO2 concentration (590 μmol L−1) in the groundwater shortly after the flood. The synchronous analysis of different nitrogen species allowed studying the importance of denitrification activity. The results indicate that in the willow zone excess-air formation inhibited denitrification through high O2 concentration input. Instead, the observed decrease in nitrate concentration (~50 μmol N L−1) may be related to fostered nitrate uptake by plants. In the other riparian zones closer to the river, no significant excess-air formation and corresponding respiration activity was observed. Overall, analyzing the dissolved gases in the groundwater significantly contributed to deciphering biogeochemical processes in the riparian aquifer characterized by pronounced changes in the flow regime and by spatial heterogeneity of the vegetation. Measuring excess-air formation helped identifying and explaining the low denitrification activity in a zone with high OC turnover and to quantify OC sources.
Introduction
Rivers play an important role in global nutrient cycles, as they connect terrestrial and marine cosystems. The saturated zones of stream-riparian interfaces act as important biogeochemical reactors (Baker and Vervier, 2004; Romani et al., 2006). The large spatial and temporal variability in these systems and the technical challenges of performing measurements in situ and in real time in the subsurface complicate a sound investigation of biogeochemical transport and transformation processes.
Organic carbon (OC) is of particular interest for river ecosystems as its availability usually limits groundwater heterotrophic activity (Sobczak and Findlay, 2002; Findlay and Sinsabaugh, 2003) and is a major control of oxygen (O2) concentrations. Besides OC infiltrating with the river water, the major OC pools in riparian soils, i.e., roots, carbon-rich lenses, and buried A-horizons, may introduce OC to groundwater (Blazejewski et al., 2009). Mineralization of this OC leads to redox conditions favorable for anaerobic microbial processes, such as denitrification. Subsurface flow paths are known as efficient nitrogen (N) removal zones, particularly through the removal of nitrate (NO−3) by denitrification (Hinkle et al., 2001; Baker and Vervier, 2004), or plant uptake (Clement et al., 2003). Denitrification in NO−3-rich groundwater is primarily controlled by the redox conditions (suboxic) and the availability of electron donors, e.g., OC (Hill et al., 2000; Baker and Vervier, 2004; Mayer et al., 2010).
Organic carbon turnover and denitrification in a riparian groundwater system can be temporally and spatially highly dynamic. In the framework of an interdisciplinary study in a restored riparian section of the River Thur, Switzerland, pronounced hot spots and moments (McClain et al., 2003) for these biogeochemical processes were identified (Peter et al., 2012a,b). Especially flood events locally intensified OC turnover in the groundwater and impacted N transformation pattern in the riparian soils (Huber et al., 2012; Shrestha et al., 2014). Furthermore, during flood events, significant amounts of air can be delivered to groundwater by the entrapment and dissolution of air bubbles in response to water table fluctuations or groundwater recharge (Mächler et al., 2013). This so called excess-air formation commonly occurs in groundwater and can contribute substantially to the overall input of O2 and N2 into groundwater (Heaton, 1981; Williams and Oostrom, 2000; Kipfer et al., 2002; Klump et al., 2007). Thus, a balanced analysis of C and N transformations need to account for the influence of excess-air formation (Mächler et al., 2013). Atmospheric noble gases (He, Ne, Ar, Kr, and Xe) are biogeochemically inert and are therefore excellent tracers to study air/water partitioning and excess-air formation in aquatic systems (e.g., Kipfer et al., 2002). In particular, noble gas measurements enable to reconstruct the amount of introduced excess-air (Pauwels et al., 2000; Mächler et al., 2013), and hence to distinguish between physical and biogeochemical processes influencing gas concentrations in water.
In order to investigate the role of excess-air formation on OC and N transformations in riparian groundwater we compared different functional process zones (Thorp et al., 2006) characterized by different riparian vegetation of a restored river corridor of River Thur, Switzerland, during a flood event. In previous studies at this field site, it was shown that the riparian zones and water level changes are important constraints on the distribution and availability of OC and NO−3 resulting in spatially and temporally highly variable biogeochemical activities (Huber et al., 2012; Peter et al., 2012a,b; Shrestha et al., 2014). We hypothesized that the formation of excess air in response to the hydraulic condition of the river additionally constrains these biogeochemical processes. Especially respiration processes (both aerobic and anaerobic) are expected to be highly affected by O2 that becomes available during flood events. We quantified concentrations of DOC and N compounds in the main channel and in the groundwater of the individual riparian zones and compared it to the estimated intrusion of O2 and N2 due to excess-air formation in response to changing discharge regime of the River Thur. The O2 and N2 injection through excess-air formation were evaluated in a separate study by Mächler et al. (2013). That study used dissolved noble gas concentrations (He, Ar, and Kr) as tracers to quantify the amount of N2 and O2 injection due to excess-air formation. In this present study we combine the analysis of excess-air formation by Mächler et al. (2013) with the measurements of DOC and N compounds to assess groundwater biogeochemical processes. We demonstrate how determining dissolved gas concentrations in the groundwater add to decipher spatial and temporal variability of biogeochemical processes within a dynamic riparian groundwater system.
Materials and Methods
Study Site
The River Thur originates in the limestone formation of the Mount Säntis region (2500 m asl), drains a catchment area of 1700 km2 on the NE Swiss Plateau, and enters the River Rhine at 345 m asl. The River Thur exhibits the dynamic flow regime of an Alpine river because reservoirs and natural lakes are absent in the catchment. Maximum, mean, and minimum flow rates are 1130, 50, and 2 m3 s−1, respectively, for the recording period of 1904–2000 (Binderheim-Bankay et al., 2000). The River Thur receives high reactive-N loads from diffuse agricultural sources and during dry summer condition substantial input from effluents of waste water treatment plants (Abbaspour et al., 2007). The river was channelized in the 1890s to prevent flooding of the river valley. In the 1970s, a plan to concurrently improve the flood protection and ameliorate the ecological state of the river corridor was elaborated and set into operation. Since the early 1990s, several 1–3 km long river sections were widened to allow alternating gravel bars to develop and to increase hydrological connectivity between the main channel and its riparian zone. Riparian succession processes were stimulated and as a consequence habitat diversity increased (Pasquale et al., 2010).
The study site, instrumented for an interdisciplinary research project on river restoration (Schneider et al., 2011), is located at Niederneunforn (Canton Thurgau, Switzerland) and covers a 2 km long restored river corridor (Figure 1). We investigated the biogeochemistry of groundwater along a transect away from the river covering three distinct riparian zones: 1) a bare gravel bank (gravel), 2) exposed gravel, colonized by the tall pioneer grass Phalaris arundinacea (grass), and 3) a second flooding terrace dominated by Salix viminalis (willow bush). The piezometers penetrated the unconfined aquifer down to 8 m depth (3–7 m screened), allowing water to be collected from the saturated zone (Figure S1). The aquifer consists of a deep sandy gravel layer (5–6 m), sealed by an impermeable clay layer at the bottom and covered by a poorly permeable sand and loam layer at the top (Schneider et al., 2011). The piezometer transect does not reflect the subsurface flow direction (Figure 1). As a consequence, the individual piezometers and riparian zones are not directly connected by the groundwater flow but the river water feeds directly into the individual zones (Peter et al., 2012b). In general, the restored river stretch is characterized by a good hydraulic and hydrological connectivity between river water and riparian groundwater, being recharged by river infiltration (Vogt et al., 2010). The groundwater below the gravel bar and the grass zone is comprised of infiltrated river water with very short residence time (~23 h travel time). The groundwater in the willow bush zone originates also from river water, but has a considerably longer residence time of ~4.5 days (Vogt et al., 2010). Distances from the main channel along the groundwater flow path are ~20, ~75, and ~135 m for the gravel, grass and willow bush zones, respectively.
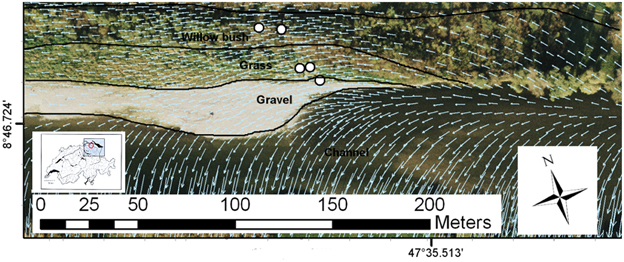
Figure 1. Field site at Niederneunforn, Switzerland with installed piezometers in the restored section of the River Thur with the different functional process zones indicated (piezometers selected for this study are highlighted). Overlaid arrows indicate the groundwater flow direction (Peter et al., 2012b). River water directly infiltrates in the different riparian zones.
Sampling and Sample Preparation
To analyse OC and N dynamics in response to the hydraulic flow/discharge regime of the river Thur a sampling campaign was conducted from 11 May to 24 May 2011 during a small flood event, covering pre-flood, flood, and post-flood conditions (Figure 2). Piezometers were sampled in the gravel zone, grass zone upstream and downstream, and willow bush zone upstream and downstream once a day (except for willow bush upstream twice a day) on 11, 13, 15, 16, 17, and 20 May and additionally on 24 May in the willow bush zone (Figure 1). Water samples for chemical analyses were collected directly from the river or from piezometers using a submersible pump and after having monitored the water to reach stable and constant values for temperature, electrical conductivity, and O2 concentrations. Water for nitrous oxide (N2O) analysis was filled bubble-free in serum flasks, amended with CuCl2, and sealed gas-tight. Cooled water samples were stored in acid-cleaned and combusted glass vials until filtration (GF/F Whatman). Filtered aliquots for DOC concentrations were acidified to pH 3 using 2 mol L−1 HCl.
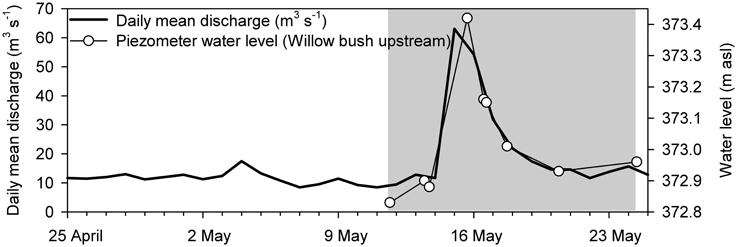
Figure 2. Daily mean discharge of the River Thur and water level changes in the willow bush zone during the course of the sampling campaign in 2011 (http://www.hydrodaten.admin.ch/de/2044.html?). Water level changes in the other zones were highly similar to the ones presented here and ranged from 0.59 to 0.68 m. The gray area indicates the monitoring period from 11 to 24 May 2011. The peak of the flood event occurred on 15 May 2011.
Dissolved Gas Measurements And Excess-air Formation
In the following the results and methodology of the excess air input determinations used for this study and which are published in Mächler et al. (2013) are summarized. The dissolved gas concentrations (He, Ar, Kr, O2, N2, and CO2) were measured with a recently developed gas equilibrium membrane-inlet mass spectrometer (GE-MIMS) (Mächler et al., 2012). Daily concentrations were measured by pumping water from the river or the respective piezometers to the GE-MIMS. The acquired noble-gas concentrations allowed to physically describe the partitioning of air and water and thus enabled to quantify the aeration of groundwater due to excess-air formation and to determine the injected concentrations of O2 and N2. The input of O2 and N2 due to excess-air formation in response to the flood can be calculated from the accumulating noble-gas concentrations which in contrast to O2 and N2 are only subject to physical gas exchange and not reactive and thus ideal to track excess-air formation. For details on the analysis of dissolved gas concentrations and the excess-air model see Mächler et al. (2012) and Mächler et al. (2013), respectively.
The consumption of O2 during excess-air formation will result in a difference from measured concentrations and concentrations estimated by the excess-air model which can be used to quantify aerobic respiration activity in the groundwater. When assessing denitrification activity, N2 concentrations need to be corrected for the intrusion of N2 from excess-air formation. Through this pathway significant amounts of atmospheric N2 can be delivered to the groundwater. Only the difference (ΔN2) of the measured N2 concentrations and the estimated N2 introduction through excess air and from river advection indicates microbial production through denitrification. The calculations, however, showed that N2 formation resulting from denitrification (ΔN2) was within the analytical error (3% of total N2 concentration, 30–40 μmol N L−1) and that the measured N2 concentrations can be fully explained (100 ± 1.7%) by excess-air formation and the prevailing air saturated water concentrations (Mächler et al., 2012, 2013).
Chemical Analyses
DOC concentrations were measured by using high-temperature catalytic oxidation on a Shimadzu TOC analyzer (TOC-V CPH) (Benner and Strom, 1993). The accuracy of the analysis was 1.5% and the detection limit 80 μmol C L−1. Nitrate, nitrite (NO−2) and ammonium (NH+4) were determined colorimetrically on a Technicon autosampler (Dev, 2004). The analytical errors were 2.5% for NO−2, and 6% for NO−3. Dissolved N2O was quantified by headspace analysis on a Trace GC Ultra (Thermo Scientific) fitted with electron capture detector and Supel-Q PLOT column (Sigma-Aldrich). N2O concentrations in the samples were calculated according to Weiss and Price (1980) accounting for the non-ideal gas behavior of N2O. The analytical error was 0.2–4.6%.
Results
Hydrological Conditions
The field campaign started in May 2011 after a dry period of several weeks and covered a small flood event (Figure 2). At the start of sampling, the discharge of River Thur was below 10 m3 s−1. On 15 May 2011, in response to a small flood event discharge increased to (100 m3 s−1 and forced the water table in the riparian aquifer to rise (Figure 2). The fast response of groundwater table increase even far away from the river reflected the high hydraulic conductivity at this field site (Vogt et al., 2010). During peak flood, the gravel zone was flooded whereas the groundwater table in the grass and the willow zones remained below the soil surface. Within 3 days after the peak flow discharge rapidly decreased to 20 m3 s−1.
DOC, O2, and CO2 Dynamics for Different Riparian Zones
DOC concentrations generally decreased with distance from the River Thur. During the period of the elevated water table on 15 to 16 May 2011 a small increase of DOC concentrations occurred in the channel and weak maxima were also observed in the aquifer (Figure 3). CO2 concentrations in the channel were in the range of 13–40 μmol L−1 and were slightly elevated in the gravel and grass zones (Figure 3). In the willow bush zone, during river base flow, CO2 concentrations were about 30–200 μmol L−1 and increased substantially during the flood event (510–590 μmol L−1). O2 in the river water was usually close to saturation (350–500 μmol L−1). In the gravel zone, measured O2 concentrations were higher compared to the other zones and were more variable in the grass zone (Figure 3). In the willow bush zone, O2 concentrations were generally low (< 50 μmol L−1). The calculated O2 input concentrations from excess-air formation differed markedly from the measured O2 concentrations during the flood event (Figure 3). Especially in the willow bush zone high amounts of O2 (220–230 μmol L−1) were temporary delivered to the groundwater by excess-air formation.
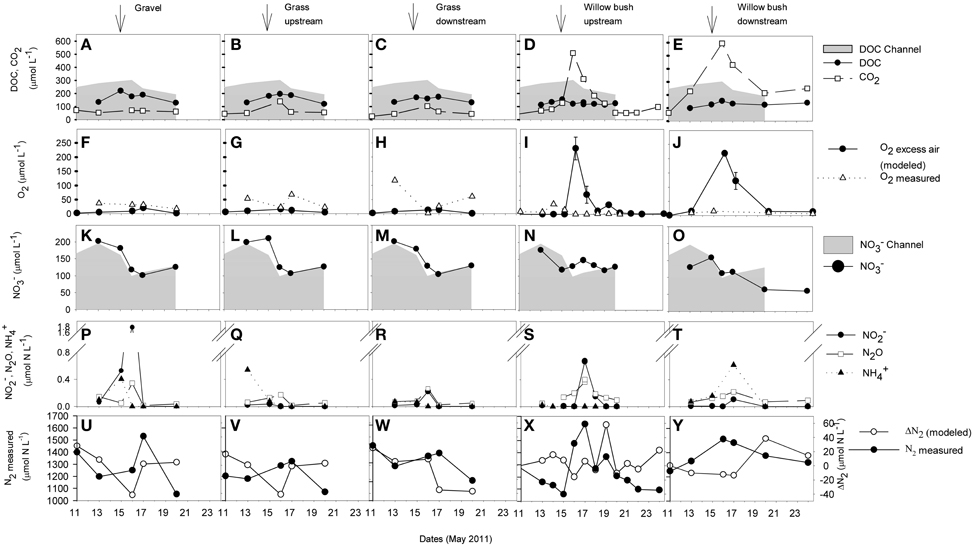
Figure 3. Concentrations of DOC, CO2 (A–E), O2 (F–J), and inorganic N compounds (K–Y) in selected piezometer of the different riparian zones during the observation period from 11 to 24 May. The O2 excess air (F–J) represents the modeled concentration of O2 that was delivered to the groundwater by excess-air formation, being calculated through the according atmospheric noble-gas excess (Mächler et al., 2013). O2 excess-air errors are derived from modeling uncertainties. The N2 concentration not explained by the modeled excess air concentration indicates microbial production (ΔN2; U-Y, y-axis at right). Nitrate (K–O) and DOC (A–E) concentrations from the channel are shown for comparison as gray areas. Arrows indicate the peak of the flood event on 15 May 2011.
Nitrogen Dynamics For Different Riparian Zones
In the channel, NO−3 concentrations decreased shortly after the flood (Figure 3), and concurrently, NH+4 and NO−2 concentrations increased (from 1 to 9 μmol L−1 and from 2 to 3 μmol L−1, respectively, not shown). The N2O concentration in the channel stayed low (< 0.04 μmol L−1) during the entire sampling period. In the gravel and grass zones close to the channel, NO−3, NO−2, and NH+4 concentrations were similar to the concentrations in the river and shared a similar dynamics. Increasing N2O concentration were observed shortly after the flood. In the willow bush zone, the two sampled piezometers differed in NO−3 concentrations. During pre-flood conditions, the concentration in the more downstream piezometer was lower than in the upstream piezometer and the channel and decreased after the flood event to a low level until the end of the sampling campaign. However, in both locations, elevated concentrations of NH+4, N2O, and NO−2 were observed 2 days after the peak flood. Most of the observed N2 increase in the groundwater of all zones during the flood was related to physical excess-air formation (Figure 3). ΔN2 surplus concentration, e.g., N2 that is not introduced in the groundwater by physical air/water partitioning and is the result of biological production was hardly detectable with the given experimental precision (< 3% of the total N2 concentration).
Discussion
Aerobic Respiration in the Riparian Groundwater During and After a Flood Event
The riparian groundwater at the restored section of the River Thur exhibits a strong spatial and temporal variability in the transport and transformation of DOC (Peter et al., 2012a). The willow bush zone is known to be a pronounced hot spot for microbial activity fuelled by labile DOC from the overlaying root and soil layer. Especially during flood events, high amounts of DOC are introduced into the groundwater. In this study, we therefore aimed at investigating in more detail the effect of a flood event and potential excess-air formation on DOC mineralization in different riparian zones and coupling our work to groundwater aeration in response to hydraulic changes (see Mächler et al., 2013).
As documented in Mächler et al. (2013), the amount of excess air formed by the studied flood varied significantly among the riparian zones. Only in the willow bush zone significant excess-air formation was observed. The O2 input due to excess air in this zone was found to be of the same order of magnitude as O2 input from the advection of river water into groundwater. In sharp contrast to the willow bush zone the excess-air formation in response to the flood was found to be very low in the gravel and grass zones. The clear zonation of the results suggest that the input of O2 into groundwater as a result of excess-air formation is controlled not only by the hydraulic conditions prevailing in the river and the groundwater, but also by geomorphological factors, like the thickness of the confining bed, which was different in the willow zone than in the other riparian zones. The gravel aquifer is too coarse to trap a significant amount of air during the water level rise whereas the confining clay layer hinders the escape of air from the subsoil to the surface, and hence is likely to be a key factor controlling the trapping and dissolution of air in groundwater. Root growth of the willows might influence soil structures, e.g., pore space, which may be an additional factor influencing excess-air formation in this riparian zone.
Following DOC, O2 (both measured and modeled as excess air input), and CO2 concentrations in different riparian zones during and after the small flood event resolved in detail the distribution of relevant compounds that drive biogeochemical processes (Figure 3). In the aquifer adjacent to the channel, respiration of riparian organic matter immediately reduced O2 concentrations about 70–90% and stochiometerically equally elevated CO2 levels compared to the open channel. River water can supply plenty of labile OC to riparian groundwater and stimulate microbial activity (Fischer et al., 2005; Romani et al., 2006). In the willow bush zone, during the flood event CO2 concentrations were substantially above the concentrations found in the gravel and grass zones, indicating a hot spot of microbial respiration. Also during the flood event, substantial amounts of O2 (~250 μmol L−1) were introduced into the willow bush groundwater by excess-air formation (Figure 3). This surplus O2 from hydraulically induced local air/water partitioning appears to be suddenly consumed by stimulated respiration activity, as elevated O2 concentration was not directly measurable in the groundwater. This locally injected and consumed O2 can explain a large fraction (~90%) of the CO2 being generated in response to the flood [Figure 3, see also Mächler et al. (2013)].
In a previous study in 2008 at the same field site, increased microbial enzymatic activity and secondary production were documented in the willow bush zone during flood events (Peter et al., 2012a). Based on those data, respiration rates were determined to be 0.18 μmol C L−1 h−1 in the willow bushes zone during flood events (Del Giorgio and Cole, 1998). We used the approach by Peter et al. (2012b) and the therein given groundwater discharge values from the same field site to calculate the respiration rate along the whole flow path in the willow bush zone, e.g., from the recharge area to the point of sampling. This yields a respiration rate of 8.1 μmol C h−1 for the willow bush zone. Hence, the elevated CO2 concentrations would be produced within 2.7 days at this calculated constant mineralization rate. As the water residence time is considerably longer (~4.5 days; Vogt et al., 2010) for this riparian zone, the increase in CO2 concentration appears to be the result of microbial respiration. The given rates only take in account free living bacteria, and the actual in situ rates might be even higher due to biofilm activity. It is likely that the elevation of the water table increases the connectivity of the aquifer with the overlaying willow root zone, a highly stimulating environment for bacteria (de Neergaard et al., 2002), and thereby promotes high microbial respiration activity in the groundwater.
Consumption of riverine DOC alone cannot explain the accumulation of CO2 measured within the willow bush zone, as the CO2 concentration there (590 μmol L−1) exceeded by far the DOC concentrations that could be provided by the river water (190–300 μmol L−1). The loss of DOC from the channel to the willow bush zone (DOC concentration difference channel to willow bush zone) accounted for only 65–175 μmol L−1. We calculated missing (not detectable) DOC concentration inputs for the groundwater pool to explain the measured CO2 production: ~25 μmol L−1 pre-flood, ~400 μmol L−1 during the flood, and a declining range from ~300 to ~100 μmol L−1 post flood. As both, DOC and O2 increase, was experimentally not detectable with the temporal resolution of the measurements we conclude that the flood activated a highly bioavailable OC source which is plausibly related to the soil or the roots of the willow plants and the mobilization through the rising water table (Peter et al., 2012a).
Effect of Excess Air on Nitrogen Transformation in Different Riparian Zones
Nitrogen transport and transformation within the riparian zone at the River Thur is known to be spatially and temporally highly variable in the transport and transformation of N (Peter et al., 2012b; Shrestha et al., 2014). The soils of the riparian zones act either as sink or source for inorganic N and flood events stimulate hot moments for N transformations. Nitrate removal through denitrification occurred both in the soils and in the riparian groundwater and appear to be locally constrained to the willow bush zone. Despite that the willow bush zone receives high amounts of labile DOC during flood events, which induces high microbial activity, denitrification was never observed during flood events. Only post flood (>1 week) and during average flow conditions, nitrate removal through denitrification is evident (Peter et al., 2012b).
This study covers on a finer resolution the functioning of the different riparian zones for N transformation processes during a flood event. We took advantage of the MIMS to be able to measure N2 concentrations, and distinguish between N2 excess due to excess-air formation in response to air/water partitioning and N2 being produced by denitrification. The gravel and grass zones close to the channel were dominated by N-dynamics in the river, e.g., by mainly reflecting river water concentrations (Figure 3). Denitrification might reduce some NO−3 in these zones, as after the flood event slightly increased N2O concentrations, an intermediate product of denitrification were measured. The lowest NO−3 concentrations within the entire riparian area were detected in the hot spot for OC respiration, the willow bush zone after the flood event. Denitrification might contribute to this reduction in NO−3 concentration because N2O and NO−2 accumulated there temporally shortly after the flood event (Figure 3). However, the N2 produced by denitrification (ΔN2), was in the range of the measurement error (3% ~30-40 μmol N L−1 Mächler et al., 2013) (Figure 3). Hence, it is not evident if denitrification contributed substantially to the decrease in NO−3 concentration (~50 μmol N L−1) occurring after the flood event in the willow bush zone. This is surprising since the willow bush zone receives substantial amounts of OC during flood events that fuels high microbial activity. We can exclude that dilution by a different groundwater source may have caused the low NO−3 concentrations in the willow bush zone, as this zone is hydrologically directly fed by the channel (Figure 1; Vogt et al., 2010). Other NO−3 consuming processes, such as microbial assimilation, dissimilative NO−3 reduction to ammonia, or plant uptake might be involved (Clement et al., 2003; Dhondt et al., 2003; Hefting et al., 2004). From previous isotopic investigations we have already presented evidence for plant uptake as a competitive NO−3 removal mechanism to denitrification for the same field site (Peter et al., 2012b).
Flood events play a key role for the functional development of the biogeochemical processes in the willow bush zone. The sampling campaign from May 2011 took place after a long dry period (Figure 2). The Pre-flood measurement indicate neither enhanced O2 respiration nor NO−3 removal, which was in sharp contrast to the biogeochemical dynamics during the flood when O2 was immediately respired (Figure 3) and previous observation during post-flood conditions were NO−3 was typically removed by denitrification (Peter et al., 2012b). The enhanced respiration during flood relates to flood induced aeration of the groundwater and OC mobilization from soil/root zone whereby O2 and DOC were instantly converted into CO2, causing DOC and O2 being almost completely depleted. The presence of injected O2 favors aerobic respiration and inhibits denitrification activity (Rivett et al., 2008), explaining the observed lack of denitrification during flood event in this study (Figure 3) and in previous studies at the fields site (Peter et al., 2012b). After such an “oxidative” disturbance of a system, N2O tends to accumulate (Naqvi et al., 2000; Verhoeven et al., 2006). The peaks in N2O and NO−2 concentrations 1 day after the flood event may relate to this phenomenon (Figure 3). However, N2O concentrations were low and may not be contributing significantly to greenhouse gas emissions. In the present investigation, DOC input seemed to be just enough to fuel O2 respiration but not the subsequent denitrification (i.e., only the downstream piezometer in the willow bush zone exhibited reduced NO−3 concentration). The investigated flood event was a minor and more intense flood events introduce higher OC loads, which could support more intense and longer anoxic periods and hence denitrification activity, as it was observed at this field site in previous studies 1 week after a flood event (Peter et al., 2012b).
Implications and Conclusions
This case study showed that excess-air formation, triggered by flood induced water table rise, fostered aerobic OC respiration due to local aeration of the riparian groundwater combined with high OC injection from the overlaying soil/root zone. On the other hand, the lack of denitrification activity during flood event indicated that high O2 input might have suppressed anaerobic respiration processes like denitrification despite the high availability of OC. Through the connectivity of the soil/root zones with the groundwater aquifer, the local variabilities in vegetation cover and aquifer structure can be important drivers for biogeochemical processes in the groundwater.
The in situ-gas determination by the field-installed MIMS successfully allowed to decipher the spatial and temporal variability of the biogeochemical processes related to different functional process zones. Only by calculating the contribution of excess air O2 and simultaneously measuring CO2 concentrations, the locally constrained effect of a flood event on microbial OC transformation could be demonstrated. Particularly, the existence of additional OC sources besides the river could be verified and the contribution to the groundwater OC pool estimated. The combination of biogeochemical monitoring with MIMS helped identifying and explaining the low N2 production by denitrification in a zone with high OC transformation. It is important to note that N2 production from denitrification in riparian aquifers can only be determined if the effect of atmospheric N2 introduction by excess-air formation is considered. Neglecting excess-air formation would have resulted in a significant overestimation of denitrification activity. However, with the given analytical precision it is also difficult to detect low biological N2 production. Studies of flood events of different magnitude and longer time series would improve the understanding of the biogeochemical role of excess air input into riparian systems.
Author Contributions
ED, BW, and RK contributed to the conceptual study design, data interpretation, critical revision and intellectual input. They approved the final version to be published and are accountable for all aspects of the work. LM and SP were involved in conception of the work, data acquisition and analysis, drafting and revision of the written part. They approved the final version to be published and are fully accountable for the work.
Conflict of Interest Statement
The authors declare that the research was conducted in the absence of any commercial or financial relationships that could be construed as a potential conflict of interest.
Acknowledgments
The authors thank Marco Baumann and Andreas Scholtis from the Agency for the Environment, Canton Thurgau, for their excellent support. We are grateful to Robert Brankatschk and Philipp Nauer (ETHZ) for their help with N2O analysis. This work is part of the project Assessment and Modeling of Coupled Ecological and Hydrological Dynamics in the Restored Corridor of a River (RECORD) and supported by the Competence Center Environment and Sustainability (CCES) of the ETH Domain and Eawag.
Supplementary Material
The Supplementary Material for this article can be found online at: https://www.frontiersin.org/article/10.3389/fenvs.2015.00075
Figure S1. Schematic view of a cross section through the different zones of the riparian aquifer at the restored field site at Niederneunforn (A). Simplified overview of the sampling set up using the membrane-inlet mass spectrometer (B) (modified from Mächler et al., 2012).
References
Abbaspour, K. C., Yang, J., Maximov, I., Siber, R., Bogner, K., Mieleitner, J., et al. (2007). Modelling hydrology and water quality in the pre-alpine/alpine Thur watershed using SWAT. J. Hydrol. 333, 413–430. doi: 10.1016/j.jhydrol.2006.09.014
Baker, M. A., and Vervier, P. (2004). Hydrological variability, organic matter supply and denitrification in the Garonne River ecosystem. Freshw. Biol. 49, 181–190. doi: 10.1046/j.1365-2426.2003.01175.x
Benner, R., and Strom, M. (1993). A critical-evaluation of the analytical blank associated with DOC measurements by high-temperature catalytic-oxidation. Mar. Chem. 41, 153–160. doi: 10.1016/0304-4203(93)90113-3
Binderheim-Bankay, E., Jakob, A., and Liechti, P. (2000). “NADUF - Messresultate 1977-1998”. Bern: Federal Office for the Environment (FOEN).
Blazejewski, G. A., Stolt, M. H., Gold, A. J., Gurwick, N., and Groffman, P. M. (2009). Spatial distribution of carbon in the subsurface of riparian zones. Soil Sci. Soc. Am. J. 73, 1733–1740. doi: 10.2136/sssaj2007.0386
Clement, J. C., Holmes, R. M., Peterson, B. J., and Pinay, G. (2003). Isotopic investigation of denitrification in a riparian ecosystem in western France. J. Appl. Ecol. 40, 1035–1048. doi: 10.1111/j.1365-2664.2003.00854.x
de Neergaard, A., Porter, J. R., and Gorissen, A. (2002). Distribution of assimilated carbon in plants and rhizosphere soil of basket willow (Salix viminalis L.). Plant Soil 245, 307–314. doi: 10.1023/A:1020414819264
Del Giorgio, P. A., and Cole, J. J. (1998). Bacterial growth efficiency in natural aquatic systems. Annu. Rev. Ecol. Syst. 29, 503–541. doi: 10.1146/annurev.ecolsys.29.1.503
Dev (2004). Deutsches Einheitsverfahren zur Wasseruntersuchung (DEW). Weimheim: Wiley-VCH Verlag GmbH.
Dhondt, K., Boeckx, P., van Cleemput, O., and Hofman, G. (2003). Quantifying nitrate retention processes in a riparian buffer zone using the natural abundance of N-15 in NO3-. Rapid Commun. Mass Spectrom. 17, 2597–2604. doi: 10.1002/rcm.1226
Findlay, S., and Sinsabaugh, R. L. (2003). Aquatic Ecosystems: Interactivity of Dissolved Organic Matter. San Diego, CA: Academic Press.
Fischer, H., Kloep, F., Wilzcek, S., and Pusch, M. T. (2005). A river's liver - microbial processes within the hyporheic zone of a large lowland river. Biogeochemistry 76, 349–371. doi: 10.1007/s10533-005-6896-y
Heaton, T. (1981). “Excess air” in groundwater. J. Hydrol. 50, 201–216. doi: 10.1016/0022-1694(81)90070-6
Hefting, M., Clement, J., Dowrick, D., Cosandey, A., Bernal, S., Cimpian, C., et al. (2004). Water table elevation controls on soil nitrogen cycling in riparian wetlands along a European climatic gradient. Biogeochemistry 67, 113–134. doi: 10.1023/B:BIOG.0000015320.69868.33
Hill, A. R., Devito, K. J., Campagnolo, S., and Sanmugadas, K. (2000). Subsurface denitrification in a forest riparian zone: interactions between hydrology and supplies of nitrate and organic carbon. Biogeochemistry 51, 193–223. doi: 10.1023/A:1006476514038
Hinkle, S., Duff, J., Triska, F., Laenen, A., Gates, E., Bencala, K., et al. (2001). Linking hyporheic flow and nitrogen cycling near the Willamette River—a large river in Oregon, USA. J. Hydrol. 244, 157–180. doi: 10.1016/S0022-1694(01)00335-3
Huber, B., Luster, J., Bernasconi, S. M., Shrestha, J., and Pannatier, E. G. (2012). Nitrate leaching from short-hydroperiod floodplain soils. Biogeosciences 9, 4385–4397. doi: 10.5194/bg-9-4385-2012
Kipfer, R., Aeschbach-Hertig, W., Peeters, F., and Stute, M. (2002). Noble gases in lakes and ground waters. Rev. Mineral. Geochem. 47, 615. doi: 10.2138/rmg.2002.47.14
Klump, S., Tomonaga, Y., Kienzler, P., Kinzelbach, W., Baumann, T., Imboden, D., et al. (2007). Field experiments yield new insights into gas exchange and excess air formation in natural porous media. Geochim. Cosmochim. Acta 71, 1385–1397. doi: 10.1016/j.gca.2006.12.006
Mächler, L., Brennwald, M. S., and Kipfer, R. (2012). Membrane inlet mass spectrometer for the quasi continuous on-site analysis of dissolved gases in groundwater. Environ. Sci. Technol. 46, 8288–8296. doi: 10.1021/es3004409
Mächler, L., Peter, S., Brennwald, M., and Kipfer, R. (2013). Excess air formation as a mechanism for delivering oxygen to groundwater. Water Resour. Res. 49, 6847–6856. doi: 10.1002/wrcr.20547
Mayer, P. M., Groffman, P. M., Striz, E. A., and Kaushal, S. S. (2010). Nitrogen dynamics at the groundwater-surface water interface of a degraded urban stream. J. Environ. Qual. 39, 810–823. doi: 10.2134/jeq2009.0012
McClain, M. E., Boyer, E. W., Dent, C. L., Gergel, S. E., Grimm, N. B., Groffman, P. M., et al. (2003). Biogeochemical hot spots and hot moments at the interface of terrestrial and aquatic ecosystems. Ecosystems 6, 301–312. doi: 10.1007/s10021-003-0161-9
Naqvi, S. W., Jayakumar, D. A., Narvekar, P. V., Naik, H., Sarma, V., D' Souza, W., et al. (2000). Increased marine production of N2O due to intensifying anoxia on the Indian continental shelf. Nature 408, 346–349. doi: 10.1038/35042551
Pasquale, N., Perona, P., Schneider, P., Shrestha, J., Wombacher, A., and Burlando, P. (2010). Modern comprehensive approach to monitor the morphodynamic evolution of restored river corridors. Hydrol. Earth Syst. Sci. Discuss. 7, 8873–8912. doi: 10.5194/hessd-7-8873-2010
Pauwels, H., Foucher, J. C., and Kloppmann, W. (2000). Denitrification and mixing in a schist aquifer: influence on water chemistry and isotopes. Chem. Geol. 168, 307–324. doi: 10.1016/S0009-2541(00)00201-1
Peter, S., Koetzsch, S., Traber, J., Bernasconi, S. M., Wehrli, B., and Durisch-Kaiser, E. (2012a). Intensified organic carbon dynamics in the groundwater of a restored riparian zone. Freshw. Biol. 57, 1603–1616. doi: 10.1111/j.1365-2427.2012.02821.x
Peter, S., Rechsteiner, R., Lehmann, M. F., Brankatschk, B., Vogt, T., Diem, S., et al. (2012b). Nitrate removal in a restored riparian groundwater system: functioning and importance of individual riparian zones. Biogeosciences 9, 4295–4307. doi: 10.5194/bg-9-4295-2012
Rivett, M. O., Buss, S. R., Morgan, P., Smith, J. W., and Bemment, C. D. (2008). Nitrate attenuation in groundwater: a review of biogeochemical controlling processes. Water Res. 42, 4215–4232. doi: 10.1016/j.watres.2008.07.020
Romaní, A. M., Vázquez, E., and Butturini, A. (2006). Microbial availability and size fractionation of dissolved organic carbon after drought in an intermittent stream: biogeochemical link across the stream-riparian interface. Microb. Ecol. 52, 501–512. doi: 10.1007/s00248-006-9112-2
Schneider, P., Vogt, T., Schirmer, M., Doetsch, J., Linde, N., Pasquale, N., et al. (2011). Towards improved instrumentation for assessing river-groundwater interactions in a restored river corridor. Hydrol. Earth Syst. Sci. Discuss. 8, 2503–2553. doi: 10.5194/hessd-8-2503-2011
Shrestha, J., Niklaus, P., Pasquale, N., Huber, B., Barnard, R., Frossard, E., et al. (2014). Flood pulses control soil nitrogen cycling in a dynamic river floodplain. Geoderma 228, 14–24. doi: 10.1016/j.geoderma.2013.09.018
Sobczak, W. V., and Findlay, S. (2002). Variation in bioavailability of dissolved organic carbon among stream hyporheic flowpaths. Ecology 83, 3194–3209. doi: 10.1890/0012-9658(2002)083[3194:VIBODO]2.0.CO;2
Thorp, J. H., Thoms, M. C., and Delong, M. D. (2006). The riverine ecosystem synthesis: biocomplexity in river networks across space and time. River Res. Appl. 22, 123–147. doi: 10.1002/rra.901
Verhoeven, J. T., Arheimer, B., Yin, C., and Hefting, M. M. (2006). Regional and global concerns over wetlands and water quality. Trends Ecol. Evol. 21, 96–103. doi: 10.1016/j.tree.2005.11.015
Vogt, T., Hoehn, E., Schneider, P., Freund, A., Schirmer, M., and Cirpka, O. (2010). Fluctuations of electrical conductivity as a natural tracer for bank filtration in a losing stream. Adv. Water Resour. 33, 1296–1308. doi: 10.1016/j.advwatres.2010.02.007
Weiss, R. F., and Price, B. A. (1980). Nitrous-oxide solubility in water and seawater. Mar. Chem. 8, 347–359. doi: 10.1016/0304-4203(80)90024-9
Keywords: excess air, organic carbon, flood, denitrification, riparian groundwater, spatial and temporal variability
Citation: Peter S, Mächler L, Kipfer R, Wehrli B and Durisch-Kaiser E (2015) Flood-Controlled Excess-Air Formation Favors Aerobic Respiration and Limits Denitrification Activity in Riparian Groundwater. Front. Environ. Sci. 3:75. doi: 10.3389/fenvs.2015.00075
Received: 11 June 2015; Accepted: 09 November 2015;
Published: 25 November 2015.
Edited by:
Prosun Bhattacharya, KTH Royal Institute of Technology, SwedenReviewed by:
Sutapa Bose, Indian Institute of Science Education and Research Kolkata, IndiaFrantisek Buzekfrantisek.buzek@, Czech Geological Survey, Czech Republic
Copyright © 2015 Peter, Mächler, Kipfer, Wehrli and Durisch-Kaiser. This is an open-access article distributed under the terms of the Creative Commons Attribution License (CC BY). The use, distribution or reproduction in other forums is permitted, provided the original author(s) or licensor are credited and that the original publication in this journal is cited, in accordance with accepted academic practice. No use, distribution or reproduction is permitted which does not comply with these terms.
*Correspondence: Simone Peter, simone.peter@ebc.uu.se