Vehicle Emission Factors of Solid Nanoparticles in the Laboratory and on the Road Using Portable Emission Measurement Systems (PEMS)
 Barouch Giechaskiel*
  Francesco Riccobono Theodoros Vlachos Pablo Mendoza-Villafuerte
  Ricardo Suarez-Bertoa Georgios Fontaras Pierre Bonnel Martin Weiss
- Sustainable Transport Unit, Joint Research Centre, Institute for Energy and Transport, European Commission, Varese, Italy
Emission inventories are used to quantify sources and identify trends in the emissions of air pollutants. They use vehicle-specific emission factors that are typically determined in the laboratory, through remote-sensing, vehicle chasing experiments and, more recently, on-board measurements with Portable Emission Measurement Systems (PEMS). Although PEMS is widely applied to measure gaseous pollutants, their application to Solid Particle Number (SPN) emissions is new. In this paper, we discuss the current status of determining SPN emission factors both on the chassis dynamometer in the laboratory and on the road using PEMS-SPN. First, we determine through dedicated tests in the laboratory the influence of the measurement equipment, ambient temperature, driving style, and cycle characteristics, and the extra mass of the PEMS equipment on the SPN emissions of vehicles. Afterward, we present the SPN emissions under type-approval conditions as well as on the road of two heavy-duty diesel vehicles equipped with Diesel Particulate Filter (DPF; one of them Euro VI), two light-duty diesel vehicles equipped with DPF, one light-duty vehicle equipped with a Port Fuel Injection engine (PFI), and seven Gasoline Direct Injection (GDI) passenger cars (two of them Euro 6). We find that cold-start and strong accelerations tend to substantially increase SPN emissions. The two heavy-duty vehicles showed on-road emissions around 2 × 10¹³ p/km (Euro V truck) and 6 × 10¹⁰ p/km (Euro VI truck), respectively. One of the DPF-equipped light-duty vehicles showed emissions of 8 × 10¹¹ p/km, while the other one had one order of magnitude lower emissions. The PFI car had SPN emissions slightly higher than 1 × 10¹² p/km. The on-road emissions of GDI passenger cars spanned approximately from 8 × 10¹¹ p/km to 8 × 10¹² p/km. For the cars not equipped with a DPF, the on-road SPN emissions remained within a factor of two of the laboratory results. This factor was on average around 0.8 for the Euro 6 and 1.6 for the Euro 5 GDIs. The DPF equipped vehicles showed a difference of almost one order of magnitude between laboratory and on-road tests due to the different DPF fill state and passive regeneration during the tests. The findings of this study can (i) help improving the inventories on SPN emissions and (ii) assist policy makers in designing effective test procedures for measuring the SPN emissions of vehicles under real-world driving conditions.
Introduction
Particulate Matter (PM) has been shown to have a negative impact on the human health. Epidemiological studies (e.g., Pope, 2000) and toxicological studies (e.g., Oberdörster, 2000) have associated urban PM pollution with carcinogenic and adverse respiratory and cardio-vascular effects. Recent reviews (EPA, 2009; HEI, 2013; WHO, 2013) concluded that adverse health effects are best linked to an exposure to PM with an equivalent aerodynamic diameter below 2.5 μm. However, a number of studies also suggest that the inflammatory response to particles from non-toxic materials correlates more closely with particle surface area rather than particle mass (e.g., Sager and Castranova, 2009). Nanoparticles of a diameter below 2.5 μm are considered more harmful than larger particles because they have a larger specific surface area and higher deposition fraction in the human respiratory tract. Moreover, inhaled ultrafine solid nanoparticles (< 100 nm) may pass through the lungs' alveolar membrane and via the blood to the heart and other organs where they can directly exert a toxic effect (translocation effect; Oberdörster et al., 2004). Thus, ultrafine Particle Number (PN) emissions have recently gained the attention of toxicologists and environmental policy makers.
Around 20% of the European Union's (EU) urban population lives in areas where the daily air quality standard for PM with a diameter smaller than 10 μm (50 μg/m3) was exceeded in 2010 (Sundvor et al., 2012; EEA, 2014). Exceedances of the PM standard (< 10 μm) occur most frequently in urban locations with dense road traffic. Quantification of the traffic contribution to PM levels in urban areas is complex, due to the many sources of primary PM emissions and due to the formation of secondary PM from precursor gases such as nitrogen oxides and volatile organic compounds emitted by vehicles and other sources. Road traffic contributes some 9–66% to the urban PM concentrations, with an average estimate of 34% in the vicinity of urban traffic sites and 15% at urban background sites. The contribution of road traffic to PN pollution is larger (60%) due to the high number of nuclei particles formed from the unburnt fuel and lubricant or secondary formation, reaching 90% in cases of busy roads (Kumar et al., 2014 and references therein).
The contribution of vehicle emissions to air pollution is typically quantified with emission inventories (EMEP/EEA, 2013). An emission inventory lists the total emissions of a specific component, disaggregated into source categories relevant in a certain geographical area and within a specified time span. Emission inventories are used since the 1970s for scientific research but also for air quality management and environmental policy making. In the context of road transport, emission inventories are specifically used to monitor the effectiveness of the vehicle emissions legislation and the emissions reduction resulting from new vehicles entering the fleet. The vehicle emission factors are a key input for emission inventories relative to on road transportation. These are typically implemented as default values in the various calculation tools (e.g., COPERT, MOVES, HBEFA) and frequently updated using experimental results (e.g., Boulter and McCrae, 2007). However, while data on gaseous emissions are generally readily available from laboratory and on-road measurements (e.g., Ntziachristos and Galassi, 2014), experimental data for PN emissions are limited. In addition, PN emission measurements are not always comparable due to differences in sampling conditions and instruments used (Keogh and Sonntag, 2011).
The European regulation on particle emissions was initially based solely on the smoke levels recorded by opacity meters (Giechaskiel et al., 2014a). However, over the past 35 years, the regulatory method has adopted the gravimetric quantification of PM collected on filters while the vehicle is driven on a prescribed speed profile (test cycle). With the introduction of Diesel Particulate Filters (DPFs) around the year 2000, the gravimetric method was no longer sensitive enough to measure very low PM emissions. To address the situation, in 2001, the United Nations Economic Commission for Europe (UN-ECE) launched the Particle Measurement Programme (PMP) to develop a new and sufficiently sensitive, precise, and representative measurement methodology (Martini et al., 2009). In addition to an improved PM filter method, the Solid Particle Number (SPN) measurement method proposed by PMP in 2007, based on the counting of solid particles with a diameter larger than 23 nm, was integrated into the European emissions regulation in 2011 for diesel light-duty vehicles (Euro 5b)1 (EC, 2007; Giechaskiel et al., 2008a), in 2014 for Gasoline Direct Injection (GDI) light-duty vehicles (Euro 6) and in 2013 for heavy-duty engines (Euro VI; EC, 2009; Giechaskiel et al., 2012a). A minimum diameter of 23 nm size was selected in order to include the primary soot particles and exclude volatile nucleation mode particles (see Giechaskiel et al., 2014a). Volatile particles were excluded in order to improve the repeatability and reproducibility of the method to levels acceptable for legislative purposes. The limit is 6 × 10¹¹ p/km (or p/kWh for heavy-duty engines) for the transient type approval test cycle. The limit for GDIs was set to 6 × 10¹² p/km in 2014 but it will decrease to 6 × 10¹¹ p/km in 2017.
The vehicle regulations in both the United States of America (US) and the European Union (EU), also address emissions from in-use vehicles. In-service conformity (or in-use compliance in the US) requires laboratory testing of vehicles recruited from the vehicle fleet that is actually operated on the road. Recently this has been augmented by regulations requiring on-board in-service conformity emissions testing of heavy-duty vehicles (EC, 2011) with Portable Emission Measurement Systems (PEMS; Bonnel et al., 2006; EPA, 2008; Perujo and Mendoza-Villafuerte, 2015). Moreover, the European Commission (EC) is currently introducing a complementary and mandatory PEMS on-road test procedure, the so-called Real-Driving Emissions (RDE) procedure for light-duty vehicles (EC, 2012; Weiss et al., 2013; Vlachos et al., 2014). These initiatives aim at reducing the large differences that are found between laboratory and on-road measurements, particularly with respect to the NOx emissions of light-duty diesel vehicles (Weiss et al., 2011a, 2012; Fontaras et al., 2014; Franco et al., 2014; Vlachos et al., 2014). A detailed discussion of in-use emissions testing with PEMS can be found in Vlachos et al. (2014). SPN measurements with PEMS is at the final stages of investigation for light duty vehicles and recently a program started for the applicability of SPN measurements for the in-service conformity testing of heavy-duty vehicles. However, for SPN, information about the difference between laboratory and on-road emissions is limited (Andersson et al., 2014).
The main objective of this article is to give an overview of the status of SPN emissions from trucks and passenger cars under real-driving conditions based on experimental data of 2 heavy-duty vehicles and 10 light-duty vehicles. The measured SPN emission levels are compared with the literature and the regulated emission limits. A second objective of this study is to analyze and discuss differences in the SPN emissions between chassis dynamometer studies and on-road measurements using the same vehicles. We focus our analysis on the effect of some parameters on particle number measurements (i.e., uncertainty of SPN instruments for on-board application, DPF load level, ambient temperature, vehicle mass, driving style, and driving cycle). The findings of this study can (i) help improving the emission inventories on SPN emissions and (ii) assist policy makers in designing effective test procedures for measuring SPN on-board of vehicles.
Background Information
The PN emissions of vehicles can be determined in the same ways that are used to determine gaseous emissions, namely through remote-sensing measurements at the roadside, tunnel studies, vehicle chasing experiments, chassis dynamometer measurements, and on-board measurements with PEMS during the actual vehicle use (for details see Franco et al. (2013) and references therein). Here only studies focusing on PN will be discussed.
Remote-sensing measurements, also referred to as “roadside measurement,” determine the instantaneous ratios of pollutant concentrations as vehicles pass by a measurement station on the roadway (Pant and Harrison, 2013). Remote-sensing enables monitoring the emissions of large numbers of vehicles (up to thousands per day) and offers the necessary resolution to identify emission levels of single vehicles, whose emission technology may be determined by video recording of license plates and cross-referencing with vehicle registration databases. On the other hand, remote-sensing only gives an instantaneous (snapshot) estimate of emissions at a specific location under specific operating conditions, and cannot be used across multiple lanes of heavy traffic. Thus, it is difficult to derive emission factors that are representative of the wide range of vehicle operations from remote-sensing measurements only. Remote-sensing particle measurements include emissions from combustion, tires, brakes and the secondary particles formed in the atmosphere (Pant and Harrison, 2013), although sometimes tracers can be used to apportion the contribution of each source. Moreover, remote-sensing needs to carefully deal with unstable weather and background pollution levels, that hinder the evaluation of the actual vehicle emissions.
Tunnel studies involve measuring the total flux of pollutants from vehicles passing through a tunnel and correlating the pollutant flux to the traffic flow. An advantage of tunnel studies is that, contrary to remote-sensing measurements, the wind conditions are well defined. The average absolute levels of emissions can be obtained. Tunnel studies are thus able to capture a cross-section of the on-road vehicle fleet under real-world operation conditions at the location of the tunnel. These, in turn, may not be typical of the wide range of real-world driving conditions (specifically those in urban environments), since tunnels are usually traversed at steady speed. As a notable disadvantage, tunnel studies usually do not allow allocating emissions to specific vehicle classes unless different tunnel bores are dedicated to them. PN measurements from both roadside and tunnel studies typically include solid and volatile particles and non-exhaust emissions particles from tire wear and road dust (see reviews of Morawska et al., 2008; Keogh et al., 2010).
During vehicle chasing experiments, individual vehicles are followed by a mobile laboratory on a van or trailer (Vogt et al., 2003; Giechaskiel et al., 2005; Ježek et al., 2015) that capture the exhaust plume of the vehicle being followed, thus providing real-world emissions data under a wide range of operating conditions (Kittelson et al., 2000, 2006a,b). Vehicle chasing experiments make it possible to study a statistically representative sample of vehicles for fleet characterization. However, such experiments are best conducted on a test track to avoid obstructing traffic safety. Comparisons between laboratory and chasing experiments at constant speed showed good agreement for particles in the accumulation mode regime (peak around 50–100 nm; Casati et al., 2007; Giechaskiel et al., 2007a) and qualitative good agreement for particles in the (volatile) nucleation mode regime (peak < 30 nm; Rönkkö et al., 2006; Casati et al., 2007; Giechaskiel et al., 2007a). However, the diluted exhaust of low emitting vehicles (i.e., those with particulate filters) will be at the levels of the ambient air particle background (Bergmann et al., 2009); thus the results will have high uncertainty and variability.
During chassis dynamometer testing, the vehicle remains stationary as a driver operates it in a test cell according to a predetermined time-speed profile and gear shift pattern shown on a monitor. In vehicle regulations around the world, chassis dynamometer testing is specified as the primary measurement method for verifying vehicle emissions [e.g., Regulation 83, UN/ECE (2015)] due to its high accuracy and repeatability compared to other methods. Climatically controlled test cells can simulate driving under a wide range of temperatures, including sub-zero tests (currently, the European emissions regulation covers the temperature range of down to −7°C); however, to date only a few laboratories can simulate driving at high altitude, i.e., at low ambient pressure. Chassis dynamometer testing does not capture the wide dynamicity range of real-world driving and may thus underestimate the on-road emissions of vehicles (Pelkmans and Debal, 2006). Moreover, the driving resistance that simulates road load is obtained from vehicle coast-down tests under artificially favorable conditions, thus frequently yielding lower fuel consumption and emission results as compared to real-world on-road driving (Mellios et al., 2011). In addition, especially for particles, the sampling conditions in the laboratory (e.g., dilution ratio, dilution temperature, etc.) can affect the measurement result (e.g., Khalek et al., 1999) to the extent that the measured particle mass and number emissions might not be representative of the actual emissions on the road (Vogt et al., 2003). Secondary particle formation from volatile species in the atmosphere (see e.g., Keogh and Sonntag, 2011) can lead to significant differences between particle emissions measured by roadside studies and on the chassis dynamometer, although in many cases there is a good agreement between both methods (Beddows and Harrison, 2008 and references therein). Chassis dynamometer tests are still the most important source of SPN emission factors (see e.g., review of Giechaskiel et al., 2012a and references therein).
On-board measurements are conducted with PEMS, mounted inside the vehicle cabin or outside thereof on a tow bar. PEMS on-board measurements can provide long series of emission data of a particular vehicle driven under a wide range of operating conditions, including those that would otherwise be difficult to replicate in the laboratory (e.g., large road gradients, strong accelerations). However, with PEMS only a relatively limited number of vehicles compared to remote-sensing can be tested with a given effort. In the past decade, extensive programs have confirmed the ability of PEMS to measure gaseous pollutants at a quality similar to that achieved by certification laboratories (Rubino et al., 2007; EPA, 2008; Johnson et al., 2009a; Bonnel et al., 2011). PEMS for PM measurement have been developed in the past 5 years with satisfactory results (Johnson et al., 2009b, 2011; Giechaskiel et al., 2011; Mamakos et al., 2013a; Mendoza-Villafuerte et al., 2015).
PEMS for PN have been used in a few studies (Bergmann et al., 2009; Li et al., 2013). However, PEMS that measure solid PN (PEMS-SPN) similarly to the regulated SPN systems became available only recently and were assessed in a comprehensive program by Giechaskiel et al. (2014b, 2015). The technical specifications of PEMS-SPN for regulatory purposes have not been finalized yet. To date, there are two measurement principles available to measure SPN emissions with PEMS: (i) diffusion charging (Fierz et al., 2008) and (ii) condensation particle counting that represents the measurement principle applied in the regulated PMP systems (Giechaskiel et al., 2009). Both principles measure PN emissions after thermal pre-treatment of the exhaust. One particular issue of mobile SPN measurements refers to emissions sampling directly from the tailpipe; the resulting SPN counts might not be identical to those measured by following the regulated procedure at the full dilution tunnel that alters particle properties due to e.g., coagulation, thermophoresis, diffusion etc. Comparisons of PEMS-SPN with reference PMP systems, especially during on-board operation, as well as of emissions of vehicles both in the laboratory and during on-road driving are still scarce (e.g., Merkisz et al., 2009; Andersson et al., 2014). Quite often high differences between laboratory and on-road testing are found (Andersson et al., 2014). Other reasons of differences between PEMS-SPN and chassis dynamometer SPN results include the typical effect of on-road operating conditions (extra vehicle mass, auxiliaries, aerodynamics), the driver, the route, the traffic, and the road conditions (road morphology, altitude, road gradients, etc.; see also Zacharof et al., 2015 and references therein). Although the effect of the above parameters has been discussed for fuel consumption and to some extent gaseous pollutant emissions (Weiss et al., 2011a, 2012), their effect on SPN has only been touched recently (e.g., Clark et al., 2002; Wang et al., 2006; Barrios et al., 2012; Huang et al., 2013; Li et al., 2013). Additional research is needed.
Experimental Methods and Materials
The heavy-duty and light-duty vehicles were tested both in the laboratory and on the road using the same SPN equipment.
Test Vehicles and Fuels
We tested two heavy-duty vehicles and 10 light-duty vehicles (Table 1). All test vehicles complied during laboratory testing under type-approval conditions with their respective emissions limit. The test fleet included diesel vehicles equipped with a DPF and gasoline vehicles with Port Fuel injection (PFI) or direct injection (GDI) engines equipped with Three-Way Catalyst (TWC) (Table 1). The light-duty vehicles were mainly Euro 5 (two Euro 6). The tested light-duty vehicles mainly comprised passenger cars of Category M1. Exceptions constitute vehicles DPF #1 and #2 which were vans of Category N1. The heavy-duty vehicles were of Category N3. One of the heavy-duty vehicles was certified as Euro V and the other as Euro VI; both vehicles were equipped with a DPF. The heavy-duty trucks weighted ~18 tons; an extra load of 8 tons was added during the on-road tests.
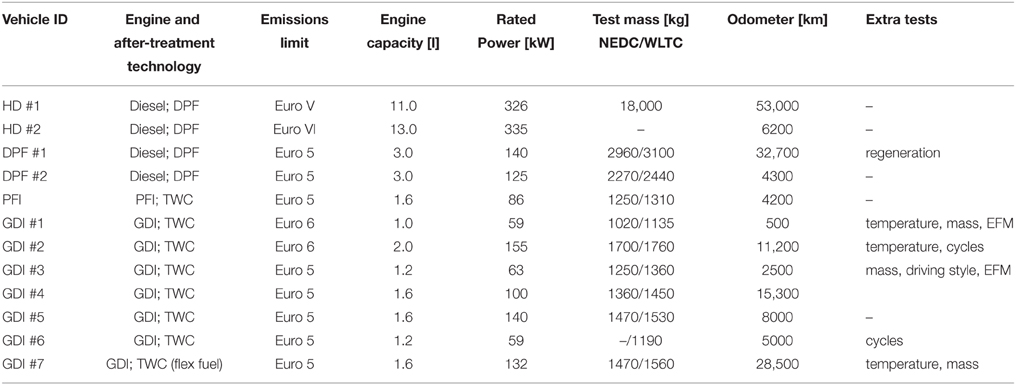
Table 1. Characteristics of test vehicles and extra evaluation tests in the laboratory.
All chassis dynamometer and on-road tests were conducted with market fuels compliant with the standards EN 228 and EN 590 for gasoline and diesel fuels, respectively. The ethanol content of the gasoline fuel was < 7%; the sulfur content of the diesel fuel was < 10 ppm. Due to the low mileage of all tested vehicles, we assume that the lubricants were the manufacturer's factory-fill products.
Laboratory
The laboratory tests were conducted in the Vehicle Emissions Laboratory (VELA 2 for light-duty and VELA 7 for the heavy-duty vehicle) of the Joint Research Centre (JRC) in Italy. All light-duty vehicles were tested on a 2 axis roller dynamometer. The exhaust gas was connected to the full dilution tunnel with a 6 m tube heated at 100°C. Typical flow rates of 9–12 and 100 m3/min were used at the full dilution tunnel with constant volume sampling (CVS; Giechaskiel et al., 2007b) for the light-duty and heavy-duty vehicles, respectively. SPN instruments (see description below) were used both at the dilution tunnel and at the tailpipe of the vehicles.
Test Cycles in the Laboratory
The Euro V heavy-duty vehicle was tested under cold and hot start conditions with the Worldwide Harmonized Vehicle Cycle (WHVC), i.e., a chassis dynamometer test developed based on the same set of data used for the development of the World Harmonized Transient Cycle (WHTC) for heavy-duty engines [which replaced the European Transient Cycle (ETC) since Euro VI]. Unlike the WHTC, however, testing with the WHVC does not follow a standardized procedure; the WHVC is not used for regulatory testing. The dyno settings were not available from the vehicle manufacturers. We thus used the values from similar trucks.
The light-duty vehicles were tested over three different driving cycles, each consisting of several phases (Table 2):
• New European Driving Cycle (NEDC) consisting of an Urban Driving Cycle (UDC) and an Extra Urban Driving Cycle (EUDC); the NEDC cycle is currently used for type-approval within the EU;
• Worldwide Harmonized Light vehicles Test Cycle (WLTC) consisting of a low-speed, medium-speed, high-speed, and extra high-speed phase; this cycle is considered more representative of real-world driving than the NEDC and will likely be used for type-approval within the EU from 2017 onward;
• Random Cycles (RC) consisting of three phases of ~900 s each that resemble soft (RC_A), medium (RC_B), and severe (RC_C) driving on European roads. Each phase consists of a low-speed, medium-speed and high-speed portion. The RC was developed by the RDE working group of the European Commission during the development of the RDE on-road test procedure (Weiss et al., 2013).
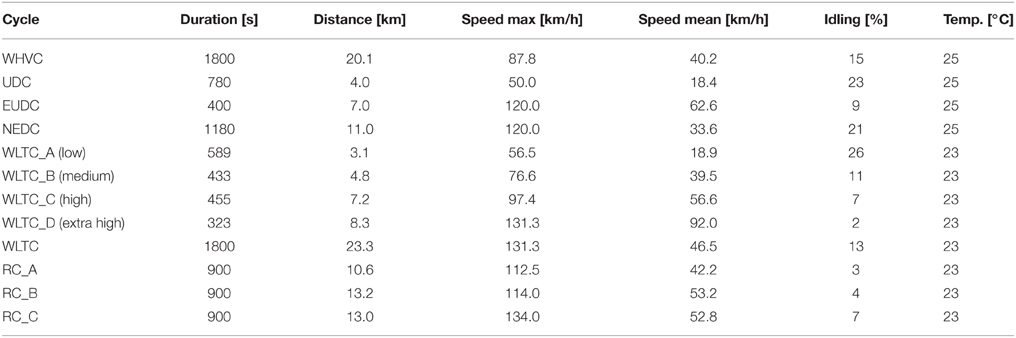
Table 2. Characteristics of driving cycles.
The speed profile of all cycles can be found in the Supplementary Material A (Figures S1–S3).
Unless specified otherwise, the NEDC and WLTC tests were conducted with a cold engine as required by the regulation. At least two repetitions of the NEDC and WLTC were conducted with each vehicle. Tests with more cycles were conducted with Vehicles GDI #1, #2, #3, #6, and #7 and Vehicle DPF #1. All tests were conducted with the same driver. One vehicle (GDI #3) was driven by four drivers to analyze the effect of the driving style on the SPN emissions. Vehicle DPF #1 was tested with various cycles (i.e., under cold and hot start conditions, as well as at various ambient temperatures) until the DPF was regenerated. Then cycles were run again until a second regeneration. A third sequence of cycles was initiated but the tests were stopped before the regeneration.
All test masses and dyno coefficients for NEDC testing were (i) used as given by the vehicle manufacturers (Vehicles DPF#1, DPF #2, PFI, GDI #5, GDI #6) or (ii) taken from Regulation 83 (UN/ECE, 2015) after weighing the vehicle and adding 100 kg for driver and fuel when vehicle manufacturer's data were not available. The test masses for WLTC and the RC testing were chosen according to the Worldwide Harmonized Light vehicles Test Procedure (WLTP); the implemented values exceeded those used for NEDC testing by 6% on average (see Table 1).
The WLTC tests with Vehicles GDI #1 (three repetitions) and GDI #3 (two repetitions) were conducted with a higher dyno inertia to match the elevated vehicle mass during on-road tests, caused by the PEMS equipment and a co-driver. The dyno coefficients were adjusted to the new inertia.
The laboratory tests were in general conducted at room temperature of 23–25°C. Some tests with Vehicles GDI #1, #2, and #7 were conducted at temperatures of 8° and −7°C (three repetitions at each temperature). For the tests at −7°C, the chassis dyno coefficients were increased by 10% as required by Regulation 83 (UN/ECE, 2015). It should be noted that Regulation 83 requires to conduct the low-temperature test at −7°C only over the UDC phase of the NEDC; for this test, there is no limit for SPN emissions defined.
All vehicles were pre-conditioned with the required cycle the day before as stated in Regulation 83 (UN/ECE, 2015).
On-Board Testing with PEMS
The procedures described in Regulation 582/2011 for in-service conformity testing of heavy-duty vehicles (EC, 2011) and the proposal on the RDE test procedure for the type-approval for light-duty vehicles (Proposal for Annex IIIA, Regulation 692/2008) were followed as close as possible. However, instead of employing an analyzer for gaseous components, our PEMS consisted of a Global Positioning System (GPS), an exhaust flowmeter (EFM), and the respective SPN instrument, i.e., a PEMS-SPN (NanoMet 3, Testo) and/or a PMP-TP (NanoMet 1, Testo; see description below). The total weight of the PEMS, including batteries and the flowmeter, was estimated to be 100 kg (160 kg when both PEMS-SPN and PMP-TP systems were on-board). Vehicles GDI #1, #3, and #5 were also tested with the analyzer for gaseous components in order to measure CO2 emissions and apply the future RDE data evaluation method.
The vehicles were tested at routes which capture urban, rural and highway driving, with an average trip length of ~100 km and an average speed of 50 km/h (see Table 3). The DPF and the PFI vehicles were tested only on urban and rural routes with an average distance of 50 km. Vehicle GDI #7 was not tested on the road. Route 1 and 4 consist mainly of rural and motorway driving, Route 2 captures urban and rural driving, while Route 3 is a rural route with steep uphill and downhill parts (up to 1100 m.a.s.l.). The other routes are located at an elevation between 200 and 400 m.a.s.l. Table 3 summarizes the number of routes and their characteristics for each vehicle. Details can be found in Weiss et al. (2011b) (see Figure S4 in the Supplementary Material A). The driver for the on-road tests was different from the drivers in the laboratory.
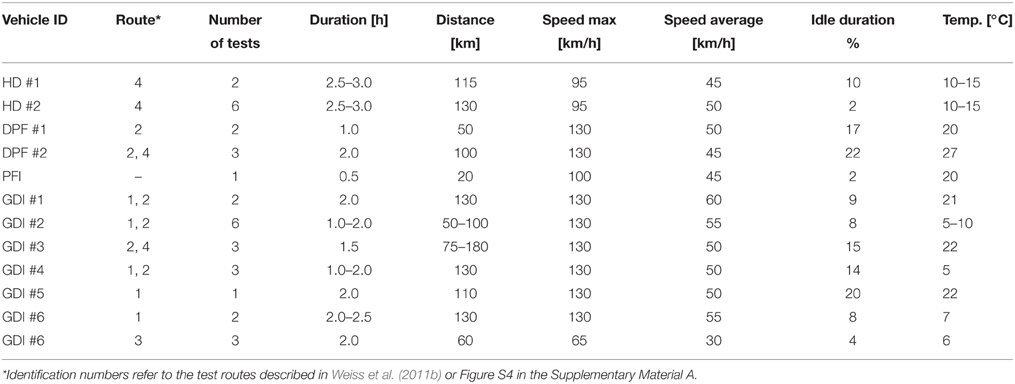
Table 3. Characteristics of on-road test routes.
SPN Equipment
A SPN measurement system (AVL APC 489) compliant with the light-duty vehicles Regulation 83 (UN/ECE, 2015) and regulation 49 for heavy-duty engines (UN/ECE, 2013) was used at the full dilution tunnel of the laboratory (Giechaskiel et al., 2010a). The system consists of a hot dilution at 150°C, an evaporation tube at 350°C and a secondary dilution at ambient temperature. The system was calibrated by the manufacturer. The chosen dilution including the particle losses (as average of sizes 30, 50, and 100 nm) is referred to as Particle number Concentration Reduction Factor (PCRF). In our experiments, we typically, used a primary PCRF of 100 and a secondary of 10. Downstream of the thermal pre-treatment system, a Condensation Particle Counter (CPC; TSI 3790) with 50% counting efficiency at 23 nm (d50% = 23 nm) was connected. The application of hot dilution and the evaporation tube with a CPC of d50% = 23 nm follows the protocol defined in the Particle Measurement Program (PMP) and is used accordingly for regulatory SPN measurements (Giechaskiel et al., 2008b). We will refer to this system as PMP-CVS.
For a few laboratory tests, another PMP compliant system (NanoMet 1, Testo) was connected to the tailpipe of the vehicles in order to investigate the effect of different sampling locations (tailpipe versus full dilution tunnel) on the measured SPN emissions. This system also consists of a hot dilution at 150°C, an evaporation tube at 350°C, a secondary dilution at ambient temperature and a CPC (TSI 3790) with d50% = 23 nm. The PCRF chosen was 540 (110 × 4). The Nanomet 1 system was also used for some PEMS on-board tests (Vehicles HD #1, HD #2, DPF #2, PFI, GDI#1, GDI #3, GDI #5). In the following, we will refer to this system as PMP-TP.
Moreover, we conducted laboratory and on-board SPN emission measurements with a portable PEMS-SPN (NanoMet 3, Testo). The system samples the raw exhaust gas through a 2 m long line kept at 110°C. The raw gas is then diluted by a factor of 10 or 100 in a rotating disk diluter (Giechaskiel et al., 2014b). The diluted sample then passes through an evaporation tube set at 300°C. The concentration of SPN is estimated by measuring the current through a mini Diffusion Size Classifier (DiSC mini, Testo; Fierz et al., 2008). The DiSC charges the particles with a unipolar diffusion charger. Subsequently, the charged particles pass through a diffusion stage where the smallest particles are deposited by diffusion and detected as an electric current. The remaining particles end up in a second stage, the so called “filter stage,” where a second current is measured. The ratio of the two currents allows estimating the average particle diameter. Taken together the two currents, the average particle diameter, the exhaust flow rate and the calibration parameters allow estimating the SPN concentration in the exhaust. This estimation includes particles < 23 nm (the 50% detection limit is around 15 nm). Future devices will have hardware and software “filters” to mimic the PMP efficiency curve. These features were not available in our device. Thus we used the total current from the two stages (proportional to the Lung Deposited Surface Area—LDSA) and we calibrated it with a PMP system (thus >23 nm); the calibrated signal was used for our calculations (Giechaskiel et al., 2014b, 2015). The results presented below refer to the calibrated LDSA to give SPN >23 nm, unless otherwise specified.
Exhaust Flow Determination
We estimated the vehicle's exhaust flow in all laboratory tests from the difference between the total flow of the dilution tunnel and the dilution air flow. In some tests of Vehicle GDI#1 (two cold start WLTCs and two hot start WLTCs) and Vehicle GDI #3 (two NEDCs, two WLTCs, one test with constant speeds) the exhaust passed through an exhaust gas flow meter (EFM; Sensors Inc., 2 inches diameter, accuracy 1.5 kg/h) connected at the exit of the vehicle's tailpipe before entering the dilution tunnel. The same flow meter was also used for the on-road PEMS measurements. The correlation between the EFM flow rate and the estimated flow rate from the dilution tunnel for steady state points was R2> 0.99 with a slope of 1.13 (see an example in Supplementary Material B, Figure S5). At transient operation, the slope was about 1.03 (R2> 0.90). Thus, the on-road exhaust mass flow as determined with the EFM could be subject to uncertainty in the range of 3–13%. We did not apply correction to the flowmeter signal because the exhaust flow determined by the difference of two big flows (dilution air and total flow in the dilution tunnel) has an uncertainty too. For the typical flow rates of the dilution tunnel that have an uncertainty of 0.5%, an uncertainty of 7% was estimated for the calculated mean vehicle exhaust gas flow. For the heavy-duty on-board tests a 5 inches exhaust flowmeter was used (reported accuracy 10 kg/h) and similar overestimation of the flow rate was found when evaluated in the laboratory.
Calculations
The CVS flow rate and the distance traveled by the vehicle were used to calculate the emissions in particles per kilometer [p/km] from the SPN systems at the dilution tunnel (CVS). For the systems at the tailpipe (both in the laboratory and on the road), the instantaneous particle concentration was time-aligned with the exhaust flow rate and then both parameters were multiplied with each other. The sum of all instantaneous particle number emissions was then divided by the test distance to obtain the distance-specific particle number emissions over a give sub-cycle, cycle, or route [p/km] (integrated emissions). For the on-board tests, all emission events from the whole trip, including cold start, idling, and regeneration events, were included in the calculations.
Note that the approach for the on-road tests is not fully compliant with the upcoming RDE regulation that excludes cold start and idling from the emission calculations and requires that the trip remains within specific boundary conditions, e.g., with respect to acceleration and elevation gain. We regard our approach justified as the target of this paper is not to check the conformity of vehicles with respect to legislative emission limits, but to compare laboratory-based results with on-board measurements. Nevertheless, the evaluation method and its application will be presented in the “Results and Discussion” Section.
Results and Discussion
Before presenting the on-road SPN emission results for the tested vehicles, the importance of some parameters that affect the level of measured emissions will be discussed.
Sampling Location and Instruments Evaluation
Measuring particle number emissions after the dilution tunnel or directly from the tailpipe can lead to substantial differences due to processes like thermophoresis, agglomeration, evaporation/condensation, and diffusion (Giechaskiel et al., 2012b). Comparing two PMP systems, one measuring at the tailpipe (PMP-TP) and one at the dilution tunnel (PMP-CVS), we found mean deviations ranging from −15 to +15%, with a standard deviation of the mean differences of ~ 15% (Figure 1, blue bars and error bars). These deviations are slightly higher compared to those we found for the two PMP systems measuring in parallel (5–10%; Figure not shown).
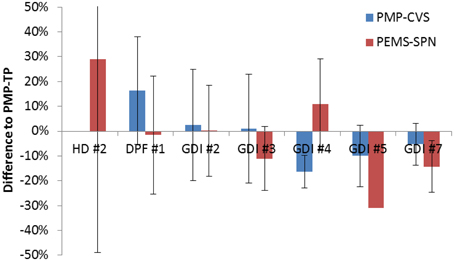
Figure 1. Deviations between SPN emissions measured with various systems at various sampling locations. Error bars show one standard deviation of SPN emissions measured over >10 phases of various driving cycles. All tests were conducted in the laboratory, except the comparison of PMP-TP with the PEMS-SPN for HD #2 and GDI #5 that were conducted on the road (on-board).
The results are in agreement with Giechaskiel et al. (2015) who compared two reference PMP systems that were compliant to Regulation 83 (UN/ECE, 2015) and installed at the tailpipe and at the dilution tunnel, respectively. Based on a sample of >130 tests with >15 vehicles, the average differences were within ±20% with a standard deviation of 15%. Giechaskiel et al. (2015) attributed the differences to agglomeration (0–15%), thermophoresis (0–5%), exhaust flow estimation (±10%), and time alignment issues (0–10%).
These observations suggest that particle dynamics play a minor role in the determination of SPN emissions; the differences in the measurements taken at the tailpipe and after the dilution tunnel are relatively small. This conclusion could be different for (i) older, high emitting vehicles where coagulation is important (Isella et al., 2008) or (ii) heavy-duty engine testing where the exhaust gas temperatures and thus thermophoretic losses are higher (Giechaskiel et al., 2010b).
The mean differences between the measurements taken at the tailpipe in the laboratory by the PEMS-SPN and the PMP-TP systems are within ±15% (Figure 1, red bars, except HD #2 and GDI #5) with a standard deviation of the differences of 25%. These differences are similar with those obtained for the two PMP systems measuring at the tailpipe and at the dilution tunnel, respectively, but it should be taken into account that the calibration of the PEMS-SPN was conducted with these vehicles. When the on-road comparisons are included the differences are within ±30% (Figure 1, red bars, HD #2 and GDI #5). The larger differences can be explained by the different principle of operation, i.e., diffusion charging of the PEMS-SPN that is sensitive to the size of particles measured versus condensation particle counting of the PMP system (see Giechaskiel et al., 2014b). For example, for Vehicle GDI #5, the concentration of the PEMS-SPN as estimated by the system using the mean size information would be within 4% of the PMP system. The results scatter over a wider range for the DPF-equipped Vehicle HD #2, where the particle number emissions were low and close to the detection limit of the PEMS-SPN. A relatively high dilution was used for these tests because the target was to catch any regeneration event that would happen. Nevertheless, although the relative difference in the measured SPN emissions seems high, in absolute terms, it was very low.
The relatively good agreement between the PEMS-SPN and the PMP-TP, both connected to the tailpipe, holds true even when emission levels span almost three orders of magnitude (from 5 × 10¹⁰ to 2 × 10¹³ p/km, Figure 2). Almost all points lie within the range of ±35% depicted by the dotted lines in Figure 2. Note that the tests of Vehicle GDI #5 (on-road) had similar differences with Vehicle DPF #1 (laboratory) and GDI #7 (laboratory).
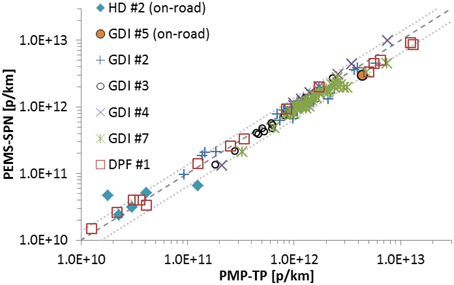
Figure 2. Deviations between the SPN emissions measured at the tailpipe with the PEMS-SPN and the PMP-TP system; each point represents a phase of a test cycle. Tests are conducted in the laboratory, unless otherwise specified (on-road). The dotted lines represent deviations of −35% (0.65:1) and +35% (1.35:1) from the 1:1 line.
The real-time response of the PEMS-SPN is very close to that of the PMP-TP (Figure 3), even though it is based on diffusion charging and not optical counting. A similar behavior was found for the other test vehicles as well. In most cases there was no significant effect of the mean size of the particles on the particle number measurement. Partly, the reason was due to the similar Geometric Mean Diameter (GMD) of the particles emitted by the tested vehicles, which ranged approximately from 37 to 59 nm (see Supplementary Material C, Figure S6 and Giechaskiel et al., 2014b). However, during, e.g., cold-starts and accelerations when the instantaneous mean particle size is different than the mean size over the whole test, the instantaneous emissions can be over- or underestimated (see details in Giechaskiel et al., 2015). For example, the spikes usually have differences on the order of ±60% between the PEMS-SPN and the PMP-TP. Partly this is due to the change of the mean particle size and partly due to the difference in the response time of the two instruments.
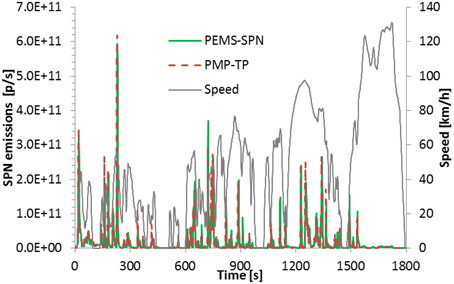
Figure 3. Real-time comparison of PEMS-SPN and PMP-TP measurements of Vehicle GDI #2 over one WLTC in the laboratory. Both systems were connected to the tailpipe.
As a final note, although the deviations between the PEMS-SPN and the PMP-TP measurements are higher than those between the two PMP systems, it should be kept in mind that the PEMS-SPN is designed for on-board use, thus it is light and relatively energy efficient; and thus simplified approaches (e.g., the sensor) are acceptable. In addition, the uncertainty is relatively constant for a wide range of emission levels. Nevertheless, we argue that the measurement uncertainty has to be taken into account in the Conformity Factors of the future PEMS-SPN regulation.
DPF Load and Regeneration
DPFs reduce tailpipe SPN emissions by more than 95% but lead to highly variable tailpipe emissions due to variations in the particle removal efficiency during cold-start and in dependence of the DPF fill state. The efficiency of a DPF can thus vary from 90 to >99%. In addition, the particle number emissions during regeneration can be significantly elevated for aggressive cycles including prolonged operation at motorway driving conditions (Mamakos et al., 2013b). The SPN emissions (>23 nm) during phases with regeneration can exceed by several factors the Euro 5b and Euro 6 SPN limit, due to the decreased efficiency of the DPF after the oxidation and removal of the accumulated soot.
Figure 4 shows three sequences of measurements that were conducted with Vehicle DPF#1 until regeneration events occurred. Each sequence depicts the SPN emissions measured over individual phases of the NEDC and WLTC at various conditions (including cold or hot start, different ambient temperatures, mixed sequence of cycles). Immediately after a regeneration event (0 km) the particle number emissions are high because the DPF is empty and its efficiency is relatively low (typically 90%). The emissions decrease over time to very low levels with a few exceptions (e.g., cold-start cycles at low ambient temperatures). A similar behavior was observed at different sequences of tests between regeneration events.
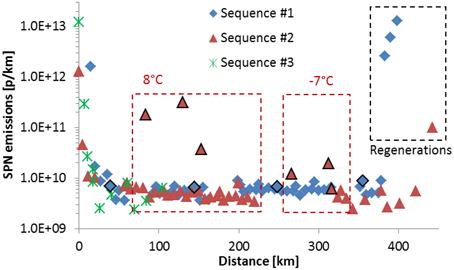
Figure 4. SPN emissions of Vehicle DPF#1 over the distance between regenerations. Each point represents a phase of a test cycle (mix of NEDCs and WLTCs). Cold-start cycles are indicated by black border line. All tests were conducted in the laboratory with PMP-CVS equipment. Sequence #3 was stopped before regeneration.
The particles during cold-start could be (i) semi-volatile material escaping oxidation as the catalytic converters have not yet reached the light-off temperature and cannot be evaporated in the SPN system or (ii) blow-out of loose non-volatile particle deposits, as the filter is exposed to highly transient operation with respect to thermal and flow conditions (Giechaskiel et al., 2007b). Another explanation is that small filter defects, which affect porosity, reduce DPF filtration efficiency at low temperatures but tend to close as the temperature rises, thus causing the DPF efficiency to increase with temperature (Braisher et al., 2010; Mamakos et al., 2013b). In conclusion, DPF equipped vehicles have low, but variable particle number emissions depending on the operating conditions of the vehicle.
Ambient Temperature
The SPN emissions tend to increase as the ambient temperature decreases (Figure 5). The emissions of Vehicle GDI #2 increased by 160% when tested over the WLTC at −7°C instead of the prescribed 23°C. The temperature effect was smaller for Vehicle GDI #1 (70%). The findings are in agreement with the literature (Aakko and Nylund, 2003; Giechaskiel et al., 2007b; Mamakos et al., 2012, 2013b; Chan et al., 2013; EPA, 2014) and can be explained by two effects. First, the enrichment of the air-fuel mixture during cold-start engine operation, which compensates for the reduced fuel vaporization and elevated friction of engine components, leads to incomplete fuel combustion. Second, at low ambient temperature, catalytic after-treatment systems need more time to reach their light-off temperature. By comparison, the increase in SPN emissions of a hot engine and after-treatment system at low ambient temperature is small (< 50%, Figure 5). This observation is expected because solid particles are being formed in the engine and are therefore relatively unaffected by ambient conditions after engine warm-up (Aakko and Nylund, 2003; Ristimäki et al., 2005). Mamakos et al. (2013b) have mentioned that the opposite effect of lower SPN emissions with decreasing ambient temperatures is also possible in cases where the Exhaust Gas Recirculation (EGR) in diesel engines is reduced at low temperatures, thus decreasing the soot-out emissions of the engine.
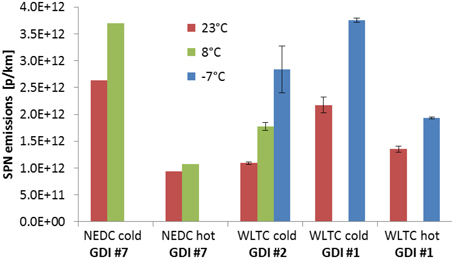
Figure 5. The effect of ambient temperature on SPN emissions. Error bars indicate the minimum and maximum emissions of three test repetitions. Tests were conducted in the laboratory with PMP-CVS equipment.
The instantaneous real-time SPN emissions and the exhaust gas temperatures of Vehicle GDI #1 are shown in Supplementary Material D, Figures S7 and S8. During cold start, SPN emissions are higher at lower ambient temperature (compare continuous red −7° and blue 23°C lines in Supplementary Material D, Figures S7 and S8). The cold start effect is significant in the first 300 s but remains visible until almost 750 s. For the hot cycles at both ambient temperatures (−7° and 23°C) the SPN emissions at the beginning of the cycle are similar as the exhaust gas temperature is also similar (compare dotted red and blue lines in Supplementary Material D, Figures S7 and S8). However, the emissions diverge after 300 s and correlate with the exhaust gas temperature. The cold and hot cycles at the same ambient temperature have similar emissions at the last part of the cycle as the exhaust gas temperature stabilizes at the same levels.
Test Mass
The mass added by the PEMS equipment to the vehicle can sometimes exceed 150 kg (especially for the first generation of PEMS). Accounting for the mass of one co-driver of 80 kg, PEMS-SPN testing may result in a vehicle load of 230 kg. This additional load may be negligible for buses or trucks; however for passenger cars, the added mass can affect engine load and thus particle number emissions. We found that increasing the chassis dyno inertia to account for an additional vehicle load of 230 kg increases the SPN emissions of Vehicle GDI #3 by 5–15% (Figure 6). The same tests suggested an increase in the CO2 emissions by 10–20% as well, which is in line with the expected CO2 increase of 6–7% for every 100 kg of vehicle mass (Zacharof et al., 2015). A 10% increase of the inertia of Vehicle GDI #1 resulted in an 18–27% increase of SPN emissions. A similar trend was found by May et al. (2014) when testing vehicles with different inertia in the laboratory.
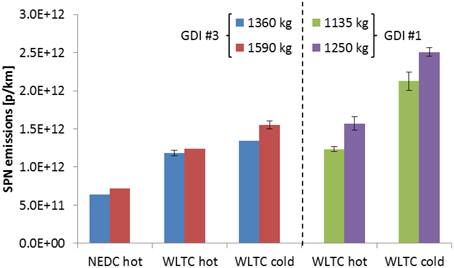
Figure 6. Effect of vehicle load (simulated here by chassis dynamometer inertia) on the SPN emissions of Vehicles GDI #1 and #3. Error bars indicate the minimum and maximum emissions of three (Vehicle GDI #1) and two (Vehicle GDI #3) test repetitions. Tests were conducted in the laboratory with PMP-CVS equipment.
Driving Style
Driving the WLTC speed profile without any gear shift indication on the display by four different but experienced drivers causes deviations in the SPN emissions of less than 10% (Figure 7). However, deliberately driving at higher engine speed, thus at lower gear, and changing the gears often can double the SPN emissions (see WLTC_D gear shifting in Figure 7 and details in the Supplementary Material E, Figures S9–S12). Dedicated constant speed tests showed that the gear change has the biggest effect on SPN emissions, while a smaller effect can be attributed to the engine speed; i.e., the transition phase has higher contribution probably due to incomplete combustion (Supplementary Material E, Figure S12). Thus, even with a well-defined speed profile, the effect of driving style on the SPN emissions can be significant. This observation is in agreement with the dynamics of gaseous pollutants and CO2 observed during on-road driving (Jackson et al., 2006). Aggressive driving can increase trip-average fuel consumption by up to 24%, while eco–driving can provide estimated benefits in the order of 6% compared to normal operation, thus directly impacting particle formation (Zacharof et al., 2015).
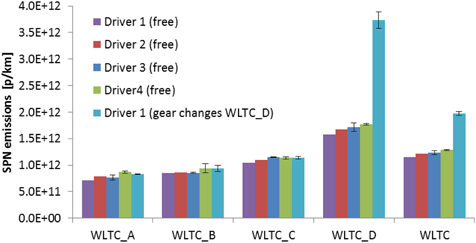
Figure 7. Effect of driving style on the SPN emissions of Vehicle GDI #3. Error bars indicate the minimum and maximum SPN emissions of two test repetitions conducted with 3 months difference between them. All drivers were free to choose their gear shifting, except Driver 1 who followed in one test sequence of WLTC_D a gear shift strategy at higher rpm. Tests in the laboratory were conducted with PMP-CVS equipment.
Driving Cycle
In line with the sensitivity to driving style, SPN emissions vary substantially depending on the driven cycles and their phases (Figure 8). For Vehicle GDI #6, the SPN emissions were on average ~ 4 × 10¹² p/km with the engine working in hot conditions, but lower emissions were measured over the high-speed phase of the WLTC (WLTC_C; 2 × 10¹¹ p/km) and higher emissions over the low-speed phase of the WLTC (WLTC_A at cold-start conditions; 8.5 × 10¹² p/km). Aggressive accelerations during the severe portion of the random cycle (RC_C) led to elevated SPN emissions. The on-board results are in qualitative agreement with the laboratory results. The higher SPN emissions over PEMS Route 1 as compared to Route 3 can be explained by the higher average speeds (55 vs. 30 km/h). Qualitatively similar results were observed for the other GDI vehicles. In most cases, cold start contributed the largest portion to the differences in SPN emissions observed between different sub-cycles.
Figure 8. SPN emissions of Vehicle GDI #6 over various phases of the WLTC and the random driving cycle as well as two on-road trips.
As mentioned in Section Ambient Temperature, SPN emissions at cold-start are high due to engine enrichment resulting in incomplete combustion. The SPN emissions decrease as the engine gets warmer due to better combustion. In addition, the increasing surface temperatures of cylinder walls aid better fuel vaporization and avoid “pool fires” (Witze and Green, 2005; Peckham et al., 2011). The higher SPN emissions during accelerations correlate with the air/fuel ratio; emissions increase when the mixture is rich (Maricq et al., 1999; Wang et al., 2006).
A similar tendency was observed for the DPF equipped vehicles, when the emissions were in measurable levels. However, due to the high efficiency of the DPF, in most cases absolute emission levels were so low that it is difficult to draw robust conclusions.
Evaluation of On-Road Data
The on-road SPN emission results are presented as integrated emissions over the whole trip. (Figures 8, 10). However, the trip share (urban, rural, motorway) and the conditions (e.g., vehicle mass, ambient conditions, road grade, wind, accelerations etc.) have a big impact on the final result.
For heavy-duty in-service conformity testing, the trip requirements and the Moving Average Window (MAW) evaluation method are described in Regulation 582/2011 (EC, 2011). The MAW is based on data evaluation of windows of on-road operation whose length is defined by the work produced over the reference laboratory WHTC. However, the method contains several boundaries; for example, operation points with coolant temperature < 70°C (i.e., cold-start) and low power operation, where the engine power is < 20% of the maximum rated power are excluded. For N3 category trucks (i.e., those tested in this study) the trip should consist of ~20% urban (< 50 km/h), 25% rural, and 55% motorway (>75 km/h) operation (Annex II of Regulation 582/2011; EC, 2011). These boundary conditions are currently under evaluation (Perujo and Mendoza-Villafuerte, 2015).
For the type approval of light-duty vehicles, the share of urban (< 60 km/h), rural (60–90 km/h), and motorway (>90 km/h) driving should be of equal duration. The data evaluation is based on the MAW method. The lengths of windows match half of the mass of CO2 emitted by the respective vehicle over the WLTC. Additional boundary conditions limit the instantaneous acceleration at a given speed and the cumulative elevation gain during a trip. However, there are still some open points regarding the boundary conditions for the analysis of the results (e.g., exclusion of high acceleration rates or certain ambient conditions).
To illustrate the variability of SPN emissions over a test, Figure 9 shows the MAW SPN results over the mean speed of each MAW as well as the average results for urban, rural, and motorway driving during an on-road trip. The WLTC laboratory results are also depicted for comparison. Figure 9 confirms the findings of Figure 8, suggesting that cold-start and high accelerations increase SPN emissions. Control of parameters such as fuel injection, spark timing, and air-to-fuel ratio during cold-start and acceleration may be important in limiting the extent of particles formation.
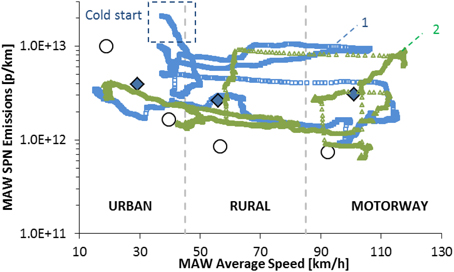
Figure 9. MAW SPN emissions of a road trip with Vehicle GDI #5 in function of the MAW speed. The blue small squares (1) show the first half way of the trip and the small green triangles (2) the return trip. Solid diamonds depict the mean on-road SPN emissions for urban, rural, and motorway driving. White circles depict the laboratory SPN emissions over the four phases of the WLTC.
The on-road PEMS-SPN emissions are calculated without any data exclusions (4.1 × 10¹² p/km) and alternatively by following the RDE regulation with the exclusion of cold start and idling and the weighing of emissions if these belong to windows whose CO2 emissions deviate by more than 25% from the emissions measured over the WLTC (3.2 × 10¹² p/km). The on-road SPN emissions are higher than those measured in the laboratory over the cold-start WLTC (2.2 × 10¹² p/km).However, it is important to keep in mind when reporting emissions using the evaluation tools (like MAW or power binning method) because they are partly normalized emissions to the type approval cycle.
SPN Emission Factors
Experimental Results
The results of the on-road PEMS tests obtained with the PMP-TP or PEMS-SPN and those of the laboratory tests obtained with the PMP-CVS are shown in Figure 10. Beginning with the PEMS results, the Euro V heavy-duty diesel Vehicle HD #1 had high emissions (2 × 10¹³ p/km), while the Euro VI heavy-duty diesel Vehicle HD#2 showed very low SPN emissions (6 × 10¹⁰ p/km). Assuming 1.2 kWh/km for the WHVC (Ntziachristos et al., 2006), then the 6 × 10¹¹ p/kWh Euro VI SPN limit would translate to 7.2 × 10¹¹ p/km, and the on-road emissions of the Euro VI truck are one order of magnitude lower than the limit. As far as the compression ignition light-duty vehicles is concerned, Vehicle DPF #1 had emissions of 8 × 10¹¹ p/km, while the emissions of Vehicle DPF#2 were one order of magnitude lower, thus close or even below the Euro 6 limit (6 × 10¹¹ p/km). The Vehicle PFI had SPN emissions slightly higher than 1 × 10¹² p/km (note that the trip comprised urban driving only). The SPN emissions of the GDI vehicles spanned ~ from 8 × 10¹¹ to almost 8 × 10¹² p/km. Most GDIs complied with the current Euro 6 limit (6 × 10¹² p/km) but not with the future Euro 6c limit (6 × 10¹¹ p/km, to be applied from 2017 onward).
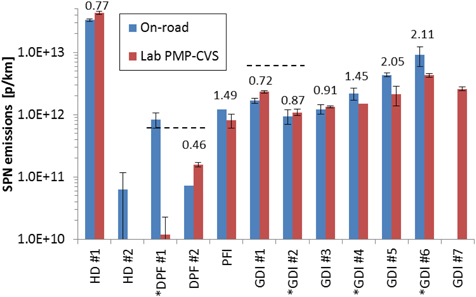
Figure 10. SPN emissions of heavy-duty and light-duty vehicles on the road (PMP-TP) and in the laboratory (PMP-CVS). Asterisk indicates that PEMS-SPN was used instead of PMP-TP system for on-road measurements. DPF regeneration has been excluded from the emission measurements of Vehicles DPF #1 and DPF#2 when tested in the laboratory. On-road results are averages of all tested routes (see Table 3). Error bars indicate the range between minimum and maximum SPN emissions. Dashed lines depict the applicable emission limits. Numbers indicate the ratio of on-road to lab emissions.
The laboratory results of the (future type approval) cold-start 23°C WLTCs (or WHVC for the Euro V truck, which is not a type approval cycle) were in relatively good agreement with the on-road PEMS results, with the exception of the DPF equipped light-duty vehicles. As discussed in the previous sections, the DPF fill state and the passive regeneration during the on-road tests most likely contributed to the high, though unsystematic differences (see also discussion of Figure 4). The on-road tests of Vehicle DPF #1 were conducted almost immediately after a regeneration event in the laboratory and for this reason they are elevated. For the remaining vehicles, deviations may be explained by: (i) uncertainties of the measurement equipment (e.g., Vehicles GDI #2, #4, #6), (ii) the lower ambient temperatures on the road (Vehicles GDI #2, #4, #6), (iii) the differences in driving conditions on the road and in the laboratory, (iv) the uncertainty of the chassis dynamometer parameters to simulate on-road driving, and (v) the mass of the PEMS.
A deviation of about a factor of two was observed when comparing the on-road and laboratory tests of Vehicles GDI #5 and GDI #6. A closer examination of the real time signals in the laboratory tests revealed that these vehicles had very high emissions during accelerations. In addition, vehicles were running under rich conditions during most part of the on-road tests. The Euro 6 Vehicles GDI #1 and #2 showed on the road lower SPN emissions than in the laboratory. This observation may probably be explained by the relatively high contribution of cold-start to the average SPN emissions in the laboratory. The cold start (around 5 min) has a higher impact on a 30 min test cycle (WLTC) than on a 120 min on-road test. To illustrate the effect, we compared the SPN emissions measured on the road with those measured over a hot WLTC test. The ratio of SPN emissions changed from 0.72 to 1.2 for Vehicle GDI #1 and from 0.87 to 1.27 for Vehicle GDI #2.
It should be mentioned that the light-duty on-board emissions were compared with the WLTC emissions which are considered more representative of the real-life operation of the vehicles than the NEDC. Comparisons with SPN emissions measured over the NEDC would probably result in higher differences between on-road and laboratory measurements. Similarly the Euro V truck on-road emissions were compared with the WHVC and not the ETC. As a side note, the fuel consumption of the three GDI vehicles (#1, #3, #5) was 15–35% higher on the road than in the lab; this observation is in line with the ranges reported in the literature (Mock et al., 2013). For example, Weiss et al. (2012) found 24 ± 15% differences at seven diesel Euro 4–6 vehicles. Another study of 600,000 vehicles found 40% differences (Tietge et al., 2015).
Literature Overview on SPN Emission Levels
The SPN emissions measured in this study are in general within the ranges reported in the literature on chassis dynamometer studies (see Giechaskiel et al., 2012a; Ntziachristos and Galassi, 2014). The substantial decrease in the SPN emissions between Euro V and Euro VI trucks shows the potential of engine and after-treatment technologies following the introduction of a Euro VI SPN limit. Until Euro V a mass limit of 20 mg/kWh was only required and any DPF was optimized for such emission levels (which are equivalent to 4 × 10¹³ p/km assuming a correlation of 2 × 10¹² p/mg, see Giechaskiel et al., 2012a). The SPN emissions of the PFI vehicle (1.2 × 10¹² p/km) are at the high end of reported values, probably because this vehicle was tested in “urban” conditions only. The emissions of the seven GDI vehicles (2 × 10¹² p/km) were at the lower end of reported values. This observation may be attributed to the improvements of the new generation of GDIs.
On-road measurements of Euro III and IV diesel buses showed levels of 9 × 10¹³ and 3 × 10¹³ p/km, respectively (Liu et al., 2011). Huang et al. (2013) found much higher emissions for a Euro IV diesel bus using PEMS equipment (7 × 10¹⁴ p/km). The Euro V truck of our study showed lower SPN emissions than the previously mentioned Euro III and Euro IV buses. Johnson et al. (2009b) and Zheng et al. (2014) measured trucks with a Continuously Regenerating Trap (CRT) and found SPN emissions below 6 × 10¹¹ p/km. However, Zheng et al. (2014) found that SPN emissions during uphill driving could increase by one order of magnitude compared to the test without uphill dribing. These findings are in agreement with the SPN emissions measured in our study with the Euro VI heavy-duty vehicle on the road (Vehicle HD #2).
The on-road PN emissions of diesel cars that are not equipped with a DPF range approximately from 1 × 10¹⁴ p/km (Vogt et al., 2003) to 6 × 10¹⁴ p/km (Huang et al., 2013), depending on the specific test route and operating conditions. The SPN emissions of diesel cars equipped with a DPF are two orders of magnitude lower (5 × 10¹² p/km; Armas et al., 2013) and can be even close to the ambient background levels under favorable operating conditions, e.g., optimum DPF fill state (Bergmann et al., 2009). Our results are within the reported range (see Vehicles DPF #1 and #2 in Figure 10).
The PN levels measured on-road for light-duty gasoline vehicles vary over several orders of magnitude. Wehner et al. (2009) found total PN emissions (including volatile and semi-volatile particles) of 1.8 × 10¹² p/km for a Euro 4 gasoline car. Huang et al. (2013) found PN emissions two orders of magnitude higher (1.5 × 10¹⁴) for another Euro 4 gasoline car. Due to the low temperature at the thermal pre-treatment (80°C) of the sampling system, it is possible that these emissions included semi-volatile particles as nucleation mode. Our results are in agreement with Wehner et al. (2009).
The on-road SPN emission levels of the two heavy-duty vehicles are lower than those found by the roadside measurements. Total PN emissions of 1.4 × 10¹⁴ p/km have been measured for DPF equipped buses and 6.5 × 10¹⁴ p/km for non-DPF buses (see reviews of Morawska et al., 2008; Hallquist et al., 2013). The Euro V DPF equipped truck had emissions of 2 × 10¹³ p/km which is lower but close to the reported value. However, the Euro VI truck had emissions < 1 × 10¹¹ p/km indicating the capabilities of high efficiency DPFs that have to fulfill the Euro VI SPN limits. The reported roadside emission levels of light-duty vehicles are on the order of 3 × 10¹³ p/km, which is much higher than the emissions reported here (1–5 × 10¹² p/km; see Figure 10). The discrepancy may be explained by (i) the share of diesel cars without DPF in the vehicle fleet, (ii) the observation that roadside measurements often include nucleation mode particles and secondary particles, and (iii) the overall higher uncertainty, thus variability, of roadside measurements.
Literature Overview on Comparisons Between Laboratory and On-Road Tests
Direct comparisons of SPN emission measurements conducted in the laboratory and on the road are still scarce. Vogt et al. (2003) and Giechaskiel et al. (2007a) found very good agreement (within 15%) between laboratory and chase steady state tests for light-duty diesel vehicles. Bergmann et al. (2009) measured lower emissions in the laboratory compared to on-road tests for a DPF equipped light-duty vehicle. Similarly, Andersson et al. (2014) found almost one order of magnitude lower SPN emissions in the laboratory than on the road with PEMS for DPF-equipped diesel cars. These results are in agreement with our findings.
To our knowledge, there are no comparisons of SPN emissions from GDI vehicles in the literature. Here, we show that SPN emissions on the road are generally higher by a factor < 2 than those found in the laboratory. The Euro 6 vehicles had on-road emissions close to the laboratory values (values < 1). This observation indicates that for current technologies, the on-road SPN emissions are roughly in line with the applicable emissions limit. We have not observed exceedances comparable to those found for NOx emissions, where factors of seven have been reported (Franco et al., 2014). In addition, the on-road SPN emissions of the GDI vehicles were lower than the current limit of 6 × 10¹² p/km. However, it remains to be investigated whether the relatively good agreement between laboratory and on-road SPN emissions may still hold for future GDI vehicles that have to emit less than 6 × 10¹¹ p/km and may be equipped with new technologies (i.e., Gasoline Particle Filters).
In general, the results of the present study are at the low end of PN emissions reported in the literature. We attribute this observation to technological improvements, especially related to GDI vehicles, and the fact that we examined only solid particles >23 nm (as currently regulated in the EU). Previous studies also investigated the emissions of sub-23 nm particles in the laboratory. In agreement with the literature, Giechaskiel et al. (2014c) found that sub-23 nm particles over a test cycle (WLTC) accounted for 30–40% of the total PN emissions. The sub-23 nm fraction during on-board tests was not measured. However, an estimation can be made based on our PEMS-SPN results: The difference of the SPN particles (>15 nm) as estimated by the instrument versus the >23 nm SPN emissions as calibrated by us reached some 30–50%, which is in line with the expected percentages. However, this estimation is subject to high uncertainty as the actual on-road mean particle size could be different compared to the one observed in lab tests used for the >23 nm calibration of the PEMS-SPN instrument. The total emissions (solids and volatiles) were not evaluated.
Conclusions
Limits for SPN emissions have been introduced in the European Union in 2011 for light-duty vehicles and 2013 for heavy-duty engines, respectively. However, quite often, differences in SPN emissions are found between laboratory and on-road tests. European policy makers address this situation with the recently approved RDE on-road test procedure for light-duty vehicles. On-road emissions testing with PEMS is well established for determining the in-service conformity of heavy-duty vehicles with respect to gaseous pollutants. The application of PEMS for measuring particulate mass emissions is already accepted in the USA and might be included in the European regulation too. However, the application of PEMS for SPN emissions for the type-approval testing of light-duty and heavy-duty vehicles is new and presents technical challenges.
Particle sampling at the tailpipe requires robust systems that can handle high temperatures. Agglomeration (0–15%), thermophoresis (0–5%), uncertainty in exhaust flow measurements (±10%), and time alignment issues (0–10%) can result in differences between SPN emissions measured at the tailpipe and after dilution tunnel sampling (as prescribed in the current regulations). The application of two different principles (i.e., diffusion charging and electrical detection vs. optical counting) for determining particle number concentration with PEMS-SPN introduces an extra measurement uncertainty which was found to be on the order of 30% (with a standard deviation 25%). Nevertheless, this uncertainty was similar for emission levels that span over almost three orders of magnitude (from 5 × 10¹⁰ to 2 × 10¹³ p/km).
This article has also analyzed parameters that can affect SPN emission levels. Among these are the status and pre-conditioning of the after-treatment systems, namely the DPF. Here it was demonstrated that the DPF status can significantly affect the repeatability of SPN measurements. Differences of more than one order of magnitude were found between regenerating and non-regenerating cycles. Low ambient temperature testing (−7°C) increased the emissions by 70–160% compared to testing at 23°C. However, tests conducted with already warm engines at different ambient temperatures typically varied by less than 50% with respect to the resulting SPN emissions. A 10–15% increase of the vehicle weight resulted in a 10–25% increase of SPN emissions. Aggressive driving that includes strong acceleration and frequent changes in engine rpm resulted in elevated SPN emissions. Subsequently, SPN emissions can increase by a factor 2–5 if cold-start and strong accelerations are covered by a driving cycle.
We also conducted on-road emission measurements of two heavy-duty vehicles equipped with diesel particle filter (DPF), two light-duty diesel vehicles equipped with DPF, one fuel port injection (PFI), and six gasoline direct injection (GDI) passenger cars. The Euro V heavy-duty diesel truck showed SPN emissions of around 2 × 10¹³ p/km, while the Euro VI diesel truck emitted only 6 × 10¹⁰ p/km. One of the DPF equipped light-duty vehicle had emissions of 8 × 10¹¹ p/km, while the other one had one order of magnitude lower emissions. The PFI showed SPN emissions slightly higher than 1 × 10¹² p/km on an urban trip. The SPN emissions of the GDI vehicles spanned ~ from 8 × 10¹¹ to almost 8 × 10¹² p/km. For the non-DPF vehicles the on-road PEMS results were in relatively good agreement with those obtained in the laboratory, with differences of a factor < 2.1. However, the SPN emissions of the DPF equipped vehicles differed by almost one order of magnitude when driven in the laboratory and on the road.
Concluding, SPN measurements on-board are possible with a relative small increase of the measurement uncertainty. This uncertainty is smaller than the differences observed between laboratory and on-road measurements. Reasons that can partly explain the differences are DPF fill state, ambient air temperature, chassis dynamometer settings, extra mass of PEMS and driving conditions/style. Even higher differences can be observed compared to roadside measurements, but there total PN measurements are typically conducted that include formation of secondary particles.
Author Contributions
BG had the concept of the work, did the analysis of the data and wrote the paper. FR organized the light-duty vehicles work. TV did the analysis of the MAW method. PM and RS organized the heavy-duty vehicles testing. GF and MW contributed in the structure of the paper. PB and MW were responsible for the project. All authors supported in the experiments, and critically commented, and revised the paper.
Conflict of Interest Statement
The authors declare that the research was conducted in the absence of any commercial or financial relationships that could be construed as a potential conflict of interest.
Acknowledgments
The views expressed here are those of the authors and may not be considered as the official position of the European Commission. The authors would like to thank R. Colombo, M. Cadario, M. Sculati, P. Lelijour, D. Lesueur, F. Forni, and M. Carriero for executing the laboratory and on-road tests.
Supplementary Material
The Supplementary Material for this article can be found online at: https://www.frontiersin.org/article/10.3389/fenvs.2015.00082
Abbreviations
APC, AVL Particle Counter; CO2, Carbon Dioxide; COPERT, COmputer Programme to calculate Emissions from Road Transport; CPC, Condensation Particle Counter; CRT, Continuously Regenerating Trap; CVS, Constant Volume Sampling; DiSC, Diffusion Size Classifier; DPF, Diesel Particulate Filter; EC, European Commissions; ECE, Economic Commission for Europe; EEA, European Environment Agency; EFM, Exhaust gas Flow Meter; EGR, Exhaust Gas Recirculation; EMEP, European Monitoring and Evaluation Programme; EPA, Environmental Protection Agency (US); ETC, European Transient Cycle; EU, European Union; EUDC, Extra Urban Driving Cycle; GDI, Gasoline Direct Injection; GMD, Geometric Mean Diameter; GPS, Global Positioning System; HBEFA, Handbook Emission Factors for Road Transport; HD, Heavy-Duty; HEI, Health Effects Institute; JRC, Joint Research Centre; LDSA, Lung Deposited Surface Area; LDV, Light-Duty Vehicle; m.a.s.l., meters above sea level; MAW, Moving Average Window; MOVES, MOtor Vehicle Emission Simulator; NEDC, New European Driving Cycle; NOx, Nitrogen Oxides; PCRF, Particle number Concentration Reduction Factor; PEMS, Portable Emissions Measurement System; PFI, Port Fuel Injection; PM, Particulate Matter; PMP, Particle Measurement Program; PN, Particle Number; RC, Random Cycle; RDE, Real Driving Emissions; rpm, Revolutions Per Minute; SPN, Solid Particle Number; TP, Tailpipe; TWC, Three-Way Catalyst; UDC, Urban Driving Cycle; UN-ECE, United Nations Economic Commission for Europe; US, United States; VELA, Vehicle Emissions Laboratory; WHO, World Health Organization; WHVC, World Harmonized Vehicle Cycle; WLTC, Worldwide Harmonized Light vehicles Test Cycle; WLTP, Worldwide Harmonized Light vehicles Test Procedure.
Footnotes
1. ^Note that Roman numbers are used for heavy-duty engines standards and Arabic numbers for light-duty vehicle standards. Note also that legislation requires the type approval of the engine for heavy-duty vehicles.
References
Aakko, P., and Nylund, N. (2003). Particle Emissions at Moderate and Cold Temperatures using Different Fuels. SAE Technical Paper doi: 10.4271/2014-01-2826
Andersson, J., May, J., Favre, C., Bosteels, D., de Vries, S., Heaney, M., et al. (2014). On-road and chassis dynamometer evaluations of emissions from two Euro 6 diesel vehicles. SAE Int. J. Fuel Lubr. 7, 919–934.
Armas, O., Garcia-Contreras, R., and Ramos, A. (2013). Emissions of light duty vehicle tested under urban and extra-urban real-world driving conditions with diesel, animal fat biodiesel and GTL fuels. SAE Technical Paper 2013-24-0176.
Barrios, C., Domínguez-Sáez, A., Rubio, J., and Pujadas, M. (2012). Factors influencing the number distribution and size of the particles emitted from a modern diesel vehicle in real urban traffic. Atmos. Environ. 56, 16–25. doi: 10.1016/j.atmosenv.2012.03.078
Beddows, D., and Harrison, R. (2008). Comparison of average particle number emission factors for heavy and light duty vehicles derived from rolling chassis dynamometer and field studies. Atmos. Environ. 42, 7954–7966. doi: 10.1016/j.atmosenv.2008.06.021
Bergmann, M., Kirchner, U., Vogt, R., and Benter, T. (2009). On-road and laboratory investigation of low-level PM emissions of a modern diesel particulate filter equipped diesel passenger car. Atmos. Environ. 43, 1908–1916. doi: 10.1016/j.atmosenv.2008.12.039
Bonnel, P., Brunella, A., Carriero, M., Fumagalli, I., Kubelt, J., Manfredi, U., et al. (2006). European Project on Portable Emissions Measurement Systems: EU PEMS. Ispra: EU Report EUR 22143 EN.
Bonnel, P., Kubelt, J., and Provenza, A. (2011). Heavy-Duty Engines Conformity Testing Based on PEMS - Lessons Learned from the European Pilot Program. Ispra: EU Report 24921.
Boulter, P., and McCrae, I. (2007). The Links Between Micro-Scale Traffic, Emission and Air Pollution Models. Transport Research Laboratory Project Report PPR 269.
Braisher, M., Stone, R., and Price, P. (2010). Particle number emissions from a range of european vehicles. SAE Technical Paper doi: 10.4271/2010-01-0786
Casati, R., Scheer, V., Vogt, R., and Benter, T. (2007). Measurement of nucleation and soot mode particle emission from a diesel passenger car in real world and laboratory in situ dilution. Atmos. Environ. 41, 2125–2135. doi: 10.1016/j.atmosenv.2006.10.078
Chan, T., Meloche, E., Kubsh, J., Brezny, R., Rosenblatt, D., and Rideout, G. (2013). Impact of ambient temperature on gaseous and particle emissions from a direct injection gasoline vehicle and its implications on particle filtration. SAE Int. J. Fuel Lubr. 6, 350–371. doi: 10.4271/2013-01-0527
Clark, N., Kern, J., Atkinson, C., and Nine, R. (2002). Factors affecting heavy-duty diesel vehicle emissions. J. Air Waste Manag. Assoc. 52, 84–94. doi: 10.1080/10473289.2002.10470755
EC (2007). Regulation (EC) No 715/2007 of the European parliament and of the council of 20 June 2007 “on type-approval of motor vehicles with respect to emissions from light passenger and commercial vehicles (Euro5 and Euro6) and on access to vehicle repair and maintenance information.” Off. J. Eur. Union L 171, 1–16.
EC (2009). Regulation (EC) no 595/2009 of the European parliament and of the Council of 18 June 2009 “on type-approval of motor vehicles and engines with respect to emissions from heavy-duty vehicles (EuroVI) and on access to vehicle repair and maintenance information and amending Regulation (EC) no. 715/2007 and directive 2007/46/EC and repealing directives 80/1269/EEC, 2005/55/EC and 2005/78/EC”. Off. J. Eur. Union L 188, 1–13.
EC (2011). Commission Regulation (EU) No 582/2011 of 25 May 2011 “implementing and amending Regulation (EC) No 595/2009 of the European Parliament and of the Council with respect to emissions from heavy-duty vehicles (EuroVI) and amending Annexes I and III to directive 2007/46/ECof the European parliament and of the council”. Off. J. Eur. Union L 167, 1–168.
EC (2012). Communication from the Commission to the European Parliament, the Council, the European Economic and Social Committee and the Committee of the Regions. Cars 2020: Action Plan for a competitive and sustainable automotive industry in Europe. (2012), COM. Available online at: http://eur-lex.europa.eu/LexUriServ/LexUriServ.do?uri=COM:2012:0636:FIN:EN:PDF
EMEP/EEA (2013). Air Pollutant Emission Inventory Guidebook. Copenhagen: European Monitoring and Evaluation Programme/European Environment Agency, 2013.
EPA (2008). Determination of PEMS Measurement Allowances for Gaseous Emissions Regulated Under the Heavy-Duty Diesel Engine in-use Testing Program. United States Environmental Protection Agency, Revised Final report. Available online at: http://www.epa.gov/otaq/regs/hd-hwy/inuse/420r08005.pdf
EPA (2009). Integrated Science Assessment for Particulate Matter (Final Report). Washington, DC: U.S. Environmental Protection Agency. EPA/600/R-08/139F, 2009.
EPA (2014). Emission Adjustments for Temperature, Humidity, Air Conditioning, and Inspection and Maintenance for on-road Vehicles in MOVES2014. Washington, DC. Report EPA-420-R-14-012.
Fierz, M., Burtscher, H., Steigmeier, P., and Kasper, M. (2008). Field measurement of particle size and number concentration with the diffusion size classifier (DISC). SAE Technical Paper 2008-01-1179.
Fontaras, G., Franco, V., Dilara, P., Martini, G., and Manfredi, U. (2014). Development and review of Euro 5 passenger car emission factors based on experimental results over various driving cycles. Sci. Total Environ. 468–469, 1034–1042. doi: 10.1016/j.scitotenv.2013.09.043
Franco, V., Kousoulidou, M., Muntean, M., Ntziachristos, L., Hausberger, S., and Dilara, P. (2013). Road vehicle emission factors development: a review. Atmos. Environ. 70, 84–97. doi: 10.1016/j.atmosenv.2013.01.006
Franco, V., Sanchez, F., German, J., and Mock, P. (2014). Real-World Exhaust Emissions from Modern Diesel Cars. A meta-Analysis of PEMS Emissions Data from EU (Euro 6) and US (Tier 2 bin 5/ULEV ii) Diesel Passenger Cars. Berlin: ICCT–The International Council on Clean Transportation.
Giechaskiel, B., Arndt, M., Schindler, W., Bergmann, A., Silvis, W., and Drossinos, Y. (2012b). Sampling of non-volatile vehicle exhaust particles: a simplified guide. SAE Int. J. Engines 5, 379–399. doi: 10.4271/2012-01-0443
Giechaskiel, B., Carriero, M., Martini, G., Bergmann, A., Pongratz, H., and Jörgl, H. (2010b). Comparison of particle number measurements from the full dilution tunnel, the tailpipe and partial flow systems. SAE Int. J. Fuel Lubr. 2, 512–530.
Giechaskiel, B., Cresnoverh, M., Jörgl, H., and Bergmann, A. (2010a). Calibration and accuracy of a particle number measurement system. Meas. Sci. Technol. 21, 045102. doi: 10.1088/0957-0233/21/4/045102
Giechaskiel, B., Dilara, P., and Andersson, J. (2008a). Particle Measurement Programme (PMP) light-duty inter-laboratory exercise: repeatability and reproducibility of the particle number method. Aerosol Sci. Technol. 42, 528–543. doi: 10.1080/02786820802220241
Giechaskiel, B., Dilara, P., Sandbach, E., and Andersson, J. (2008b). Particle Measurement Programme (PMP) light-duty inter-laboratory exercise: comparison of different particle number measurement systems. Meas. Sci. Technol. 19:095401. doi: 10.1088/0957-0233/19/9/095401
Giechaskiel, B., Mamakos, A., Andersson, J., Dilara, P., Martini, G., Schindler, W., et al. (2012a). Measurement of automotive non-volatile particle number emissions within the European legislative framework: a review. Aerosol Sci. Technol. 46, 719–749. doi: 10.1080/02786826.2012.661103
Giechaskiel, B., Manfredi, U., and Martini, G. (2014c). Engine exhaust solid sub-23 nm particles: I. literature survey. SAE Int. J. Fuels Lubr. 7, 950–964. doi: 10.4271/2014-01-2834
Giechaskiel, B., Maricq, M., Ntziachristos, L., Dardiotis, C., Wang, X., Axmann, H., et al. (2014a). Review of motor vehicle particulate matter emissions sampling and measurement: from smoke and filter mass to particle number. J. Aerosol Sci. 67, 48–86. doi: 10.1016/j.jaerosci.2013.09.003
Giechaskiel, B., Massimo, C., Bonnel, P., Schindler, W., Scheder, D., Bassoli, C., et al. (2011). PEMS feasibility of particulate mass and number measurement with portable emission measurement systems (PEMS) for in-use testing. SAE Technical Paper 2011-24-0199.
Giechaskiel, B., Munoz-Bueno, R., Rubino, L., Manfredi, U., Dilara, P., De Santi, G., et al. (2007b). Particle measurement programme (PMP): particle size and number emissions before, during and after regeneration events of a euro 4 DPF equipped light-duty diesel vehicle. SAE Technical Paper 2007-01-1944.
Giechaskiel, B., Ntziachristos, L., Samaras, Z., Casati, R., Scheer, V., and Vogt, R. (2005). Formation potential of vehicle exhaust nucleation mode particles onroad and in the laboratory. Atmos. Environ. 39, 3191–3198. doi: 10.1016/j.atmosenv.2005.02.019
Giechaskiel, B., Ntziachristos, L., Samaras, Z., Casati, R., Volker, S., and Rainer, V. (2007a). Effect of speed and speed transition on the formation of nucleation mode particles from a light-duty diesel vehicle. SAE Technical Paper 2007-01-1110.
Giechaskiel, B., Riccobono, F., and Bonnel, P. (2014b). Feasibility Study on the Extension of the Real Driving Emissions (RDE) Procedure to Particle Number (PN): Experimental Evaluation of Portable Emission Measurement Systems (PEMS) with Diffusion Chargers (DCs) to Measure Particle Number (PN) Concentration. JRC Report 26997, Ispra.
Giechaskiel, B., Riccobono, F., and Bonnel, P. (2015). Feasibility Study on the Extension of the Real Driving Emissions (RDE) Procedure to Particle Number (PN): Chassis Dynamometer Evaluation of Portable Emission Measurement Systems (PEMS) to Measure Particle Number (PN) Concentration: Phase II. Ispra: EU Report 27451.
Giechaskiel, B., Wang, X., Horn, H., Spielvogel, J., Gerhart, C., Southgate, J., et al. (2009). Calibration of condensation particle counters for legislated vehicle number emission measurements. Aerosol Sci. Technol. 43, 1164–1173. doi: 10.1080/02786820903242029
Hallquist, Å., Jerksjö, M., Fallgren, H., Westerlund, J., and Sjödin., Å (2013). Particle and gaseous emissions from individual diesel and CNG buses. Atmos. Chem. Phys. 13, 5337–5350. doi: 10.5194/acp-13-5337-2013
HEI (2013). Understanding the Health Effects of Ambient Ultrafine Particles. HEI Perspectives 3. Health Effects Institute Review Panel on Ultrafine Particles.
Huang, C., Lou, D., Hu, Z., Feng, H., Chen, Y., Chen, C., et al. (2013). A PEMS study of the emissions of gaseous pollutants and ultrafine particles from gasoline- and diesel-fueled vehicles. Atmos. Environ. 77, 703–710. doi: 10.1016/j.atmosenv.2013.05.059
Isella, L., Giechaskiel, B., and Drossinos, Y. (2008). Diesel-exhaust aerosol dynamics from the tailpipe to the dilution tunnel. J. Aerosol Sci. 39, 737–758. doi: 10.1016/j.jaerosci.2008.04.006
Jackson, E., Qu, Y., Holmén, B., and Aultman-Hall, L. (2006). Driver and road type effects on light-duty gas and particulate emissions. Transport. Res. Rec. J. Transport. Res. Board 1987, 118–127. doi: 10.3141/1987-13
Ježek, I., Drinovec, L., Ferrero, L., Carriero, M., and Moènik, G. (2015). Determination of car on-road black carbon and particle number emission factors and comparison between mobile and stationary measurements. Atmos. Meas. Tech. 8, 43–55. doi: 10.5194/amt-8-43-2015
Johnson, K. C., Durbin, T. D., Jung, H., Chaudhary, A., Cocker, D. R., Herner, J. D., et al. (2009b). Evaluation of the European PMP methodologies during on-road and chassis dynamometer testing for DPF equipped heavy-duty diesel vehicles. Aerosol Sci. Technol. 43, 962–969. doi: 10.1080/02786820903074810
Johnson, K., Durbin, T., Cocker, D., Miller, W., Bishnu, D., Maldonado, H., et al. (2009a). On-road comparison of a portable emission measurement system with a mobile reference laboratory for a heavy-duty diesel vehicle. Atmos. Environ. 43, 2877–2883. doi: 10.1016/j.atmosenv.2009.03.019
Johnson, K., Durbin, T., Jung, H., Cocker, D. R. III, Bishnu, D., and Giannelli, R. (2011). Quantifying in-use PM measurements for heavy duty diesel vehicles. Environ. Sci. Technol. 45, 6073–6079. doi: 10.1021/es104151v
Keogh, D., and Sonntag, D. (2011). Challenges and approaches for developing ultrafine particle emission inventories for motor vehicle and bus fleets. Atmosphere 2, 36–56. doi: 10.3390/atmos2020036
Keogh, D., Kelly, J., Mengersen, K., Jayaratne, R., Ferreira, L., and Morawska, L. (2010). Derivation of motor vehicle tailpipe particle emission factors suitable for modelling urban fleet emissions and air quality assessments. Environ. Sci. Pollut. Res. 17, 724–739. doi: 10.1007/s11356-009-0210-9
Khalek, I., Kittelson, D., and Brear, F. (1999). The influence of dilution conditions on diesel exhaust particle size distribution measurements. SAE Technical Paper 1999-01-1142.
Kittelson, D., Johnson, J., Watts, W., Wei, Q., Drayton, M., and Paulsen, D. (2000). Diesel aerosol sampling in the atmosphere. SAE Technical Paper 2000-01-2212.
Kittelson, D., Watts, W., and Johnson, J. (2006a). On-road and laboratory evaluation of combustion aerosols. Part 1: summary of diesel engine results. J. Aerosol Sci. 37, 913–930. doi: 10.1016/j.jaerosci.2005.08.005
Kittelson, D., Watts, W., Johnson, J., Schauer, J., and Lawson, D. (2006b). On-road and laboratory evaluation of combustion aerosols Part 2: summary of spark ignition engine results. J. Aerosol Sci. 37, 931–949. doi: 10.1016/j.jaerosci.2005.08.008
Kumar, P., Morawska, L., Birmili, W., Paasonen, P., Hu, M., Kulmala, M., et al. (2014). Ultrafine particles in cities. Environ. Int. 66, 1–10. doi: 10.1016/j.envint.2014.01.013
Li, T., Chen, X., and Yan, Z. (2013). Comparison of fine particles emissions of light-duty gasoline vehicles from chassis dynamometer tests and on-road measurements. Atmos. Environ. 68, 82–91. doi: 10.1016/j.atmosenv.2012.11.031
Liu, Z., Ge, Y., Johnson, K., Shah, A., Tan, J., Wang, C., et al. (2011). Real-world operation conditions and on-road emissions of Beijing diesel buses measured by using portable emission measurement system and electric low-pressure impactor. Sci. Total Environ. 409, 1476–1480. doi: 10.1016/j.scitotenv.2010.12.042
Mamakos, A., Bonnel, P., Perujo, A., and Carriero, M. (2013a). Assessment of portable emission measurement systems (PEMS) for heavy-duty diesel engines with respect to particulate matter. J. Aerosol Sci. 57, 54–70. doi: 10.1016/j.jaerosci.2012.10.004
Mamakos, A., Dardiotis, C., and Martini, G. (2012). Assessment of Particle Number Limits for Petrol Vehicles. Ispra: EU Report 25592 EN.
Mamakos, A., Martini, G., and Manfredi, U. (2013b). Assessment of the legislated particle number measurement procedure for a Euro5 and a Euro6 compliant diesel passenger cars under regulated and unregulated conditions. J. Aerosol Sci. 55, 31–47. doi: 10.1016/j.jaerosci.2012.07.012
Maricq, M., Podsiadlik, D., and Chase, R. (1999). Examination of the size-resolved and transient nature of motor vehicle particle emissions. Environ. Sci. Technol. 33, 1618–1626. doi: 10.1021/es9808806
Martini, G., Giechaskiel, B., and Dilara, P. (2009). Future European emission standards for vehicles: the importance of the UN-ECE particle measurement program. Biomarkers 14, 29–33. doi: 10.1080/13547500902965393
May, J., Bosteels, D., and Favre, C. (2014). An assessment of emissions from light-duty vehicles using PEMS and chassis dynamometer testing. SAE Int. J. Engines 7, 1326–1335. doi: 10.4271/2014-01-1581
Mellios, G., Hausberger, S., Keller, M., Samaras, Z., and Ntziachristos, L. (2011). Parameterisation of Fuel Consumption and CO2 Emissions of Passenger Cars and Light Commercial Vehicles for Modelling Purposes. JRC Report 24927, Ispra.
Mendoza-Villafuerte, P., Perujo, A., Bonnel, P., Carriero, M., Forni, F., and Riccobono, F. (2015). EU-PEMS PM Pilot Program: Testing, Data Analysis and Results. JRC Report 27326, Ispra.
Merkisz, J., Pielecha, J., and Gis, W. (2009). Gaseous and particle emissions results from light duty vehicle with diesel particle filter. SAE Technical Paper 2009-01-2630.
Mock, P., German, J., Bandivadekar, A., Riemersma, I., Ligterink, N., and Lambrecht, U. (2013). From Laboratory to Road: A Comparison of Official and ‘Real-World’ Fuel Consumption and CO2 Values for Cars in Europe and the United States. ICCT White Paper. Berlin: The International Council on Clean Transportation.
Morawska, L., Ristovski, Z., Jayaratne, E., Keogh, D., and Ling, X. (2008). Ambient nano and ultrafine particles from motor vehicle emissions: characteristics, ambient processing and implications on human exposure. Atmosp. Environ. 42, 8113–8138. doi: 10.1016/j.atmosenv.2008.07.050
Ntziachristos, L., and Galassi, M. (2014). Emission Factors for New and Upcoming Technologies in Road Transport. JRC Report 26952, Ispra.
Ntziachristos, L., Mamakos, A., Samaras, Z., Rexeis, M., and Hausberger, S. (2006). Diesel particle exhaust emissions from light duty vehicles and heavy duty engines. SAE Technical Paper 2006-01-0866.
Oberdörster, G. (2000). Toxicology of ultrafine particles: in vivo studies. Philos. Trans. R. Soc. A 258, 2719–2740. doi: 10.1098/rsta.2000.0680
Oberdörster, G., Sharp, Z., Atudorei, V., Elder, A., Gelein, R., Kreyling, W., et al. (2004). Translocation of inhaled ultrafine particles to the brain. Inhal. Toxicol. 16, 437–445. doi: 10.1080/08958370490439597
Pant, P., and Harrison, R. (2013). Estimation of the contribution of road traffic emissions to particulate matter concentrations from field measurements: a review. Atmos. Environ. 77, 78–97. doi: 10.1016/j.atmosenv.2013.04.028
Peckham, M., Finch, A., Cambell, B., Price, P., and Davies, M. (2011). Study of Particle Number Emissions from a Turbocharged Gasoline Direct Injection (GDI) Engine Including Data from a Fast Response Particle Size Spectrometer. SAE Technical Paper 2011-01-1224.
Pelkmans, L., and Debal, P. (2006). Comparison of on-road emissions with emissions measured on chassis dynamometer test cycles. Transport. Res. D 11, 233–241. doi: 10.1016/j.trd.2006.04.001
Perujo, A., and Mendoza-Villafuerte, P. (2015). PEMS Emissions Testing of Heavy Duty Vehicles/Engines: Assessment of PEMS Procedures in Fulfilment of Article 14(3) to Regulation (EU) 582/2011. JRC Report 27251, Ispra.
Pope, C. A. III. (2000). Epidemiology of fine particulate air pollution and human health: biologic mechanisms and who's at risk? Environ. Health Perspect. 108, 713–723. doi: 10.2307/3454408
Ristimäki, J., Keskinen, J., Virtanen, A., Maricq, M., and Aakko, P. (2005). Cold temperature PM emissions measurement: method evaluation and application to light duty vehicles. Environ. Sci. Technol. 39, 9424–9430. doi: 10.1021/es050578e
Rönkkö, T., Virtanen, A., Vaaraslahti, K., Keskinen, J., Pirjola, L., and Lappi, M. (2006). Effect of dilution conditions and driving parameters on nucleation mode particles in diesel exhaust: laboratory and on-road study. Atmos. Environ. 40, 2893–2901. doi: 10.1016/j.atmosenv.2006.01.002
Rubino, L., Bonnel, P., Hummel, R., Krasenbrink, A., Manfredi, U., De Santi, G., et al. (2007). PEMS light duty vehicles application: experiences in downtown milan. SAE Technical Paper 2007-24-0113.
Sager, T., and Castranova, V. (2009). Surface area of particle administered versus mass in determining the pulmonary toxicity of ultrafine and fine carbon black: comparison to ultrafine titanium dioxide. Part. Fibre Toxicol. 6:15. doi: 10.1186/1743-8977-6-15
Sundvor, I., Castell Balaguer, N., Viana, M., Querol, X., Reche, C., Amato, F., et al. (2012). Road Traffic's Contribution to Air Quality in European Cities. Bilthoven: The European Topic Centre on Air Pollution and Climate Change Mitigation, ETC/ACM Technical Paper, 2012/14.
Tietge, U., Zacharof, N., Mock, P., Franco, V., German, J., Bandivadekar, A., et al. (2015). From laboratory to road: a 2015 update of official and “real-world” fuel consumption and CO2 values for passenger cars in Europe. ICCT white paper.
UN/ECE, Regulation 49. (2013). Addendum 48: Regulation No. 49, Revision 6. UNECE - United Nations – Economic Commissions for Europe. Available online at: http://www.unece.org/fileadmin/DAM/trans/main/wp29/wp29regs/2013/R049r6e.pdf
UN/ECE (2015). Addendum 82: Regulation No. 83, Revision 5. UNECE – United Nations - Economic Commission for Europe. Available online at: http://www.unece.org/fileadmin/DAM/trans/main/wp29/wp29regs/R083r5e.pdf.
Vlachos, T., Bonnel, P., Perujo, A., Weiss, M., Mendoza-Villafuerte, P., and Riccobono, F. (2014). In-use emissions testing with portable emissions measurement systems (PEMS) in the current and future European vehicle emissions legislation: overview, underlying principles and expected benefits. SAE Int. J. Commer. Veh. 7, 199–215. doi: 10.4271/2014-01-1549
Vogt, R., Scheer, V., Casati, R., and Bender, T. (2003). On-road measurement of particle emission in the exhaust plume of a diesel passenger car. Environ. Sci. Technol. 37, 4070–4076. doi: 10.1021/es0300315
Wang, J., Storey, J., Domingo, N., Huff, S., Thomas, J., and West, B. (2006). Studies of diesel engine particle emissions during transient operations using an engine exhaust particle sizer. Aerosol Sci. Technol. 40, 1002–1015. doi: 10.1080/02786820600919408
Wehner, B., Uhrner, U., von Löwis, S., Zallinger, M., and Wiedensohler, A. (2009). Aerosol number size distributions within the exhaust plume of a diesel and a gasoline passenger car under on-road conditions and determination of emission factors. Atmos. Environ. 43, 1235–1245. doi: 10.1016/j.atmosenv.2008.11.023
Weiss, M., Bonnel, P., Hummel, R., Manfredi, U., Colombo, R., Lanappe, G., et al. (2011b). Analyzing On-Road Emissions of Light-Duty Vehicles with Portable Emission Measurement Systems (PEMS). JRC report 24697, Ispra.
Weiss, M., Bonnel, P., Hummel, R., Provenza, A., and Manfredi, U. (2011a). On-road emissions of light-duty vehicles in Europe. Environ. Sci. Technol. 45, 8575–8581. doi: 10.1021/es2008424
Weiss, M., Bonnel, P., Hummel, R., and Steininger, N. (2013). A Complementary Emissions Test for Light-Duty Vehicles: Assessing the Technical Feasibility of Candidate Procedures. Conclusions of the Real Driving Emissions – Light Duty Vehicles (RDE-LDV) Working Group. JRC Report 25572, Ispra.
Weiss, M., Bonnel, P., Provenza, A., Lambrecht, U., Alessandrini, S., Carriero, M., et al. (2012): Will Euro 6 reduce the NOx emissions of new diesel cars? Preliminary conclusions from on-road emissions tests with Portable Emission Measurement Systems (PEMS). Atmos. Environ. 62, 657–665. doi: 10.1016/j.atmosenv.2012.08.056.
WHO (2013). Review of Evidence on Health Aspects of Air Pollution - REVIHAAP Project. WHO Technical Report, World Health Organization, Regional Office for Europe, Copenhagen, Denmark.
Witze, P., and Green, R. (2005). Comparison of single and dual spray fuel injectors during cold start of a PFI spark ignition engine using visualization of liquid fuel films and pool fires. SAE Technical Paper 2005-01-3863.
Zacharof, N., Fontaras, G., Tsiakmakis, S., Ciuffo, B., Codrea, C., and Anagnostopoulos, K. (2015). Review of in use Factors Affecting the Fuel Consumption and CO2 Emissions of Passenger Cars. Ispra: EU Report.
Zheng, Z., Durbin, T., Xue, J., Johnson, K., Li, Y., Hu, S., et al. (2014). Comparison of particle mass and solid particle number (SPN) emissions from a heavy-duty diesel vehicle under on-road driving conditions and a standard testing cycle. Environ. Sci. Technol. 48, 1779-1786. doi: 10.1021/es403578b
Keywords: particle number, Real Driving Emissions, RDE, PMP, WLTC tests, regeneration, cold-start, nucleation mode
Citation: Giechaskiel B, Riccobono F, Vlachos T, Mendoza-Villafuerte P, Suarez-Bertoa R, Fontaras G, Bonnel P and Weiss M (2015) Vehicle Emission Factors of Solid Nanoparticles in the Laboratory and on the Road Using Portable Emission Measurement Systems (PEMS). Front. Environ. Sci. 3:82. doi: 10.3389/fenvs.2015.00082
Received: 12 September 2015; Accepted: 04 December 2015;
Published: 22 December 2015.
Edited by:
Leonidas Ntziachristos, Aristotle University of Thessaloniki, GreeceReviewed by:
Stavros Amanatidis, Aristotle University of Thessaloniki, GreeceHugo Tor Levi Wihersaari, Tampere University of Technology, Finland
Copyright © 2015 Giechaskiel, Riccobono, Vlachos, Mendoza-Villafuerte, Suarez-Bertoa, Fontaras, Bonnel and Weiss. This is an open-access article distributed under the terms of the Creative Commons Attribution License (CC BY). The use, distribution or reproduction in other forums is permitted, provided the original author(s) or licensor are credited and that the original publication in this journal is cited, in accordance with accepted academic practice. No use, distribution or reproduction is permitted which does not comply with these terms.
*Correspondence: Barouch Giechaskiel, barouch.giechaskiel@jrc.ec.europa.eu