Rigorous Selection of Random Forest Models for Identifying Compounds that Activate Toxicity-Related Pathways
 Yoshihiro Uesawa
- Department of Clinical Pharmaceutics, Meiji Pharmaceutical University, Tokyo, Japan
Random forest (RF) is a machine-learning ensemble method with high predictive performance. Majority voting in RF uses the discrimination results in numerous decision trees produced from bootstrapping data. For the same dataset, the bootstrapping process yields different predictive capacities in each generation. As participants in the Toxicology in the Twenty-first Century (Tox21) DATA Challenge 2014, we produced numerous RF models for predicting the structures of compounds that can activate each toxicity-related pathway, and then selected the model with the highest predictive ability. Half of the compounds in the training dataset supplied by the competition organizer were allocated to the validation dataset. The remaining compounds were used in model construction. The charged and uncharged forms of each molecule were calculated using the molecular operating environment (MOE) software. Subsequently, the descriptors were computed using MOE, MarvinView, and Dragon. These combined methods yielded over 4,071 descriptors for model construction. Using these descriptors, pattern recognition analyses were performed by RF implemented in JMP Pro (a statistical software package). A hundred to two hundred RF models were generated for each pathway. The predictive performance of each model was tested against the validation dataset, and the best-performing model was selected. In the competition, the latter model selected a best-performing model from the 50% test set that best predicted the structures of compounds that activate the estrogen receptor ligand-binding domain (ER-LBD).
Introduction
The Toxicology in the Twenty-first Century (Tox21) challenge, launched in the United States in 2008, is the largest study of toxic substances to date (Shukla et al., 2010). The Tox21 project is promoted as a collaborative research among the National Institute of Health (NIH), Environmental Protection Agency (EPA), and Food and Drug Administration (FDA), and accords with the Memorandum of Understanding, which outlines the legal requirements of collaboration among U.S. public institutions (http://epa.gov/ncct/Tox21/; Ettlin, 2013; Tice et al., 2013). Tox21 is a far-reaching plan embracing the understanding of toxicities, establishment of evaluation systems, comprehensive experimental analyses, and constructions of prediction methods. Tox21 provides a chemical library of approximately 10,000 typical toxic compounds (the Tox21 10K library) as proper objects for toxicity evaluations (Hsieh et al., 2015). Activation and inhibition of various nuclear receptors such as the androgen receptor (AR), aryl hydrocarbon receptor (AhR), Ligand-binding domain of the androgen receptor (AR-LBD), estrogen receptor α (ER), ligand-binding domain of the estrogen receptor α (ER-LBD), aromatase and peroxisome proliferator-activated receptor γ (PPAR-γ), and stress response pathways such as nuclear factor (erythroid-derived 2)-like 2/antioxidant responsive element (ARE), ATP-ase family AAA domain containing 5 (ATAD5), heat shock factor response element (HSE), mitochondrial membrane potential (MMP), and p53 were selected as investigation items in toxicity evaluation for the Tox21 10K library based on a published research for key regulatory pathways that integrate genetic and environmental modulators (Gohlke et al., 2009). One goal of Tox21 is to construct prediction models of toxicity-related biological activities from chemical structures. NIH's National Center for Advancing Translational Sciences (NCATS) organized the Tox21 Data Challenge 2014, in which participants compete in predicting biological toxic responses using computational toxicology technologies (https://tripod.nih.gov/tox21/challenge/index.jsp). Competitors predicted the existence of unpublished activities of various “evaluation set compounds” from the chemical structures and known activities of “training set compounds” extracted from the Tox21 10K library. The competition targets were the 12 proteins/pathways mentioned above, including PPARγ and p53 (Shukla et al., 2010). On a homepage designed for the challenge, the organizers uploaded the chemical structures of approximately 8,000 compounds in the Tox21 10K library as the target data, and their assay results of the proteins/pathways as the training set. As the evaluation set, they also offered the chemical structures of 647 compounds without the assay results. Each model submitted by the registered teams was ranked by its ability to predict the activities in the evaluation set. We registered the prediction results of 7 proteins/pathways based on random forest (RF) models (Breiman, 2001) with elaborate technologies, which yielded excellent prediction results. In particular, among the submitted models, our model best predicted the active compounds in the ER-LBD assay system (http://ncats.nih.gov/news/releases/2015/tox21-challenge-2014-winners). The RF method constructs many decision-trees and averages the predicted values to obtain the final ones. Trees are grown by bootstrapping samples of observations, and each split on each tree considers a randomly sampled descriptor. The current study describes the construction of our model and the characteristics of the prediction results in the Tox21 data challenge 2014.
Materials and Methods
Conformations
The training dataset includes both chemical structures and activities; the evaluation dataset includes only the chemical structures. Both datasets were downloaded from the homepage set up for the challenge (https://tripod.nih.gov/tox21/challenge/index.jsp). The prediction model for discriminating between active and inactive compounds in the assays of each sub-challenge was constructed from the training dataset in the SDF files. The SDF files were changed to mdb file format by molecular operating environment (MOE) 2013.08 (Chemical Computing Group Inc., Quebec, Canada), which also cleaned up the chemical structures, removing smaller molecules such as counter-ions. Meanwhile, the charged and uncharged forms of each molecule were calculated using the protonation function in MOE. In other words, if there were chargeable functional groups in a chemical structure, both charged and uncharged forms were generated for that structure. Partial charges with force field (MMFF94x) parameters were allocated to the atoms in each molecule (Halgren, 1996). Next, the local-minimum 3D conformations of the charged and uncharged forms were computed by the MOE's Rebuild3D minimization function. The charged and uncharged forms might introduce different descriptors with different 3D/topological conformations and counts of functional groups. Therefore, acquisition of the descriptors should provide detailed molecular information on each chemical structure.
Descriptors
A variety of descriptors were computed by 3 software packages: MOE, MarvinView 5.12.4 (ChemAxon Kft., Budapest, Hungary), and Dragon 6 (Talete srl., Milano, Italy). Excluding the overlapping descriptors, 4071 descriptors were selected for constructing the prediction models. These descriptors are summarized in Supplemental Table 1. However, some of the descriptors could not be calculated in lithium, which was included in the evaluation datasets. Because the structural and physicochemical properties in lithium were dissimilar to all other compounds in the datasets, the activity of lithium was evaluated with the lowest probability among the compounds in the evaluation datasets.
Datasets
In seven of the sub-challenge targets (ER, ARE, p53, PPAR-γ, ATAD5, ER-LBD, and AhR), half of the compounds in each training dataset were randomly selected as the validation dataset (50% test set). The remaining compounds in the training datasets (50% training set) were used to construct the prediction models. That is, the 50% test set was used to externally validate the constructed models but not the internal data generating the RF resampling processes. The evaluation process is outlined in Figure 1. The evaluation set in Figure 1 is the final evaluation set prepared by the competition organizer. This set included 647 chemical structures without their assay results during the period of the competition.
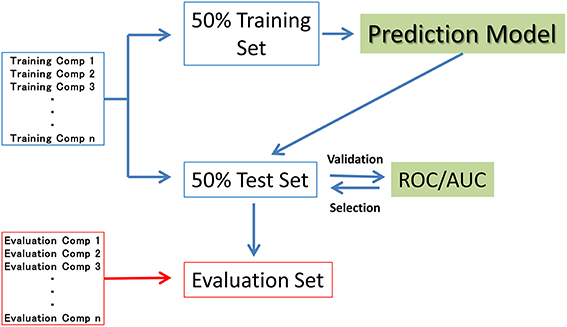
Figure 1. Datasets used in model construction.
Pattern Recognition and Rigorous Selection
Pattern recognition analyses of these descriptors were performed by the RF method (Breiman, 2001) using the bootstrap-forest function in the statistical software package JMP Pro 10.02 (SAS Institute Inc., Cary, NC, USA).
Because they perform bootstrapping, RF models have different predictive performances for the same combination of hyperparameters. The contribution of a combination can be checked by comparing the performance of that combination with the average performance of plural models. Therefore, to select the best combination of hyperparameters, we estimated at least 10 models with each combination. The hyperparameter decision step was based on data sets with ER-LBD. Specifically, we estimated the discrimination abilities of the models for predicting compound activities by the area under the receiver operating characteristic curve (ROC–AUC), which scores the probability of activity of the compound. The predictive performance of each model contributed from 50% of the ER-LBD training set was evaluated on the 50% test set in the assay result. Based on the investigations, the hyperparameters were set as follows: Number of Trees, specifying the number of trees to grow before averaging (100), Number of Terms, denoting the number of columns specified as predictors (1032), Bootstrap Sample Rate, specifying the proportion of observations sampled in each tree growth (1), Maximum Splits Per Tree, defining the minimum number of splits in each tree (2000), and Minimum Size Split, defining the minimum number of observations required for candidate splitting (2). The same hyperparameters were applied in all predictions of all targets. Using combinations of these hyperparameters, from 100 to 200 RF models were generated for each target (the numbers of the models, decided a priori, were 192, 100, 150, 109, 151, 200, and 132 in ER, ARE, p53, PPAR-γ, ATAD5, ER-LBD, and AhR, respectively), and their predictive performances were evaluated on the 50% test set in each sub-challenge. After the competition, the assay results of the evaluation set were available for viewing. Therefore, we could compute the ROC-AUC values in the evaluation set and the prediction results of the numerous RF models for ER-LBD constructed by the above method. The modeling process was validated in ROC-AUC comparisons of the 50% training set and 50% test set (Figure 2). In this validation, prediction values in the 50% training set and 50% test set as well as in the evaluation set were recalculated for the different values of the hyperparameters, Number of Terms (1–1000), and Maximum Splits Per Tree (2–400) during the construction of 190 models.
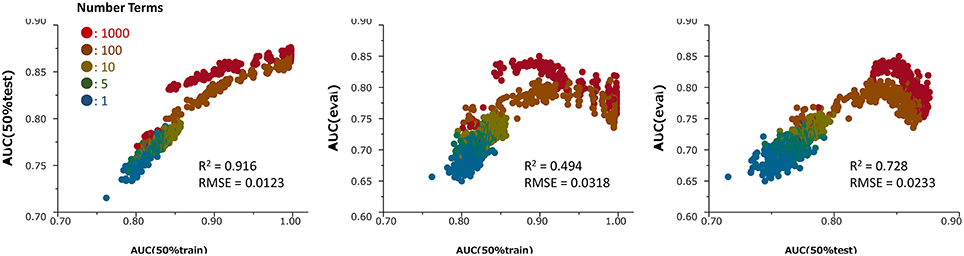
Figure 2. Relationships among the ROC-AUC values of numerous prediction models in the ER-LBD test, training and evaluation datasets for different values of the hyperparameter Number of Terms (1–1000) and Maximum Splits Per Tree (2–400) during the construction of 190 models. R2 and RMSE means determination coefficient and root mean squared error, respectively.
Computational Environment
All simulations were performed on a desktop personal computer: Endeavor MR7200-M (Epson Direct Corporation, Nagano, Japan) with Windows 7 sp1 (64 bit), an Intel® Core™i7-4790 CPU (3.6 GHz), and 32.0 GB RAM.
Results
Rigorous Selection
Figure 2 presents the relationships among the ROC-AUC values of ER-LBD obtained by the RF models in the 50% training set, 50% test set, and evaluation set for different values of the hyperparameters Number of Terms (1–1000) and Maximum Splits Per Tree (2–400). The AUC values in the 50% training set were well-correlated with those in the 50% test set. However, the AUC values in the 50% test set and the final evaluation set were not simply correlated; rather, there was an optimal point at which the AUC of the 50% test set corresponded to the highest AUC of the evaluation model.
Targets
The RF models described in the Methods section were constructed for 7 targets; namely, ER, ARE, p53, PPAR-γ, ATAD5, ER-LBD, and AhR. Using these models, we predicted the activities of the compounds included in the final evaluation set of the targets. The model performances were evaluated by their ROC–AUC values and their rankings in the Tox21 data challenge 2014 (Table 1; https://tripod.nih.gov/tox21/challenge/index.jsp). In the competition, 125 participants were registered from 18 countries, and finally, 40 teams from 11 countries submitted prediction models (Huang et al., 2015). Most of our models were within the top 10 of the registered sub-challenges. In particular, our models achieved the highest ROC–AUC in the ER-LBD sub-challenge. The estimated scores of the compounds in the evaluation set of each target are plotted against the assay results in Figure 3.
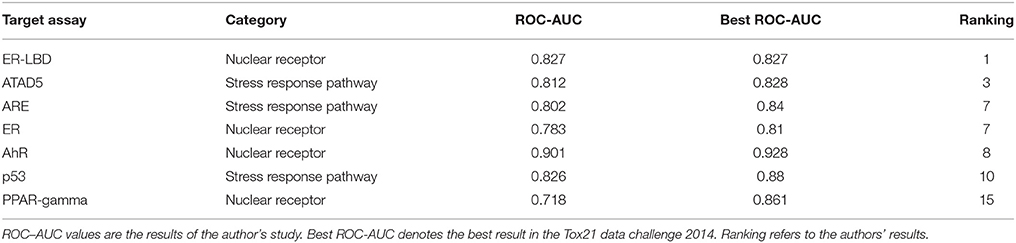
Table 1. ROC–AUC values of the RF models.
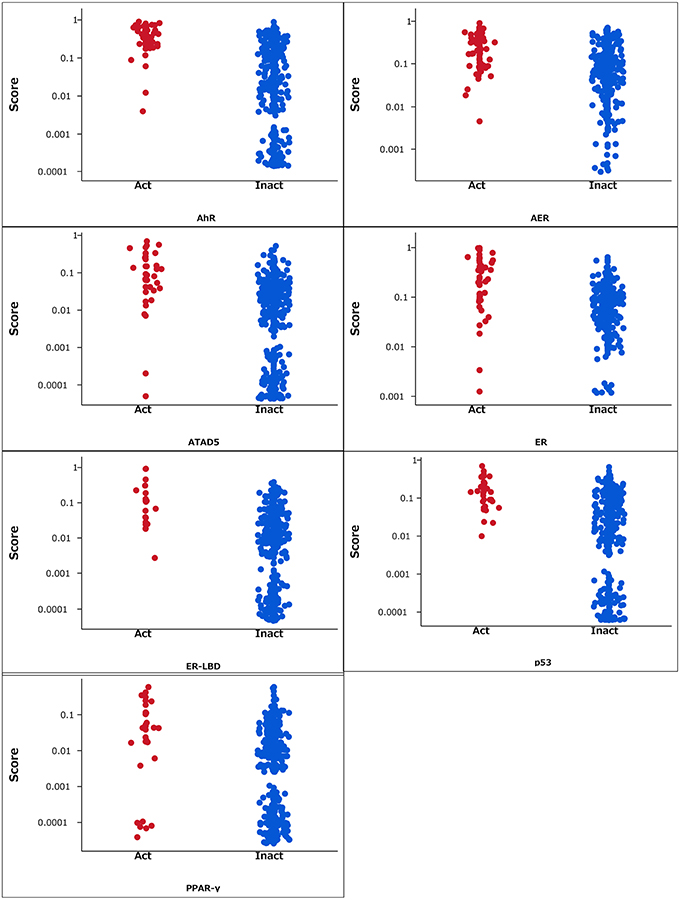
Figure 3. Estimated scores of compounds in the evaluation set. Act and Inact denotes the active and inactive results in each assay.
Discussion
In constructing the prediction models, we considered the various factors discussed below.
Charged and Uncharged Forms
For chemical structures with chargeable functional group(s), we generated both the charged form under neutral pH conditions and the uncharged form. The structures of these forms should differ in their numbers of functional groups and optimized 3D-conformations. Therefore, by constructing both forms, we can extract more structural information from each molecule because of the greater variety of generated descriptors. Actually, a previous investigation confirmed that including the descriptors from both forms improved the predictive ability of the RF models, relative to descriptors from unilateral forms (data not shown).
Usage of Numerous Descriptors
To maximize the information on the chemical structures, we calculated numerous descriptors including structural and physicochemical features using the MOE, Marvin, and Dragon software packages. Approximately 10,000 descriptors were generated from the above-described charged and uncharged forms. After discarding the overlapping descriptors, we obtained 4,000 descriptors for the modeling studies.
RF Model
The model construction was based on the RF algorithm (Breiman, 2001), which has advantage of high prediction potency, low computational cost, handling of large and prejudiced data, and resistance to effects containing outliers (Bruce et al., 2007). On account of its high cost performance, model construction by RF can proceed in standard computing environments. Because it ranks the contributions of the model descriptors, the RF algorithm can also estimate the importance of physicochemical features of the compounds during interactions with biopolymers such as proteins. For instance, the importance of the descriptors in constructing the ER-LBD model was estimated from the entropic changes and the descriptor-usage numbers at the split points. In this model, the most significant descriptors were the number of aromatic hydroxyls (nArOH) and the smallest eigenvalue (n.1) of the mass-weighted Burden matrix (SpMin1_Bh_m) (sup. Table 1) (Burden, 1989; Todeschini and Consonni, 2009). Such characteristics of the RF algorithm might provide useful knowledge for understanding the interactions.
Rigorous Model Selection
A high-performance model was selected among numerous RF models. When constructing the RF models, we performed bootstrap sampling of compound–descriptor combinations. Because the bootstrap process is repeated randomly, each constructed model has a unique predictive ability. For example, the average, highest and lowest ROC-AUC values among numerous ER-LBD prediction models in the trial shown in Figure 2 were respectively 0.869, 0.998, and 0.762 in the 50% training set, 0.802, 0.876, and 0.715 in the 50% test set, and 0.743, 0.850, and 0.650 in the evaluation set. Selection of the submitted models was based on their prediction potentials in the 50% test set. The competition rules allowed free selection of the target pathways for submission. Our 7 targets were selected from the 12 pathways for no special reason. Although we did not attempt to predict the active compounds in the remaining five pathways, we expect that our method would predict these with equal efficacy.
Furthermore, our rigorous model selection strategy successfully predicted the ATAD5, ARE, ER, AhR, and p53 pathways. The ROC–AUC values obtained for these pathways ranked among the top 10 registered by competitors (Table 1). In contrast, the predictive performance of PPAR-γ (ROC–AUC = 0.718) was ranked at 15. Such varying performance for different targets might reflect varying compatibility with the hyperparameter combination in the RF modeling. The hyperparameter combination was determined from the training data for ER-LBD, and might be markedly suboptimal for PPAR-γ prediction.
After the competition, the assay results of the compounds in the evaluation set were opened for viewing, so we could validate the current construction method of the RF models. Scatter plots between the ROC-AUC values in the 50% test set and evaluation set revealed a strong correlation between the 50% test set and the evaluation dataset, confirming the prediction potential of the models for this dataset (Figure 2). This result supports the strategy of selecting the best model from numerous RF models, based on their ROC-AUC values of the 50% test set. However, the optimal combinations of hyperparameters for predicting the evaluation set and the 50% test set were non-identical. The best-performing models for the test set may be overfitted. To improve the model selection, we should use the current results to refine the hyperparameter combinations.
Conclusions
We have constructed a high-performance single RF model for biological pathway prediction. The method succeeded by rigorously selecting the best model among numerous previous models. Each of the previous models has a unique performance because of the bootstrap data sampling used in model construction. Increasing the number of previous models and refining the hyperparameter combinations might improve the final model. In other words, the generalizability of the prediction models can be influenced by the number of generated RF models, which depends on the performance of the computational environment.
Author Contributions
The author confirms being the sole contributor of this work and approved it for publication.
Conflict of Interest Statement
The author declares that the research was conducted in the absence of any commercial or financial relationships that could be construed as a potential conflict of interest.
Acknowledgments
The author is grateful to Mr. Yuki Asako, Department of Clinical Pharmaceutics, Meiji Pharmaceutical University for skillful technical assistance. This work was partially supported by KAKENHI from the Japan Society for the Promotion of Science (JSPS) (15K08111 and 25460227). The annual license of the statistical software, JMP Pro, was supported by the grant-in-aid of the oncology specialists' promotion program by the Ministry of Education, Culture, Sports, Science, and Technology, Japan.
Supplementary Material
The Supplementary Material for this article can be found online at: https://www.frontiersin.org/article/10.3389/fenvs.2016.00009
Supplemental Table 1. Descriptors.
References
Bruce, C. L., Melville, J. L., Pickett, S. D., and Hirst, J. D. (2007). Contemporary QSAR classifiers compared. J. Chem. Inf. Model. 47, 219–227. doi: 10.1021/ci600332j
Burden, F. R. (1989). Molecular identification number for substructure searches. J. Chem. Inf. Comp. Sci. 29, 225–227.
Ettlin, R. A. (2013). Toxicologic pathology in the 21st century. Toxicol. Pathol. 41, 689–708. doi: 10.1177/0192623312466192
Gohlke, J. M., Thomas, R., Zhang, Y., Rosenstein, M. C., Davis, A. P., Murphy, C., et al. (2009). Genetic and environmental pathways to complex diseases. BMC Syst. Biol. 3:46. doi: 10.1186/1752-0509-3-46
Halgren, T. A. (1996). Merck molecular force field. I. Basis, form, scope, parameterization, and performance of MMFF94. J. Comp. Chem. 17, 490–519.
Hsieh, J. H., Sedykh, A., Huang, R., Xia, M., and Tice, R. R. (2015). A Data Analysis Pipeline Accounting for Artifacts in Tox21 Quantitative High-Throughput Screening Assays. J. Biomol. Screen. 20, 887–897. doi: 10.1177/1087057115581317
Huang, R., Xia, M., Nguyen, D., Zhao, T., Sakamuru, S., Zhao, J., et al. (2015). Tox21 Challenge to build predictive models of nuclear receptor and stress response pathways as mediated by exposure to environmental chemicals and drugs. Front. Environ. Sci. 3:85. doi: 10.3389/fenvs.2015.00085
Shukla, S. J., Huang, R., Austin, C. P., and Xia, M. (2010). The future of toxicity testing: a focus on in vitro methods using a quantitative high-throughput screening platform. Drug Discov. Today 15, 997–1007. doi: 10.1016/j.drudis.2010.07.007
Keywords: random forest model, estrogen receptor ligand-binding domain, model-selection, Tox21 DATA Challenge 2014, pattern recognition
Citation: Uesawa Y (2016) Rigorous Selection of Random Forest Models for Identifying Compounds that Activate Toxicity-Related Pathways. Front. Environ. Sci. 4:9. doi: 10.3389/fenvs.2016.00009
Received: 07 September 2015; Accepted: 28 January 2016;
Published: 15 February 2016.
Edited by:
Ruili Huang, NIH National Center for Advancing Translational Sciences, USAReviewed by:
Luis Gomez, University of Las Palmas de Gran Canaria, SpainMinjun Chen, Food and Drug Administration, USA
Copyright © 2016 Uesawa. This is an open-access article distributed under the terms of the Creative Commons Attribution License (CC BY). The use, distribution or reproduction in other forums is permitted, provided the original author(s) or licensor are credited and that the original publication in this journal is cited, in accordance with accepted academic practice. No use, distribution or reproduction is permitted which does not comply with these terms.
*Correspondence: Yoshihiro Uesawa, uesawa@my-pharm.ac.jp