Waves of El Niño-Southern Oscillation and Influenza Pandemics
 Olusegun S. A. Oluwole
- Neurology Unit, College of Medicine, University of Ibadan, Ibadan, Nigeria
Influenza pandemics has occurred at irregular intervals for over 500 years, unlike seasonal influenza epidemics which occur annually. Although the risk factors are known, the basis for the timing of influenza pandemic waves are unknown. Coherence of peaks of El Niño and influenza pandemic in 2009–2010, however, suggest that both waves are coupled. This study was done to determine the relation of influenza pandemics to the peaks and waveforms of El Niño southern oscillation (ENSO). ENSO cycles from 1871 to 2015 which had El Niño phases were windowed from Multivariate El Niño Index. Influenza pandemic peaks were mapped to ENSO monthly time series. ENSO waveforms were compared graphically, and fitted to non-stationary cosinor models. Second order polynomial regression model was fitted to the peak and duration of El Niño. Agglomerative hierarchical cluster of ENSO waveforms was performed. All influenza pandemic peaks mapped to El Niño peaks, with lags of 0–5 months. ENSO waveforms during influenza pandemics share parameters of oscillation. Non-stationary cosinor models showed that ENSO cycles are complex waves. There was second order polynomial relationship between peak and duration of El Niños, p < 0.0001. ENSO waveforms clustered into four distinct groups. ENSO waveforms during influenza pandemics of 1889–1900, 1957–1958, and 1968–1969 linked closely. ENSO indices were significantly high from 7 to 16 months after onset of cycles, p < 0.0001. Global reduction of precipitation by El Niños of certain spatial and temporal evolution promote aerosol transmission and survival of novel influenza A viruses. Surveillance for El Niño events to forecast periods of maximal transmission and survival of influenza A viruses is, therefore, crucial for public health control strategies.
Introduction
The word influenza, which attributed fever, cough, and cold to the influence of the stars, was coined in Italy in 1357 AD (Lina, 2008). Influenza pandemics have been documented for over 500 years, but there is consensus that influenza pandemics that occurred since 1700 were less likely to be mistaken for other febrile illnesses (Potter, 2001; Lina, 2008). The intervals between historical influenza pandemics have been estimated to vary from 10 to 50 years (Potter, 2001) and 6–149 years (Morens et al., 2010), unlike seasonal influenza epidemics, which occur annually during the winter of northern and southern hemispheres (Oluwole, 2015). Further, influenza pandemics peak multiple times, but the peaks are not restricted to winter seasons (Taubenberger and Morens, 2006). Although the basis for the timing of influenza pandemic waves are not established, it has been attributed to timing of school calendar, demography, geography, changes in virulence of influenza A viruses strains, and waning immunity (Mummert et al., 2013).
Seasonal changes in humidity has been proposed the basis for influenza pandemics, and for annual epidemics of influenza, which occur during the winter in temperate regions (Shaman and Kohn, 2009; Shaman et al., 2011). Transmission and survival of influenza virus has been shown experimentally to increase when absolute humidity decreases (Shaman and Kohn, 2009). El Niño southern oscillation (ENSO), however, modulates interannual and interdecadal changes in precipitation of all parts of the earth through teleconnection (Wang and Ropelewski, 1985; An and Wang, 2000). Changes in occurrence of seasonal influenza epidemics have been correlated with interannual changes in indices of ENSO (Oluwole, 2015). Occurrence of seasonal influenza epidemics was highest during El Niño, the warm phase of ENSO, but lowest during La Niña, its cool phase (Oluwole, 2015). Coupling of peaks of 2009–2010 El Niño and influenza pandemic (Oluwole, 2015) suggest phase-locking of El Niño and influenza pandemics waves. Features of ENSO include phase locking of its El Niño phase to seasons (Rasmusson and Carpenter, 1982), amplitude modulation, and decadal changes in frequencies (Wang and Ropelewski, 1985; An and Wang, 2000). There are, however, different types of El Niños, which include Central-Pacific, Eastern-Pacific, and mixed types (Yu and Kim, 2013), but it is not known if a specific type of El Niño is associated with influenza pandemics. This study was done to determine the relation of influenza pandemics to the peaks and waveforms of ENSO.
Methods
Data
Years of occurrence all influenza pandemics from 1871 to 2015 and months of their peaks were obtained from the literature (Taubenberger and Morens, 2006; Richard et al., 2009; Bandaranayake et al., 2011; Kempinska-Miroslawska and Wozniak-Kosek, 2013; Mummert et al., 2013; Skog et al., 2014). Years of all El Niño events from 1871 to 2015 were obtained from the literature (Quinn and Neal, 1987) and Oceanic Niño index (National Oceanic Atmospheric Administration, 2015e). Types of El Niños from 1871 to 2015 were obtained from the literature (Yu and Kim, 2013). ENSO data from 1871 to 2005 were obtained from Extended Multivariate El Niño Index (MEI.ext) (National Oceanic Atmospheric Administration, 2015a), which are derived from sea level pressure and sea surface temperature (Allan and Ansell, 2006), while ENSO data from 1950 to 2015 were obtained from Multivariate El Niño Index (MEI) data (National Oceanic Atmospheric Administration, 2015c), which are derived from sea-level pressure, zonal and meridional components of the surface wind, sea surface temperature, surface air temperature, and total cloudiness fraction of the sky of the South Pacific Ocean (Wolter and Timlin, 1998). Although the correlation of MEI and MEI.ext indices for the period 1950–2005 across all seasons is 0.97 (Wolter and Timlin, 2011), the two datasets were analyzed separately. ENSO cycles were windowed from the time series from January of the year of onset of El Niño to its lowest decay value below the mean. Ranks of monthly ENSO indices for MEI.ext (National Oceanic Atmospheric Administration, 2015b) and MEI data (National Oceanic Atmospheric Administration, 2015d) were obtained from NOAA.
Waveforms of ENSO
Time series were fitted to ENSO cycles of both MEI.ext and MEI data. Each ENSO cycle was assigned its highest monthly MEI rank, which was used to group the cycles into quantiles. The time series were plotted, and their waveforms in the quantiles were compared.
Non-stationary cosinor model was fitted to each cycle. The formula for the model is
where At is amplitude, Pt is phase, c is period, and t is time. Model fit was assessed using autocorrelation of residuals. Plots of the fitted values for ENSO cycles during influenza pandemics, and for ENSO cycles of 1982–1983 and 1997–1998 were displayed.
Peaks of indices for each ENSO cycle, and duration of ENSO ≥ 0.75 index value were determined. Peaks and duration of ENSO cycles ≥ 0.75 were fitted to second order polynomial regression to determine the relationship of strength and duration of El Niño.
Hierarchical Agglomerative Clustering
Hierarchical agglomerative clustering was done to determine the spatial and temporal similarities between the time series of El Niño years. Distance matrix was calculated for ENSO cycles using dynamic time warping algorithm, while clustering was performed using the complete method. Each ENSO cycle was characterized by type of El Niño which may be Central Pacific or Eastern Pacific, year of occurrence, rank, and occurrence of influenza pandemic. Cluster validation was performed using Hubert and Dindex graphical methods. Dendrogram and heatmap were plotted.
The distributions of peaks and duration of ENSO ≥ 0.75 index in distinct clusters were compared, using univariate non-parametric Kruskal-Wallis ANOVA. Post hoc tests were performed using the Kruskal-Nemenyi test. Chi square test of independence was performed to compare the types of El Niño in the clusters.
Statistics
Statistical analyses were performed using the R Statistical Programming and Environment, Austria, version 3.2.2, 2015 (R Core Team, 2015). Non-stationary cosinor models were fitted using the season package. Cluster validation using the NbClust package, heatmap and dendrogram using the dendextend and gplots packages, while post hoc Kruskal-Nemenyi test by PMCMR package, and other graphics by ggplot2 package. Second order polynomial regression was fitted using the base package.
Results
Peaks of Influenza Pandemics and ENSO
Five influenza pandemics occurred in 1899–1900, 1918–1919, 1957–1958, 1968–1969, and 2009–2010. Peaks of influenza pandemics were in December 1899 and 1900, March 1901, March and July 1918, November 1919, January 1920, October 1957, February 1958, March and December 1969, January 1970, June and October 2009. Peaks of all influenza pandemics mapped to El Niño peaks in both MEI.ext and MEI data, Figure 1. Median lag of influenza pandemic peaks was 1 month (range 0–5) for MEI.ext data, but 1 month (range 0–2) for MEI data. The median interval between influenza pandemics from 1899 to 2015 was 29 years (range 11–41).
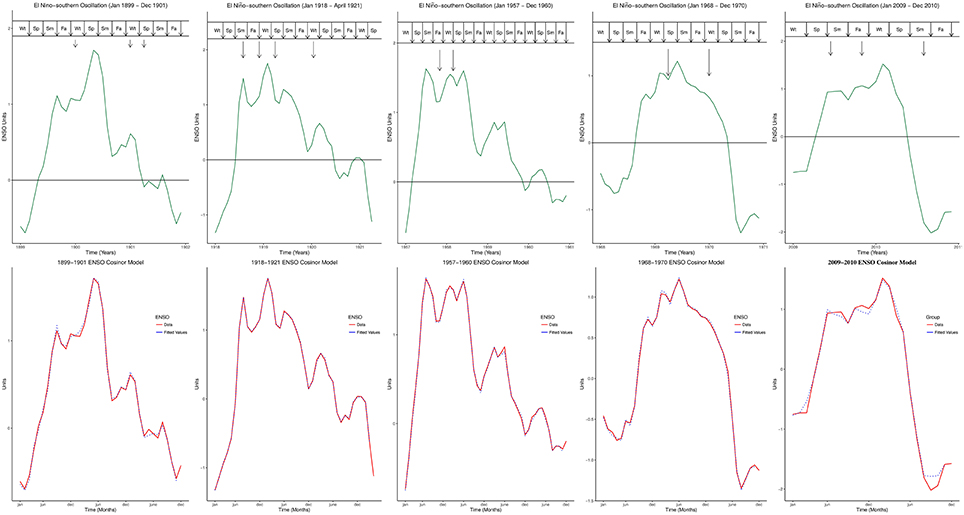
Figure 1. Peaks of influenza Pandemics, El Niños, and Cosinor models. Wt, Winter; Sp, Spring; Sm, Summer; Fa, is Fall.
There were 29 ENSO cycles which had El Niño phases, 6 (21%) Central Pacific and 23 (71%) Eastern Pacific types in the MEI.ext data. Of 5 El Niños during influenza pandemics 2 (40%) were Central Pacific, while 3 (60%) were Eastern Pacific. The median rank of ENSO cycles in the MEI.ext data was 128 (range 109–135), of possible ranks of 1–135, but 61 (range 53–66) in the MEI data, of possible ranks of 1–66. The median rank of ENSO cycles during influenza pandemics was 128 (range 119–129) in the MEI.ext data, but 55, 61, and 63 in the MEI data. The median duration (range) of ENSO indices > 0.75 was 12 months (1–28) for MEI.ext data, but 10 months (1–18) for MEI based data.
Within the first and third quantiles, which contained the ENSO cycles during influenza pandemics, the median duration of El Niños were 14 months (10–20) for pandemic ENSO cycles, but 9 months (1–14) for non-pandemic ENSO cycles, while the median peak of El Niños (range) was 1.7 (1.2–1.8) for pandemic ENSO cycles, but 1.2 (0.8–1.9) for non-pandemic ENSO cycles. Numbers were too small for statistical comparisons.
Waveforms of ENSO
Figure 2A showed the ENSO waveforms of 1899–1901, 1918–1921, and 1957–1960, while Figure 2B showed the ENSO waveforms of 1968–1970, and 2009–2010. The waveforms of ENSO cycles in quantiles of ranks are shown in Figure 3. Six ENSO cycles ranked 104–119, 7 ranked 120–127, 6 ranked 128–131, and 10 ranked 132–135. The non-stationary cosinor models of ENSO waveforms of 1899–1900, 1918–1920, 1957–1959, 1968–1970, 1982–1983 and 1997–1998, are shown in Figure 1. Second order polynomial regression model showed significant association of peak and duration of El Niño in both MEI.ext and MEI data, p < 0.0001, Figure 4.
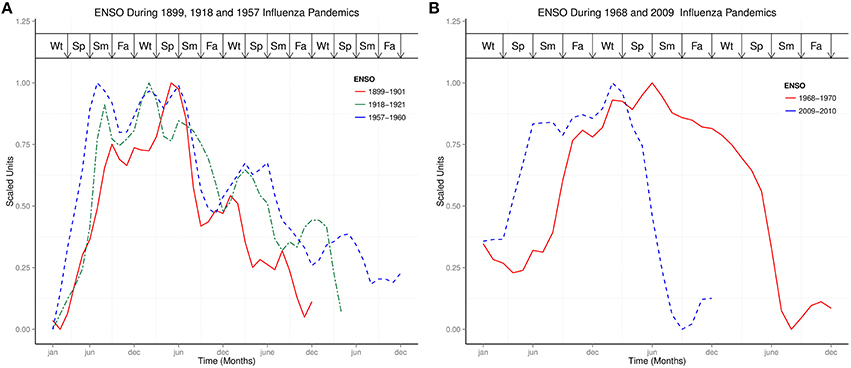
Figure 2. Comparisons of ENSO waveforms during influenza pandemics. (A) ENSO Waveforms of 1899–1901, 1918–1921, and 1957–1960. (B) ENSO Waveforms of 1968–1970, and 2009–2010.
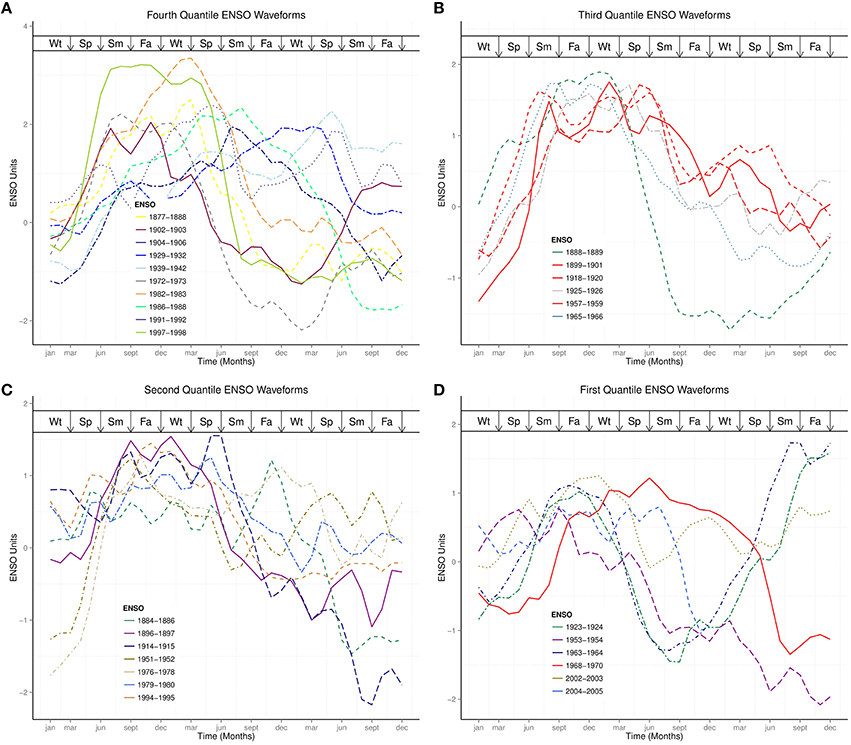
Figure 3. ENSO waveforms of similar strength. (A) Fourth Quantile ENSO Waveforms. (B) Third Quantile ENSO Waveforms. (C) Second Quantile ENSO Waveforms. (D) First Quantile ENSO Waveforms. Wt, Winter; Sp, Spring; Sm, Summer; Fa, Fall.
Figure 4. Peak and duration of El Niños. (A) MEI.ext Data El Nino Peak and Duration. (B) MEI Data El Nino Peak and Duration.
Clustering
Both Dindex and Hubert cluster validation methods showed four significantly distinct clusters. Dendrogram and heatmap of ENSO cycles MEI.ext data are shown in Figure 5, while that of MEI data are shown in Figure 6. Cluster A in red had 2 ENSO cycles, cluster B in brown had 8 ENSO cycles, cluster C in green had 9 ENSO cycles, and cluster D in blue had 10 ENSO cycles, Figure 5. ENSO cycles of 1982–1983 and 1997–1998, which had the strongest El Niño in the past century, are in cluster A. ENSO cycles during influenza pandemics of 1889–1900, 1957–1958, and 1968–1969 linked closely in cluster C, while ENSO cycle during the influenza pandemic of 1918–1919 is in cluster D. Instrument based data also showed that ENSO cycles during influenza pandemics of 1957–1958 and 1968–1969 linked closely, while ENSO cycle of 2009–2010 is in a different cluster, Figure 6. ENSO cycles of 1982–1983 and 1997–1998 also linked closely, Figure 6.
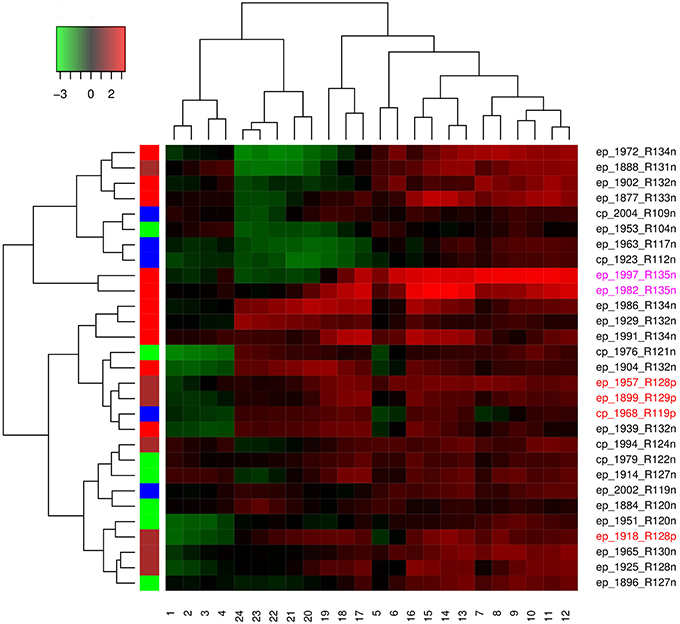
Figure 5. Dendogram and heatmap of MEI.ext data.
Figure 6. Dendrogram and heatmap (MEI data.).
ENSO indices of MEI.ext data were low from 1 to 6 months after onset (January to June) and from 17 to 24 months (May to December), but high from 7 to 16 months (July to April), Figure 5. Differences in the distribution of ENSO indices in the groups were statistically significant, Kruskal-Wallis test p < 0.0001. Post hoc tests showed significant pairwise differences between the three groups, p < 0.0001. ENSO indices for MEI data had low indices from 1 to 5 and 19 to 24 months, but high indices from 6 to 18 months, Figure 6. The Kruskal-Wallis test showed statistically significant differences between the groups, p < 0.0001. Post hoc tests showed that ENSO indices were significantly higher at 6–18 months than at 1–5 and 19–24 months, p < 0.0001, but no significant difference between 1–5 and 19–24 months ENSO indices, p > 0.05.
The median peak (range) was 3.3 (3.2–3.3) in cluster A, 1.5 (0.8–2.5) in cluster B, 2.0 (1.2–2.4) in cluster C, and 1.5 (1.2–1.8) in cluster D. The median rank was 135 for cluster A, 124 (104–134) for the cluster B, 132 (119–134) for cluster C, and 126 (119–130) for the cluster D. The median duration (range) of ENSO index ≥ 0.75 was 15 months (14–16) for cluster A, 9 months (1–14) for cluster B, 14 months (6–28) for cluster C, and 12 months (2–16) for cluster D.
Kruskal-Wallis test of MEI.ext data, showed significant differences in the distribution of ENSO peaks in the clusters, p < 0.05. Post hoc tests showed significant differences between cluster A and cluster D, p < 0.05. Kruskal-Wallis test also showed significant differences of duration of El Niño ≥ 0.75 index in the clusters, p < 0.05. Post hoc tests showed significant differences between cluster B and cluster C, p < 0.05. Chi square test showed no significant difference in of distribution of El Niño types in the clusters, p > 0.05. Kruskal-Wallis test of MEI data did not show significant differences in the distribution of peaks and duration of ENSO ≥ 0.75 index in the clusters, p > 0.05.
Discussion
Timing of influenza pandemic peaks, which lag or are in phase with El Niño peaks, indicate that influenza pandemic waves are phase-locked to El Niño, Figure 1. Proximity of all influenza pandemic peaks to El Niño events is shown by the relatively short lags of 0–5 months. Although the intervals between influenza pandemics from 1871 to 2015 vary from 11 to 41 years, these intervals are approximately multiples of 10 years. The interval between 1889–1900 and 1918–1919 influenza pandemics is approximately 20 years, while the interval between 1918–1919 and 1957–1958 influenza pandemics is approximately 40 years. Similarly the interval between 1957–1958 and 1968–1969 influenza pandemics is approximately 10 years, while the interval between 1968–1969 and 2009–2010 influenza pandemics is approximately 40 years. It is noteworthy that the low grade influenza pandemic (Taubenberger and Morens, 2010) of 1977–1978 occurred approximately 10 years after the influenza pandemic of 1968–1969. Decadal variation of influenza pandemics is, therefore, consistent with decadal variation of El Niño events (Ogata et al., 2013). Thus, influenza pandemics and El Niños are coupled on decadal timescale.
While ENSO has been described using non-linear dynamic models (Elsner and Tsonis, 1993; Mukhin et al., 2015), each ENSO cycle graphically appears like complex waves, which may be visually described as 1889–1901 like, or 1968–1969 like, Figures 1, 2. The ENSO cycles during influenza pandemics, therefore, appear to share parameters of oscillation. Similarities of waveforms of 1899–1901 and 1918–1920 ENSO cycles, which were separated by 40 years, of 1957–1959 and 1968–1969 ENSO cycles, which were separated by 58 years, and of waveform of 1968–1969 and 2009–2010 ENSO cycles, which were separated by 41 years, indicate that ENSO cycles during influenza pandemics are not random waveforms. Although variations of El Niño frequency and amplitude have been modeled using chaos theory (Jin et al., 1994; Tziperman et al., 1994), repeating motifs of ENSO waveforms indicate that generation of these waveforms is deterministic, Figures 1, 2. Thus, changes in precipitation induced by El Niños of certain waveforms enhance global transmission of novel influenza viruses.
Strength is one of the characteristics of El Niños (Wolter and Timlin, 2011), which is graded weak, moderate, strong, and very strong (Quinn and Neal, 1987, 1992; Null, 2015). These gradings, which apply globally to each El Niño event, do not indicate the spatial and temporal changes of the waveforms. Plots of ENSO times series within quantiles of ranks show that ENSO waveforms in the first, second, and third quantiles share similar characteristics of their waveforms than those of fourth quantile, which has ENSO cycles of long and short duration ENSO, Figure 3. The very strong ENSO cycles of 1982–1983 and 1997–1998, which are among the relatively short duration ENSO cycles in the fourth quantile, indicate that the two strongest El Niños of the past century have similar waveforms, but do not have the longest duration, Figure 3. Although the ENSO cycle during the 1968–1969 influenza pandemic is in the first quantile, its waveform shows relatively long duration and high indices than other ENSO cycles in the quantile. This observation is also the case for the three pandemic ENSO cycles in the third quantile, Figure 3. The median duration of ENSO cycles of influenza pandemics in the first and third quantiles, which is 5 months longer than non-pandemic ENSO cycles, and their relatively higher peaks indicate that ENSO cycles during influenza pandemics have different waveform characteristics than other ENSO cycles in the same quantiles. Thus, pandemic ENSO cycles have relatively longer duration and higher indices than ENSO cycles in the same quantile.
The median duration of El Niño was 13 months in the whole MEI.ext dataset from 1871 to 2005 (Wolter and Timlin, 2011), but 12 months in the MEI.ext and 10 months in the MEI datasets of this study. MEI.ext dataset, which shows curvilinear relationship of peaks and duration of ENSO indices > 0.75, indicate that very strong El Niños have shorter duration than strong El Niños, Figure 4A. This will explain the two patterns of waveforms in the fourth quantile of Figure 3, which shows shorter duration for ENSO with very strong El Niños. The relationship of peak and duration of El Niño is, however, linear from weak to moderately strong El Niños, Figures 4A,B. MEI data also shows curvilinear relationship of peaks and duration of ENSO indices > 0.75, Figure 4B. Second order polynomial regression model indicate that the relationship of peak and duration of ENSO for both MEI.ext and MEI data is quadratic (p < 0.0001). Thus, the duration of El Niño depends on its strength, but the relationship is non-linear.
El Niño is defined as anomaly of sea surface temperature, which occurs when running mean exceeds baseline threshold by ≥ 0.5°C for five consecutive 3-month periods in the Niño 3.4 region (5°N–5°S, 120°–170°W) of the Pacific Ocean (National Oceanic Atmospheric Administration, 2015e). The ENSO has been described as non-linear and non-stationary system (Timmermann et al., 2003; An et al., 2005). Non-stationary cosinor models confirm the visual impression that ENSO are complex waves with varying parameters of oscillation like amplitude and angular velocity, Figures 1, 2. This indicate that ENSO parameters of oscillation are modulated in each cycle. The amplitudes of ENSO waveforms, therefore, vary substantially between ENSO cycles in addition to decadal variations of El Niño frequency. Since ENSO is a multiscale system (Gershunov and Barnett, 1998; An and Jin, 2011; Ogata et al., 2013), which has fast and slow frequency modes, the complexity of the waveforms is attributable to the sum of its non-linear and non-stationary components, which vary from sub-annual to multidecadal timescales. It is, therefore, conceivable that the annual frequency mode is coherent with seasonal influenza epidemics, while decadal frequency mode (Timmermann, 2003) is coherent with influenza pandemics. Thus, decadal modulations of amplitude and frequency of ENSO will explain the variations of intervals between influenza pandemics.
Hierarchical agglomerative cluster linkage of ENSO cycles of 1899–1900, 1957–1958, and 1968–1969, during which influenza pandemics occurred, indicates that their waveforms have similar parameters of oscillation, Figure 5. Similarly close linkage of ENSO cycles of 1982–1983 and 1997–1998, which have the strongest El Niño of the past century, indicate that their waveforms also have similar parameters of oscillation, Figure 5. The dendrogram of MEI data also shows that ENSO cycles of 1957–1958, and 1968–1969 linked closely, Figure 6. The clusters in both dendrograms, however, do not contain waveforms of uniform strength and duration of El Niños, Figures 5, 6. Although the clusters of MEI.ext data have weakly significantly different distributions of peaks and duration of ENSO indices > 0.75 (p < 0.05), that of MEI data did not (p > 0.05). Waveforms of ENSO cycles, therefore, cluster into meaningful groups, which share parameters of oscillation. Heatmap of MEI.ext data show that ENSO cycles have significantly different temporal variations of indices of strength (p < 0.0001), Figure 5. Significantly higher ENSO indices occurred from 7 to 16 months after onset (July to April), while low indices occur from 1 to 6 months (January to June), and from 17 to 24 months (May to December), Figure 5. Heatmap of MEI data also show significantly different temporal variations of indices of strength (p < 0.0001), which were highest from 6 to 18 months, Figure 6. Thus, cluster analysis confirms that ENSO waveforms during influenza pandemics have similar spatial and temporal patterns.
Sea surface warming and influx of nutrient-rich coastal water from the Gulf of Guayaquil, which occur in December, was named El Niño by fishermen in the Peruvian port of Paita (Caviedes, 2007). The sea surface warming, which typically starts in spring and peaks in winter, diminishes in amplitude westward along the equator (Philander, 1985). In 2005 additional seasons of anomalies of sea surface warming, termed Dateline El Niño, were identified (Larkin and Harrison, 2005). This El Niño, which has different spatial characteristic from classical El Niño, is now named El Niño Modoki (Ashok et al., 2007), warm pool El Niño (Kug et al., 2009) or Central Pacific El Niño, while the classical El Niño is named East Pacific El Niño (Yu and Kim, 2013) or cold tongue El Niño (Kug et al., 2009). Although the two El Niños peak in winter, EP El Niño typically has larger positive than negative amplitudes, in contrast to CP El Niño. The dendrogram, which shows that only two of six CP El Niños, 1979–1980 and 1994–1995, linked closely indicate that El Niño type is not discriminating in the clustering, Figures 5, 6. The absence of statistical difference in the distribution of El Niño types in the clusters confirms this. Thus, the waveforms of CP and EP El Niños, which do not have distinct parameters of oscillation, have both occurred during influenza pandemics.
Influenza A viruses have been found in humans, birds, horses, pigs, and several other mammals (Webster et al., 1992). They are negative, single stranded RNA viruses of Orthomyxoviridae family. The genome, which is enveloped in a lipid bilayer, has 8 segments, which encode 11 proteins that include two antigenic structural proteins, hemagglutinin (HA) and neuramidase (NA), and PB1 and PB2 polymerases (Noda et al., 2006). There are as many as 18 HA subtypes and 11 NA subtypes (Centers for Disease Control Prevention, 2015), which are used to define influenza A subtypes like H1N1, H3N2, and H7N2. HA and NA undergo frequent point mutations termed antigenic drift, and less frequent reassortment of genes from avian, swine, and human influenza viruses termed antigenic shift (Webster et al., 1992). The pandemic influenza A viruses of 1918, 1957, and 1968 had HAs of avian origin, which mutated to human type. The novel triple reassortant influenza A(H1N1), which initiated the pandemic of 2009 started in USA, Mexico, and Canada, contained gene segments from human, swine, and avian influenza A viruses [Garten et al., 2009; Novel Swine-Origin Influenza A (H1N1) Virus Investigation Team, 2009]. This virus had, however, circulated in north American swine since the 1990s (Vijaykrishna et al., 2010), while human cases occurred between 2005 and 2009 (Newman et al., 2008; Shinde et al., 2009). Similarly, reassortant influenza A pandemic strains of 1918, 1957, and 1968 pandemics also circulated for years before the pandemics (Smith et al., 2009). While novel reassortant viruses acquire the ability to infect across species, they do not always possess the potential for aerosol transmission (Su et al., 2015). Human influenza A viruses preferentially bind to receptors that end with α2,6 sialic acid moieties, which are present in human upper respiratory epithelium, while avian influenza A virus preferentially bind to α2,6 sialic acid moieties, which are present in avian alimentary epithelium and lower respiratory tract of humans (Herfst et al., 2012). Receptor specificity, which is the basis for host restriction of influenza A viruses is, however, breached not only by reassortant mechanism, but also by direct transmission of avian influenza A virus to humans. The outbreak of avian A/H5N1 influenza in Hong Kong in 1997, which was accompanied by 6 deaths in 18 subjects, was acquired directly from chickens without intermediate hosts (Centers for Disease Control and Prevention, 1997; Chan, 2002). A/H5N1 virus, however, lacked the potential for aerosol transmission, which limited its potential for transmission in human populations (Imai et al., 2013). Targeted mutagenesis and passage experiments in ferrets showed that five amino acid substitutions, four in HA and one in PB2 gene products, conferred aerosol transmissibility on A/H5N1. (Herfst et al., 2012). Thus, influenza A viruses are ubiquitous in nature, actively mutating and reassorting to novel influenza A viruses which typically do not have high potential for aerosol transmission in humans, but circulate for years before initiating pandemics.
Influenza A viruses circulate constantly in the air, but at concentrations below the threshold that can overwhelm the immune system (Hall, 2007). Transmission of influenza A viruses in human populations occurs via aerosols (Lindsley et al., 2010b), droplets (Morawska, 2006), or direct contact with infected secretions (Mubareka et al., 2009; Thomas et al., 2014). Influenza particle aerosols are generated when infected subjects cough, sneeze, breath, or talk (Nikitin et al., 2014). Aerosols of aerodynamic equivalent sizes > 4-μm, which take less than 33 min to settle 1 m in still air, and aerosols of 1-μm, which take 8 hrs to settle, show that aerosols of small aerodynamic equivalent sizes will contribute to the spread of infection by surviving longer and with the potential to penetrate deep into lower respiratory tracts (Lindsley et al., 2010a). Blockage of influenza aerosol transmission at 30°C show that low environmental temperature favor aerosol transmission (Lowen et al., 2008). The guinea-pig model show, however, that cold and dry conditions favor aerosol transmission of influenza A viruses (Lowen et al., 2007). Transmission of 2009–2010 influenza pandemic virus was also dependent on low temperature and humidity (Steel et al., 2011). Influenza mortality in 359 counties in the USA from 1973 to 2002, and its seasonal variations, correlated with < 6 g of water vapor per kilogram of air (Barreca and Shimshack, 2012). There is geospatial association of influenza pandemics and precipitation at locations where the cases occurred (Skog et al., 2014). The absence of influenza pandemics during very weak and very strong El Niños, therefore, indicate that global changes in precipitation during these El Niños are not optimal for survival and transmission of influenza A viruses. The presence of more peaks of influenza pandemics during the strong El Niño of 1918–1921 than the strong El Niño of 2009–2010 indicate that the duration of El Niño is a determinant of the duration of increase survival and transmission of influenza A viruses. Occurrence of a third peak of 2009–2010 influenza pandemic in the UK, when immunity against the virus was high, show that infection is still possible in the population as long as environmental conditions are favorable for transmission of the virus (Dorigatti et al., 2013). Other putative factors, which contribute to transmission of influenza virus in humans include seasonal changes in host behavior such as school attendance, indoor crowding, airtravel, and reduced immunity due to low vitamin D concentrations due in winter (Lofgren et al., 2007; Guo et al., 2015). Thus, the determinants of aerosol transmission, survival, and infectivity of influenza A viruses are multifactorial, but global reduction of precipitation by El Niños of certain spatial and temporal evolution is the most important determinant of occurrence of influenza pandemics.
Limitations of Study
Non-availability of time series of influenza cases during pandemics, except for the 2009–2010 pandemic, prevented spectral analysis, which is the appropriate method to assess correlation of time series. This limitation is, however, attenuated since months of influenza pandemic peaks and monthly ENSO time series are available. Another limitation is the unequal duration of ENSO cycles which prevented clustering beyond 24 months, the shortest duration of ENSO cycles in the dataset. This limitation is, however, not serious since most of the ENSO cycles did not last more than 24 months. The relatively small number of influenza pandemics, five during the study period, prevented applications of more robust statistical methods for comparison of pandemic and non-pandemic ENSO cycles.
Conclusions
Influenza pandemics and El Niños are coupled on decadal and multidecadal timescales. There are multiple El Niño waveforms, which cluster into distinct groups. Similarity of El Niño waveforms during influenza pandemics indicate that spatio-temporal evolution of these El Niños induces changes in precipitation that are optimal for survival and global transmission of novel influenza A virus. Global reduction of precipitation by El Niños of certain spatial and temporal evolution promote aerosol transmission and survival of novel influenza A viruses. Surveillance for El Niño events to forecast periods of maximal transmission and survival of influenza A viruses is, therefore, crucial for public health control strategies.
Influenza pandemics and seasonal influenza epidemics remain major public health problems, which impact significant mortality and morbidity worldwide. HA and NA antigens of influenza A viruses continue to mutate or reassort with the potential to cause severe seasonal influenza epidemic or pandemic. Currently, strains of influenza type A viruses with potential to cause pandemic include H5N1, H7N9 (Imai et al., 2013; Uyeki and Cox, 2013; Lam et al., 2015), H9N2 (Sediri et al., 2015), and H10N8 (Chen et al., 2014). While surveillance of these emerging influenza A viruses in human, swine, and birds intensifies, there is the need to monitor climate for El Niño events, which modulate precipitation and promote viral transmission.
Author Contributions
The author conceived the study, designed the methodology, collected and analyzed the data, and wrote the manuscript.
Conflict of Interest Statement
The author declares that the research was conducted in the absence of any commercial or financial relationships that could be construed as a potential conflict of interest.
References
Allan, R., and Ansell, T. (2006). A new globally complete monthly historical gridded mean sea level pressure dataset (HadSLP2): 1850–2004. J. Clim. 19, 5816–5842. doi: 10.1175/JCLI3937.1
An, S., and Jin, F. F. (2011). Linear solutions for the frequency and amplitude modulation of ENSO by the annual cycle. Tellus A 63, 238–243. doi: 10.1111/j.1600-0870.2010.00482.x
An, S., and Wang, B. (2000). Interdecadal change of the structure of the ENSO mode and its impact on the ENSO frequency. J. Clim. 13, 2044–2055.
An, S.I., Hsieh, W.W., and Jin, F.F. (2005). A nonlinear analysis of the ENSO cycle and its interdecadal changes. J. Clim. 18, 3229–3239. doi: 10.1175/JCLI3466.1
Ashok, K., Behera, S. K., Rao, S. A., and Weng, H. (2007). El-Niño Modoki and its possible teleconnection. J. Geophys. Res. 112, 1–27. doi: 10.1029/2006JC003798
Bandaranayake, D., Jacobs, M., Baker, M., Hunt, D., Wood, T., Bissielo, A., et al. (2011). The second wave of 2009 pandemic influenza A(H1N1) in New Zealand, January-October 2010. Euro. Surveill. 16:19788.
Barreca, A. I., and Shimshack, J. P. (2012). Absolute humidity, temperature, and influenza mortality: 30 years of county-level evidence from the United States. Am. J. Epidemiol. 176(Suppl. 7), S114–S122. doi: 10.1093/aje/kws259
Caviedes, C. N. (2007). “Impacts of El Nino-Southern Oscillation on natural and human systems,” in The Physical Geography of South America. eds T. T. Veblen, K. R. Young, and A. R. Orme (New York, NY: Oxford University Press), 305–321.
Centers for Disease Control Prevention (1997). Isolation of avian influenza A(H5N1) viruses from humans–Hong Kong, May-December 1997. Morb. Mortal. Wkly. Rep. 46, 1204–1207.
Centers for Disease Control Prevention (2015). Influenza Type A Viruses. Available online at: http://www.cdc.gov/u/avianu/inuenza-a-virus-subtypes
Chan, P. K. S. (2002). Outbreak of avian influenza A(H5N1) virus infection in Hong Kong in 1997. Clin. Infect. Dis. 34(Suppl. 2), S58–S64. doi: 10.1086/338820
Chen, H., Yuan, H., Gao, R., Zhang, J., Wang, D., Xiong, Y., et al. (2014). Clinical and epidemiological characteristics of a fatal case of avian influenza A H10N8 virus infection: a descriptive study. Lancet 383, 714–721. doi: 10.1016/S0140-6736(14)60111-2
Dorigatti, I., Cauchemez, S., and Ferguson, N. M. (2013). Increased transmissibility explains the third wave of infection by the 2009 H1N1 pandemic virus in England. Proc. Natl. Acad. Sci. U.S.A. 110, 13422–13427. doi: 10.1073/pnas.1303117110
Elsner, J. B., and Tsonis, A. A. (1993). Nonlinear dynamics established in the ENSO. Geophys. Res. Lett. 20, 213–216. doi: 10.1029/93GL00046
Garten, R. J., Davis, C. T., Russell, C. A., Shu, B., Lindstrom, S., Balish, A., et al. (2009). Antigenic and genetic characteristics of swine-origin 2009 A(H1N1) influenza viruses circulating in humans. Science 325, 197–201. doi: 10.1126/science.1176225
Gershunov, A., and Barnett, T. P. (1998). Interdecadal modulation of ENSO teleconnections. Bull. Am. Meteor. Soc. 79, 2715–2725.
Guo, D., Li, K. C., Peters, T. R., Snively, B. M., Poehling, K. A., and Zhou, X. (2015). Multi4 scale modeling for the transmission of influenza and the evaluation of interventions toward it. Sci. Rep. 5:8980. doi: 10.1038/srep08980
Hall, C. B. (2007). The spread of influenza and other respiratory viruses: complexities and conjectures. Clin. Infect. Dis. 45, 353–359. doi: 10.1086/519433
Herfst, S., Schrauwen, E. J. A., Linster, M., Chutinimitkul, S., de Wit, E., Munster, V. J., et al. (2012). Airborne transmission of influenza A/H5N1 virus between ferrets. Science 336, 1534–1541. doi: 10.1126/science.1213362
Imai, M., Herfst, S., Sorrell, E. M., Schrauwen, E. J. A., Linster, M., De Graaf, M., et al. (2013). Transmission of influenza A/H5N1 viruses in mammals. Eng. Virus Res. 178, 15–20. doi: 10.1016/j.virusres.2013.07.017
Jin, F. F., Neelin, J. D., and Ghil, M. (1994). El Nino on the devil's staircase: annual subharmonic steps to chaos. Science 264, 70–72. doi: 10.1126/science.264.5155.70
Kempinska-Miroslawska, B., and Wozniak-Kosek, A. (2013). The influenza epidemic of 188990 in selected European cities a picture based on the reports of two Pozna daily newspapers from the second half of the nineteenth century. Med. Sci. Monit. 19, 1131–1141. doi: 10.12659/MSM.889469
Kug, J., Jin, F., and An, S. (2009). Two types of El Niño events: cold tongue El Niño and warm pool El Niño. J Clim. 22, 1499–1515. doi: 10.1175/2008JCLI2624.1
Lam, T. T., Zhou, B., Wang, J., Chai, Y., Shen, Y., Chen, X., et al. (2015). Dissemination, divergence and establishment of H7N9 influenza viruses in China. Nature 522, 102–105. doi: 10.1038/nature14348
Larkin, N. K., and Harrison, D. E. (2005). On the definition of El Niño and associated seasonal average U.S. weather anomalies. Geophys. Res. Lett. 32, 1–4. doi: 10.1029/2005GL022738
Lina, B. (2008). “History of influenza pandemics,” in Paleomicro-Biology: Past Human Infections, eds D. Raoult, and M. Drancourt (Berlin: Springer-Verlag), 199–211.
Lindsley, W. G., Blachere, F. M., Davis, K. A., Pearce, T. A., Fisher, M. A., Khakoo, R., et al. (2010a). Distribution of airborne influenza virus and respiratory syncytial virus in an urgent care medical clinic. Clin. Infect. Dis. 50, 693–698. doi: 10.1086/650457
Lindsley, W. G., Blachere, F. M., Thewlis, R. E., Vishnu, A., Davis, K. A., Cao, G., et al. (2010b). Measurement of airborne influenza virus in aerosol particles from human coughs. PLoS ONE 5:e15100. doi: 10.1371/journal.pone.0015100
Lofgren, E., Fefferman, N. H., Naumov, Y. N., Gorski, J., and Naumova, E. N. (2007). Influenza seasonality: underlying causes and modeling theories. J. Virol. 81, 5429–5436. doi: 10.1128/JVI.01680-06
Lowen, A. C., Mubareka, S., Steel, J., and Palese, P. (2007). Influenza virus transmission is dependent on relative humidity and temperature. PLoS Pathog. 3:e151. doi: 10.1371/journal.ppat.0030151
Lowen, A. C., Steel, J., Mubareka, S., and Palese, P. (2008). High temperature (30 °C) blocks aerosol but not contact transmission of influenza virus. J. Virol. 82, 5650–5652. doi: 10.1128/JVI.00325-08
Morawska, L. (2006). Droplet fate in indoor environments, or can we prevent the spread of infection? Indoor Air 16, 335–347. doi: 10.1111/j.1600-0668.2006.00432.x
Morens, D. M., Taubenberger, J. K., Folkers, G. K., and Fauci, A. S. (2010). Pandemic influenza's 500th anniversary. Clin. Infect. Dis. 51, 1442–1444. doi: 10.1086/657429
Mubareka, S., Lowen, A. C., Steel, J., Coates, A. L., García-Sastre, A., and Palese, P. (2009). Transmission of influenza virus via aerosols and fomites in the guinea pig model. J. Infect. Dis. 199, 858–865. doi: 10.1086/597073
Mukhin, D., Gavrilov, A., Feigin, A., Loskutov, E., and Kurths, J. (2015). Principal nonlinear dynamical modes of climate variability. Sci. Rep. 5:15510. doi: 10.1038/srep15510
Mummert, A., Weiss, H., Long, L., Amigó, J. M., and Wan, X. (2013). A perspective on multiple waves of influenza pandemics. PLoS ONE 8:e60343. doi: 10.1371/journal.pone.0060343
National Oceanic Atmospheric Administration (2015a). Equatorial Pacific Sea Surface Temperatures. Available online at: https://www.ncdc.noaa.gov/teleconnections/enso/indicators/sst.php
National Oceanic Atmospheric Administration (2015b). MEI-Ext Ranks. Available online at: http://www.esrl.noaa.gov/psd/enso/mei.ext/rank.ext.html
National Oceanic Atmospheric Administration (2015c). MEI Index. Available online at: http://www.esrl.noaa.gov/psd/enso/mei/table.html
National Oceanic Atmospheric Administration (2015d). MEI Ranks. Available online at: http://www.esrl.noaa.gov/psd/enso/mei/rank.html
National Oceanic Atmospheric Administration (2015e). Oceanic Nino Index. Available online at: http://www.cpc.ncep.noaa.gov/products/analysis_monitoring/ensostuff/ensoyears.shtml
Newman, A. P., Reisdorf, E., Beinemann, J., Uyeki, T. M., Balish, A., Shu, B., et al. (2008). Human case of swine influenza A (H1N1) triple reassortant virus infection, Wisconsin. Emerg. Infect. Dis. 14, 1470–1472. doi: 10.3201/eid1409.080305
Nikitin, N., Petrova, E., Trifonova, E., and Karpova, O. (2014). Influenza virus aerosols in the air and their infectiousness. Adv. Virol. 2014:859090. doi: 10.1155/2014/859090
Noda, T., Sagara, H., Yen, A., Takada, A., Kida, H., Cheng, R. H., et al. (2006). Architecture of ribonucleoprotein complexes in influenza A virus particles. Nature 439, 490–492. doi: 10.1038/nature04378
Novel Swine-Origin Influenza A (H1N1) Virus Investigation Team (2009). Emergence of a novel swine-origin influenza A (H1N1) virus in humans. N. Engl. J. Med. 360, 2605–2615. doi: 10.1056/NEJMoa0903810
Null, J. (2015). El Nino and La Nina Years and Intensities. Available online at: http://ggweather.com/enso/oni.htm
Ogata, T., Xie, S., Wittenberg, A., and Sun, D. (2013). Interdecadal amplitude modulation of El Nino–southern oscillation and its impact on tropical Pacific decadal variability. J. Clim. 26, 7280–7297. doi: 10.1175/JCLI-D-12-00415.1
Oluwole, O. S. A. (2015). Seasonal influenza epidemics and El Ninos. Front. Public Health 3:250. doi: 10.3389/fpubh.2015.00250
Potter, C. W. (2001). A history of influenza. J. Appl. Microbiol. 91, 572–579. doi: 10.1046/j.1365-2672.2001.01492.x
Quinn, W. H., and Neal, V. T. (1987). El Nino occurrence over the past four and a half centuries. J. Geophys. Res. 92, 14449–14461. doi: 10.1029/JC092iC13p14449
Quinn, W. H., and Neal, V. T. (1992). “The historical record of El Nino events,” in Climate Since A.D. 1500, eds R. S. Bradley, and P. D. Jones (London: Routledge), 623–648.
R Core Team (2015). R: A Language and Environment for Statistical Computing. Vienna: R Foundation for Statistical Computing.
Rasmusson, E. M., and Carpenter, T. H. (1982). Variations in tropical sea surface temperature and surface wind associated with the southern oscillation/El Nino. Mon. Weather Rev. 110, 358–384.
Richard, S. A., Sugaya, N., Simonsen, L., Miller, M. A., and Viboud, C. (2009). A comparative study of the 1918–1920 influenza pandemic in Japan, USA and UK: mortality impact and implications for pandemic planning. Epidemiol. Infect. 137, 1062–1072. doi: 10.1017/S0950268809002088
Sediri, H., Thiele, S., Schwalm, F., Gabriel, G., and Klenk, H. (2015). The PB2 subunit of avian influenza virus of subtype H9N2: a pandemic risk factor. J. Gen. Virol. 97, 39–48.
Shaman, J., and Kohn, M. (2009). Absolute humidity modulates influenza survival, transmission, and seasonality. Proc. Natl. Acad. Sci. U.S.A. 106, 3243–3248. doi: 10.1073/pnas.0806852106
Shaman, J., Goldstein, E., and Lipsitch, M. (2011). Absolute humidity and pandemic versus epidemic influenza. Am. J. Epidemiol. 173, 127–135. doi: 10.1093/aje/kwq347
Shinde, V., Bridges, C. B., Uyeki, T. M., Shu, B., Balish, A., Xu, X., et al. (2009). Triple-reassortant swine influenza A (H1) in humans in the United States, 2005-2009. N. Engl. J. Med. 360, 2616–2625. doi: 10.1056/NEJMoa0903812
Skog, L., Linde, A., Palmgren, H., Hauska, H., and Elgh, F. (2014). Spatiotemporal characteristics of pandemic influenza. BMC Infect. Dis. 14:378. doi: 10.1186/1471-2334-14-378
Smith, G. J. D., Bahl, J., Vijaykrishna, D., Zhang, J., Poon, L. L. M., Chen, H., et al. (2009). Dating the emergence of pandemic influenza viruses. Proc. Natl. Acad. Sci. U.S.A. 106, 11709–11712. doi: 10.1073/pnas.0904991106
Steel, J., Palese, P., and Lowen, A. C. (2011). Transmission of a 2009 pandemic influenza virus shows a sensitivity to temperature and humidity similar to that of an H3N2 seasonal strain. J. Virol. 85, 1400–1402. doi: 10.1128/JVI.02186-10
Su, W., Wang, C., Luo, J., Zhao, Y., Wu, Y., Chen, L., et al. (2015). Testing the effect of internal genes derived from a wild-bird-origin H9N2 influenza a virus on the pathogenicity of an A/H7N9 virus. Cell Rep. 12, 1831–1841. doi: 10.1016/j.celrep.2015.08.029
Taubenberger, J., and Morens, D. M. (2006). 1918 Influenza: the mother of all pandemics. Emerg. Infect. Dis. 12, 15–22. doi: 10.3201/eid1209.05-0979
Taubenberger, J. K., and Morens, D. M. (2010). Influenza: the once and future pandemic. Public Health Rep. 125(Suppl. 3), 16–26.
Thomas, Y., Boquete-Suter, P., Koch, D., Pittet, D., and Kaiser, L. (2014). Survival of influenza virus on human fingers. Clin. Microbiol. Infect. 20, O58–O64. doi: 10.1111/1469-0691.12324
Timmermann, A. (2003). Decadal ENSO amplitude modulations: a nonlinear paradigm. Glob. Planet. Change 37, 135–156. doi: 10.1016/S0921-8181(02)00194-7
Timmermann, A., Jin, F.-F., and Abshagen, J. (2003). A nonlinear theory for El Ninobursting. J. Atmosph. Sci. 60, 152–165.
Tziperman, E., Stone, L., Cane, M. A., and Jarosh, H. (1994). El Nino chaos: overlapping of resonances between the seasonal cycle and the Pacific ocean-atmosphere oscillator. Science 264, 72–74. doi: 10.1126/science.264.5155.72
Uyeki, T. M., and Cox, N. J. (2013). Global concerns regarding novel influenza A (H7N9) virus infections. N. Engl. J. Med. 368, 1862–1864. doi: 10.1056/NEJMp1304661
Vijaykrishna, D., Poon, L. L. M., Zhu, H. C., Ma, S. K., Li, O. T. W., Cheung, C. L., et al. (2010). Reassortment of pandemic H1N1/2009 influenza A virus in swine. Science 328, 1529. doi: 10.1126/science.1189132
Wang, X. L., and Ropelewski, C. F. (1985). An asessment of ENSO-Scale secular variability. J. Clim. 8, 1584–1599.
Webster, R. G., Bean, W. J., Gorman, O. T., Chambers, T. M., and Kawaoka, Y. (1992). Evolution and ecology of influenza A viruses. Microbiol. Rev. 56, 152–179.
Wolter, K., and Timlin, M. S. (2011). El Nino/Southern Oscillation behaviour since 1871 as diagnosed in an extended multivariate ENSO index (MEI.ext). Int. J. Climatol. 31, 1074–1087. doi: 10.1002/joc.2336
Wolter, K., and Timlin, M. S. (1998). Measuring the strength of ENSO events: How does 1997/98 rank? Weather 53, 315–324. doi: 10.1002/j.1477-8696.1998.tb06408.x
Keywords: El Niño, influenza, flu, epidemic, pandemic, climate, waves
Citation: Oluwole OSA (2016) Waves of El Niño-Southern Oscillation and Influenza Pandemics. Front. Environ. Sci. 4:25. doi: 10.3389/fenvs.2016.00025
Received: 16 December 2015; Accepted: 21 March 2016;
Published: 12 April 2016.
Edited by:
Shuguang (Leo) Liu, U.S. Geological Survey Earth Resources Observation and Science Center, USAReviewed by:
Shailesh D. Pawar, National Institute of Virology, IndiaThandavarayan Ramamurthy, Translational Health Science and Technology Institute (DBT), India
Copyright © 2016 Oluwole. This is an open-access article distributed under the terms of the Creative Commons Attribution License (CC BY). The use, distribution or reproduction in other forums is permitted, provided the original author(s) or licensor are credited and that the original publication in this journal is cited, in accordance with accepted academic practice. No use, distribution or reproduction is permitted which does not comply with these terms.
*Correspondence: Olusegun S. A. Oluwole, osaoluwole@hotmail.com