Sensitivity of Grapevine Phenology to Water Availability, Temperature and CO2 Concentration
 Johann Martínez-Lüscher1,2*
  Tefide Kizildeniz3 Višnja Vučetić4
  Zhanwu Dai5
  Eike Luedeling6,7 Cornelis van Leeuwen5 Eric Gomès5
  Inmaculada Pascual3 Juan J. Irigoyen3 Fermín Morales8
  Serge Delrot5
- 1School of Agriculture, Policy and Development, University of Reading, Reading, UK
- 2Genetics and Crop Improvement Program, East Malling Research, East Malling, UK
- 3Grupo de Fisiología del Estrés en Plantas, Departamento de Biología Ambiental (Unidad Asociada al CSIC, EEAD, Zaragoza e ICVV, Logroño, Spain), Facultades de Ciencias y Farmacia, Universidad de Navarra, Pamplona, Spain
- 4Meteorological Research and Development Division, Agrometeorological Department, Meteorological and Hydrological Service, Zagreb, Croatia
- 5UMR 1287, EGFV, Bordeaux Sciences Agro, Institut National de la Recherche Agronomique, Université de Bordeaux, Villenave d'Ornon, France
- 6World Agroforestry Centre, Nairobi, Kenya
- 7Centre for Development Research (ZEF), University of Bonn, Bonn, Germany
- 8Departamento de Nutrición Vegetal, Estación Experimental de Aula Dei, CSIC, Zaragoza, Spain
In recent decades, mean global temperatures have increased in parallel with a sharp rise in atmospheric carbon dioxide (CO2) levels, with apparent implications for precipitation patterns. The aim of the present work is to assess the sensitivity of different phenological stages of grapevine to temperature and to study the influence of other factors related to climate change (water availability and CO2 concentration) on this relationship. Grapevine phenological records from 9 plantings between 42.75°N and 46.03°N consisting of dates for budburst, flowering and fruit maturity were used. In addition, we used phenological data collected from 2 years of experiments with grapevine fruit-bearing cuttings with two grapevine varieties under two levels of water availability, two temperature regimes and two levels of CO2. Dormancy breaking and flowering were strongly dependent on spring temperature, while neither variation in temperature during the chilling period nor precipitation significantly affected budburst date. The time needed to reach fruit maturity diminished with increasing temperature and decreasing precipitation. Experiments under semi-controlled conditions revealed great sensitivity of berry development to both temperature and CO2. Water availability had significant interactions with both temperature and CO2; however, in general, water deficit delayed maturity when combined with other factors. Sensitivities to temperature and CO2 varied widely, but higher sensitivities appeared in the coolest year, particularly for the late ripening variety, ‘White Tempranillo’. The knowledge gained in whole plant physiology and multi stress approaches is crucial to predict the effects of climate change and to design mitigation and adaptation strategies allowing viticulture to cope with climate change.
Introduction
Evolution of Environmental Factors Linked to Climate Change
Analyses of historic climatic changes indicate an increase in mean land surface temperature by 1.06°C over a period of more than 100 years, with the lion's share of this amount—0.85°C—occurring over the past two decades (IPCC, 2014b). Climate projections for the end of the 21st century forecast increases in temperature within a rather wide range, from stabilization at 1.5°C higher than the current reference period to a more than 4°C increase in average global temperature, depending on the mitigation measures adopted (IPCC, 2014a). The main driver of the temperature increase has been human emission of greenhouse gases. Among these, CO2 is the most relevant in volume and global effect (IPCC, 2014a), with its concentrations increasing from a preindustrial level of 280 μL L−1 to currently more than 400 μL L−1 in 2016, with predictions for the end of the century ranging from 421 to a 936 μL L−1 (Meinshausen et al., 2011). Rainfall in many major wine growing regions of the world has decreased and is expected to decrease further in the future (IPCC, 2014b).
Dependence of Grapevine on Temperature
Important effects of temperature on grapevine (Vitis vinifera L.) have long been recognized as influencing plant physiology, berry composition and ultimately wine characteristics (Jones et al., 2005; Bonada and Sadras, 2015). Thermal time integrals are even used as one of the main criteria to assess the suitability of a given cultivar to a given location (Gladstones, 1992). Premium commercial vineyards have been traditionally distributed across a relatively wide range of latitudes, ranging from the subtropics to temperate climates like the south of England (at 53°N). Across this range, temperature during dormancy and growing season varies widely (Jones, 2006, 2007). However, the distribution of grape growing regions is not necessarily aligned with the acclimation or adaptation thresholds of the species, and in the case of quality wine production, the upper temperature limits are hard to assess even at the variety level (van Leeuwen et al., 2013). Evidence of the plasticity of this species and the apparent lack of thermal restrictions for growing grapes is the recent increase in production of both table and wine grapes in subtropical and tropical areas (Demir, 2014).
Temperature Thresholds for Wine Typicity
Although basic climatic conditions for grape growing are easily satisfied, rising temperatures may make it difficult to consistently fulfill specific criteria required for grape quality in many places without adjusting variety, clone or accession within a given variety, or changing management practices. This is especially relevant for wine grapes, as most wine appellations in the world aim to deliver a very specific product, resulting from the wine-making, grapevine genetic material (cultivar and clone), cultural practices, edaphic factors and climatic conditions (van Leeuwen et al., 2004). Final grape composition results from numerous processes leading to accumulation and/or decay of metabolites, which are affected to a considerable degree by climatic conditions (Kuhn et al., 2014). Consequently, aromas, aroma precursors, phenolic compounds, organic acids, and sugars have very different accumulation patterns throughout grape development and, what is most relevant, their responses to increasing temperatures may differ in magnitude. The best example is that temperature increases can enhance both sugar accumulation and organic acid decay, but acidity is more affected than sugar levels. This results in lower acidity for the same sugar level in grapes grown under warmer conditions (Lakso and Kliewer, 1975; Sweetman et al., 2009; Etienne et al., 2013). This decoupling has been reported for other relevant metabolites, such as anthocyanins (decreasing the anthocyanin/sugar ratio) (Sadras and Moran, 2012; Martínez-Lüscher et al., 2016), proanthocyanidins (Cohen et al., 2012) and aromas (Bonada et al., 2015). In contrast, a decoupling of anthocyanins and sugars was reported with increasing water stress, in favor of anthocyanins in Cabernet Sauvignon (Sadras et al., 2007). During the ripening period, in summer, elevated temperature and drought occur simultaneously, and therefore, the effects on the decoupling of anthocyanins and sugars can be moderate due to the contrasting responses elicited by these two factors. In this sense, Sadras and Moran (2012) reported that restricted water supply during berry development can contribute to partially restore anthocyanin/sugar ratios disrupted by high temperature.
Relationship between Wine Composition and Altered Phenology
Despite the scarcity of data, some attempts have been undertaken to relate grape composition to records of environmental conditions (Bonada and Sadras, 2015). Grapevine phenology records, however, are relatively abundant and can be a good proxy for altered grape composition in response to environmental factors (Sadras and Moran, 2013; Bonada and Sadras, 2015). The duration of the phenophases can affect metabolite dynamics (Kuhn et al., 2014; Martínez-Lüscher et al., 2016), but it is also likely that advancing phenology shifts the ripening period toward the warmest part of the year (Webb et al., 2007; Duchene et al., 2010), which is not compatible with the production of high quality table wines (van Leeuwen and Seguin, 2006). Other factors, such as water deficit and elevated CO2, did not affect significantly grape development speed of ‘Red Tempranillo’ fruit-bearing cuttings when applied individually (Salazar Parra, 2011). Only, a significant hastening in grape ripening was observed when these two factors were applied simultaneously from veraison to maturity.
Annual Cycle of Grapevine Development
Most temperate fruit crops need a period of cool temperatures before they can produce flowers (Campoy et al., 2011; Considine and Considine, 2016). Satisfaction of the chilling requirement influences the timing of budburst, flowering and subsequent phenological stages (Luedeling, 2012). However, grapevine flowering and veraison can be modeled quite successfully using spring temperatures as the only predictor variable (Parker et al., 2011), suggesting a weak effect of temperatures during bud dormancy (Garcia de Cortazar-Atauri et al., 2009). While the period from the breaking of dormancy to flowering is strongly determined by temperature, flowering to veraison is often influenced by other abiotic factors such as water deficit (Davies et al., 1994; Antolin et al., 2003; Martínez-Lüscher et al., 2015a), and the correlation is usually weaker (Duchene et al., 2010). This becomes even more evident for the period from flowering or veraison to fruit maturity, which is influenced by an even larger number of factors (Petrie and Sadras, 2008; Webb et al., 2012). Even though ripeness is defined by subjective criteria, and therefore is not a phenological event strictly, it can be reliably measured in relation to metabolite concentrations, such as sugars, anthocyanins and organic acids (Bonada and Sadras, 2015). For instance, regarding the implications of sugar content for the potential alcohol content of resulting wine, the concentration of total soluble solids (TSS) is a straightforward and reliable marker for the progress of ripening (Bonada and Sadras, 2015).
Aim of the Study
In recent years, phenology responses of perennial crops to projected future climates have been assessed. These projections have often focused on response to temperature, with a few cases including water availability, but they have not convincingly considered CO2. The present study aims to give an overview of the effect of climate change-related phenomena (water deficit, increasing temperature and elevated CO2) on the phenology of grapevine, a temperate perennial woody crop. For this purpose, we evaluated historical data of phenological records and conducted some experiments under controlled conditions. The combination of these two data sources—historical records and fruit-bearing cuttings under controlled conditions—allows immediate extrapolation to the field when analyzing historical data, but it also allows studying the direct effects of these environmental factors at reasonable cost, when performing experiments under semi-controlled conditions.
Materials and Methods
Field Phenology Records
Grapevine phenological records of Croatia were obtained from the pan European phenology project (PEP725 Pan European Phenology Data; dataset accessed on 2015-09-23 at http://www.pep725.eu). Croatia has a long tradition in phenological observations carried out by the Meteorological and Hydrological Service from 1951, which was extended to vineyards in 1958. In this study, the records were used to calculate the time elapsed between March 1st and the beginning of budburst (BBCH 7), budburst to beginning of flowering (BBCH 60) and from flowering to fruit maturity (BBCH 87), to test the influence of temperature on grapevine development (Lorenz et al., 1995). The database consisted of 307 seasonal records collected between 1961 and 2013 from nine commercial vineyards in five phenological stations in Croatia (Mandicevac, Daruvar, KriZevCi, Cepic and Trsteno). These sites, which are distributed between latitudes 42.75°N and 46.03°N and between longitudes 14.13°E and 19.23°E, are representative of the average latitude for the distribution of northern hemisphere vineyards. The nine plots had different climate and soil conditions but none were irrigated. Most of them were in south-orientated hills. In the continental part (Mandicevac, Daruvar and KriZevCi) and the northern Adriatic Coast (Cepic), vines were trained with trellis, distance between rows varied from 1.6 to 2.2 m, and distance within plants in a row ranged from 0.7 to 1.2 m. In the southern Adriatic Coast (Trsteno), there was no training, and separation between plants was 1 × 1 m. The white varieties observed in the vineyards were ‘Chasselas Dore,’ present in Mandicevac, KriZevCi and Trsteno; ‘Riesling Italico,’ present in Mandicevac, KriZevCi and Daruvar; and ‘Istrian Malmsey,’ present in Cepic. ‘Plavac Mali,’ an autochthonous red variety present in Trsteno, was also observed.
Temperature and Rainfall Records
Field temperature and rainfall records were extracted from the E-OBS European gridded data set (Haylock et al., 2008). As this database contains daily minimum and maximum temperatures, hourly records were constructed with procedures contained in the chillR package (Luedeling, 2016), for R programming language (R Development Core Team, 2016). These procedures follow the recommendations of Linvill (1990). Sunrise, sunset and day length data for this method were modeled using each site latitude (Spencer, 1971; Almorox et al., 2005).
Identification of Chilling and Warming Periods
Partial Least Squares (PLS) regression was used at one of the locations (Mandicevac) to correlate variation in daily chill and heat accumulation to grapevine budburst dates. Daily chill accumulation (in Chill Portions) was calculated according to the so-called Dynamic Model (Fishman et al., 1987), which is regarded as the most accurate under a wide range of circumstances (Campoy et al., 2011). Daily heat accumulation (in Growing Degree Hours) was calculated according to Anderson et al. (1986), with a curvilinear model using a base temperature of 4°C and an optimum temperature of 26°C, which are representative of grapevine response to temperature (Parker et al., 2011). Formulas for each model are given in Luedeling and Brown (2011) and Luedeling et al. (2009), respectively. Eleven-day running means were constructed to facilitate interpretation of the results (Luedeling and Gassner, 2012). Forty-one datasets were created, consisting of 694 independent variables—daily heat and chill accumulation from June 1st (of the year preceding the year of recorded budburst) to May 14th, which was the latest budburst date recorded at the site (data for May 14th were omitted in leap years)—and one bud break date each. PLS regression outputs—variable importance in the projection (VIP) and model coefficients—were used to delineate the periods where an increase in daily chill accumulation indicated a bloom-advancing effect (negative correlation between chill accumulation and budburst date; this was interpreted as the chilling phase) and where an increase in daily heat accumulation implied a bloom-advancing effect (negative correlation; warming phase). The VIP threshold for importance was set to 0.8, which is commonly adopted by other studies (Wold et al., 2001). Further details of the procedures are described in Luedeling et al. (2013). Once these periods were identified, three-dimensional interpolation (Kriging) was used to illustrate the differential effects of temperature during the chilling and warming periods on budburst dates. This aims to facilitate the interpretation of the effect of two predictor variables that are highly correlated. The angle of the contour lines that are generated indicates, which one of the two factors is dominant in determining budburst dates (Guo et al., 2015).
Plant Material and Growth Conditions
Dormant cuttings of Vitis vinifera L. cvs ‘Red Tempranillo’ (accession T43, Clone RJ-43) and ‘White Tempranillo’ (accession CI-101 in the “La Grajera” germplasm bank, Government of Rioja, Spain) were collected in January of 2014 and 2015 from an experimental vineyard of the Institute of Sciences of Vine and Wine (ICVV) in Logroño (La Rioja, Spain).
Three node cuttings of V. vinifera L. cv. ‘Red Tempranillo’ and ‘White Tempranillo’ were selected to produce fruit-bearing cuttings according to Mullins (1966), as described in Kizildeniz et al. (2015). Rooting was induced using indole butyric acid (300 mg L−1) in a heated moist-bed (25–27°C) kept in a cool chamber (5°C). After 1 month, the rooted cuttings were planted in 0.8 L plastic pots containing a mixture of sand, perlite and vermiculite (1:1:1, v/v) and transferred to the greenhouse. At fruit set, plants were planted in 13 L plastic pots containing a mixture of peat and perlite (2:1, v/v). Only a single flowering stem was allowed to develop on each plant, resulting in only one grape bunch per plant. Pruning was used to control vegetative growth until fruit set, thus allowing only 4 leaves per plant to grow. Growth conditions in the greenhouse were 26/15°C and 60/80% relative humidity (RH) (day/night), with a photoperiod of 15 h with natural daylight supplemented with high-pressure metal halide lamps (OSRAM®, Augsburg, Germany). The supplemental system was triggered when photosynthetically active radiation (PAR) dropped below a photosynthetic flux density (PPFD) of 900 μmol m−2 s−1, providing a PPFD of 500 μmol m−2 s−1 at inflorescence level. Plants were irrigated with the nutrient solution described by Ollat et al. (1998): NH4NO3 (64.5 mg L−1), (NH4)2HPO4 (75 mg L−1), KNO3 (129 mg L−1), MgSO4.7H2O (125 mg L−1), Ca(NO3)2.4H2O (248 mg L−1), (NH4)2SO4 (66 mg L−1), Fe (EDDHA) (280 mg L−1), H3BO3 (2.86 mg L−1), MnCL2.4H2O (1.81 mg L−1), ZnSO4.7H2O (0.22 mg L−1), CuSO4.5H2O (0.08 mg L−1) and (NH4)6Mo7O24.4H2O (0.016 mg L−1). Plants grew under these conditions until fruit set (from March to May, both in 2014 and 2015).
Temperature Gradient Greenhouse Experiment Design and Analyses
Treatments were applied in the temperature gradient greenhouses (TGGs), located at the University of Navarra (42.80°N, 1.67°W) in Pamplona (Navarra, Spain), from June to August (i.e., from fruit set to maturity) in 2014 and 2015. TGGs are designed as temperature gradient tunnels (Rawson, 1995), which allows investigating the effects on plants of environmental changes, such as elevated temperature, elevated CO2 and drought, acting separately or in combination. They were constructed with a modular design with three temperature modules, which creates a temperature gradient ranging from near-ambient temperature in module 1 to ambient temperature +4°C in module 3. CO2 can be injected into the greenhouse to increase the air CO2 concentration as desired (more details in Morales et al., 2014). When fruit set was complete for all plants, fruit-bearing cuttings of ‘Red Tempranillo’ and ‘White Tempranillo’ cultivars were subjected to a combination of two temperature regimes (ambient and ambient +4°C, no experimental plants were set in module 2 with intermediate temperature) and two CO2 concentrations (current ca. 400 μL L−1 and elevated ca. 700 μL L−1) until maturity (defined as TSS = 21–23°Brix). Each treatment consisted of 10 plants, which were selected on the basis of similar grape bunch sizes. Plants were maintained with free vegetative growth. CO2 concentration, temperature, relative humidity and radiation were measured and/or controlled by an automated monitoring system. Data were analyzed with XLStat (Addinsoft, Paris, France) by a factorial ANOVA (2 × 2 × 2 × 2 × 2). Only main factors and two-level interaction P-values were presented.
Results
Effect of Temperature on Grapevine Dormancy Breaking Under Field Conditions
PLS regression results for budburst dates (Figure 1) showed several periods with significant variable importance in the projection (VIP) scores (>0.8) and negative coefficients between September 23rd and February 27th, suggesting that during this period, increases in chilling were correlated to advanced budburst. Although there was a period of negative correlations before this period—between August 31st and September 8th—and a large period of significant scores and positive coefficients from October 25th to November 26th, it seemed reasonable to interpret the period between September 23rd and February 27th as the chilling phase, in agreement with studies showing the effectiveness of chilling in October (Dokoozlian, 1999; Li and Dami, 2016). Days with significant VIP scores coupled with negative correlation coefficients for daily heat accumulation were also discontinuous, but they were concentrated in two major periods: January 4th to January 16th and January 22nd to May 1st, with only a brief interruption, during which model coefficients did not remain negative every day. In addition, mean heat accumulation during the first period—January 4th to January 16th—was very low and most likely did not have a strong effect in most years. It must be noted that this species may fulfill its critical chilling requirement much earlier than most perennial crops, and therefore, important and negative scores for heat accumulation could be expected at any time of the chilling period when adequate temperature levels are reached. We delineated the warming phase as the period between January 22nd and May 1st.
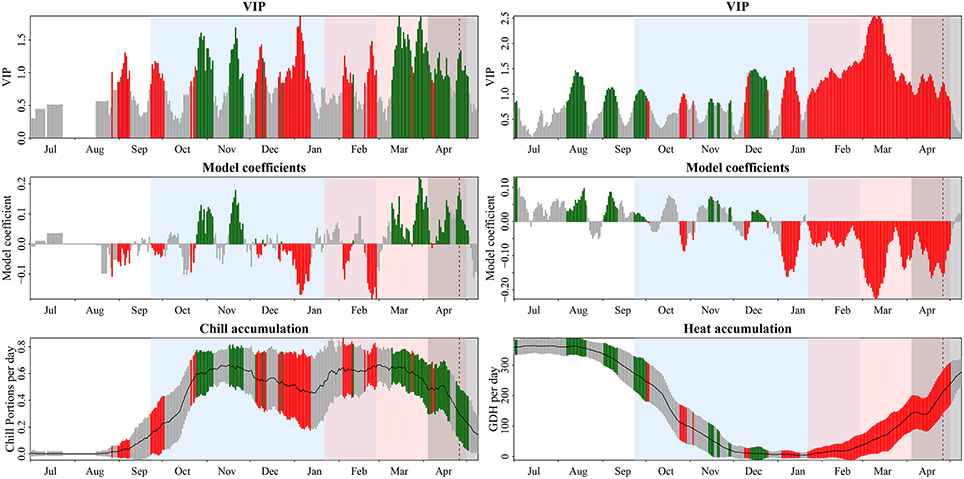
Figure 1. Results of Partial Least Squares (PLS) regression analysis for budburst dates of grapevine cv. ‘Riesling Italico’ in Mandicevac (Croatia), using the Dynamic Model and the GDH Model for quantifying chill and heat accumulation, respectively (historical data from 1961 to 2013). Color bars in the figures indicate VIP above 0.8, the threshold for considering variables important. Green and red bars represent, besides importance, a positive and negative relationship, respectively, between budburst and daily chilling and heat accumulation. In the lower graphs (chill accumulation and heat accumulation), bars represent the standard deviation of daily chill and heat accumulation, with colors following the same pattern as for the variable importance in the projection (VIP) and model coefficients. Blue, red, and gray shaded areas and dashed lines represent the designated chilling and warming period, range in budburst dates and average budburst date, respectively. GDH, Growing Degree Hours.
The delineation of chilling and warming phases allowed calculation of mean temperature during these phases. Results showed a weak effect of changes in temperature during the chilling phase on budburst date (Figure 2). Taking into account the angle and the separation of the contour lines in Figure 2, the sensitivity of budburst date to changes in temperature during the chilling period was small (0.03 d °C−1), compared to −4.38 d °C−1 for temperatures during the warming phase. The almost horizontal contour lines of the interpolation surface suggest that temperature during the warming period strongly affected budburst date compared to the effect of temperatures during the chilling period. In addition, variation in mean temperature during the delineated chilling phase is much lower than during the warming phase (ranges of −4.2 to 3.9°C and 3.0 to 9.2°C, respectively).
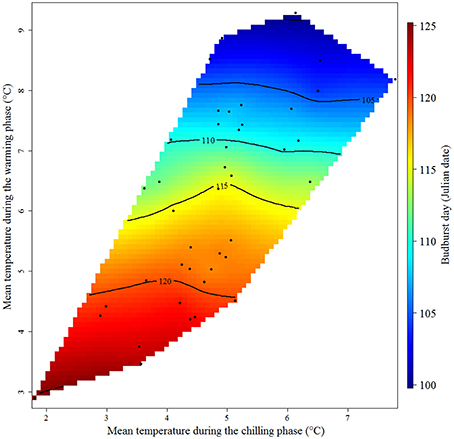
Figure 2. Response of the budburst date of grapevine cv. ‘Riesling Italico’ in Mandicevac (Croatia) to average temperatures during the chilling and warming periods (September 23rd to February 27th and January 22nd to May 1st, respectively (historical data from 1961 to 2013). Colors and contour lines represent predicted flowering dates expressed in Julian dates (days of the year) using observed data points of grapevine budburst dates in Mandicevac (Croatia; black dots).
Decoupling of the Effects of Water Availability and Temperature on Grapevine Phenophases under Field Conditions
The linear regression trend determined for all sites (Figure 3) shows that the sensitivity is −4.49 days change in budburst date for each degree of temperature increase (d °C−1) from March 1st to budburst. This sensitivity is higher than for any other phenophase displayed, as the stage from budbreak to flowering had a sensitivity of −3.29 d °C−1 and the stage from flowering to harvest had a sensitivity of −2.57 d °C−1. When the effect of temperature on field phenological data was decoupled from rainfall (Figure 4), precipitation showed a differential effect on phenological periods. The interpolation surface of the period from March 1st to budburst (Figure 4A) shows some delaying effects in rainy years and advancing effects in dry years, but this was not a general trend and it resulted in a high degree of patchiness. Contrarily, the period from budburst to flowering and flowering to ripe fruit resulted in smoother interpolation surfaces (Figures 4B,C, respectively). In the case of budburst to flowering (Figure 4B), only temperature and not rainfall showed an advancing effect. This is suggested by decreasing values of contour lines and interpolation surface with increasing temperature, but not with rainfall. However, in the case of the period from flowering to ripe fruit (Figure 4C), this effect was shared by increases in temperatures and decreases in precipitation.
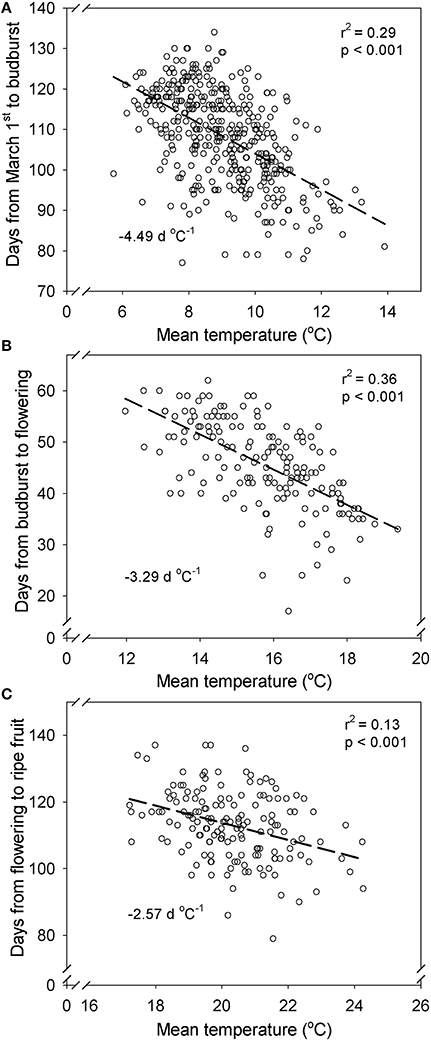
Figure 3. Time from March 1st to budburst (A), budburst to flowering (B) and flowering to ripe fruit stage (C) vs. mean temperature for that period for each year and place. Data from 9 plantings in Daruvar, Cepic, KriZevCi, Mandicevac and Trsteno (Croatia) (historical data from 1961 to 2013).
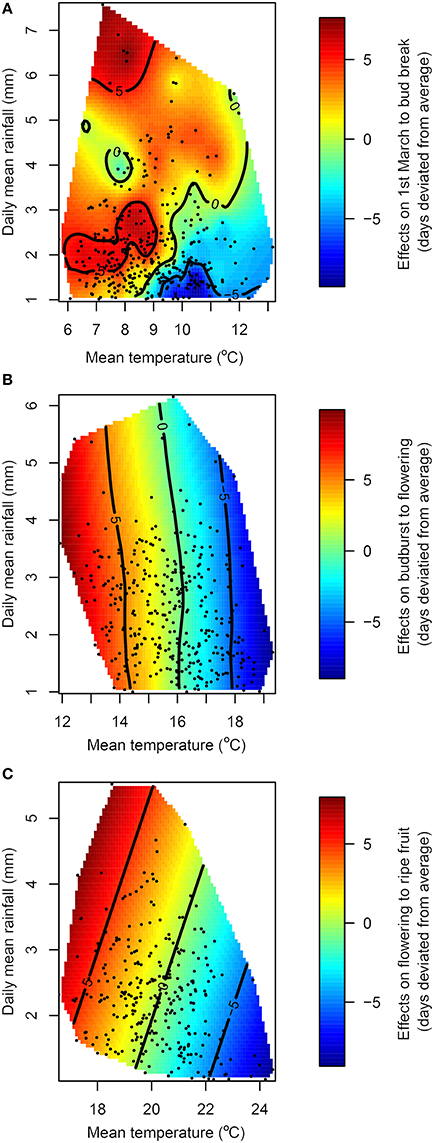
Figure 4. Response of the length of the periods March 1st to budburst (A), budburst to flowering (B) and flowering to ripe fruit (C) to mean temperature and mean rainfall for each planting and year (historical data from 1961 to 2013). Colors and contour lines represent predicted deviation from the average length of each period expressed in days using observed data points of the length of each phenophase (black dots).
Effects of Water Availability, Temperature, CO2 Concentration and their Interactions under Semi-Controlled Conditions
The two varieties (‘Red Tempranillo’ and ‘White Tempranillo’) showed different sensivities to increasing temperatures (Figure 5). The figures obtained were −1.52 d °C−1 in 2014 and 0.15 d °C−1 in 2015 for ‘Red Tempranillo’ and −2.03 d °C−1 in 2014 and −0.90 d °C−1 in 2015 for ‘White Tempranillo’. The lower sensitivity to temperature observed in 2015 for both varieties was most likely associated with higher temperatures recorded in that year and a higher number of days with temperatures above 35°C (Table 1). Atmospheric CO2 did not change the sensitivity to temperature in any case, and this is supported by the lack of interactions in the two-way ANOVA analysis. The overall effect of CO2 and temperature was highly significant [p(CO2) < 0.001 and p(Temp) = 0.001], with elevated CO2 having an advancing effect of 4.37 d and 3.54 d in T and T+4°C treatments, respectively. However, looking at the varieties separately, the effect was not significant for the ‘Red Tempranillo’ variety [p(CO2) and p(Temp) > 0.05], whereas the effect for ‘White Tempranillo’ was strong [p(CO2) < 0.001 and p(Temp) = 0.005]. Considering all years and varieties, high CO2 advanced phenology by 6.75 d and 4.06 d in the T and T+4°C treatments, respectively.
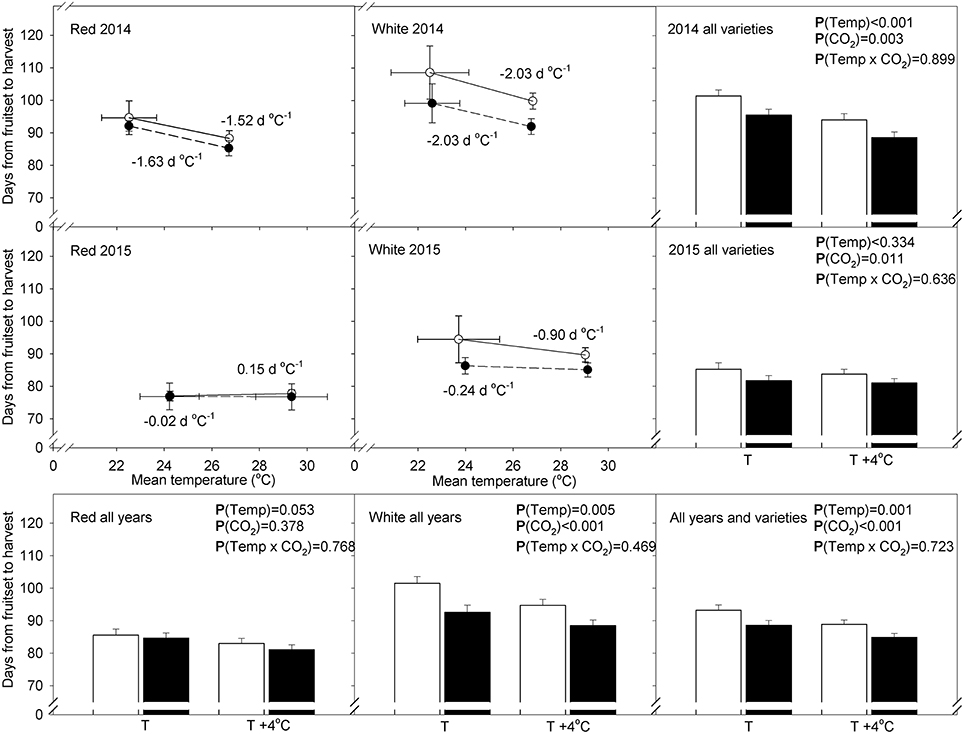
Figure 5. Days to complete fruit development (from fruit set to designated maturity) vs. mean temperature between the phenophases in ‘Red Tempranillo’ and ‘White Tempranillo’ grapevine grown under two CO2 concentrations (ambient CO2 or 700 μL L−1 CO2; white and black points and bars, respectively) and two temperature regimes (ambient temperature, T or ambient temperature +4°C, T+4°C). Points and bars represent means ± standard error (n = 16–20). P-values based on four-way ANOVA taking as main factors: cultivar, temperature, CO2 concentration and water availability.
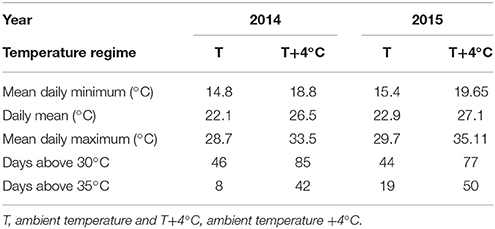
Table 1. Temperature recorded in the temperature gradient greenhouse experiments with ‘Red Tempranillo’ and ‘White Tempranillo’ grapevine.
It must be noted that several two-level interactions were significant for time from fruit set to veraison, veraison to harvest and fruit set to harvest (Table 2). Therefore, the significance of the main effects must be interpreted with caution. For instance, 5 out of 11 interactions involved the Year main effect, which reflects the inconsistency of some factor effects from year to year. Other important interactions were found between the Cultivar and CO2 for time from veraison to maturity and fruit set to maturity. These findings point out the higher susceptibility of the white cultivar under all the combinations of conditions. Still, it must be noted that for most combinations of treatments, elevated CO2 plants completed fruit development and ripening earlier than their ambient CO2 homolog. Interactions between environmental factors were also found, including between water deficit and temperature and between water deficit and CO2. In the main effect comparisons, water deficit extended the ripening period by an average of 3 days. However, looking at the effect of water deficit combined with other factors, cyclic drought (CD) had an advancing effect (i.e., ‘Red Tempranillo’ under T–E CO2 in 2015 and ‘White Tempranillo’ under T–E CO2 in 2014 and 2015), which explains the significant interactions between water availability and temperature and CO2.
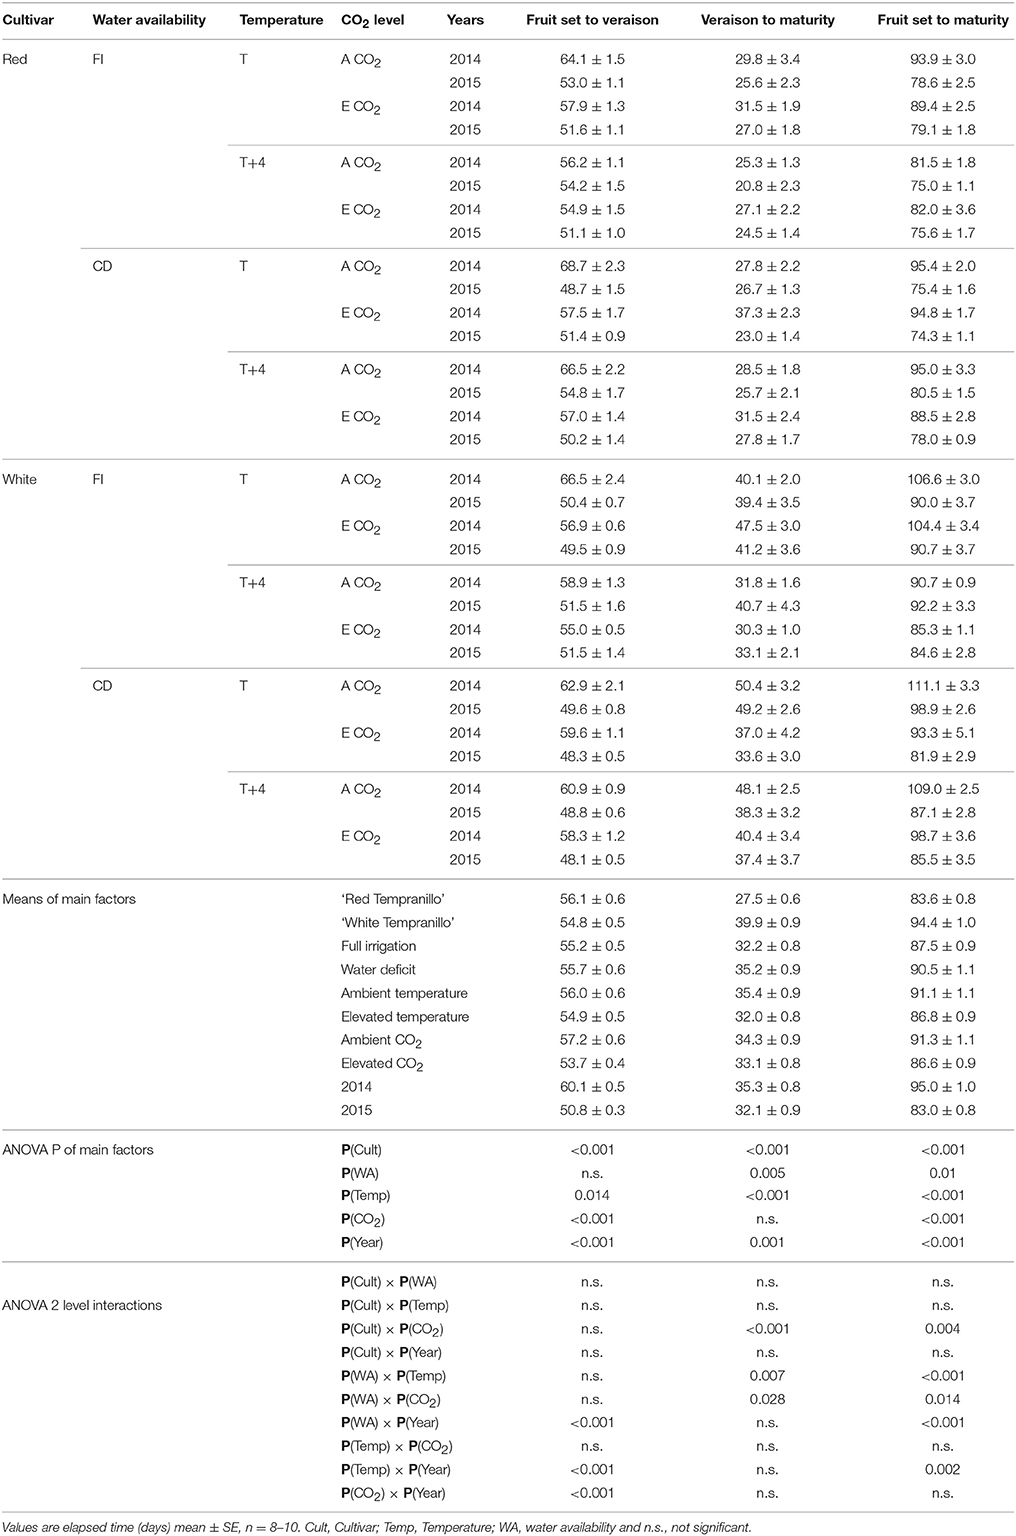
Table 2. Days to complete phenological periods: fruit set to veraison, veraison to designated maturity and fruit set to designated maturity in ‘Red Tempranillo’ and ‘White Tempranillo’ grapevine grown under two water availability levels (FI, full irrigation or CD, cyclic drought), two temperature regimes (ambient temperature, T or ambient temperature +4°C, T+4°C) and two CO2 concentrations (A CO2, ambient CO2, or E CO2, 700 μL L−1 CO2).
Discussion
Effect of Temperature
Many studies have reported the accelerating effects of rising temperatures on phenology based on events typically occurring in spring (i.e., budburst, leaf unfolding, and flowering). While most species show a clear advance in phenology, an exception to this general trend may be those species that are starting to experience difficulties in meeting their chilling requirements (Guo et al., 2015). In this respect, grapevine (Vitis vinifera L.) is presented in the literature as a species with a low chill requirement, despite its tendency to burst and flower rather late (Mullins et al., 1992). Although they are believed to need a very small exposure to chilling temperatures to resume growth and flower normally, incremental exposure to chilling temperatures reduces the time to respond to high temperatures and increases the percentage of budburst, which suggests some sensitivity to chilling (Dokoozlian, 1999). In the present study, grapevines do not show a major change in budburst date in response to changes in temperature during the chilling period. Instead, temperature during the warming period was the overriding factor influencing this phenophase (Figure 2). The high variable importance in the projection (VIP) values and negative coefficients for heat accumulation observed at the beginning of March highlight the importance of taking into account this period for the prediction of budburst and flowering. These results support previous studies that find best model performance for models using the March 1st as a start date for the accumulation of thermal time, instead of the classical approach of taking into account temperatures from January 1st (Garcia de Cortazar-Atauri et al., 2009; Duchene et al., 2010; Parker et al., 2011).
For later phenological events, such as onset of ripening, thermal time models have proven to be valuable tools. However, as the growing season goes on, the level of complexity increases and factors such as yield, cultural practices and water availability may also influence the timing of phenophases (Petrie and Sadras, 2008; Sadras and Petrie, 2011; Martínez de Toda et al., 2013). Simply, the ripening of non-climacteric fruits relies to a great extent on photoassimilation in the leaves, translocation and storage of photoassimilates, which are reactions greatly enhanced by temperature (Greer and Weedon, 2013). Historical data also support the relationship between temperature and commercial ripeness in grapes (Chuine et al., 2004; Daux et al., 2012). In the historical data used in this study, the effect of temperature on the time between flowering and harvest was visible, but—as expected—the correlation was weaker than for the completion of previous stages, such as budburst or flowering. This advancement of the ripening period, shifting dates from September to August in the northern hemisphere, has the additional effect of shifting this period to what is usually the warmest part of the year (Webb et al., 2007; Duchene et al., 2010). In this study, this effect resulted in an increase of the temperature during the ripening period by 1.27°C for each °C increase in the average temperature (Figure S1).
Effect of Water Availability in Relation to Temperature
Our studies show differences in the effects of rainfall depending on the phenological period. Whereas events occurring before berry development do not show a clear dependence on rainfall, berry development shows a higher dependence both on temperature and water availability (Figure 4). Mild water deficit has proven to enhance ripening through several processes, such as altering plant abscisic acid (ABA) signaling, reduction in berry size or concentrating berry contents (i.e., anthocyanins and sugars) (Deluc et al., 2009; van Leeuwen et al., 2009; Chaves et al., 2010). In fact, environmental cues such as water deficit, as well as solar radiation, and even heat within the suboptimal range of temperature of a variety, may promote signaling mechanisms, such as ABA biosynthesis, and enhance ripening (Kuhn et al., 2014). ABA signaling during grape ripening interacts with plant responses to exogenous stresses, by regulating the process of plant adaptation (Ferrandino and Lovisolo, 2014). Many key genes involved in flavonoid biosynthesis are up-regulated during ripening, therefore ABA accumulation induced by stress conditions may induce the activation of these key genes (Nicolas et al., 2014), thus improving berry quality (Ferrandino and Lovisolo, 2014). For example, despite hastening fruit ripening, mild water deficit normally has a desirable effect, increasing the concentration of some phenolic compounds in the grapes (Chaves et al., 2010). However, as climate change continues, places experiencing a risk of severe water deficit may encounter contrasting effects. Severe water deficit can induce stomatal closure, greatly reduce carbon fixation, and subsequently, impair berry ripening (Martínez-Lüscher et al., 2015a). This may explain the results obtained with fruit-bearing cuttings, where a water deficit appeared to generally delay maturity. In addition, water availability had significant interactions with both temperature and CO2 concentration. For conditions such as ambient temperature and elevated CO2, where plants were presumably less stressed, the general tendency of cyclic drought to delay ripening was reverted. Contrasting effects of water deficit have also been reported by Cook and Wolkovich (2016) in large scale field data analyses, where precipitation correlates positively with harvest date anomalies in France, while they correlate negatively in the drier vineyards of Spain. Cook and Wolkovich (2016) highlight that the relationship between water deficit and early harvest has weakened in recent decades in central Europe due to the decoupling of the incidence of high temperatures and drought.
The influence of temperature and water availability on grape ripening may depend on other factors, such as soil type, variety and rootstock, among others. Soil is a key factor for vine productivity and fruit quality, and the response of V. vinifera to water deficit may depend on the soil water retention capacity (Oliveira et al., 2003). In addition, the increase in phenolic concentrations observed in higher clay soils were greater in wet and intermediate years than in dry years when abundant ABA biosynthesis controls plant responses to drought, independently from soil properties (references in Lovisolo et al., 2016). Soils with moderate water retention capacity induced mild water stress, thus favoring fruit ripening, compared with soils with either very low or unlimited water availability (Tramontini et al., 2013). Also, they stated that water availability in the soil overrides differences due to cultivar in determining the vineyard productive potential. van Leeuwen et al. (2004), who studied the effect of weather, soil and cultivar simultaneously, found that soil had little effect on phenology (1 day change in flowering-harvest) compared with weather and cultivar (up to 14 and 9 day difference in the flowering-harvest period, respectively). For fruit quality, however, impacts of weather and soil were greater than that of cultivar, with effects being mediated through their influence on vine water status. Concerning rootstocks, a small and possibly insignificant 3-day difference for the time between flowering and harvest in a comparison among three different rootstocks was reported by Dias Tofanelli et al. (2011). In contrast, Corso et al. (2016), using a selection of the most representative rootstocks and scions of mid-latitude vineyards, showed a rather strong effect of rootstocks on ripening rates. Varieties can also differ in their response to increased temperatures and water deficit. Based on the results under controlled conditions, late ripening varieties may be more sensitive than early ones. Probably, early ripening varieties may be more predetermined to ripen during the warmest part of the year, reaching a threshold of precocity where further advances are not possible, whereas late ripening varieties may be advanced to a greater extent, and therefore, the increase in ambient temperature during their ripening period may be greater.
Effect of CO2 Concentration in Relation to Temperature
Grapevine fruit-bearing cuttings grown under semi-controlled conditions showed similar sensitivities to increasing temperatures compared to field grown vines, although sensitivities were lower in the warmer year, 2015, and for the early cultivar, ‘Red Tempranillo.’ The change induced by elevated CO2 followed similar variation, but this effect was greater than the effect of the 4°C increase. In recent studies with grapevine fruit-bearing cuttings, a correlation between carbon fixation rates and grape development rates has been reported (Martínez-Lüscher et al., 2015b). This behavior has been described under field conditions as well, where leaf removal treatments, which presumably reduce overall grapevine carbon fixation, resulted in a delay in grape maturity (Martínez de Toda et al., 2013; Parker et al., 2014, 2015). Plants exposed to elevated CO2 often show photosynthetic acclimation, which is characterized by an initial increase in carbon fixation rates and reduction to initial levels or even lower after a mid-term exposure (Leakey et al., 2009). However, this is not a generalized response and, even if this were the case, it would not mean that plant performance and fruit yield would be strongly affected (Idso and Kimball, 1991; Leakey et al., 2009). One of the greatest efforts to study the effect of elevated CO2 on fruiting woody perennials is a 17-year experiment on sour orange trees (Citrus aurantium L.) with open-top-chambers, which showed a constant increase in yield despite photosynthetic acclimation (Kimball et al., 2007). To the best of our knowledge, a paper by Bindi et al. (2001) is the only FACE experiment study in the literature, where an increase in sugar accumulation in the grapes was reported. Although this effect was diluted in the latest stages of ripening, this is evidence for accelerated ripening in grapes grown under elevated CO2. In previous reports, Salazar Parra et al. (2010) and Martínez-Lüscher et al. (2016) showed how grapes grown under both elevated CO2 and increased temperature met the sugar criteria for harvest much earlier, and this led to a decrease in anthocyanin concentration. In contrast, Kizildeniz et al. (2015), who studied the interaction between elevated CO2 and increasing temperature, reported that elevated CO2 showed mitigating effects, generally increasing anthocyanin concentration and increasing either grape organic acid concentration or decreasing grape pH, probably related to the precocity of these treatments. Thus, due to its complexity, the relationship between different environmental factors and grape composition should be assessed with caution, as phenology-mediated effects are likely.
Martínez de Toda and Balda Manzanos (2013) and Martínez de Toda et al. (2013) showed that cultural practices, such as canopy density reduction, can have an opposite effect to that resulting from high temperature, reducing TSS concentration for a fixed date. However, in that case, this contributed to restore grape pH, but reduced anthocyanin concentration. Interestingly, Martínez de Toda et al. (2014), in a similar experiment but harvesting grapes at a designated TSS concentration, found that delayed phenological development contributed to increasing anthocyanin concentration. These findings suggest that carbon translocation into the grapes can be controlled, thus altering the timing of phenological stages, which can contribute to mitigating the effects of climate change.
Conclusions
The results of the present study suggest that temperature, water deficit and CO2 levels representative of the conditions expected for the end of the 21st century may strongly advance budburst, flowering, and berry designated maturity. Some uncertainties still exist, such as whether the delaying effect of severe water deficit or the decreasing sensitivity under extreme temperature, which have been observed both in fruit-bearing cuttings in the present study and in other field studies, will be generally observable in vineyards in the future. Future efforts should be directed to investigating how grapevine whole-plant physiology may be altered in response to climate change-related factors, and to uncoupling the effects of environmental factors such as temperature, water deficit and CO2, from their potential effects on berry phenology. These are crucial topics to establish successful mitigation and adaptive strategies for viticulture in a changing environment.
Author Contributions
JM performed the analysis and elaborated the draft of the manuscript. ZD and EL designed the analysis of the field data. IP, JI, and FM designed the TGG experiments, TK performed the TGG experiments. VV provided the field data and reviewed the manuscript. JM, TK, ZD, EL, CV, EG, IP, JI, FM, and SD contributed to the interpretation of the results and elaboration of the final manuscript.
Funding
This work was funded by the Land Settlement Association, the University of Reading Research Endowment Trust and East Malling Trust, European Union (INNOVINE Call FP7-KBBE-2011-6, Proposal N°311775), Ministerio de Ciencia e Innovación of Spain (MCINN BFU 2011-26989), Ministerio de Economía y Competitividad of Spain (AGL2014-56075-C2-1-R), Aragón Government (A03 research group) and Asociación de Amigos de la Universidad de Navarra (grant to TK).
Conflict of Interest Statement
The authors declare that the research was conducted in the absence of any commercial or financial relationships that could be construed as a potential conflict of interest.
Acknowledgments
We acknowledge the members of the PEP725 project making possible accessing the field data, the E-OBS dataset from the EU-FP6 project ENSEMBLES (http://ensembles-eu.metoffice.com) and the data providers in the ECA&D project (http://www.ecad.eu). Special thanks to Amadeo Urdiain, Hector Santesteban and Mónica Oyarzun for technical assistance in the TGG experiments.
Supplementary Material
The Supplementary Material for this article can be found online at: https://www.frontiersin.org/article/10.3389/fenvs.2016.00048
References
Almorox, J., Hontoria, C., and Benito, M. (2005). Statistical validation of daylength definitions for estimation of global solar radiation in Toledo, Spain. Energy Conv. Manag. 46, 1465–1471. doi: 10.1016/j.enconman.2004.07.007
Anderson, J. L., Richardson, E. A., and Kesner, C. D. (1986). Validation of chill unit and flower bud phenology models for “Montmercy” sour cherry. Acta Hortic. 184, 71–78. doi: 10.17660/ActaHortic.1986.184.7
Antolin, M. C., Baigorri, H., De Luis, I., Aguirrezabal, F., Geny, L., Broquedis, M., et al. (2003). ABA during reproductive development in non-irrigated grapevines (Vitis vinifera L. cv. Tempranillo). Aust. J. Grape Wine Res. 9, 169–176. doi: 10.1111/j.1755-0238.2003.tb00266.x
Bindi, M., Fibbi, L., and Miglietta, F. (2001). Free Air CO2 Enrichment (FACE) of grapevine (Vitis vinifera L.): II. Growth and quality of grape and wine in response to elevated CO2 concentrations. Eur. J. Agron. 14, 145–155. doi: 10.1016/S1161-0301(00)00093-9
Bonada, M., Jeffery, D. W., Petrie, P. R., Moran, M. A., and Sadras, V. O. (2015). Impact of elevated temperature and water deficit on the chemical and sensory profiles of Barossa Shiraz grapes and wines. Aust. J. Grape Wine Res. 21, 240–253. doi: 10.1111/ajgw.12142
Bonada, M., and Sadras, V. O. (2015). Review: critical appraisal of methods to investigate the effect of temperature on grapevine berry composition. Aust. J. Grape Wine Res. 21, 1–17. doi: 10.1111/ajgw.12102
Campoy, J. A., Ruiz, D., and Egea, J. (2011). Dormancy in temperate fruit trees in a global warming context: a review. Sci. Hortic. 130, 357–372. doi: 10.1016/j.scienta.2011.07.011
Chaves, M. M., Zarrouk, O., Francisco, R., Costa, J. M., Santos, T., Regalado, A. P., et al. (2010). Grapevine under deficit irrigation: hints from physiological and molecular data. Ann. Bot. 105, 661–676. doi: 10.1093/aob/mcq030
Chuine, I., Yiou, P., Viovy, N., Seguin, B., Daux, V., and Le Roy Ladurie, E. (2004). Historical phenology: grape ripening as a past climate indicator. Nature 432, 289–290. doi: 10.1038/432289a
Cohen, S. D., Tarara, J. M., Gambetta, G. A., Matthews, M. A., and Kennedy, J. A. (2012). Impact of diurnal temperature variation on grape berry development, proanthocyanidin accumulation, and the expression of flavonoid pathway genes. J. Exp. Bot. 63, 2655–2665. doi: 10.1093/jxb/err449
Considine, M. J., and Considine, J. A. (2016). On the language and physiology of dormancy and quiescence in plants. J. Exp. Bot. 67, 3189–3203. doi: 10.1093/jxb/erw138
Cook, B. I., and Wolkovich, E. M. (2016). Climate change decouples drought from early wine grape harvests in France. Nat. Clim. doi: 10.1038/nclimate2960. [Epub ahead of print].
Corso, M., Vannozzi, A., Ziliotto, F., Zouine, M., Nicolato, T., Maza, E., et al. (2016). Grapevine rootstocks differentially affect the rate of ripening and modulate auxin-related genes in Cabernet Sauvignon berries. Front. Plant Sci. 7:69. doi: 10.3389/fpls.2016.00069
Daux, V., de Cortazar-Atauri, I. G., Yiou, P., Chuine, I., Garnier, E., Ladurie, E. L., et al. (2012). An open-access database of grape harvest dates for climate research: data description and quality assessment. Climate Past 8, 1403–1418. doi: 10.5194/cp-8-1403-2012
Davies, W. J., Tardieu, F., and Trejo, C. L. (1994). How do chemical signals work in plants that grow in drying soil. Plant Physiol. 104, 309–314.
Deluc, L. G., Quilici, D. R., Decendit, A., Grimplet, J., Wheatley, M. D., Schlauch, K. A., et al. (2009). Water deficit alters differentially metabolic pathways affecting important flavor and quality traits in grape berries of Cabernet Sauvignon and Chardonnay. BMC Genomics 10:212. doi: 10.1186/1471-2164-10-212
Demir, K. (2014). A review on grape growing in tropical regions. Turk. J. Agric. Nat. Sci. 6, 1236–1241.
Dias Tofanelli, M. B., Vasconcelos Botelho, R., Paioli Pires, E. J., Ferreira Vilela, L. A., and Oliveira Ribeiro, D. (2011). Phehology of “Niagara Rosada” grepevines grafted on different rootstocks grown on Cerrado (Brazilian savanna) of Goiás State, Brazil. Afr. J. of Biotechnol. 10, 3387–3392.
Dokoozlian, N. K. (1999). Chilling temperature and duration interact on the budbreak of “Perlette” grapevine cuttings. HortScience 34, 1054–1056.
Duchene, E., Huard, F., Dumas, V., Schneider, C., and Merdinoglu, D. (2010). The challenge of adapting grapevine varieties to climate change. Clim. Res. 41, 193–204. doi: 10.3354/cr00850
Etienne, A., Genard, M., Lobit, P., Mbeguie-A-Mbeguie, D., and Bugaud, C. (2013). What controls fleshy fruit acidity? A review of malate and citrate accumulation in fruit cells. J. Exp. Bot. 64, 1451–1469. doi: 10.1093/jxb/ert035
Ferrandino, A., and Lovisolo, C. (2014). Abiotic stress effects on grapevine (Vitis vinifera L.): Focus on abscisic acid-mediated consequences on secondary metabolism and berry quality. Environ. Exp. Bot. 103, 138–147. doi: 10.1016/j.envexpbot.2013.10.012
Fishman, S., Erez, A., and Couvillon, G. A. (1987). The temperature dependence of dormancy breaking in plants: mathematical analysis of a two-step model involving a cooperative transition. J. Theor. Biol. 124, 473–483. doi: 10.1016/S0022-5193(87)80221-7
García de Cortázar-Atauri, I., Brisson, N., and Gaudillere, J. P. (2009). Performance of several models for predicting budburst date of grapevine (Vitis vinifera L.). Int. J. Biometeorol. 53, 317–326. doi: 10.1007/s00484-009-0217-4
Gladstones, J. S. (1992). Viticulture and Environment: A Study of the Effects of Environment on Grapegrowing and Wine Qualities, with Emphasis on Present and Future Areas for Growing Winegrapes in Australia. Adelaide, SA: Winetitles.
Greer, D. H., and Weedon, M. M. (2013). The impact of high temperatures on Vitis vinifera cv. Semillon grapevine performance and berry ripening. Front. Plant. Sci. 4:491. doi: 10.3389/fpls.2013.00491
Guo, L., Dai, J., Wang, M., Xu, J., and Luedeling, E. (2015). Responses of spring phenology in temperate zone trees to climate warming: a case study of apricot flowering in China. Agric. For. Meteorol. 201, 1–7. doi: 10.1016/j.agrformet.2014.10.016
Haylock, M. R., Hofstra, N., Klein Tank, A. M. G., Klok, E. J., Jones, P. D., and New, M. (2008). A European daily high-resolution gridded data set of surface temperature and precipitation for 1950–2006. J. Geophys. Res. 113:D20119. doi: 10.1029/2008jd010201
Idso, S. B., and Kimball, B. A. (1991). Downward regulation of photosynthesis and growth at high CO2 levels No evidence for either phenomenon in three-year study of sour orange trees. Plant Physiol. 96, 990–992. doi: 10.1104/pp.96.3.990
IPCC (2014a). Climate Change 2014: Mitigation of Climate Change. Contribution of Working Group III to the Fifth Assessment Report of the Intergovernmental Panel on Climate Change. Cambridge; New York, NY: Cambridge University Press.
IPCC (2014b). “Climate Change 2014: Synthesis Report,” in Contribution of Working Groups I, II and III to the Fifth Assessment Report of the Intergovernmental Panel on Climate Change, eds Core Writing Team, R. K. Pachauri, and L. A. Meyer (Geneva: IPCC), 151.
Jones, G. (2006). “Climate and terroir: impacts of climate variability and change on wine,” in Fine Wine and Terroir-The Geoscience Perspective, eds R. W. Macqueen and L. D. Meinert (St John's, NL: Geological Association of Canada), 1–14.
Jones, G. V. (2007). Climate change: observations, projections, and general implications for viticulture and wine production. Econ. Depart. Working Paper 7, 15.
Jones, G. V., White, M. A., Cooper, O. R., and Storchmann, K. (2005). Climate change and global wine quality. Clim. Change 73, 319–343. doi: 10.1007/s10584-005-4704-2
Kimball, B. A., Idso, S. B., Johnson, S., and Rillig, M. C. (2007). Seventeen years of carbon dioxide enrichment of sour orange trees: final results. Global Change Biol. 13, 2171–2183. doi: 10.1111/j.1365-2486.2007.01430.x
Kizildeniz, T., Mekni, I., Santesteban, H., Pascual, I., Morales, F., and Irigoyen, J. J. (2015). Effects of climate change including elevated CO2 concentration, temperature and water deficit on growth, water status, and yield quality of grapevine (Vitis vinifera L.) cultivars. Agric. Water Manag. 159, 155–164. doi: 10.1016/j.agwat.2015.06.015
Kuhn, N., Guan, L., Dai, Z. W., Wu, B. H., Lauvergeat, V., Gomès, E., et al. (2014). Berry ripening: recently heard through the grapevine. J. Exp. Bot. 65, 4543–4559. doi: 10.1093/jxb/ert395
Lakso, A. N., and Kliewer, W. M. (1975). The influence of temperature on malic acid metabolism in grape berries: I. Enzyme responses. Plant Physiol. 56, 370–372. doi: 10.1104/pp.56.3.370
Leakey, A. D. B., Ainsworth, E. A., Bernacchi, C. J., Rogers, A., Long, S. P., and Ort, D. R. (2009). Elevated CO2 effects on plant carbon, nitrogen, and water relations: six important lessons from FACE. J. Exp. Bot. 60, 2859–2876. doi: 10.1093/jxb/erp096
Li, S., and Dami, I. E. (2016). Responses of Vitis vinifera ‘Pinot gris’ grapevines to exogenous abscisic acid (ABA): I. yield, fruit quality, dormancy, and freezing tolerance. J. Plant Growth Regul. 35, 245–255. doi: 10.1007/s00344-015-9529-2
Linvill, D. E. (1990). Calculating chilling hours and chill units from daily maximum and minimum temperature observations. Hortscience 25, 14–16.
Lorenz, D. H., Eichhorn, K. W., Bleiholder, H., Klose, R., Meier, U., and Weber, E. (1995). Growth stages of the grapevine: phenological growth stages of the grapevine (Vitis vinifera L. ssp. vinifera)—Codes and descriptions according to the extended BBCH scale†. Aust. J. Grape Wine Res. 1, 100–103. doi: 10.1111/j.1755-0238.1995.tb00085.x
Lovisolo, C., Lavoie-Lamoureux, A., Tramontini, S., and Ferrandino, A. (2016). Grapevine adaptations to water stress: new perspectives about soil/plant interactions. Theor. Exp. Plant. Physiol. 28, 53–66. doi: 10.1007/s40626-016-0057-7
Luedeling, E. (2012). Climate change impacts on winter chill for temperate fruit and nut production: a review. Sci. Hortic. 144, 218–229. doi: 10.1016/j.scienta.2012.07.011
Luedeling, E. (2016). chillR: Statistical Methods for Phenology Analysis in Temperate Fruit Trees. R package version 0.62. Available online at: http://cran.r-project.org/web/packages/chillR/
Luedeling, E., and Brown, P. H. (2011). A global analysis of the comparability of winter chill models for fruit and nut trees. Int. J. Biometeorol. 55, 411–421. doi: 10.1007/s00484-010-0352-y
Luedeling, E., and Gassner, A. (2012). Partial Least Squares Regression for analyzing walnut phenology in California. Agric. For. Meteorol. 158–159, 43–52. doi: 10.1016/j.agrformet.2011.10.020
Luedeling, E., Kunz, A., and Blanke, M. M. (2013). Identification of chilling and heat requirements of cherry trees–a statistical approach. Int. J. Biometeorol. 57, 679–689. doi: 10.1007/s00484-012-0594-y
Luedeling, E., Zhang, M., McGranahan, G., and Leslie, C. (2009). Validation of winter chill models using historic records of walnut phenology. Agric. For. Meteorol. 149, 1854–1864. doi: 10.1016/j.agrformet.2009.06.013
Martínez de Toda, F., and Balda Manzanos, P. (2013). Delaying berry ripening through manipulating leaf area to fruit ratio. Vitis 52, 171–176.
Martínez de Toda, F., Sancha González, J. C., and Balda Manzanos, P. (2013). Reducing the sugar and pH of the grape (Vitis vinifera L. cvs. Grenache and Tempranillo) through a single shoot trimming. S. Afr. J. Enol. Vitic. 34, 246–251.
Martínez de Toda, F., Sancha, J. C., Zheng, W., and Balda, P. (2014). Leaf area reduction by trimming, a growing technique to restore the anthocyanins: sugars ratio decoupled by the warming climate. Vitis 53, 189–192.
Martínez-Lüscher, J., Morales, F., Delrot, S., Sánchez-Díaz, M., Gomès, E., Aguirreolea, J., et al. (2015a). Characterization of the adaptive response of grapevine (cv. Tempranillo) to UV-B radiation under water deficit conditions. Plant Sci. 232, 13–22. doi: 10.1016/j.plantsci.2014.12.013
Martínez-Lüscher, J., Morales, F., Delrot, S., Sánchez-Díaz, M., Gomès, E., Aguirreolea, J., et al. (2015b). Climate change conditions (elevated CO2 and temperature) and UV-B radiation affect grapevine (Vitis vinifera cv. Tempranillo) leaf carbon assimilation, altering fruit ripening rates. Plant Sci. 236, 168–176. doi: 10.1016/j.plantsci.2015.04.001
Martínez-Lüscher, J., Sánchez-Díaz, M., Delrot, S., Aguirreolea, J., Pascual, I., and Gomès, E. (2016). Ultraviolet-B alleviates the uncoupling effect of elevated CO2 and increased temperature on grape berry (Vitis vinifera cv. Tempranillo) anthocyanin and sugar accumulation. Aust. J. Grape Wine Res. 22, 87–95. doi: 10.1111/ajgw.12213
Meinshausen, M., Smith, S. J., Calvin, K., Daniel, J. S., Kainuma, M. L. T., Lamarque, J.-F., et al. (2011). The RCP greenhouse gas concentrations and their extensions from 1765 to 2300. Clim. Change 109, 213–241. doi: 10.1007/s10584-011-0156-z
Morales, F., Pascual, I., Sánchez-Díaz, M., Aguirreolea, J., Irigoyen, J. J., Goicoechea, N., et al. (2014). Methodological advances: using greenhouses to simulate climate change scenarios. Plant Sci. 226, 30–40. doi: 10.1016/j.plantsci.2014.03.018
Mullins, M. G. (1966). Test-plant for investigations of the physiology of fruiting in Vitis vinifera L. Nature 209, 419–420. doi: 10.1038/209419a0
Mullins, M. G., Bouquet, A., and Williams, L. E. (1992). Biology of the Grapevine. Cambridge, UK: Cambridge University Press.
Nicolas, P., Lecourieux, D., Kappel, C., Cluzet, S., Cramer, G., Delrot, S., et al. (2014). The basic leucine zipper transcription factor ABSCISIC ACID RESPONSE ELEMENT-BINDING FACTOR2 is an important transcriptional regulator of abscisisic acid-dependent grape ripening processes. Plant Physiol. 164, 365–383. doi: 10.1104/pp.113.231977
Oliveira, C., Silva Ferreira, A. C., Mendes Pinto, M., Hogg, T., Alves, F., and Guedes de Pinho, P. (2003). Carotenoid compounds in grapes and their relationship to plant water status. J. Agric. Food Chem. 51, 5967–5971. doi: 10.1021/jf034275k
Ollat, N., Geny, L., and Soyer, J. (1998). Les boutures fructifères de vigne: validation d'un modèle d'étude du development de la physiologie de la vigne. I. Caracteristiques de l'appareil vegetatif. J. Int. Sci. Vigne Vin 32, 1–8.
Parker, A. K., de Cortazar-Atauri, I. G., van Leeuwen, C., and Chuine, I. (2011). General phenological model to characterise the timing of flowering and veraison of Vitis vinifera L. Aust. J. Grape Wine Res. 17, 206–216. doi: 10.1111/j.1755-0238.2011.00140.x
Parker, A. K., Hofmann, R. W., van Leeuwen, C., McLachlan, A. R. G., and Trought, M. C. T. (2014). Leaf area to fruit mass ratio determines the time of veraison in Sauvignon Blanc and Pinot Noir grapevines. Aust. J. Grape Wine Res. 20, 422–431. doi: 10.1111/ajgw.12092
Parker, A. K., Hofmann, R. W., van Leeuwen, C., McLachlan, A. R. G., and Trought, M. C. T. (2015). Manipulating the leaf area to fruit mass ratio alters the synchrony of total soluble solids accumulation and titratable acidity of grape berries. Aust. J. Grape Wine Res. 21, 266–276. doi: 10.1111/ajgw.12132
Petrie, P. R., and Sadras, V. O. (2008). Advancement of grapevine maturity in Australia between 1993 and 2006: putative causes, magnitude of trends and viticultural consequences. Aust. J. Grape Wine Res. 14, 33–45. doi: 10.1111/j.1755-0238.2008.00005.x
Rawson, H. M. (1995). Yield responses of 2 wheat genotypes to carbon-dioxyde and temperature in-field studies using temperature-gradient tunnels. Aust. J. Plant Physiol. 22, 23–32. doi: 10.1071/PP9950023
R Development Core Team (2016). R: A Language and Environment for Statistical Computing. Vienna: R Foundation for Statistical Computing. Available online at: http://www.R-project.org
Sadras, V. O., and Moran, M. A. (2012). Elevated temperature decouples anthocyanins and sugars in berries of Shiraz and Cabernet Franc. Aust. J. Grape Wine Res. 18, 115–122. doi: 10.1111/j.1755-0238.2012.00180.x
Sadras, V. O., and Moran, M. A. (2013). Nonlinear effects of elevated temperature on grapevine phenology. Agric. For. Meteorol. 173, 107–115. doi: 10.1016/j.agrformet.2012.10.003
Sadras, V. O., and Petrie, P. R. (2011). Climate shifts in south-eastern Australia: early maturity of Chardonnay, Shiraz and Cabernet Sauvignon is associated with early onset rather than faster ripening. Aust. J. Grape Wine Res. 17, 199–205. doi: 10.1111/j.1755-0238.2011.00138.x
Sadras, V. O., Stevens, R., Pech, J., Taylor, E., Nicholas, P., and McCarthy, M. (2007). Quantifying phenotipic plasticity of berry traits using an allometric-type approach: a case study on anthocyanins and sugars in berries of Cabernet Sauvignon. Aust. J. Grape Wine Res. 13, 72–80. doi: 10.1111/j.1755-0238.2007.tb00237.x
Salazar Parra, C. (2011). Vid y Cambio Climático. Estudio del Proceso de Maduración de la baya en Esquejes Fructíferos de Tempranillo, en Respuesta a la Interacción de CO2 Elevado, Estrés Hídrico y Temperatura Elevada. PhD Thesis. University of Navarra. Spain
Salazar Parra, C., Aguirreolea, J., Sánchez-Díaz, M., Irigoyen, J. J., and Morales, F. (2010). Effects of climate change scenarios on Tempranillo grapevine (Vitis vinifera L.) ripening: response to a combination of elevated CO2 and temperature, and moderate drought. Plant Soil 337, 179–191. doi: 10.1007/s11104-010-0514-z
Sweetman, C., Deluc, L. G., Cramer, G. R., Ford, C. M., and Soole, K. L. (2009). Regulation of malate metabolism in grape berry and other developing fruits. Phytochemistry 70, 1329–1344. doi: 10.1016/j.phytochem.2009.08.006
Tramontini, S., van Leeuwen, C., Domec, J.-C., Destrac-Irvine, A., Basteau, C., Vitali, M., et al. (2013). Impact of soil texture and water availability on the hydraulic control of plant and grape-berry development. Plant Soil 368, 215–230. doi: 10.1007/s11104-012-1507-x
van Leeuwen, C., Friant, P., Choné, X., Tregoat, O., Koundouras, S., and Dubourdieu, D. (2004). Influence of climate, soil, and cultivar on terroir. Am. J. Enol. Vitic. 55, 207–217.
van Leeuwen, C., Schultz, H. R., Garcia de Cortazar-Atauri, I., Duchene, E., Ollat, N., Pieri, P., et al. (2013). Why climate change will not dramatically decrease viticultural suitability in main wine-producing areas by 2050. Proc. Natl. Acad. Sci. U.S.A. 110, E3051–E3052. doi: 10.1073/pnas.1307927110
van Leeuwen, C., and Seguin, G. (2006). The concept of terroir in viticulture. J. Wine Res. 17, 1–10. doi: 10.1080/09571260600633135
van Leeuwen, C., Tregoat, O., Choné, X., Bois, B., Pernet, D., and Gaudillere, J. P. (2009). Vine water status is a key factor in grape ripening and vintage quality for red Bordeaux wine. How can it be assessed for vineyard management purposes? J. Int. Sci. Vigne Vin 43, 121–134. doi: 10.20870/oeno-one.2009.43.3.798
Webb, L. B., Whetton, P. H., and Barlow, E. W. R. (2007). Modelled impact of future climate change on the phenology of winegrapes in Australia. Aust. J. Grape Wine Res. 13, 165–175. doi: 10.1111/j.1755-0238.2007.tb00247.x
Webb, L. B., Whetton, P. H., Bhend, J., Darbyshire, R., Briggs, P. R., and Barlow, E. W. R. (2012). Earlier wine-grape ripening driven by climatic warming and drying and management practices. Nature Climate Change 2, 259–264. doi: 10.1038/nclimate1417
Keywords: climate change, viticulture, fruit development, ripening, chilling, dormancy, partial least squares regression
Citation: Martínez-Lüscher J, Kizildeniz T, Vučetić V, Dai Z, Luedeling E, van Leeuwen C, Gomès E, Pascual I, Irigoyen JJ, Morales F and Delrot S (2016) Sensitivity of Grapevine Phenology to Water Availability, Temperature and CO2 Concentration. Front. Environ. Sci. 4:48. doi: 10.3389/fenvs.2016.00048
Received: 29 April 2016; Accepted: 09 June 2016;
Published: 12 July 2016.
Edited by:
Urs Feller, University of Bern, SwitzerlandReviewed by:
Claudio Lovisolo, University of Turin, ItalyMaren Müller, University of Barcelona, Spain
Copyright © 2016 Martínez-Lüscher, Kizildeniz, Vučetić, Dai, Luedeling, van Leeuwen, Gomès, Pascual, Irigoyen, Morales and Delrot. This is an open-access article distributed under the terms of the Creative Commons Attribution License (CC BY). The use, distribution or reproduction in other forums is permitted, provided the original author(s) or licensor are credited and that the original publication in this journal is cited, in accordance with accepted academic practice. No use, distribution or reproduction is permitted which does not comply with these terms.
*Correspondence: Johann Martínez-Lüscher, jmluscher@gmail.com