VRAKA—A Probabilistic Risk Assessment Method for Potentially Polluting Shipwrecks
 Hanna Landquist
 Lars Rosén
 Andreas Lindhe
 Ida-Maja Hassellöv
- 1Department of Shipping and Marine Technology, Chalmers University of Technology, Gothenburg, Sweden
- 2Department of Civil and Environmental Engineering, Chalmers University of Technology, Gothenburg, Sweden
Shipwrecks around the world contain unknown volumes of hazardous substances which, if discharged, could harm the marine environment. Shipwrecks can deteriorate for a number of reasons, including corrosion and physical impact from trawling and other activities, and the probability of a leakage increases with time. Before deciding on possible mitigation measures, there are currently few comprehensive methods for assessing shipwrecks with respect to pollution risks. A holistic method for estimating environmental risks from shipwrecks should be based on well-established risk assessment methods and should take into account both the probability of discharge and the potential consequences. The purpose of this study was therefore to present a holistic risk assessment method for potentially polluting shipwrecks. The focus is set to developing a method for estimating the environmental consequences of potential discharges of hazardous substances from shipwrecks and to combine this with earlier research on a tool for estimating the probability of discharge of hazardous substances. Risk evaluation should also be included in a full risk assessment and is the subject of further research. The consequence assessment was developed for application in three tiers. In Tier 1, the probability of discharge and possible amount of discharge are compared to other shipwrecks. In Tier 2, a risk matrix, including a classification of potential consequences, is suggested as a basis for assessment and comparison. The most detailed level, Tier 3, is based on advanced tools for oil spill trajectory modeling and sensitivity mapping of the Swedish coast. To illustrate the method an example application on two wrecks is presented. Wreck number 1 present a lower probability of discharge and a lower consequence in a Tier 1 and Tier 3 assessment. For the Tier 2 consequence assessment, the two example wrecks present equal consequence. The tool for estimating the probability of discharge of hazardous substances from shipwrecks, and the approach for consequence estimation, offers a comprehensive method for assessing the risks presented by potentially polluting shipwrecks. The method is known as VRAKA (short for shipwreck risk assessment in Swedish) and provides decision support, facilitating prioritization of risk mitigation measures enabling efficient use of available resources.
Introduction
Shipwrecks are recognized as a risk to the marine environment (Michel et al., 2005; NOAA, 2013; Ventikos et al., 2013) and the substantial costs associated with remediation of shipwrecks (Etkin et al., 2009) imply that it is not economically viable to take action for all wrecks. In Swedish waters only, it is estimated that 2700 wrecks pose a potential environmental threat (Larsson et al., 2011) and similar situations are reported from many parts of the world (Michel et al., 2005). Each wreck is unique in terms of time since it sank, the potential volume of hazardous substances still on board, and the proximity to sensitive environments. There are most often also major uncertainties regarding specific wreck conditions. The probability of discharge of hazardous substances and their potential effects and consequences thus differ from one wreck to another. Decision support is needed, properly taking into account the risks and uncertainties, in order to make well-informed decisions concerning prioritization and efficient remediation measures for these potentially polluting shipwrecks.
Risk can be defined as severity combined with the probability of effects from a certain action (Suter, 2007). It is well-known that proper and well-structured routines for identifying, analyzing, and evaluating risks are essential for an efficient management of risks. The purpose of risk management is to provide decision support regarding future uncertain events (Burgman, 2005; Aven, 2012). The concept of risk management is used in a number of areas in society today and therefore a variety of frameworks describing the process exists (IEC, 1995; The Swedish Civil Contingencies Agency, 2003; AZ/NZS, 2004a,b; ISO, 2009). Risk management includes risk assessment where risk is identified, analyzed, and evaluated as well as treatment of risk (ISO, 2009). A number of risk assessment methods have been developed specifically for shipwrecks. Landquist et al. (2013) presents a review and comparison of the majority of these methods to, in the case of shipwrecks, relevant parts of the ISO standard for risk management (ISO, 2009). Two more methods have been described after the review by Landquist et al. (2013), Ventikos et al. (2013), and NOAA (2013) but we can nevertheless conclude that there are still no comprehensive methods for risk assessment and management of shipwrecks. Existing methods for risk assessment of shipwrecks fail to provide a holistic and, most importantly, probabilistic risk assessment of wrecks and thus do not provide the means for incorporating all uncertainties involved (SPREP and SOPAC, 2002; Idaas, 2005; Michel et al., 2005; Alcaro et al., 2007; Etkin et al., 2009; Louzis et al., 2009; NOAA, 2009, 2013; Ventikos et al., 2013). Landquist et al. (2013) found that none of the analyzed methods present a truly quantitative risk assessment and in most methods no uncertanity or sensitivity analyis was included. Risk evaluation was not fully developed in any of the approaches. Further examination of NOAA (2013) and Ventikos et al. (2013) not included in the review in Landquist et al. (2013) did to some extent include uncertainty analysis and NOAA (2013) also incorporates a quantitative method for consequence assessment. However, there is no aspect of probability estimation regarding a potential discharge. In summary, there is still no fully holistic risk assessment approach for potentially polluting shipwrecks.
Landquist et al. (2013) suggest a framework (Figure 1) for risk management of shipwrecks that encompasses all the important aspects of risk assessment. The link between risk management and decision-making is emphasized and the framework suggests a combined structure and generic description of risk management for shipwrecks in a decision-making context. It stresses the importance of risk assessment results for decision support and forms the basis for the development of VRAKA (short for shipwreck risk assessment in Swedish; Figure 2). The framework also emphasizes the importance of considering uncertainties.
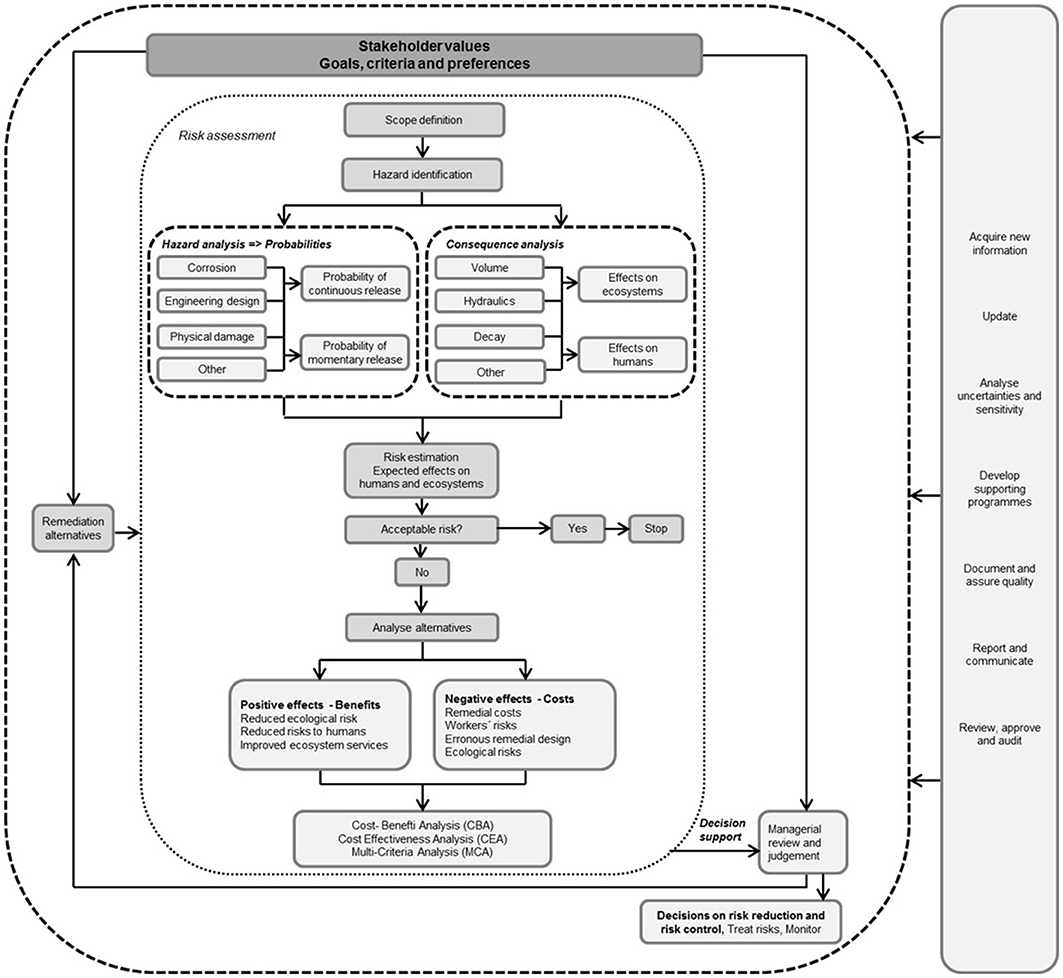
Figure 1. Generic risk management framework for shipwrecks.
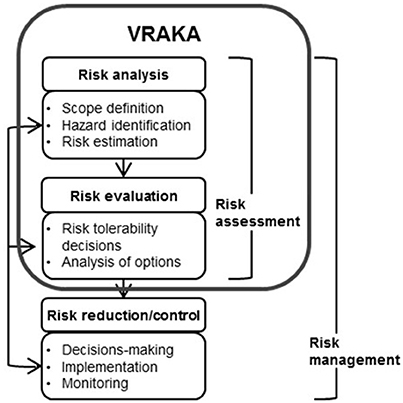
Figure 2. VRAKA in the risk management process.
VRAKA is a method for probabilistic risk assessment of shipwrecks and has been developed based on the framework in Landquist et al. (2013). The main focus of VRAKA is risk analysis and risk evaluation, which are not possible without thorough risk identification. The methods consists of three parts: (1) A tool for estimating the probability of discharge; (2) Approaches required for making a consequence assessment of such a discharge with a particular emphasis on Swedish and Baltic waters; (3) Risk evaluation. A draft structure for (1), with a basic Tier 1 consequence assessment approach, is presented in Hassellöv et al. (2015) and Landquist et al. (2015) and a more detailed description can be found in Landquist et al. (2014). The aim of the work presented here was to further develop (2) and present a holistic risk assessment method for potentially polluting shipwrecks by combining earlier research of a method for estimating probability of release (1) with a consequence assessment. The risk evaluation (3) is a future development and will thus not be commented on in detail in the present paper.
VRAKA—Probabilistic Risk Assessment of Shipwrecks
Within VRAKA it is possible to perform quantitative probabilistic risk assessment of shipwrecks and an uncertainty analysis of the results. The method comprises three parts: (1) A tool for estimating the probability of discharge of hazardous substances from a shipwreck; (2) Approaches for estimating the consequences of such a discharge; (3) Risk evaluation (Figure 3).
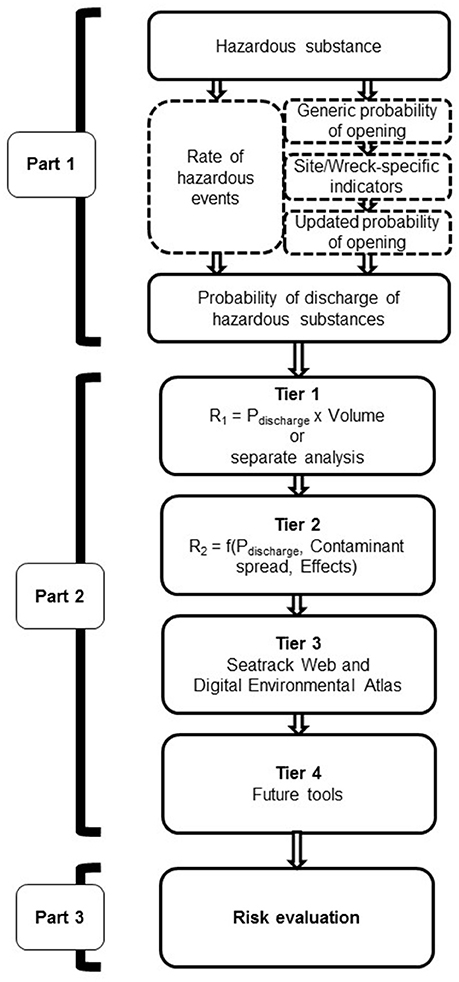
Figure 3. Schematic structure of VRAKA.
Part 1, the assessment of the probability of discharge is performed using fault tree analysis, thus facilitating quantification of the probability with regard to a set of identified hazardous activities and site-specific and wreck-specific properties. This approach enables a structured assessment to be made, providing transparent uncertainty and sensitivity analyses. The model also facilitates quantification of the uncertainties in the input data and results. This facilitates identification of the parameters that need to be investigated further to reduce the uncertainties in the risk calculations (Landquist et al., 2014, 2015; Hassellöv et al., 2015).
In Part 2, consequences can be assessed at three levels of ambition (tiers) based on available resources. In a Tier 1 assessment, the probability of discharge is combined with the expected volume still contained in the shipwreck to arrive at an annual expected amount of discharged substance. A Tier 2 assessment provides a consequence matrix in which proximity to shore and a proxy for shipwreck status are also included. In Tier 3, consequences are assessed based on the estimated discharge of oil from shipwrecks into the marine environment, the type of end-point receptors and the vulnerability of each receptor. This is done by modeling the contaminant load on specific end-point receptors using the Seatrack Web tool developed by the Swedish Meteorological and Hydrological Institute (SMHI, 2015) and maps of sensitivity to oil spills in the Swedish Digital Environmental Atlas (The County Administrative Board of Västra Götaland, 2015). The vulnerability is ranked further based on knowledge about the physical and biological characteristics of these features.
Methods
The following section provides an overview of the tools applied in VRAKA: fault tree analysis, the Digital Environmental Atlas and Seatrack Web.
Fault Tree Analysis
Fault tree analysis is a logic tree model applied to estimate the probability of the occurrence of an event. This estimate is based on the occurrence or non-occurrence of underlying intermediate and basic events. Figure 4 contains an example of a generic fault tree where four basic events define two intermediate events, which in turn define whether the top event will occur or not. The occurrence and non-occurrence of the events are expressed using Boolean algebra and the two types of gates used are the AND gate and the OR gate. The AND gate describes the outcome of an event if the input events occur simultaneously, while the OR gate describes the outcome if at least one input event occurs (Bedford and Cooke, 2001). The mathematical description is presented in Equations (1) and (2).
Parts of the information needed to perform a risk assessment using VRAKA are available or can be retrieved with reasonable effort. Other parts are obtained by expert elicitation and a Bayesian approach was applied to formally incorporate these different types of data into the model. The lack of information gave rise to the adoption of a probabilistic approach to facilitate relevant and transparent uncertainty analysis. Monte Carlo simulation was applied in order to incorporate the uncertainty of input variables into the model. This presents the possibility of applying input information as a distribution rather than a point value, implying that the result is estimated as a distribution that captures the uncertainty of the assessment (Bedford and Cooke, 2001).
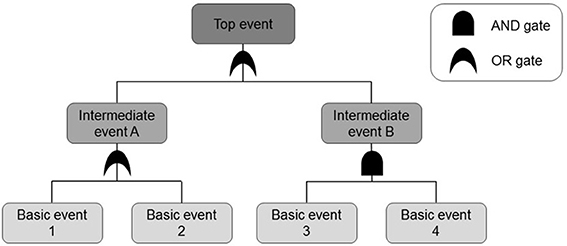
Figure 4. Example of generic fault tree with a top event dependent on basic events 1–4 and intermediate events A and B.
The Digital Environmental Atlas
The Digital Environmental Atlas (DEA) is a GIS-based map tool comprising information for areas along the Swedish coast that are particularly sensitive to oil discharge. The information is provided by the various Swedish county administrative boards and is administered by the Västra Götaland County Administrative Board. This online tool is in the public domain (The County Administrative Board of The County Administrative Board of Västra Götaland, 2015) and the shoreline is mapped according to physical characteristics (Kulander et al., 2010). The sensitivity estimations provided in the DEA to some extent take into account ecological aspects but are mainly based on the difficulty of remediating the specific shore type. The seafloor and water surface are ranked analogously by the authors.
Seatrack Web
Seatrack Web provides the possibility of modeling an oil spill trajectory in 3D based on a location and an amount of potential discharge. The models facilitate the modeling of the trajectory based on the weather for the dates chosen, which is in turn based on meteorological and hydrological data. It is possible to extract information about how much of the discharged substance is deposited on beaches, the seafloor and the water surface. The tool is used by some 80 organizations around the Baltic Sea, making it a powerful means for cooperating on the discharge of oil into the sea (SMHI, 2015). Seatrack Web is a web-based tool with maps within a user-friendly GIS interface. The tool is not in the public domain and permission must be sought from SMHI (2011).
Seatrack Web is founded on three main parts: forcing (forecasts of wind and flow fields), the oil drift model (Particle Dispersion Model, PADM), and a graphical user interface. The forcing fields are based on the weather and ocean forecasts at SMHI, i.e., High Resolution Local Area Modeling (HIRLAM) for weather models, and the High Resolution Operational Model for the Baltic (HIROMB) for ocean forecasts. Forcing fields covering longer periods are derived from the European Centre for Medium-Range Weather Forecasts. The PADM has been developed jointly by the Danish Maritime Administration and SMHI and the graphical user interface has been developed by SMHI. The main area covered is the Baltic Sea extending to Kattegat, Skagerrak and the North Sea up to around 3° east. For detailed information about the computational algorithms, see Liungman and Mattson (2011).
Part 1—Estimation of Probability of Discharge
In the first part of VRAKA the probability each year that an opening will occur in the shipwreck is combined with the probability that the wreck still contains hazardous substances. The result is a yearly probability of a discharge of hazardous substances into the marine environment. An opening in the wreck is assumed to occur due to certain activities and also depends on the status of the wreck, which is affected by wreck-specific and site-specific indicators, such as bottom water oxygen concentration and how the wreck is lying on the seafloor (Landquist et al., 2014, 2015; Hassellöv et al., 2015).
To acquire information regarding the extent to which certain activities (e.g., trawling, diving, and shipping traffic) might affect a wreck and how wreck-specific and site-specific indicators (e.g., water depth, water salinity, and age of the wreck) influence how harmful these activities are, expert elicitation took place in March 2015. Obtaining actual values for the probability of an opening in a wreck is difficult due to the significant uncertainties involved and the broad body of knowledge that is required. Consequently, over 20 experts with a wide range of expertise were brought together. The SHELF method (O'Hagan and Oakley, 2010) for elicitation of probabilities from expert judgment was used for the workshop. The results from the workshop provided estimations of the probability of an opening in a randomly selected wreck in the Swedish wreck population due to a number of activities and influencing indicators. The elicited probabilities are used as input data for the VRAKA tool.
The experts assigned a generic probability of an opening as a result of each of the identified activities and they provided estimates of how these probabilities are conditioned by different indicators. An assessor, i.e., a user of VRAKA, estimates site-specific and wreck-specific indicator values for the wreck in question and the generic probabilities are updated using a Bayesian approach (see e.g., Bedford and Cooke, 2001) with regard to the site-specific and wreck-specific information about indicators. The assessor also estimates the annual rate of hazardous activities. The probabilities and rates for each activity are combined in a logic tree model (fault tree; Figure 5). The assessments can, if preferred, be made as intervals rather than point values, allowing potential uncertainties regarding the absolute value of a model variable to be taken into account. This implies that results can be presented as probability distributions rather than point values, which means that the sensitivity of the end result to uncertainties in different input data can be assessed. This provides useful information about where to direct further studies in order to make a risk assessment with a higher degree of reliability.
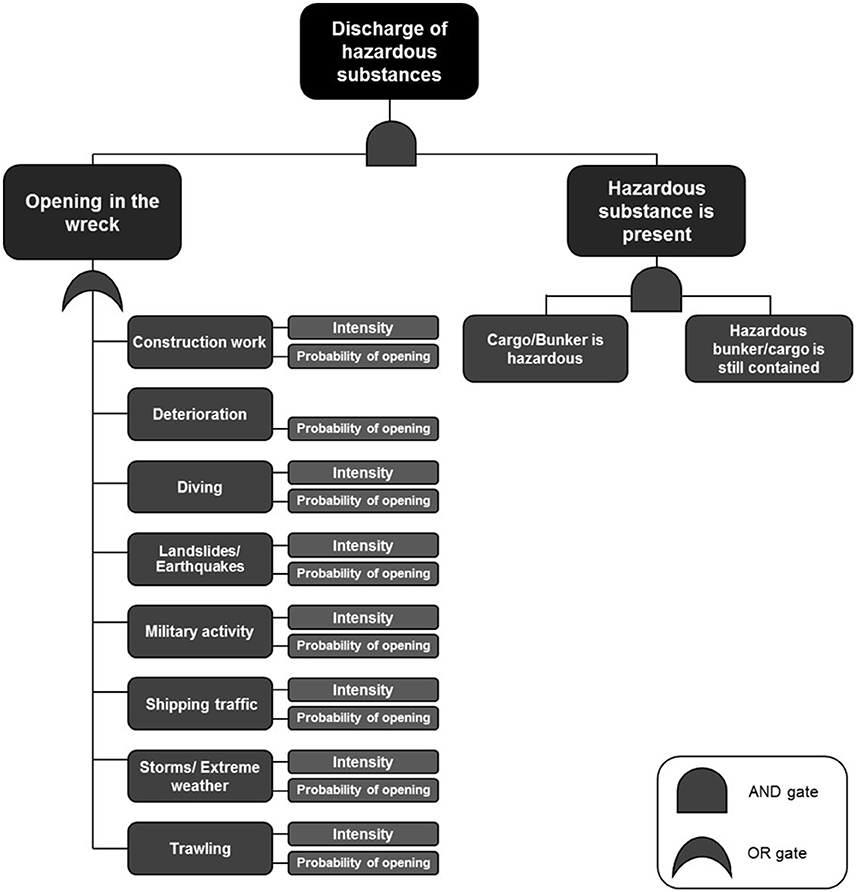
Figure 5. Fault tree adapted to VRAKA. The top event “Discharge of hazardous substance” is defined by the two underlying events “Opening in the wreck” and “Hazardous substance is present.” The latter is assumed to only occur if both “Cargo/Bunker is hazardous” and “Hazardous bunker/cargo is still contained.” “Opening in the wreck” is assumed to occur due to the fault tree-defined activities, which are in turn defined by a specific probability of causing an opening and how often these activities occur for the current wreck position.
In the fault tree in VRAKA, the top event is defined as the discharge of a hazardous substance, which is assumed to occur due to one or a number of underlying events. According to VRAKA, an opening must occur while there is still a hazardous substance in the wreck in order to cause the top event. The two events are combined by an AND gate. These underlying events are in turn defined by further events, shown in the fault tree in Figure 5, e.g., trawling, diving, and shipping traffic. For a more detailed description of the method used for estimating probability of discharge, see Landquist et al. (2014).
Part 2—Consequences Assessment and Risk Calculation
The second part of VRAKA—consequence assessment and risk calculation—presents the means for estimating the effects of the expected discharge in Part 1. The assessment can be performed in three tiers depending on the purpose of the assessment and available resources. The suggested means for consequence assessment in VRAKA are based mainly on available tools and methods.
Tier 1
In Tier 1, risk is expressed as a product of the probability of an opening in the wreck, the probability that hazardous substances are still contained in the wreck and the expected volumes of the hazardous substances that are still contained. The risk is then interpreted as an annual expected level of discharge (Equations 3, 4).
Where P is probability and V is volume. The estimated risk can be used to rank shipwrecks for e.g., mitigation measures.
Tier 2
A more detailed analysis of consequences may include simplified estimations of effects on potential receptors. The consequence is assessed according to a matrix where the amount of oil discharged is combined with the distance to shore and the sensitivity of the receptor (Table 1). The consequence is suggested to be high if at least two boxes are red, as moderate if at least two boxes are yellow or if each box displays a different color. Otherwise the consequence is low. The volume figures are retrieved from VRAKA Part 1. The probability of discharge of a hazardous substance and the consequence category (high, moderate, low) form the basis for a shipwreck comparison. The probability of discharge and the consequence estimation can be compared separately between wrecks or combined in order to rank the shipwrecks. A combination of the probability and consequences could be performed according to Figure 6. However, the assessor must decide what low, medium, and high probability corresponds to with regard to the consequence. The risk is high if either both or one of consequence and severity is moderate and so on.
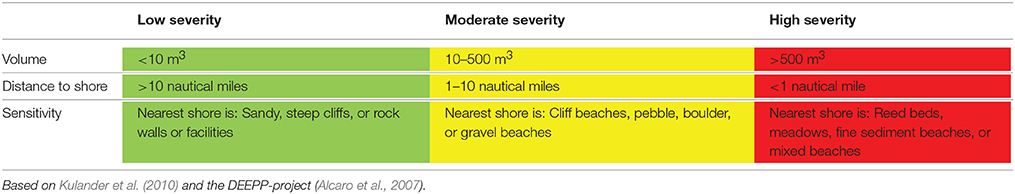
Table 1. Matrix for Tier 2 consequence assessment in VRAKA.
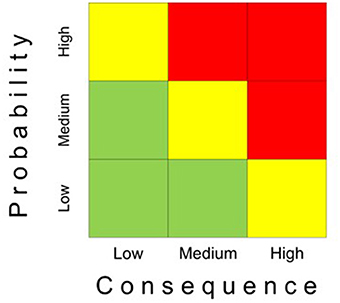
Figure 6. Schematic guide for quantitative risk estimation.
Tier 3
In Tier 3, an advanced oil spill trajectory modeling tool is combined with shore type sensitivity assessments in order to evaluate the effects on the marine environment (see Sections The Digital Environmental Atlas and Seatrack Web). Results from Seatrack Web provide an indication of where oil will reach the shore, the water surface or the seafloor. The sensitivity of shore types can be found in the DEA. Combining the results from modeling in Seatrack Web with the sensitivity mapping in the DEA provides an indication of the amount of oil that is expected to reach a specific receptor (Figure 7). The expected amount of oil reaching each shore type, water surface, or seafloor is combined with a ranking to estimate a consequence of discharge (Table 2 and Equation 5).
where Otot, total volume of oil (corrected for evaporated substance); Osf, percentage of the total volume of oil affecting the seafloor; Ows, percentage of the total volume of oil affecting the water surface; Osln, percentage of the total volume of oil affecting shoreline type n = 1…14; Vsf, vulnerability ranking for the seafloor; Vws, vulnerability ranking for the surface; Vsln, vulnerability ranking for the shoreline type n = 1…14.
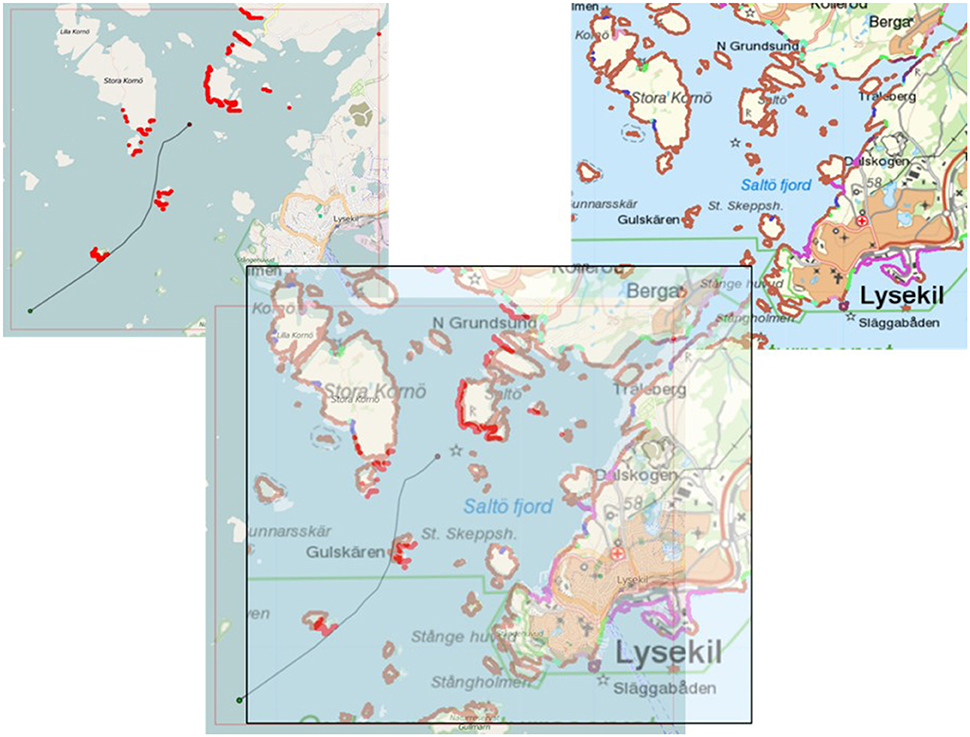
Figure 7. Principal sketch of how data from Seatrack Web and The Digital Environmental Atlas can be combined. Included is an example simulation from Seatrack Web, where the red indicates onshore oil. Examples taken from the Digital Environmental Atlas of shoreline classification in the Lysekil area in Sweden are also presented. Brown, rocky shore; dark purple, rocky shore and steep cliffs; purple, plants; pink, fine sediment beach; turquoise, gravel beach; dark blue, pebble shore; green, sandy beach.
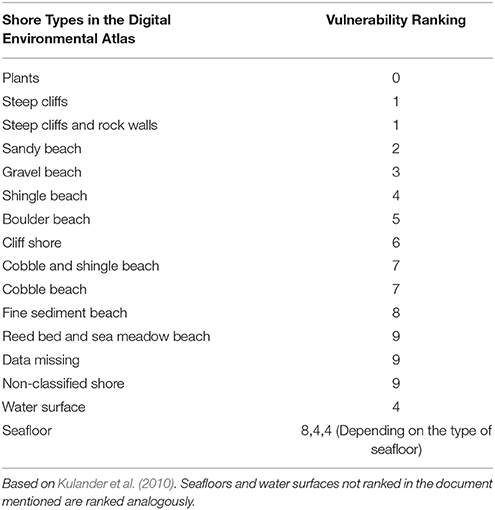
Table 2. Vulnerability ranking for shore types, water surface and seafloor.
The consequence [Cu] should be understood as the load in terms of volume and the vulnerability of the recipient to that load.
Part 1 of VRAKA provides an estimation of the probability of discharge, PD, i.e., the probability of an opening in the wreck multiplied by the probability that there is still a hazardous substance in the wreck. This probability, combined with the estimated probable volume of oil and the consequences as estimated above, can provide an estimate for a total yearly risk of discharge of hazardous substances from a shipwreck (Equation 6).
The risk should thus be interpreted as the expected consequence per year [Exp [Cu]] in terms of volume released and the vulnerability of the recipients exposed.
Example
An application of VRAKA to two hypothetical wrecks is presented to illustrate the use of the method. Any similarities to actual wrecks are unintentional. Consequence assessments in three tiers are described for the two wrecks.
Shipwreck 1
Wreck number 1 is located west of the island of Gotland, east of mainland Sweden. The wreck, which is estimated to contain between 300 and 500 m3 of bunker oil, sank 50 years ago and lies at a depth of around 26 m. Other input information for VRAKA regarding indicators, intensity of harmful activities, cargo, and uncertainty of estimations, is also included but is not presented here as the main focus of this work is the consequence assessment of a potential discharge.
Tier 1
Table 3 presents the results of the application of the VRAKA tool and a Tier 1 consequence assessment. The estimated probability of opening is set at 0.01, the probability of discharge is set at 0.01 and the expected amount of discharge of oil is set at 400 m3. The total annual risk estimate is thus 4 m3 of oil. Figure S1 shows the results for wreck number 1. The distribution of the expected probability of discharge is presented, which reveals skewness toward smaller values. The probability of opening per activity is shown, where deterioration is the single “activity” that contributes most to the total probability of opening. Shipping traffic and diving are the factors that contribute least to an opening in this specific wreck. Figure S1 also shows the probability distribution for the total expected volume.
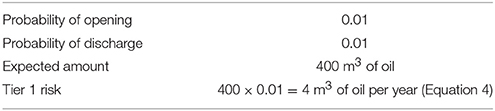
Table 3. Results of a Tier 1 consequence assessment for wreck number 1.
Tier 2
A Tier 2 consequence assessment is performed, see Table 1. The results are presented in Table S1 as text in red. Volume, distance to shore and sensitivity all show moderate severity, implying that the total severity is also moderate.
This moderate severity estimation, together with the probability of discharge taken from the VRAKA tool, form the basis for a Tier 2 risk estimation. The probability of discharge and the consequence estimation are either compared separately between wrecks or compared after combination performed based on Figure 5.
Tier 3
The Tier 3 consequence assessment is made in part by applying Seatrack Web for a release from the wreck at the sea floor and utilizing the Digital Environmental Atlas. Figures S2, S3 show the estimated oil spill trajectory and shore types affected by oil from wreck number 1. Table S2 contains a summary of these results.
The consequence is estimated (Equation 7) according to Equation (5) and is presented for each shore type in Figure 8. The estimated amount of oil per shore, water surface and seafloor is also presented in Figure 8 along with oil per shore type and where a sandy beach will receive the majority of the discharge. The Tier 3 risk is expressed in Equation (8) (based on Equation 6).
Shipwreck Number 2
Shipwreck number 2 is located off the west coast of Sweden outside the town of Kungshamn. The wreck, which is estimated to contain between 50 and 100 m3 of bunker oil, sank 80 years ago and lies at a depth of around 42 m. Other input information for VRAKA regarding indicators, intensity of harmful activities, cargo, and uncertainty of estimations, is also included but is not presented here as the main focus of this work is the consequence assessment of a potential discharge.
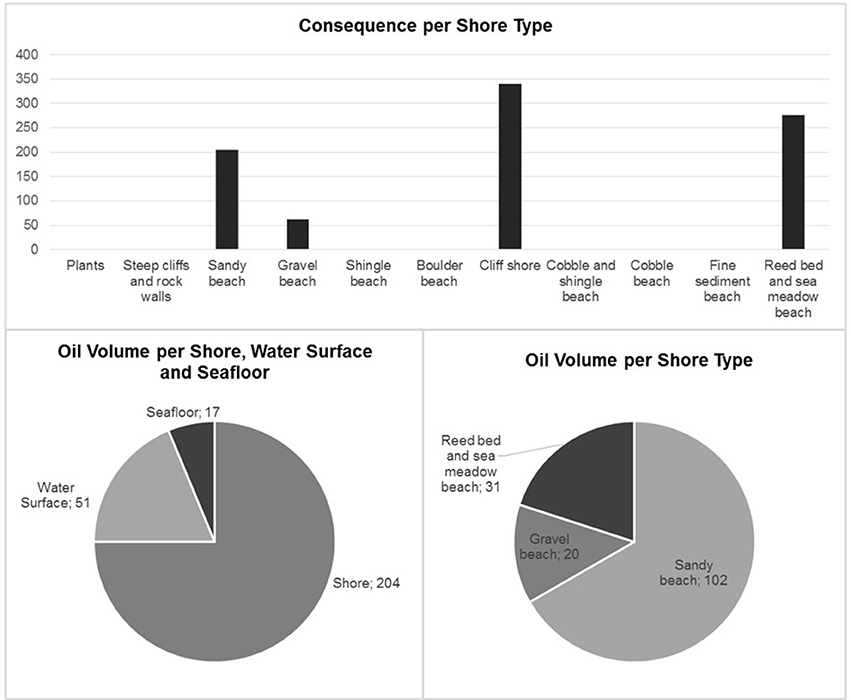
Figure 8. Consequence estimated per shore type. Estimated amount of oil per shore, water surface, and seafloor, amount of oil per shore type and estimated amount of oil per shore type.
Tier 1
Table 4 presents the results of the application of the VRAKA tool and a Tier 1 consequence assessment. The probability of opening is set at 0.12, the probability of discharge is set at 0.08 and the expected amount of oil discharge is set at 81 m3. The total annual risk estimate is 10 m3 of oil. Figure S4 shows the results for wreck number 2. The uncertainty distribution of the expected probability of discharge is presented, revealing heavy skewness toward smaller values. The probability of opening per activity is shown. Trawling contributes to the largest extent to the total probability of opening while shipping traffic and diving contribute the least. Figure S4 also shows the probability distribution for the total expected volume of a discharge.
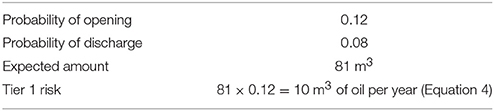
Table 4. Results of a Tier 1 consequence assessment for wreck number 2.
Tier 2
Shipwreck number 2 falls into the moderate severity category for volume, distance to shore, and sensitivity. The total severity is therefore estimated to be moderate (Table S3, estimates marked in red).
The consequence estimation of moderate severity, together with the probability of discharge taken from the VRAKA tool, form the basis for a Tier 2 risk estimation. Probability of discharge and the consequence estimate are either compared separately between wrecks or compared after combination performed based on Figure 5.
Tier 3
The Tier 3 assessment is based on oil spill trajectory modeling in Seatrack web for a release from the wreck at the sea floor and links the results to the sensitive shore types presented in the Digital Environmental Atlas. Figure S5 shows the estimated oil trajectory for wreck number 2 and Figure S6 shows the shore types in the vicinity of the wreck.
Table S4 summarizes the results from Seatrack Web and the Digital Environmental Atlas. A consequence assessment for wreck number 2 (Equation 9) is made according to Equation (5) and the Tier 3 Risk is expressed in Equation (10) (based on Equation 6).
Figure 9 presents the estimated consequences per shore type. Figure 9 also shows the amount of oil per shore, water surface and seafloor and the estimated amount per shore type, respectively. It is calculated that some oil (8 m3) will remain on the water surface while the remaining 57 m3 will be deposited on the cliff shore.
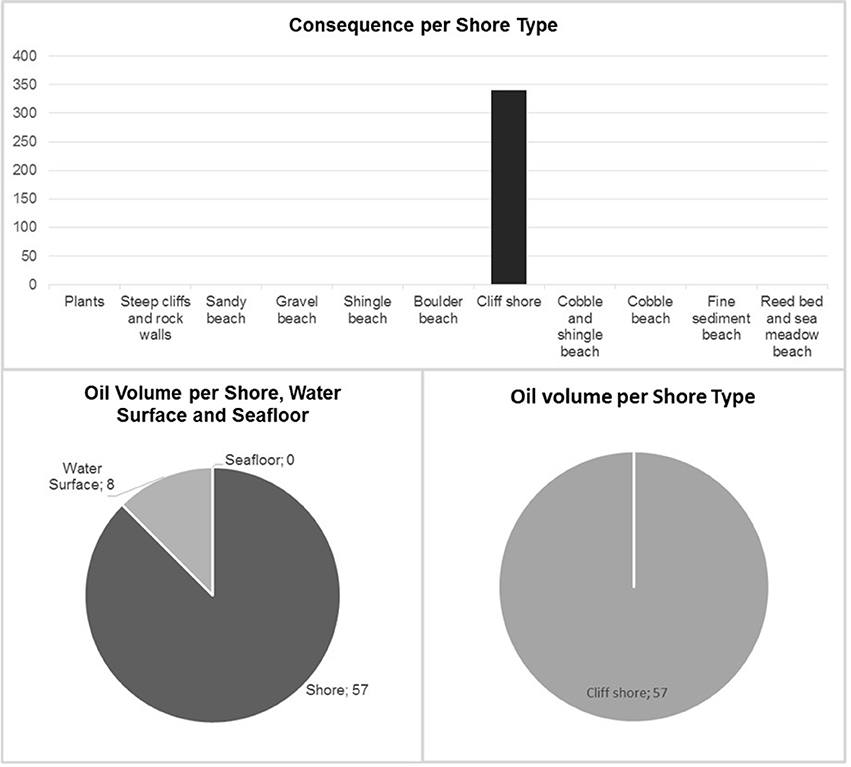
Figure 9. Estimated consequence per shore type, amount of oil per shore, water surface, and seafloor. Estimated amount of oil per shore type.
Concluding Remarks Regarding the Examples
Consequence estimations in three tiers have been performed for two hypothetical wrecks. The results obtained are presented in Table 5. Results can be interpreted in a number of ways. Tier 1 results can be interpreted as a probability of and possible amount of the discharge, either combined (Equation 2) or as separate information. In the case of Tier 2, such a combination can be performed based on Figure 6 and the probability of discharge and severity are compared between wrecks either combined or separately. Results from a Tier 3 assessment can again be analyzed as a risk by combining the probability of discharge and the estimated consequence (Equations 5, 6) or as the two results separately.
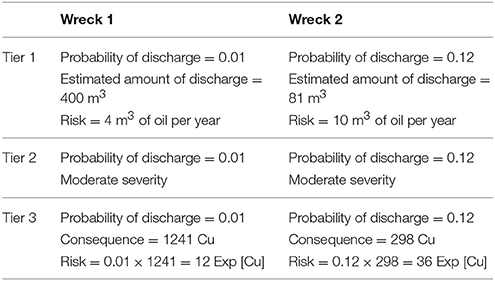
Table 5. Results of consequence assessments on three tiers for two hypothetical shipwrecks.
It can be concluded that wreck number 1 reveals a lower probability of discharge and a lower risk according to the Tier 1 assessment than wreck number 2. However, analyzing the results of the Tier 3 assessment of wreck number 1 shows a higher consequence than wreck number 2 but when the probability and consequence are analyzed together, a higher total risk for wreck number 2 is obtained. Different results are thus obtained by choosing to look at different factors in the consequence assessment.
The results are illustrated further in Figure 10. Wreck number 2 reveals a higher total risk according to a Tier 3 estimation whilst wreck number 1 reveals greater consequences.
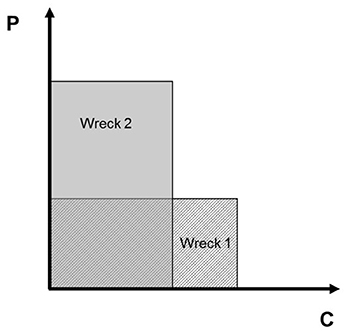
Figure 10. Illustration of the example results for Tier 3 where P is probability and C is consequence. The total risk for wreck number 2 is higher but the consequences for wreck number 1 are greater than for number 2.
Discussion
VRAKA is a holistic risk assessment method for potentially polluting wrecks based on well-established risk assessment methods. The yearly probability of the expected amount of discharge is estimated and uncertainties as well as consequences of a discharge are taken into account.
Results from VRAKA can provide important information when prioritizing mitigation measures for wrecks. The method facilitates efficient resource allocation for risk mitigation and it can also be used to evaluate the effects of risk mitigation measures. If, for example, trawling contributes significantly to the total risk, the effects of a ban or reduction in trawling in the wreck area can be easily modeled to estimate the risk reduction. A simple risk evaluation can also be performed with VRAKA by comparing the results to acceptable risk levels formulated by the responsible authority or actor. However, this third part of VRAKA could be further developed.
In the risk evaluation step, effects of mitigation measures could be evaluated using economic methods such as Cost Benefit Analysis or Multi Criteria Analysis, where social, environmental, and economic effects can be integrated into a sustainability assessment, see e.g., Rosén et al. (2015).
Probabilistic risk assessment of wrecks can provide well-informed input for decisions regarding risk mitigation measures and remediation. VRAKA is based on a quantitative probabilistic approach. It therefore has an advantage over previous methods in that uncertainties, which may be substantial in risk assessment of wrecks, can be modeled and taken into account fully in the risk assessment. The uncertainties refer to site-specific and wreck-specific information, estimated amounts of oil still contained and the probability of a discharge. VRAKA allows a global sensitivity analysis to be made, using Monte Carlo simulation, thus providing information on the uncertainties of the outcomes and guidance on what data collection should be prioritized in order to improve the reliability of the risk assessment. VRAKA also presents the assessor with an opportunity to perform the consequence assessment at a suitable level of detail or tier. This makes VRAKA adaptable to both preliminary studies as well as more elaborate assessment of the potential consequences of a discharge. However, there is still potential for further development.
The approach for making a consequence assessment is in three tiers as illustrated in the example (Section Example). The three tiered approach was developed to comply with the practical reality in real-world applications that there is simply varying economic and time resources, as well as different levels of ambition, for performing risk assessments of shipwrecks in different programs and at different involved responsible organizations and stakeholders. The method was developed to be possible to use under different conditions and levels of ambition and available resources. Tier 1 combines the probability of discharge derived in Part 1 of VRAKA with the expected volume of the discharge. In Tier 2, a matrix of sensitivity categories forms the basis for the consequence assessment and the results are combined with the probability of discharge. The total risk can be estimated qualitatively according to a guiding matrix. In Tier 3, an advanced tool for oil spill trajectory modeling is applied together with sensitivity mapping of the Swedish coast for the consequence assessment. The risk is calculated as the product of the consequence and the probability of discharge of a hazardous substance. The application on two hypothetical wrecks shows the importance of analyzing both the probability and consequence of a discharge, since e.g., wreck number 1 present a much larger consequence than wreck number 2 in Tier 3 while the actual risk is higher for wreck number 2.
Seatrack Web, which is suggested for oil spill trajectory modeling, can at the moment model oil spills in the near future or starting a few days in the past. It is thus not possible, for example, to obtain an estimation of the probability of certain receptors receiving hazardous substances over several seasons. However, SMHI is about to release an update of Seatrack Web that will make it possible to produce a probability map describing where hazardous substances can be distributed over a longer period of time. The outcome would provide a better picture of possible effects and more accurate information about the consequence assessment.
Seatrack Web and the Digital Environmental Atlas are both GIS-based software. This implies that separate layers can be created for wreck location and associated information, such as results from the oil trajectory modeling and the vulnerability of the shoreline, water surface and seafloor. This calculation of the amounts of oil that could possibly reach the different types of receptor provides an efficient tool for risk estimation of wrecks. Furthermore, it provides the potential to estimate high risk areas, where a number of wrecks which collectively could result in an elevated risk.
It is important to include environmental, economic, and socioeconomic consequences fully in a holistic risk assessment. The Swedish coast is ranked according to its sensitivity to oil spills, based essentially on the difficulty of remediating. Some weight is also attached to ecological sensitivity although the main basis for the ranking is the remediation potential. Socioeconomic effects are not included. In VRAKA, environmental effects on organisms in water and in sediment are included in the ranking which was not the case initially. The sensitivity of these two potential receptors has therefore also been ranked by the authors according to the criteria in Kulander et al. (2010). However, there is a lack of means to estimate the economic and socioeconomic consequences for receptors and further development should be carried out to incorporate ecological sensitivity and the economic and socioeconomic effects in more detail into VRAKA.
VRAKA can now be applied to estimate the probability of a larger single discharge and the resulting consequences. However, since ecotoxicological effects of small and frequent discharges of oil into the marine environment have been shown to have an effect (Lindgren, 2015), it is desirable to also include this type of discharge.
VRAKA is a method used to estimate the probability and consequences of a discharge of hazardous substances. Explosives and other munitions are not included in the assessment but should nevertheless be considered when making a holistic risk assessment, not least for potential remediation and the safety of the operating personnel.
The present version of VRAKA has been developed for Sweden and the Baltic Sea. Although tiers 1 and 2 can be applied throughout the Baltic Sea, Tier 3 is only applicable in full in Sweden. Whilst Seatrack Web can be used throughout the entire Baltic basin, the Digital Environmental Atlas has only been developed for Sweden. However, a preliminary study is being prepared by the Swedish Civil Contingencies Agency to investigate the potential for sensitivity mapping in the Baltic Sea, which in the long term could be applied for uniform risk assessment of wrecks in the whole of the Baltic.
The assessment examples provided here serve as good examples of possible results from a risk estimation of actual wrecks. These examples also show that results obtained from risk estimation only act as input for deciding on prioritization and possible mitigation measures and are not the final answer. A decision needs to be taken regarding which results can be used for such an analysis and subsequently which part of the results should be given the highest priority. The examples also show how uncertainties are incorporated into the model by presenting results as probability distributions rather than point values.
VRAKA can provide decision support for risk mitigation related to potentially polluting wrecks. The risk posed by an individual wreck can be compared to another wreck and a group of adjacent wrecks can be compared to another group as VRAKA is a method for comparing risk levels and ranking wrecks rather than estimating an absolute risk for a single wreck. Decision support of this nature facilitates effective resource allocation. VRAKA is based on models that depict reality but which are, of course, not reality. A model is never better than the underlying theories and input data. The results from VRAKA, or any risk assessment method or tool, should therefore be considered as one piece of information among others for the final decision.
VRAKA has been developed for potentially polluting shipwrecks. Further development for application to dumped munitions and/or adaptation of the tool to handle hazardous substances other than oil is a possible future way forward.
Other possible developments include further means for consequence assessment. VRAKA provides a fully probabilistic estimation of the probability of discharge and a semi-quantitative, three-tiered consequence assessment, allowing for different levels of input depending on the purpose of the assessment and available resources. Combining the probabilistic estimation of discharge in VRAKA with, for example, the SIMAP tool (McCay et al., 2004), which would provide probabilistic estimates of consequences, would offer a fully probabilistic risk assessment tool for potentially polluting shipwrecks.
Conclusions
The main conclusions of this study are:
• A novel method for probabilistic risk assessment of wrecks has been developed. The method is known as VRAKA and takes into account the probability of discharge and the potential consequences of such a discharge.
• VRAKA can provide decision support for remediation of potentially polluting wrecks and facilitates effective resource allocation for environmental problems of this nature.
• A three-tiered approach for consequence assessment is presented:
◦ Tier 1 suggests a combination of the probability of discharge and the expected amount of hazardous substances still contained.
◦ Tier 2 provides a matrix of
severity, the results of which are combined with the probability of discharge.
◦ Tier 3 is an advanced tool for oil spill trajectory modeling and is applied in combination with sensitivity mapping of the Swedish coast.
• When the suggested oil spill trajectory model provides a possibility of producing probability maps showing where oil might be deposited, it is suggested that the present version applied in VRAKA is replaced.
• The suggested approaches for consequence assessment are based primarily on a sensitivity assessment of the difficulty of performing remediation. A holistic method for risk assessment of wrecks should include all the ecological, social, and economic consequences.
• VRAKA can be applied to large, single discharges. A desired development of VRAKA would be to also include the possibility of handling small, frequent discharges.
• VRAKA is a risk assessment method for wrecks. The main focus so far has been on risk estimation. Further work is needed to fully develop the risk evaluation step.
Author Contributions
HL is a Ph.D. student in the project working full time. She has contributed with underlying work and writing. LR has contributed with underlying work and writing. AL has contributed with underlying work and writing. IH is the project leader and contributed with underlying work and writing.
Funding
This work was funded by The Swedish Maritime Administration (1399-14-01942-6 and 1399-14-01942-15) and by EU Bonus Project, SWERA.
Conflict of Interest Statement
The authors declare that the research was conducted in the absence of any commercial or financial relationships that could be construed as a potential conflict of interest.
Acknowledgments
This research was funded and carried out within the EU BONUS programme through the SWERA project and in Miljörisker Sjunkna vrak II (Environmental Risks Posed by Sunken Wrecks II), The Swedish Maritime Administration. The research has also been funded by The Swedish Research Council FORMAS, project no 2008-1510. The authors would also like to acknowledge all the experts who were involved in producing input for VRAKA. Special thanks to Associate Professor Jenny Norrman at the Department of Civil and Environmental Engineering, and Dr. Fredrik Lindgren at the Department of Shipping and Marine Technology, both at Chalmers University of Technology, for acting as facilitators at the expert elicitation workshop. Thank you also to Tomas Petterson at SMHI for providing support and for discussing future applications for the Seatrack Web tool.
Supplementary Material
The Supplementary Material for this article can be found online at: https://www.frontiersin.org/article/10.3389/fenvs.2016.00049
References
Alcaro, L., Amato, E., Cabioch, F., Farchi, C., and Gouriou, V. (2007). DEEPP Project, DEvelopment of European Guidelines for Potentially Polluting Shipwrecks. ICRAM, Instituto Centrale per la Ricerca scientifica e tecnologica Applicata al Mare, CEDRE, CEntre de Documentation de Recherché et d'Epérimentations sur les pollutions accidentelles des eaux.
AZ/NZS (2004a). Handbook: Risk Management Guidelines - Companion to AS/NZS 4360:2004. Sydney, NSW; Wellington: Standards Australia/Standards New Zealand.
AZ/NZS (2004b). Risk Management AS/NZS 4360:2004. Sydney, NSW; Wellington: Standards Australia/New Zealand.
Bedford, T., and Cooke, R. (2001). Probabilistic Risk Analysis: Foundations and Methods. Cambridge, UK: Cambridge University Press.
Burgman, M. (2005). Risk and Decisions for Conservation and Environmental Management. New York, NY: Cambridge University Press.
Etkin, D., Van Rooij, H., and French-McCay, D. (2009). Risk Assessment Modeling Approach for the Prioritization of Oil Removal Operations from Sunken Wrecks. Effects of oil on wildlife. Tallin: Interspill.
Hassellöv, I. M., Olsson, U., Ekberg, G., Östin, A., Simonsson, F., Larsson, C., et al. (2015). Miljörisker sjunkna vrak II. Sjöfartsverket.
Idaas, K. (2005). “Norwegian Pollution control authority work on shipwreck,” in 2005 International Oil Spill Conference, IOSC 2005 (Miami Beach, FL).
IEC (1995). Dependability Management - Part 3: Application Guide - Section 9: Risk Analysis of Technological Systems. Geneva: International Electrotechnical Commission.
ISO (2009). Risk Management - Principles and Guidelines, ISO 31000:2009(E). Geneva: International Organization for Standardization.
Kulander, K. E., Ericsson, M., Tegenack, A., Fejes, J., and Evans, S. (2010). Saneringsmanual för Olja På Svenska Stränder. Karlstad: Swedish Civil Contingencies Agency.
Landquist, H., Hassellöv, I. M., Rosén, L., Lindgren, J. F., and Dahllöf, I. (2013). Evaluating the needs of risk assessment methods of potentially polluting shipwrecks. J. Environ. Manage. 119, 85–92. doi: 10.1016/j.jenvman.2012.12.036
Landquist, H., Rosén, L., Lindhe, A., Norberg, T., Hassellöv, I. M., Lindgren, J. F., et al. (2014). A fault tree model to assess probability of contaminant discharge from shipwrecks. Mar. Pollut. Bull. 88, 239–248. doi: 10.1016/j.marpolbul.2014.08.037
Larsson, B.-Å., Ekberg, G., Söderberg, M., and Jesäter, M. (2011). Miljörisker Från Fartygsvrak. The Swedish Maritime Administration.
Lindgren, J. F. (2015). Evaluating Effects of Low Concentrations of Oil in Marine Benthic Communities. Göteborg: Chalmers University of Technology.
Liungman, O., and Mattson, J. (2011). Scientific Documentation of Seatrack Web; Physical Processes, Algorithms and References. Norrköping: SMHI.
Louzis, K., Koimtzoglou, A., and Ventikos, N. P. (2009). “The Risk of Wrecks or the Wreck of Risk? The Greek Paradigm,” in 2nd International Conference on Risk Analysis and Crisis Reponse (Beijing).
McCay, D. F., Rowe, J. J., Whittier, N., Sankaranarayanan, S., and Etkin, D. S. (2004). Estimation of potential impacts and natural resource damages of oil. J. Hazard. Mater. 107, 11–25. doi: 10.1016/j.jhazmat.2003.11.013
Michel, J., Gilbert, T., Waldron, J., Blocksidge, C. T., Schmidt Etkin, D., and Urban, R. (2005). “Potentially polluting wrecks in marine waters,” in International Oil Spill Conference (Miami Beach, FL).
NOAA (2009). Wreck Oil Removal Program (WORP) 2009 Demonstration Project Overview. Silver Spring, MD: National Oceanic and Athmospheric Administration.
NOAA (2013). Risk Assessment for Potentially Polluting Wrecks in U.S. Waters. Silver Spring, MD: National Oceanic and Atmospheric Administration.
O'Hagan, A., and Oakley, J. F. (2010). The Sheffield Elicitation Framework (SHELF, v2.0). An “Off the Shelf” Package for Eliciting Probability Distributions. Department of Probability and Statistics. The University of Sheffield, UK.
Rosén, L., Back, P. E., Söderqvist, T., Norrman, J., Brinkhoff, P., Norberg, T., et al. (2015). SCORE: a novel multi-criteria decision analysis approach to assessing the sustainability of contaminated land remediation. Sci. Total Environ. 511, 621–638. doi: 10.1016/j.scitotenv.2014.12.058
SMHI (2011). Seatrack Web. The Swedish Meteorological and Hydrological Institute. Available online at: https://stw.smhi.se/ (Accessed 24 February, 2016).
SMHI (2015). Seatrack web - Spridningsprognoser för Oljeutsläpp och Andra Föroreningar. The Swedish Meteorological and Hydrological Institute. Available online at: http://www.smhi.se/professionella-tjanster/professionella-tjanster/sakerhet-och-beredskap/seatrack-web-spridningsprognoser-for-oljeutslapp-och-andra-fororeningar-1.1646 (Accessed 29th February, 2016).
SPREP SOPAC (2002). “A regional strategy to address marine pollution from world war II wrecks,” in 13th SPREP Meeting (Majuro: The Pacific Ocean Pollution Prevention Programme, PACPOL).
Suter, G. W. (2007). Ecological Risk Assessment. Boca Raton, FL: CRC Press; Taylor and Francis Group.
The County Administrative Board of Västra Götaland (2015). Digital Miljöatlas. Available online at: http://www.lansstyrelsen.se/vastragotaland/Sv/manniska-och-samhalle/krisberedskap/skydd-mot-olyckor/Pages/digital-miljoatals.aspx (Accessed 30 October, 2015).
The Swedish Civil Contingencies Agency (2003). Handbook of Risk Analysis (In Swedish: Handbok Riskanalys). Karlstad: The Swedish Civil Contingencies Agency formerly the Swedish Rescue Authority.
Keywords: risk assessment, shipwreck, oil, environmental consequence, decision support, VRAKA
Citation: Landquist H, Rosén L, Lindhe A and Hassellöv I-M (2016) VRAKA—A Probabilistic Risk Assessment Method for Potentially Polluting Shipwrecks. Front. Environ. Sci. 4:49. doi: 10.3389/fenvs.2016.00049
Received: 27 January 2016; Accepted: 30 June 2016;
Published: 22 July 2016.
Edited by:
Naser A. Anjum, University of Aveiro, PortugalReviewed by:
David Valença Dantas, Universidade do Estado de Santa Catarina, BrazilNikolaos P. Ventikos, National Technical University of Athens, Greece
Copyright © 2016 Landquist, Rosén, Lindhe and Hassellöv. This is an open-access article distributed under the terms of the Creative Commons Attribution License (CC BY). The use, distribution or reproduction in other forums is permitted, provided the original author(s) or licensor are credited and that the original publication in this journal is cited, in accordance with accepted academic practice. No use, distribution or reproduction is permitted which does not comply with these terms.
*Correspondence: Hanna Landquist, hanna.landquist@chalmers.se
Lars Rosén, lars.rosen@chalmers.se