Identifying Biological Pathway Interrupting Toxins Using Multi-Tree Ensembles
 Gergo Barta
- Data Mining Group, Data and Content Technologies Laboratory, Department of Telecommunications and Media Informatics, Budapest University of Technology and Economics, Budapest, Hungary
The pharmaceutical industry constantly seeks new ways to improve current methods that scientists use to evaluate environmental chemicals and develop new medicines. Various automated steps are involved in the process as testing hundreds of thousands of chemicals manually would be infeasible. Our research effort and the Toxicology in the Twenty First Century Data Challenge focused on cost-effective automation of toxicological testing, a chemical substance screening process looking for possible toxic effects caused by interrupting biological pathways. The computational models we propose in this paper successfully combine various publicly available substance fingerprinting tools with advanced machine learning techniques. In our paper, we explore the significance and utility of assorted feature selection methods as the structural analyzers generate a plethora of features for each substance. Machine learning models were carefully selected and evaluated based on their capability to cope with the high-dimensional high-variety data with multi-tree ensemble methods coming out on top. Techniques like Random forests and Extra trees combine numerous simple tree models and proved to produce reliable predictions on toxic activity while being nearly non-parametric and insensitive to dimensionality extremes. The Tox21 Data Challenge contest offered a great platform to compare a wide range of solutions in a controlled and orderly manner. The results clearly demonstrate that the generic approach presented in this paper is comparable to advanced deep learning and domain-specific solutions. Even surpassing the competition in some nuclear receptor signaling and stress pathway assays and achieving an accuracy of up to 94 percent.
1. Introduction
Traditional toxicity testing protocols using animal experiment-based models have many drawbacks; they are expensive, time-consuming (Shukla et al., 2010) and might raise ethical or reliability concerns. The urgent need to involve alternative methods in chemical risk assessment drove the National Research Council (NRC) in the U.S. to project a new vision and strategy for the increased use of in vitro technologies in toxicity screening studies (Krewski et al., 2010). European measures soon followed as the European Chemical Agency (ECHA) issued similar guidelines. These guidelines promoted quick and cost effective computational methods and described the role of animal testing as the last resort. Over the years, this lead to the development and wide-scale implementation of high-throughput screening (HTS) techniques. A process that is capable of screening thousands of compounds using a quick and standardized protocol, furthermore, it may be combined with robotic methods (Malo et al., 2006).
The popularity of HTS opened up chemical toxicity research to machine learning and the big data era. The need of novel techniques in data handling, data transformation, and data mining sparked substantial research efforts throughout the years. This new emerging trend brought about the convergence of toxicity screening protocols and conventional graphical data mining tools (e.g., RapidMiner1, KNIME2) or popular scripting languages in data science (R3, Python4). With various modules, libraries, and extensions available to read, transform and analyze HTS assay data, it really comes down to a choice of preference.
Over the years, Random forests (Svetnik et al., 2003), projection pursuit, partial least squares and Support vector machines (Si et al., 2007) have been applied successfully to the Quantitative Structure-Activity Relationship (QSAR) task. Each of these methods has different advantages and disadvantages (see Liu and Long, 2009 for a detailed review). Judson et al. (2008) also carried out an extensive review of conventional machine learning methods applied in HTS; methods included Nearest neighbors, Nave Bayes, Regression trees, Support vector machines, Artificial neural networks. The comparison showed that most models provide comparable performance when suitable data preparation is carried out. The authors identified careful feature selection as the most crucial step in preparing the data. Furthermore, Dahl et al. successfully applied multi-task neural networks to exploit task inter-dependencies (Dahl et al., 2014).
The usage of Random forests in HTS applications was first suggested by Svetnik et al. (2003). Svetnik et al. demonstrated superior performance compared to other methods at the time and described additional useful features of the proposed method. The main strengths were identified as high classification performance, aggressive regularization to capture sparsity and useful services such as built-in performance assessment and feature importance.
The following document describes in detail team Dmlab's approach to solving the Tox21 Data Challenge5. The challenge offered a compound toxicity screening classification problem on two panels [Nuclear Receptor Signaling (NR) and Stress Response (SR)] and 12 different assays: Androgen Receptor (AR, AR-LBD), Aryl Hydrocarbon Receptor (AhR), Estrogen Receptor (ER, ER-LBD), Aromatase Inhibitors (aromatase), Peroxisome Proliferator-activated receptor gamma (ppar-gamma), Antioxidant Response Element (ARE), luciferase-tagged ATAD5 (ATAD5), Heat Shock Response (HSE), Mitochondrial Membrane Potential (MMP), and Agonists Of The P53 Signaling Pathway (P53). For further details on the competition, see Huang et al. (2016).
Our general approach was to utilize the vast machine learning features offered by Python's scikit-learn library6 and prepare the dataset for analysis by combining data manipulating tools (RapidMiner and KNIME) with domain specific structure analyzers in order to provide high-accuracy toxicity screening.
This article contains three major sections:
1. Materials and Methods shows the underlying models in detail with references, introduces the software used, provides data description, and basic statistics. The second part of this section describes how the substance screening framework works and how to reproduce contest results.
2. Results contains the thorough evaluation of the proposed methods in the competition context
3. Conclusions and discussions are provided in the last section with an indication of future research directions.
2. Materials and Methods
The Tox21 Data Challenge portal contains helpful guidance and a multitude of materials to start working on the problem. The challenge organizers even generously provided a simple benchmark solution to kickstart the process, comparison of the benchmark and team Dmlab's approach can be found in Table 1. While the Naïve Bayes classifier utilized in the benchmark is a good initial approach, it falls behind when it comes to parameter tuning options and accuracy in general. Finding a more suitable classifier was chief among the goals of this competition. The same goes for replacing the lower level components of the stack; using the same inputs as other challengers gives no edge in a competitive environment.
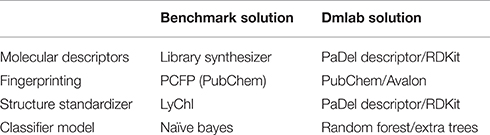
Table 1. Building the solution stack.
The flow chart in Figure 1 gives a high-level overview of the solution process and the techniques combined. The process involves 3 major steps: data preparation, modeling, and post-processing. The data preparation step includes deriving descriptors from structural information, transforming the data to suit modeling purposes and finalizing the set of descriptors to be used. Modeling involves model selection, parameter tuning and generating predictions. The post-processing step covers the optimal threshold selection and application process to generate toxicity decisions.
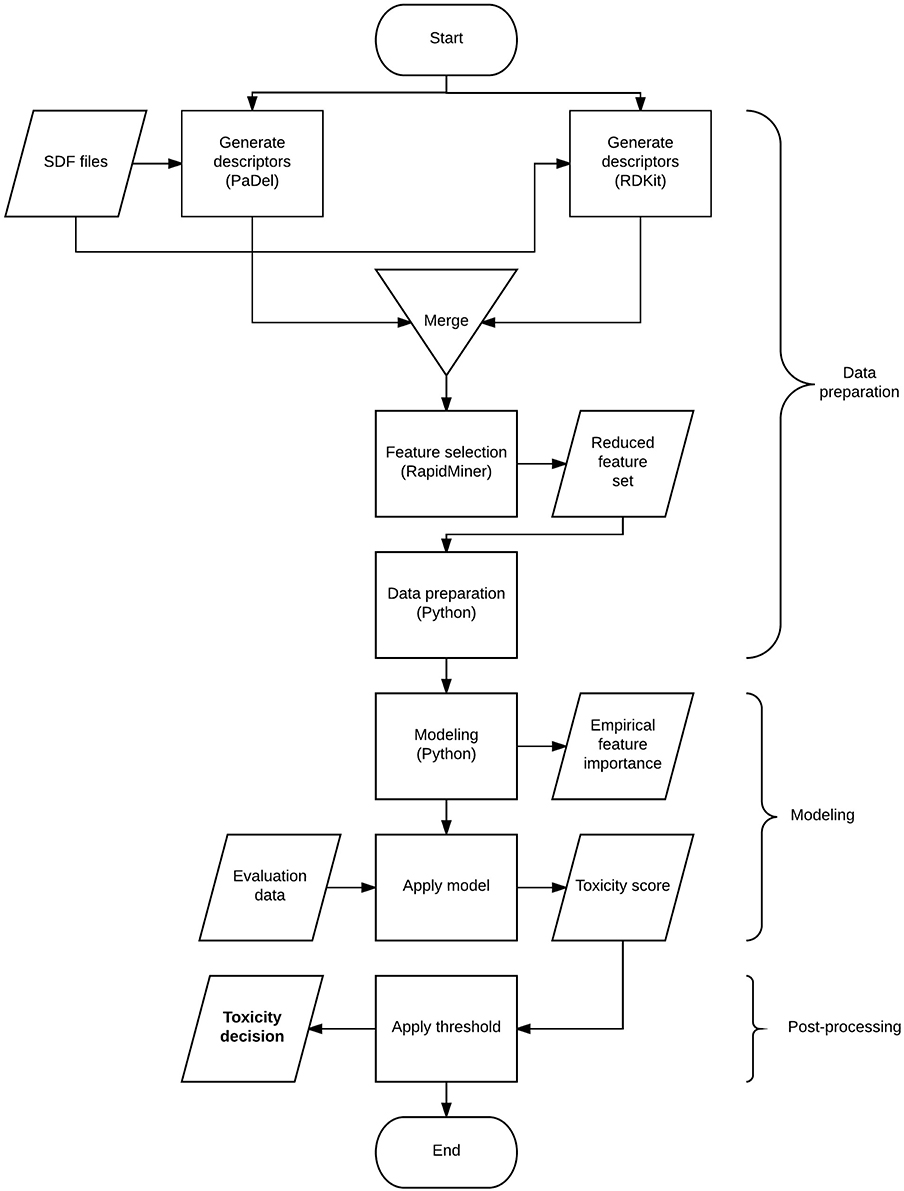
Figure 1. Detailed overview of the proposed solution.
2.1. Data Description
The Tox21 Data Challenge provided a dataset with the structural information of 11,737 distinct molecules. The different assays contained results for between 7143 and 9068 of the molecules. The respective activity flag was used as the target variable of analysis for each individual track.
While challenge tracks are intended to be independent a quick correlation and clustering analysis shows signs of positive correlation between track activities in various cases (see Figure 2). Notably, the closest relationship is between NR-AR, NR-ER and their LBD counterparts. Surprisingly enough, NR and SR assays mix in the two other clusters, one containing AhR, Aromatase, ARE, and MMP, while the other includes the remaining assays; PPAR-gamma, ATAD5, HSE, and p53. Correlation coefficients hint at possible inter-track information gain that could be harnessed to achieve better classifier performance, but no such action was taken during the challenge. A promising direction for future research.
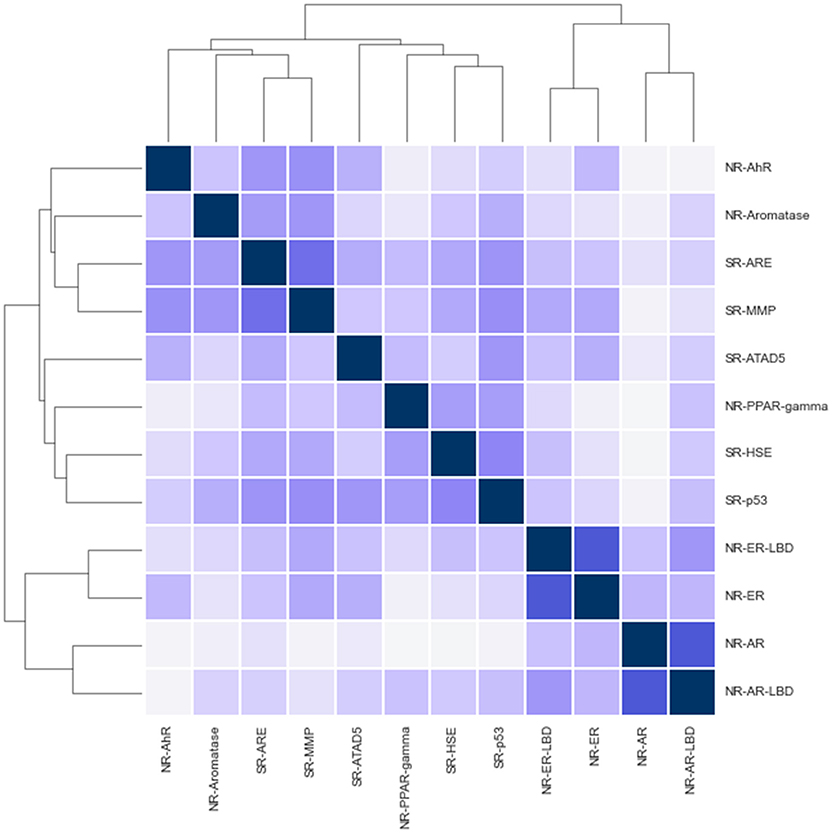
Figure 2. Correlation and potential clustering of challenge tracks.
2.1.1. Generating Descriptors
At the beginning of the analysis, the structural information of the molecules in the training and test set has to be processed to generate descriptive attributes for data analysis. During the challenge, our team used 2 different versatile tools to generate the descriptive attributes; PaDel Descriptor and RDKit cheminformatics toolkit. Other tools, like the CDK Descriptor Calculator7, were also experimented with but failed to generate conclusive results.
2.1.2. PaDel Descriptor
PaDel Descriptor8 was developed by the Pharmaceutical Data Exploration Laboratory at the National University of Singapore. The tool has the capabilities to generate 1-dimensional, 2-dimensional structural information and many fingerprints as seen in Yap (2011), and also operates in a multi-core fashion to reduce computational times. It also acts as a structure standardizer; removes salts, detects aromaticity, and standardizes nitro groups. As a result, 1444 2-dimensional attributes were extracted from the structures. 3-dimensional descriptors were also experienced with, but failed to be generated for many molecules, and ultimately were discarded from the analysis.
In addition, the tool also offers 12 different fingerprint versions; CDK fingerprint, CDK extended fingerprint, Estate fingerprint, CDK graph only fingerprint, MACCS fingerprint, PubChem fingerprint, Substructure fingerprint, Substructure fingerprint count, Klekota-Roth fingerprint, Klekota-Roth fingerprint count, 2D atom pairs, and 2D atom pairs count. Out of those the PubChem Substructure Fingerprint (see Bolton et al., 2008) was selected based on its empirical performance widespread use, which is also the default fingerprinting method in the PaDel Descriptor. It is a 2-dimensional chemical structure fingerprint that consists of an 881-dimension binary vector. Each bit represents a boolean determination of the absence or presence of a specific structural element as can be seen in the PubChem Substructure Fingerprint manual9.
2.1.3. RDKit Cheminformatics Toolkit
RDKit, an open source toolkit for cheminformatics10, was also utilized in the descriptor generating process. There are many wrappers available to work with the tool in different environments; our team chose the KNIME extension, which inherently works with SDF and SMILES files (see Figure 3).
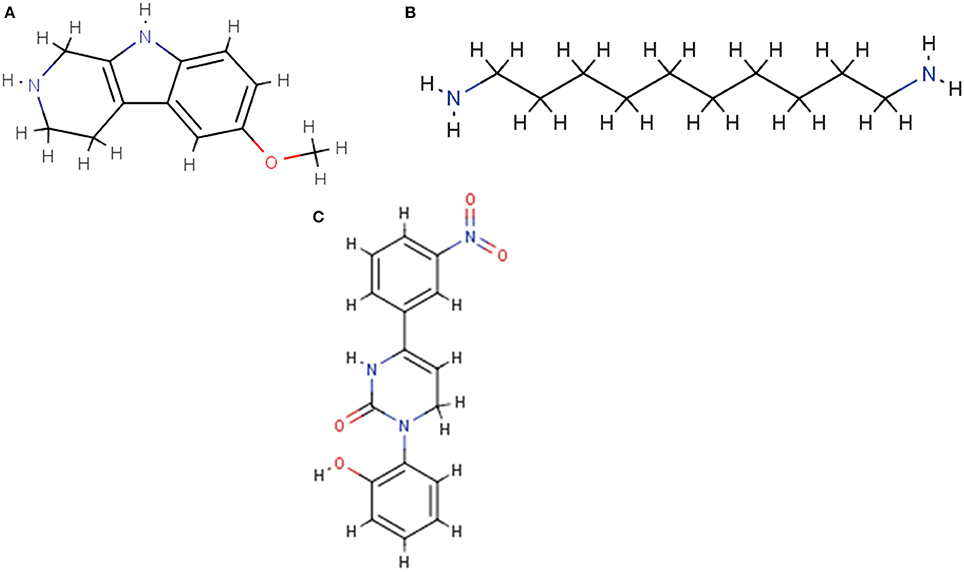
Figure 3. Sample molecule structures displayed by the RDKit cheminformatics toolkit. (A) NCGC00260687. (B) NCGC00261143. (C) NCGC00261111.
Descriptive attributes were generated by the descriptor calculation feature. In addition Gasteiger charges were also calculated by the calculate charges feature, see Gasteiger and Marsili (1980) for details. The toolkit also offers 8 distinct fingerprints to be generated; Morgan, FeatMorgan, AtomPair, Torsion, RDKit, Avalon, Layered, and MACCS. Empirical results showed the Avalon fingerprint11 as the most promising, and was selected as the final fingerprinting option to work with.
Similarly to the PaDel scenario, salts were removed at the beginning of the process using the salt stripper feature. In the end, 117 descriptors, 118 charges, and 1024 fingerprint flags were extracted as new features.
2.2. Data Preparation
The resulting dataset used in data analysis combines two main sources. PaDel descriptor provides 2-dimensional features and the PubChem fingerprint, while RDKit adds its respective structural descriptors along with the Avalon fingerprint.
The whole dataset contains 3418 attributes; this means a relatively wide data table that makes feature selection a top priority. The many descriptors represent a high dimensional sparsely inhabited feature space. Cautious measures have to be taken as this kind of classification problem is particularly prone to overfitting.
Additionally, some of these attributes overlap, as different sources provide the same functionality. First, correlated attributes were removed to avoid the effect of multicollinearity as suggested by Chong and Jun (2005). In this step, attributes were filtered where a pairwise correlation was above 0.95. Other attributes were deemed useless and removed, based on their low variance (below 0.1) or high ratio of missing values (above 10%). Note, this step removes many of the Gasteiger charges.
Literature review underlined the importance of feature selection in QSAR protocols. To carry out careful filtering of the feature space, the functionality of conventional methods were combined in a novel way. RapidMiner, a reliable data analysis software, offers various feature selection operators (Schowe, 2011), and also comes with a powerful extension12 to further extend options. In this attempt, 5 basic feature selector operators were combined to generate a versatile ranking of individual attributes, thus creating a flexible attribute filtering scheme. The basic operators include calculating feature relevance by computing the value of correlation with respect to the target attribute, based on the information gain ratio, based on the Gini impurity index, by measuring the symmetrical uncertainty with respect to the class, and according to how well their values distinguish between the instances of the same and different classes that are near each other.
Summing the aforementioned ranks represents the universal scoring for the given input variable provided by a committee of experts, thus creating a more reliable ranking. Using the universal scoring, 681 features were selected for further analysis, meaning depending on the assay the analytical base table contained roughly 10–13 times more observations than features, a data table size much less prone to overfitting. Further details on the final set of descriptors and most important input features for all 3 winning tracks are provided in the Supplementary Materials.
Many of the structural descriptor features contain missing values; we decided that attributes with excessive missing values are to be entirely removed. Some molecule structures are prone to fail to generate descriptors in PaDel and/or RDKit, and thus missing values are generated. Classification models implemented in Python do not handle missing values well, so all rows in the training set including such values were removed entirely. On the validation sets (test set and final evaluation set), where dropping a molecule was no option, such values were imputed with a fixed 0 value, which in the case of fingerprints, represents the absence of a specific pattern and is considered a safe option.
2.3. Random Forests and Extra Trees
The Random forest is perhaps the best-known of ensemble methods, thus it combines simple models called base learners for increased performance. In this case, multiple tree models are used to creating a forest as introduced by Breiman> (2001).
There are three key factors of forest creation:
1. bootstrapping the dataset
2. growing unpruned trees
3. limiting the candidate features at each split
These steps ensure that reasonably different trees are grown in each turn of iteration, which is key to the effective model combination.
The bootstrapping step of the model creation carries out a random sampling of a dataset with N observations with a replacement that results in N rows, but only ca. 63% of the data used as stated in (1) (Efron and Tibshirani, 1993). The probability that an observation x does not get into the sample S equals
Pruning the trees would reduce variance between trees and thus considered inessential as the overfitting of individual trees is balanced anyway by the ensemble.
When growing trees a different set of features is proposed as candidates in finding the best split based on information criteria like Gini or entropy. The subset of features is selected randomly further increasing the variance between trees.
The output of the trees is then combined by averaging the results based on some weights or by performing a majority vote in the case of classification problems.
Random forests have very few vital parameters to tune, they are effectively non-parametric. The unique architecture provides many benefits and is widely recognized as a good initial approach to most problems. Unlike decision trees, the ensemble method's averaging property inherently finds a balance between high variance and bias. It is insensitive to many data related issues such as the large number and heterogeneity of features, outliers, missing data, and even an unbalanced target. Other than being a great out-of-the-box tool it offers various useful services. Random forest gives an intrinsic evaluation of the results based on the data discarded by bootstrapping (called out-of-bag error), it also gives estimates what variables are important.
Extra Trees is a slightly different Random forest variant suggested by Pierre Geurts, Damien Ernst and Louis Wehenkel in the article “Extremely randomized trees” in 2006 (Geurts et al., 2006). The extreme randomization comes from the fact that the variable splitting in each node is no longer based on finding the best split, but done in a completely random manner. This causes the trees grown to be even less data dependent, thus introducing extra variance between them.
2.4. K-Fold Cross-Validation
Cross-validation is the primary method of model evaluation. In this technique, multiple models are trained using the same tuning parameters and subsequently tested on a different subset of data. The results are more reliable than performing the simple holdout method that could be misleading when a not-so-fortunate split is used.
During cross-validation the data is partitioned into K disjoint subsamples; typical K values lie between 5 and 10. Model training is then carried out using K-1 folds and testing on the last fold, as seen in Figure 4. The process is performed until all the folds have been used for testing and the cross-validation error equals
where Ei is the error measured at each iteration. A 3-fold cross-validation scheme was used in the evaluation phase to ensure honest performance assessment. In general, local cross-validation scores were close to the leaderboard but slightly overestimated accuracy in some cases. K-fold cross-validation also ensured that the modeling has been executed using all data.
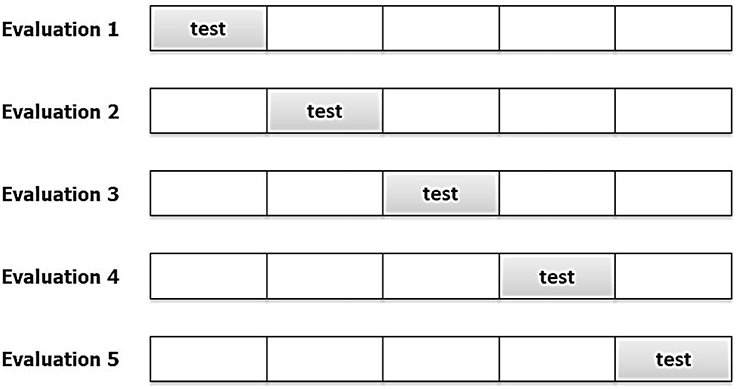
Figure 4. Illustrative example of 5-fold cross-validation.
3. Results
3.1. Model Implementation and Evaluation
The distribution of the target variable for all assays is highly skewed (target event between 3 and 16%). This causes difficulties for conventional modeling methods when it comes to predicting target values. Model alternatives were preselected based on their ability to handle the characteristics of the specific classification problem; having highly imbalanced target and a high dimensional feature space. Out of the many modeling methods Python's scikit-learn provides, the following were tested thoroughly:
1. Random Forest Classifier
2. Extra Trees Classifier
3. Gradient Boosting Classifier
4. Support Vector Classifier
Results clearly showed that neither Gradient boosting classifier (GBC) nor Support vector classifier (SVC) was able to handle target imbalance properly. Literature suggests balancing of target (Zakharov et al., 2014), which takes either substantial modification of the original method (Chen et al., 2004) or re-sampling of the whole dataset (Zhang et al., 2013). None of these advanced approaches was pursued in depth, as the random forest class was able to deliver convincing results in most cases without any further transformation needed. GBR and SVC approaches were subsequently discarded.
All models were evaluated using the K-fold cross-validation paradigm, using 3 folds to perform honest performance assessment. As the number of observations compared to the number of features is relatively low, this represents a crucial step in involving all observations in both the training and the testing phase. Model parameters were tuned using the grid search method; a combination of cross-validation and an exhaustive search in parameter space. Results were evaluated based on the area under the receiver operating characteristics curve score (ROC-AUC) as designated by the challenge organizers. Table 2 shows the parameter settings that were tested.
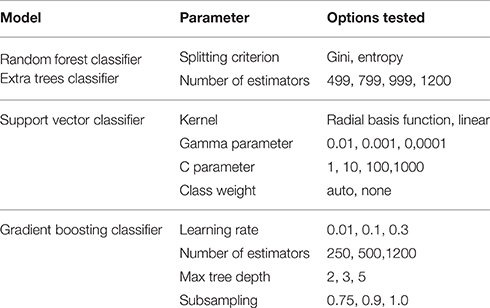
Table 2. Searching the parameter space.
The final evaluation models were trained on the combined training and testing dataset to encapsulate all the information available.
Table 3 shows the parameter settings found optimal for each track along with leaderboard and final evaluation performance. All solutions were ranked based on the challenge criteria: ROC-AUC, but balanced accuracy scores are also provided. As a sole exception, modeling for the SR-ARE assay was carried out completely in RapidMiner using Support vector classifier and is not discussed in this article. Any parameters not mentioned in Table 3 were set to their respective default values (see the scikit-learn documentation for details). Although a wide spectrum of models was experimented with, all optimal solutions came from the Random forest class of models with very similar parameter settings, meaning this approach proved to be a relatively robust that worked well on all assays. The only real difference is the number of estimators employed, that varies in a broader spectrum from 499 to 999 depending on the assay. Performance discrepancy between leaderboard and final evaluation was also minimal, 4.73 ± 0.04 percent for NR and 4.62 ± 0.05 percent for SR panel.
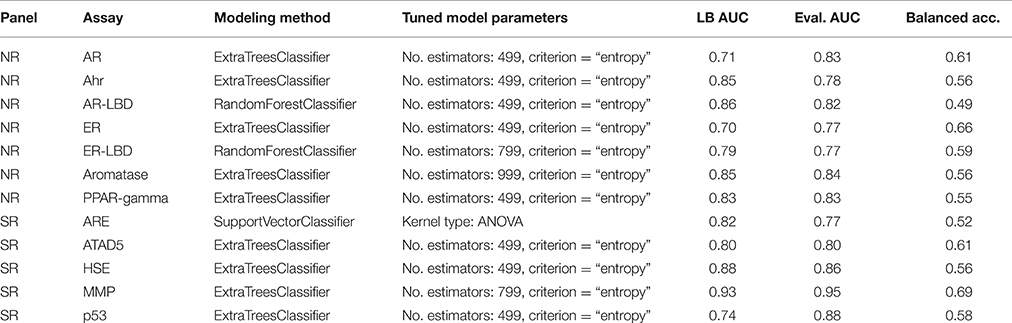
Table 3. Comparison of leaderboard and final performance on all assays.
Besides successfully avoiding overfitting and working reliably on all assays, the solution stack discussed in this paper also provides useful insights into variable importance, a feature crucial to the deeper understanding of complex problems like toxicity screening. Figure 6 shows empirical feature importance assessment for the assay SR-P53, and underlines the significance of specific patterns to this problem, such as conventional bond orders and the presence of particular ring patterns. Further details on the most important input features for all 3 winning tracks are provided in the Supplementary Materials.
3.2. Post-Processing the Results
As part of the final evaluation task, molecule activity decisions had to be submitted instead of simple activity probabilities. As seen previously, the distribution of the target variable for all assays is highly skewed. This made cutting at the conventional 0.5 probability threshold impractical. The output of each model was further tuned to better represent the expected distribution of the target using a flexible cutoff point. Figure 7 contains details of the process; do note the logarithmic scale on the figure. The optimal cutoff point per assay was calculated to closely resemble the target distribution observed on the training set published by the organizers. A strong assumption was made that evaluation and training data was sampled in a nearly stratified manner. The optimized cutoff point used in each assay can be found in Table 4.
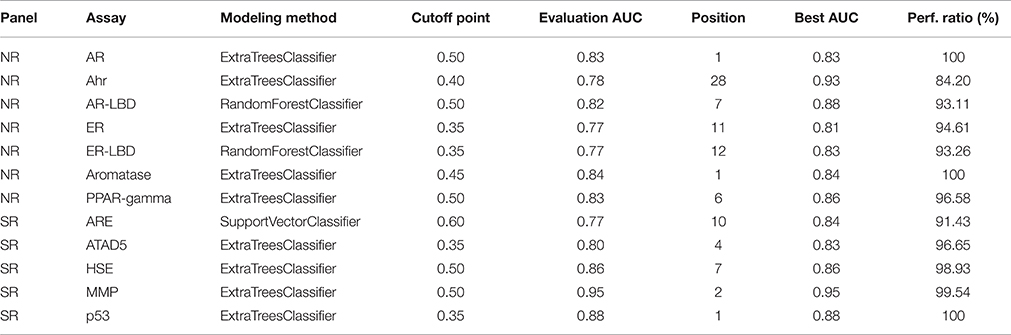
Table 4. Performance comparison of final solution and winning solution on all assays.
4. Discussion
The Tox21 Data Challenge offered a novel way of mass chemical assay classification. Much of our team's efforts were focused on developing accurate predictions with the help of well-established domain specific descriptors and finding the right approach to feature selection. Modeling was carried out using the cutting edge of open source data science tools available. This approach was highly capable of capturing toxicity driving factors while also avoiding overfitting on the training data. In the competition context, the proposed solution achieved a winning position in 3 of the Tox21 Data Challenge 2014 tracks and delivered highly comparable results on the rest.
The solution's robustness and competitiveness are proven through empirical results. The model evaluation shows empirical evidence that Random forest class predictors suit the particular classification problem well. When built on carefully preselected features they offer extremely high performance in the chemical assay classification domain. Model performance, however, greatly depends on the feature set used and the cutoff threshold applied; the proposed approach for both issues worked convincingly in 11 out of the 12 challenge tracks. The Random forest method is found to be insensitive to most modeling parameters; the number of estimators has a slight effect on performance, but overfitting is rarely an issue.
When compared to other challenger's solutions the Random forest stack offers convincing performance with 3 assay wins and 6 more places among the top 10. Figure 5 shows the graphical representation of the winning solution performances. Even when the achieved ranking is not so prominent, ROC-AUC scores show a promising performance ratio compared to the assay winning solutions proving the approach's versatility (see Table 4). Average performance ratios were found to be 94.54 ± 4.99 percent for NR and 97.31 ± 3.16 percent for SR panel. Figure 8 offers additional graphical comparison of performance ratios on selected assays SR-ATAD5 (96.65%), SR-MMP (99.54%), and SR-HSE (98.93%) respectively.
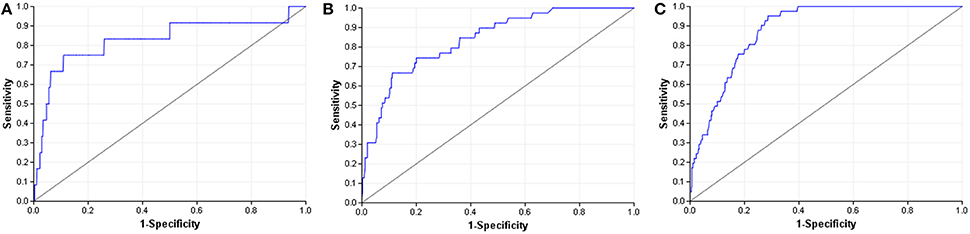
Figure 5. ROC curves of the winning models. (A) NR-AR. (B) NR-Aromatase. (C) SR-P53.
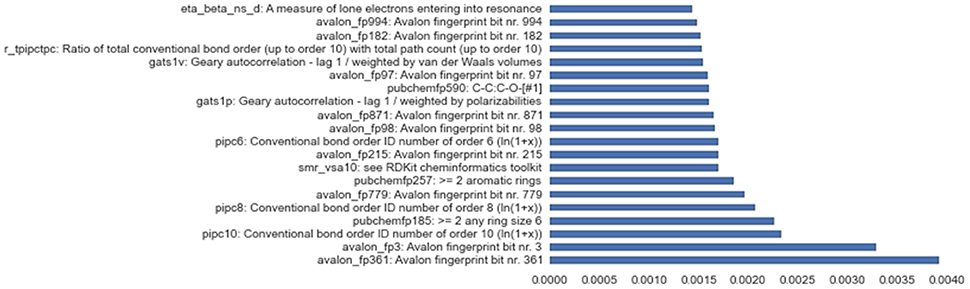
Figure 6. Top 20 empirical feature importance assessment on assay SR-P53.
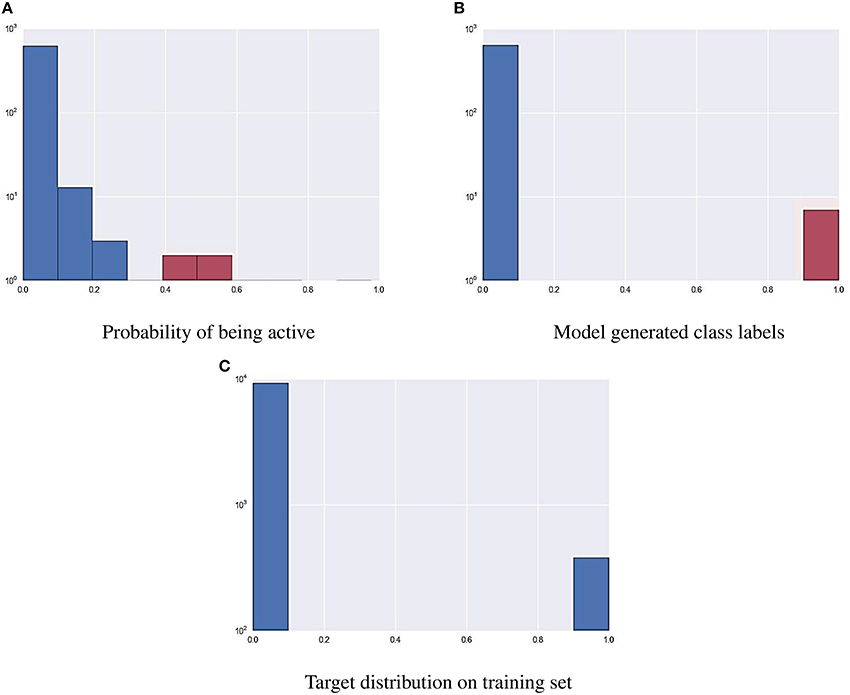
Figure 7. Using a cutoff threshold on assay NR-AR to transform probabilistic predictions (A) to actual activity (B) that resembles training distribution (C).
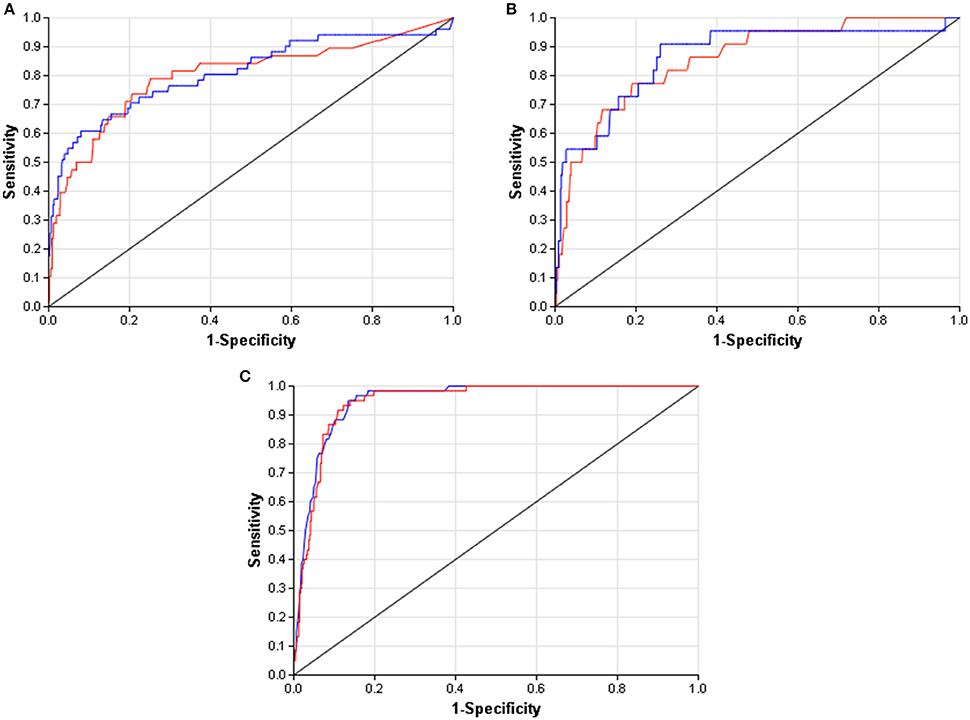
Figure 8. ROC curves of best models (blue) and selected Dmlab models ranked 2–10th (red). (A) SR-ATAD5. (B) SR-MMP. (C) SR-HSE.
All computations were carried out on a quad core PC with Intel Core i5 CPU @ 3.20 GHz processor and 16 GB of RAM. Depending on the assay, single thread model building on the full dataset took between 28.3 and 42.2 s. Random Forests also possess the capability for multi-thread execution; using scikit-learn's parallelization feature reduces model building time between 9.6 and 13.7 s. Model application is generally quick; predictions are generated within seconds regardless of the data size.
In summary, the article provides a detailed description of the solution stack used to develop high accuracy QSAR models. This approach was able to achieve the highest accuracy in 3 different tracks of Tox21 Data Challenge. This accurate modeling approach also provides useful services, such as intrinsic feature importance that gives immediate feedback and further facilitates understanding the proposed toxicology screening method. The methodology used in the competition may be applied in other problems in cheminformatics as well. Furthermore, winning models are made publicly available for comparison and further research.
Author Contributions
The author confirms being the sole contributor of this work and approved it for publication.
Conflict of Interest Statement
The author declares that the research was conducted in the absence of any commercial or financial relationships that could be construed as a potential conflict of interest.
Acknowledgments
The author would like to thank the reviewers for their valuable comments and various suggestions to improve the quality of the paper.
Supplementary Material
The Supplementary Material for this article can be found online at: https://www.frontiersin.org/article/10.3389/fenvs.2016.00052
To ensure reproducibility, all processes, scripts, configurations and miscellaneous supplementary materials for this article are publish online at https://github.com/themrbarti/tox21-challenge-publication.
Footnotes
1. ^https://rapidminer.com/products/studio/
3. ^https://www.r-project.org/
5. ^https://tripod.nih.gov/tox21/challenge/
7. ^http://www.rguha.net/code/java/cdkdesc.html
8. ^http://www.yapcwsoft.com/dd/padeldescriptor/
9. ^ftp://ftp.ncbi.nlm.nih.gov/pubchem/specifications/pubchem_fingerprints.txt
References
Bolton, E. E., Wang, Y., Thiessen, P. A., and Bryant, S. H. (2008). Pubchem: integrated platform of small molecules and biological activities. Ann. Rep. Comput. Chem. 4, 217–241. doi: 10.1016/S1574-1400(08)00012-1
Chen, C., Liaw, A., and Breiman, L. (2004). Using Random Forest to Learn Imbalanced Data. Berkeley, CA: University of California.
Chong, I.-G., and Jun, C.-H. (2005). Performance of some variable selection methods when multicollinearity is present. Chem. Intell. Lab. Syst. 78, 103–112. doi: 10.1016/j.chemolab.2004.12.011
Dahl, G. E., Jaitly, N., and Salakhutdinov, R. (2014). Multi-task neural networks for qsar predictions. arXiv preprint arXiv:1406.1231.
Efron, B., and Tibshirani, R. (1993). An Introduction to the Bootstrap. New York, NY: Chapman & Hall.
Gasteiger, J., and Marsili, M. (1980). Iterative partial equalization of orbital electronegativity-a rapid access to atomic charges. Tetrahedron 36, 3219–3228. doi: 10.1016/0040-4020(80)80168-2
Geurts, P., Ernst, D., and Wehenkel, L. (2006). Extremely randomized trees. Mach. Learn. 63, 3–42. doi: 10.1007/s10994-006-6226-1
Huang, R., Xia, M., Nguyen, D.-T., Zhao, T., Sakamuru, S., Zhao, J., et al. (2016). Tox21 Challenge to build predictive models of nuclear receptor and stress response pathways as mediated by exposure to environmental chemicals and drugs. Front. Environ. Sci. 3:85. doi: 10.3389/fenvs.2015.00085
Judson, R., Elloumi, F., Setzer, R. W., Li, Z., and Shah, I. (2008). A comparison of machine learning algorithms for chemical toxicity classification using a simulated multi-scale data model. BMC Bioinformatics 9:241. doi: 10.1186/1471-2105-9-241
Krewski, D., Acosta, D. Jr. Andersen, M., Anderson, H., Bailar III, J. C., Boekelheide, K., et al. (2010). Toxicity testing in the 21st century: a vision and a strategy. J. Toxicol. Environ. Health B 13, 51–138. doi: 10.1080/10937404.2010.483176
Liu, P., and Long, W. (2009). Current mathematical methods used in qsar/qspr studies. Int. J. Mol. Sci. 10:1978. doi: 10.3390/ijms10051978
Malo, N., Hanley, J. A., Cerquozzi, S., Pelletier, J., and Nadon, R. (2006). Statistical practice in high-throughput screening data analysis. Nat. Biotechnol. 24, 167–175. doi: 10.1038/nbt1186
Schowe, B. (2011). “Feature selection for high-dimensional data with rapidminer,” in Proceedings of the 2nd RapidMiner Community Meeting And Conference (RCOMM 2011), Aachen.
Shukla, S. J., Huang, R., Austin, C. P., and Xia, M. (2010). The future of toxicity testing: a focus on in vitro methods using a quantitative high-throughput screening platform. Drug Discov. Today 15, 997–1007. doi: 10.1016/j.drudis.2010.07.007
Si, H., Wang, T., Zhang, K., Duan, Y.-B., Yuan, S., Fu, A., et al. (2007). Quantitative structure activity relationship model for predicting the depletion percentage of skin allergic chemical substances of glutathione. Anal. Chim. Acta 591, 255–264. doi: 10.1016/j.aca.2007.03.070
Svetnik, V., Liaw, A., Tong, C., Culberson, J. C., Sheridan, R. P., and Feuston, B. P. (2003). Random forest: a classification and regression tool for compound classification and qsar modeling. J. Chem. Inform. Comput. Sci. 43, 1947–1958. doi: 10.1021/ci034160g
Yap, C. W. (2011). Padel-descriptor: an open source software to calculate molecular descriptors and fingerprints. J. Comput. Chem. 32, 1466–1474. doi: 10.1002/jcc.21707
Zakharov, A. V., Peach, M. L., Sitzmann, M., and Nicklaus, M. C. (2014). Qsar modeling of imbalanced high-throughput screening data in pubchem. J. Chem. Inform. Model. 54, 705–712. doi: 10.1021/ci400737s
Keywords: Classification, random forest, toxicity, Tox21, challenge, competition
Citation: Barta G (2016) Identifying Biological Pathway Interrupting Toxins Using Multi-Tree Ensembles. Front. Environ. Sci. 4:52. doi: 10.3389/fenvs.2016.00052
Received: 22 March 2016; Accepted: 29 July 2016;
Published: 15 August 2016.
Edited by:
Ruili Huang, National Center for Advancing Translational Sciences (NIH), USAReviewed by:
Luis Gomez, University of Las Palmas de Gran Canaria, SpainMohamed Diwan M. AbdulHameed, Department of Defense Biotechnology High Performance Computing Software Applications Institute, USA
Copyright © 2016 Barta. This is an open-access article distributed under the terms of the Creative Commons Attribution License (CC BY). The use, distribution or reproduction in other forums is permitted, provided the original author(s) or licensor are credited and that the original publication in this journal is cited, in accordance with accepted academic practice. No use, distribution or reproduction is permitted which does not comply with these terms.
*Correspondence: Gergo Barta, barta@tmit.bme.hu