Deciphering behavioral changes in animal movement with a “multiple change point algorithm- classification tree” framework
 Bénédicte Madon
 Yves Hingrat
- RENECO Wildlife Consultants LLC, Abu Dhabi, UAE
The recent development of tracking tools has improved our nascent knowledge on animal movement. Because of model complexity, unrealistic a priori hypotheses and heavy computational resources, behavioral changes along an animal path are still often assessed visually. A new avenue has recently been opened with change point algorithms because tracking data can be organized as time series with potential periodic change points segregating the movement in segments of different statistical properties. So far this approach was restricted to single change point detection and we propose a straightforward analytical framework based on a recent multiple change point algorithm: the PELT algorithm, a dynamic programming pruning search method to find, within time series, the optimal combination of number and locations of change points. Data segments found by the algorithm are then sorted out with a supervised classification tree procedure to organize segments by movement classes. We apply this framework to investigate changes in variance in daily distances of a migratory bird, the Macqueen's Bustard, Chlamydotis macqueenii, and describe its movements in three classes: staging, non-migratory and migratory movements. Using simulation experiments, we show that the algorithm is robust to identify exact behavioral shift (on average more than 80% of the time) but that positive autocorrelation when present is likely to lead to the detection of false change points (in 36% of the iterations with an average of 1.97 (SE = 0.06) additional change points). A case study is provided to illustrate the biases associated with visual analysis of movement patterns compared to the reliability of our analytical framework. Technological improvement will provide new opportunities for the study of animal behavior, bringing along huge and various data sets, a growing challenge for biologists, and this straightforward and standardized framework could be an asset in the attempt to decipher animal behavior.
Introduction
Animal movement is a spatially and temporally dynamic mechanism controlling the most fundamental animal behaviors such as foraging, reproduction, predation (Turchin, 1998; Patterson et al., 2008). The recent development of tracking tools (e.g., GPS data loggers, GSM tracking devices), both in terms of technology and affordability, has improved our nascent knowledge on animal movement (Fiedler, 2009; Bridge et al., 2011; Guilford et al., 2011; Bouten et al., 2013). Several analytical frameworks have emerged to attempt to interpret this new type of data with different, but complementary, objectives: either understand the underlying process driving animal movement or decipher the movement by detecting changes in individual behavior.
Because of data inaccuracy and low frequency from earlier tracking tools, e.g., ARGOS satellite tracking devices (Jonsen et al., 2003), the early analytical frameworks developed focused on accounting for error in animal locations and predicting the “true” path of the animal from its observed locations. Random walk models (Skellam, 1951; Turchin, 1998) received a lot of attention and were then extended to several more mathematically and statistically sophisticated approaches to interpret movement data such as State-Space Models (SSM) (Jonsen et al., 2003, 2005) and Brownian Bridge Movement Model (BBMM) (Horne et al., 2007). These Bayesian approaches can help understanding the underlying process driving animal movement and appeared successful in estimating animal paths, migration routes, home ranges and even analyzing fine-scale resource selection (Jonsen et al., 2003, 2005; Horne et al., 2007; Nathan, 2008; Schick et al., 2008; Tang and Bennett, 2010). Nevertheless, these models require heavy computational resources (Patterson et al., 2008) and unrealistic structural a priori hypotheses about movement, such as homogeneous movement behavior. A fundamental property of animal movements is behavioral heterogeneity (Gurarie et al., 2009) and these models poorly performed in highlighting behavioral changes in animal movements through space and time (Kranstauber et al., 2012).
Later, to identify discrete behavioral modes, “Switching models” (Morales et al., 2004) and “Sequential Importance Resampling” (considering time varying parameters) (Breed et al., 2012) have been implemented to SSM, but here again, these extensions typically involve computationally intensive procedures with a clearly addressed objective: handling the noise associated with inaccurate locations. Considering recent innovations in animal tracking (e.g., GPS, acoustic and video tracking) which increase accuracy and frequency of locations, there is little direct need for a state-space framework for movement data (Gurarie et al., 2009).
More recently, using GPS locations, the net squared displacement method (NSD), based on position-derived metric, appeared effective to specifically distinguish migration from other movement behaviors (dispersal, home range, nomadic movements) and quantify three main variable of migration: distance, timing, and duration (Bunnefeld et al., 2011). However, the method still involves structural a priori hypotheses on the type of movement patterns and subsequent model selection. In addition, the NSD model is based on the Euclidian distance between the first location and subsequent locations. As a consequence changes in movement behavior might be missed if the radial distance to the origin remains constant, e.g., a significant drift during migration in longitude might lead to a little variation in distance to the origin.
Moreover the models mentioned above fail at providing a straightforward answer to the question of individual timings in movement patterns which could explain why their use is scattered and data are still often analyzed by visual interpretation. This is especially apparent in bird migration ecology where the focus of the studies often bears on individual key timings (e.g., Kjellén et al., 2001; Battley et al., 2012). While some species present clear, visually-distinctive movement behavior (e.g., bird species migrating in flock), the complexity in individual movement patterns of other species renders the task of visually determining movement parameters (e.g., migration timing and stopover) very subjective (Hake et al., 2001; Chevallier et al., 2011; Mellone et al., 2013).
In addition, with the increase of the number of tracked animals and the increase number of locations per individuals (GPS-GSM, GPS archive devices), the not-so-basic task of visual analysis might also prove overwhelming in a near future and scientists need reliable simple automatic procedures to analyze their data. Therefore, another body of work on animal movement started to focus on Change Point Analysis in an attempt to detect changes in individual movement behavior. Indeed, data derived from tracking tools such as daily distance and speed are time series data where behavioral changes in animal movement are expected to lead to periodic change points, i.e., where the statistical properties of the data change. In migratory species for example, change points can be expected at key timings of migration, e.g., departure, arrival and stopover dates. Limiñana et al. (2007) used a regression to detect a single breakpoint corresponding to fall migration departure of Montagu's harriers. Later, to detect multiple change points, Gurarie et al. (2009) proposed the Behavioral Change Point Analysis (BCPA). This framework, which was then applied on BBMM by Kranstauber et al. (2012), is based on a pre-determined partition of the data and a single change point model that is applied on each data segment. However, the inability to detect multiple change point over the whole time series leads to a necessarily arbitrary choice for the width of the search window. This restriction limits the approach as the size of the search window ultimately dictates the maximum number of change points. Fortunately, recent developments in change point methodology have enabled to solve this non-trivial problem. These algorithms have already proven useful in other fields, e.g., economy (See Koop and Potter, 2004 for a review), climatology (Reeves et al., 2007), oceanography (Killick et al., 2010), and genetics (Olshen et al., 2004). Commonly-used methods in multiple change point analysis include the binary segmentation (Scott and Knott, 1974), segment neighborhoods (Auger and Lawrence, 1989), a method developed by Jackson et al. (2005) and a recently-proposed algorithm that stems from the latter: the Pruned Exact Linear Time (PELT) algorithm (Killick et al., 2012). Among these alternative exact methods, simulations (Killick et al., 2012) have shown that the PELT algorithm was comparatively faster in finding the optimal number and locations of change points and led to more accurate inferences on the segmentation of the data.
We propose a practical analytical framework based on the PELT algorithm, coupled with a supervised classification tree. This framework allows straightforward estimation of individual behavioral changes and does not require structural a priori hypotheses on movement or computationally-intensive procedures. We apply our framework on movement data of the Macqueen's Bustard, Chlamydotis macqueenii, tracked by satellite (GPS and ARGOS locations). The Macqueen's Bustard is a long migratory bird showing complex and variable individual migratory movements (Combreau et al., 1999, 2011). Our aim was to analyze individual movement patterns by detecting key timings of migration while minimizing the subjectivity inherent to visual interpretation of satellite tracking data. We show that the PELT algorithm is able to detect meaningful multiple change points without a priori hypotheses and specification of the number of change points expected. The supervised classification tree technique sorts out the different segments in classes in order to describe the individual movement patterns. Simulation experiments are used to show the performances of the algorithm. A case study is also provided to illustrate the biases associated with visual analysis of movement patterns compared to the reliability of our proposed analytical framework.
Materials and Methods
Statistical Analysis: the PELT-TREE Method
Change point analysis: the PELT algorithm
The PELT algorithm is a dynamic programming and pruning search method, also called optimal partitioning method, to find, for an ordered sequence of data, y1:n = (y1, …, yn), m change points τ i (i = 1, … m) such that the data are split into m + 1 segments of different statistical properties, with the ith segment containing y(τi − 1 + 1):τi The optimal combination of number and locations of change points is the one minimizing the sum of the cost functions C (i.e., twice the negative log-likelihood) of each segment plus a linear penalty
To find multiple change points, the PELT algorithm is first applied to the whole data set and iteratively and independently to each partition until no further change points are detected (See Killick et al., 2012 for details on the algorithm of the PELT method).
The main assumption of the PELT algorithm is that the numbers of change points increases linearly with the increase of data set, i.e., the change points are spread throughout the data and are not restricted to one portion of the data. For a change in variance, the minimum segment length is two observations. The data are assumed to follow a Normal distribution with a constant mean and the observations are assumed independent.
Supervised classification model
A supervised classification technique aims at building a classification model, using an input data set, i.e., training data set, with a good generalization capability. A binary partitioning process is used to build a tree based on a response variable and on splits from predictors which maximize the reduction in impurity.
Application of the PELT-TREE Method
First step: data processing
The present application focused on the variable “daily distance” to study migration key timings. Seventeen wild Macqueen's Bustards were captured during the breeding season (end of March to end of May) in 2010, 2011 and 2012, in Uzbekistan (Navoi district, 39°N, 65°E, Figure 3). Birds were equipped with 22 or 30 g solar-powered satellite transmitters (Microwave Telemetry Inc., Columbia, MD, USA). Their weight did not exceed 40 g including the harness, therefore representing less than 3% of the total body weight of individuals (Combreau et al., 1999). The platform terminal transmitters (GPS-PTT) were operated through the ARGOS system in Toulouse (CLS, France) and programmed to record a position every 2 h and transmit once every 2 days. Satellite tracking data from nine wild adults (six females, three males) with at least one complete migration leg (i.e., the first fall migration following capture) to their wintering ground in Iran or Pakistan were included in the analysis. Data were first filtered by precision: GPS and ARGOS locations of CLS class 3–2 were retained.
To build the time series data for the change point analysis, only the last location per day was retained for each individual to allow for regular time spacing (i.e., an approximate 24 h gap) between successive locations. Location coordinates were then projected using the Asia north equidistant conic projection in ArcGIS 10.1 (ESRI, 2012) to calculate distances between successive locations (in km), i.e., daily distances. Autocorrelation was plotted for all time series using the acf() function in the R library (stats).
Second step: movement segmentation
We run the PELT algorithm with the Schwarz Information Criterion (SIC) as penalty to find changes in variance in the daily distances of each bird using the function “cpt.var()” from the R package “changepoint” (Killick and Eckley, 2012). Segments were checked for normality using a one-sample Kolmogorov-Smirnov test: non-normality arose for less than 20% of the segments due to small sample size characterizing, for this species, short-term movement phases.
Third step: segment classification
We started by training the supervised classification tree: we created a training set with three birds (i.e., bird 3947, 5826, 5863) featuring the highest number of segments in order to have at least 30% of the segments in the training set and all behavioral classes present. Segments belonging to the three “training” birds (N = 68, Table 1) were assigned to three behavioral classes: staging, migratory and non-migratory movements, based on the mean, standard error, and maximum of the variable daily distance of each segment. Typically, we assigned segments with low mean, standard error, and maximum to class staging, i.e., phases of low mobility and/or faithfulness to key areas. Segments of class migratory corresponded to movements of large amplitude, with expected high mean and maximum, contrasting with segments of non-migratory movements, i.e., movement of lesser amplitude, such as foraging and exploratory trips. Segments of class non migratory movement were expected to have a smaller mean and maximum than class migratory movement and higher standard error than class staging. In this training set, we classified 33 segments in class staging, 17 in class non-migratory movement and 18 in class migratory movement (Table 1 and Data Sheet 1). We then used the function “tree()” in the R package “tree” (Ripley, 2013) to fit a tree and find splitting rules with the training set and the mean, standard error, and maximum of each segment as predictors for the response factor “class” (i.e., staging, migratory, and non-migratory movements). We then applied the splitting rules of the previously fitted tree on the six remaining birds using the function “predict()” from the R package “tree.”
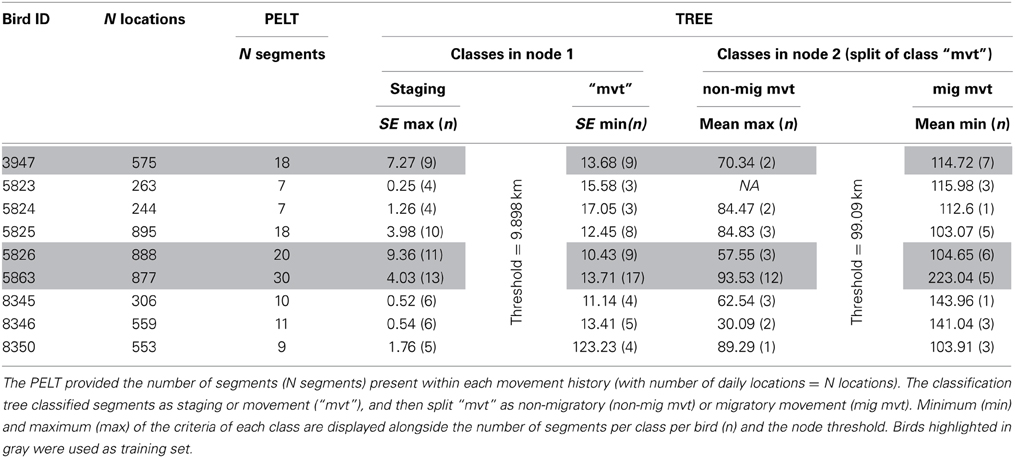
Table 1. Results of the PELT-TREE method applied on movement histories of nine Macqueen's Bustards.
In the following, we refer to the PELT algorithm as the PELT and to the analytical framework based on the PELT algorithm followed by the supervised classification tree as the PELT-TREE method.
Simulation Experiments
To test the PELT algorithm performances to detect behavioral changes, we simulated the three movement classes (staging, non-migratory movement, migratory, movement) for 1000 iterations of 365 daily distances (corresponding to a year of tracking with 2 migration events) creating 8 segments as follow: staging from day 1 to 90, non-migratory movement from day 91 to 95, staging from day 96 to 115, migratory movement from day 116 to 117, staging from day 118 to 217, non-migratory movement from day 218 to 223, migratory movement from day 224 to 226 and staging from day 227 to 365. We therefore expected the PELT to detect change points at day 90, 95, 115, 117, 217, 223, and 226.
In a first simulation experiment (Experiment 1, Data Sheet 1), we first randomly selected the mean and standard error to create 8 normal distributions (one for each segment): the means for each segment of staging (n = 4) had to be comprised between 0.2 and 2 and the standard error between 0.01 and 4; for class non-migratory movement (n = 2), the means were comprised between 20 and 50 with standard error between 5 and 10 and for the migratory segments (n = 2), the means were bounded between 200 and 400 and the standard errors between 10 and 200. We then created segments by sampling x (x being the segment length) times the corresponding distribution to create the 365-day time series and run the PELT. We constrained the values of simulated daily distances to be positive and not to exceed 20 km for class staging, 100 km for class non-migratory movement and 800 km for class migratory movement. We repeated the process 1000 times.
In a second simulation experiment (Experiment 2, Data Sheet 1), we used more “realistic” constrains to build the normal distributions to create the 8 segments: either the values used by the classification tree at the nodes to break segments into classes or the minimum/maximum (respectively for the lower or upper bound) means and standard errors from segments with no missing days present in our data set (Data Sheet 2). We constrained the values of simulated daily distances using maximum distances for each class found in the data set (using segments with no missing argument), i.e., 52 km for class staging, 262 km for class non-migratory movement and 850 km for class migratory movement. We repeated the process 1000 times. Also see (Killick et al., 2012) for additional scenarios and simulation experiments.
Results
Tracking data led to an average of 574 (SE = 267) daily distances (in km) per bird, two birds had complete time series and the remaining seven birds had an average of 17.85 (SE = 6.9) missing days with individual 3947 having the maximum number of missing day (n = 62) (Table 1). Single missing day was the most frequent (61 occurrences) and most missing days occurred in segments of class staging (n = 103). As expected in such time series, data were not random for six birds: weak positive auto-correlation was present for bird 5863, mild positive auto-correlation for birds 5825, 8346, and 8350 and weak cyclic auto-correlation for birds 5824 and 8345 (Figure 1).
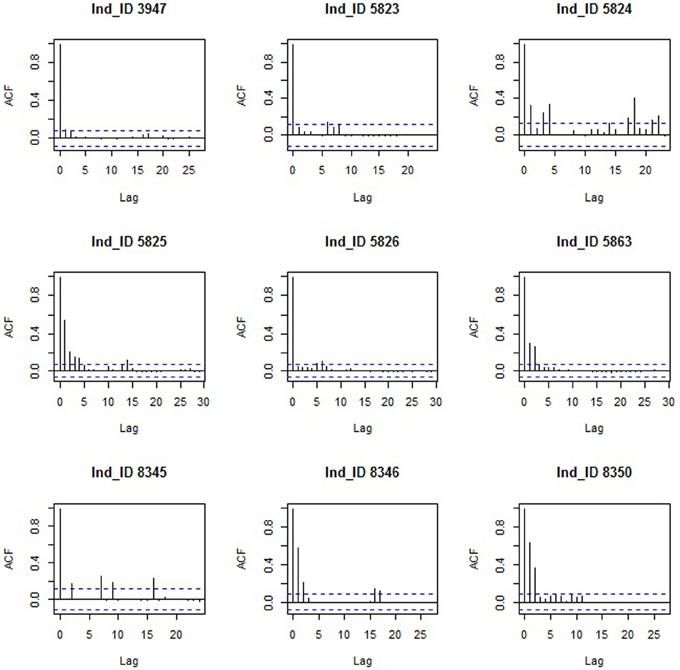
Figure 1. Autocorrelation function (ACF) of the time series of the nine Macqueen's Bustards (Ind_ID = Bird ID).
The PELT algorithm detected an average of 13 change points (SE = 8) in individual daily distance time series (Table 1 and Data Sheet 1). The classification tree was able to find mathematical rules to classify, without error, all 68 segments of the training set using standard error and mean of daily distances as predictors. Based on the training data, the classification tree rules were defined as follow:
1. The first node of the tree split the segments into two classes, one class of segments with standard error <9.898 (i.e., class staging) and one class of segments with standard error >9.898 (i.e., class “movement”).
2. The second node split the previous class “movement” into two classes: one class with segments of mean <99.09 (i.e., class non-migratory movement) and another class of segments with mean >99.09 (i.e., class migratory movements).
When testing the performance of the PELT algorithm (Experiment 1), we found that the algorithm detected exactly the expected change points in more than 93.6% of the time (Table 2). As expected, the algorithm performed better when behavioral shift occurred between extreme movement types (i.e., staging and migratory) and was robust to non-normality arising from small sample size (e.g., segment size <10 such as the movement and migration segments). The performances dropped slightly in a more “realistic” context (Experiment 2) with the algorithm detecting exact change points for behavioral shifts occurring between:
1. A staging phase and a non-migratory movement 80.4% of the time and detected them at ±1 day 13.2% of the time;
2. A staging phase and a migratory movement 96.5% of the time;
3. A non-migratory movement and a migratory movement 53.9% of the times and detected them at ±1 day 15.3% of the time.
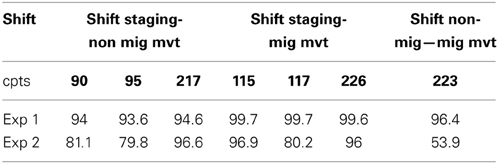
Table 2. Performances (in %) of the PELT algorithm at detecting exactly the 7 expected change points (cpts, in bold: positions of the cpts within the year-long simulated tracking) in simulation Experiments 1 and 2 (Exp 1, Exp 2).
The apparent poor performances of the algorithm in the second simulation experiment in detecting a shift between a non-migratory phase and a migratory phase (53.9% of the time with ±1 day 15.3% of the time) need to be put into perspective. Indeed, with the current parameter values (means and standard errors) used in the experiment 2 to draw the distributions, the second segment of non-migratory movement and the following segment representing a migration phase were only significantly different (Welch's t-test p-value < 0.05) in 35.6% of the iterations. This suggests that the algorithm detected precisely this behavioral shift when present in the data but also detected it when not present, hence creating false change points. Finally, simulated data were slightly positively auto-correlated (e.g., Figure 2) and as a consequence, the PELT algorithm detected false change points 36% of the time with an average of 1.97 (SE = 0.06) additional change points.
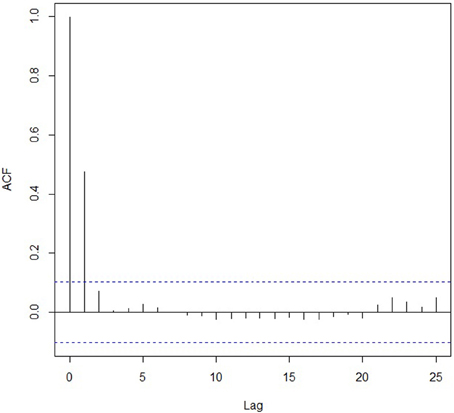
Figure 2. Autocorrelation function (ACF) for one iteration of Experiment 2.
Segment characteristics and R codes for the PELT-TREE method and the simulations are provided respectively in the Data Sheets 1–3.
Case Study
We used a 1 year cycle of movement (March 2012–2013) of bird 5863 to illustrate the challenges of visual analysis and the benefits of our analytical framework. Figure 3 contrasts our visual interpretation based on tracking point scrutiny with the mathematical estimation of the PELT-TREE method based on daily distance statistical characteristics. The first difference observed between the two methods was the estimate of the bird arrival date on its breeding ground in 2012 (visual: 15/3/12 vs. PELT-TREE: 12/3/12). Then, the visual interpretation of the movement pattern on the breeding ground until 2/10/12 required a zoom (from 1/10,000,000 to 1/3,000,000). At this scale, we visually considered that the individual had 3 phases of staging separated by non-migratory movements on the 27/3/12 and 17/6/12. For the same period, the PELT-TREE method did not detect any changes in daily distances (i.e., distances on the 27/3/12 and 17/6/12 did not differ statistically from the other distances) and the movement pattern on the breeding ground represented a unique segment classified as a staging phase. The fall migration departure dates were only 1 day apart between the two methods. The next discrepancy appeared during the course of the migration: the PELT detected a significant decrease in daily distances from 5/10/12, while, visually, we were unable to highlight this phenomenon. Moreover, between the staging sites 4 and 5, we were visually unable to determine if the bird was still migrating or if it had arrived on the wintering ground on the 10/10/12 (i.e., “undetermined movement,” Figure 3) and was just moving to another staging site (i.e., site 5). The same difficulties encountered with the visual analysis on the breeding ground appeared on the wintering ground and led to differences in staging site delineation. On the wintering ground, staging site 7 on the visual map was not detected by the PELT-TREE method, indicating that there was no significant difference in the daily distances between 31/12/12 and 5/1/13. Furthermore, the PELT-TREE method detected that site 8 of the visual analysis was in fact two staging sites, 7′ and 8′, separated by 2 days of non-migratory movement that we missed during the visual analysis. Finally both methods agreed on the estimation of spring migration timing (16/3/13 to 19/3/13).
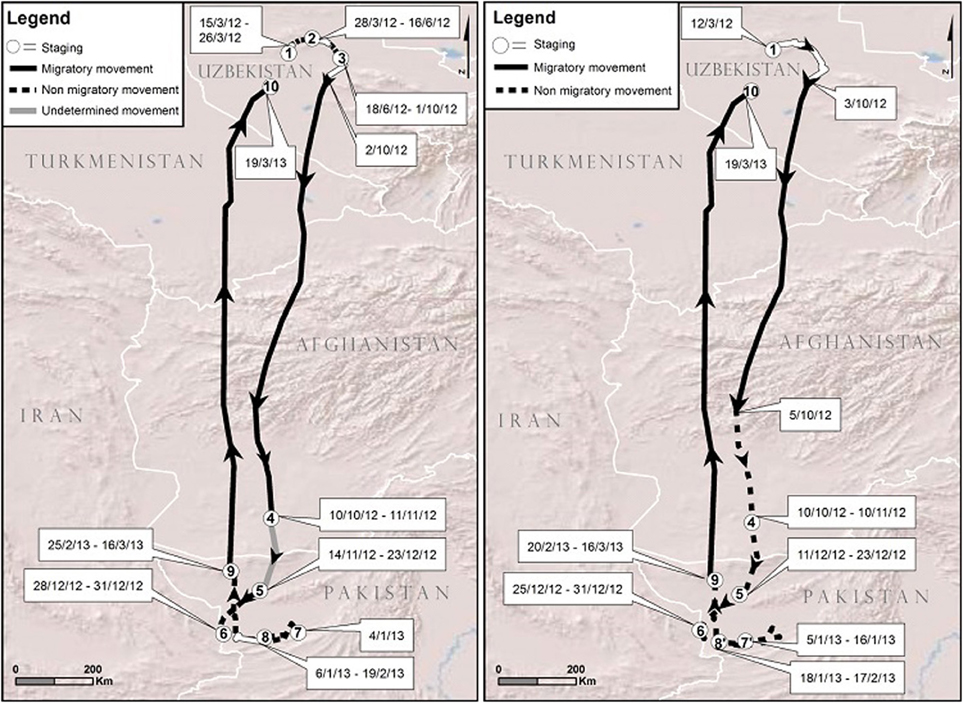
Figure 3. Movement patterns for bird 5863 in 2012–2013 with staging sites (white areas), migration legs (solid lines) and non-migratory movements (dashed lines) estimated: 1- with the visual analysis (left) and 2- with the PELT-TREE method (right). Note the gray line in the visual analysis symbolizing visual uncertainty in determining the type of movement, migratory or non-migratory, and that identical staging sites on both maps bear the same number.
Discussion
In the field of movement ecology, the improvement of the technological assets (e.g., satellite tracking, GPS-GSM, etc.) has opened a whole new window in the study of animal movement by providing an extraordinary new set of data. Despite recent analytical development (Gurarie et al., 2009; Bunnefeld et al., 2011), behavioral changes along movement path are still left to visual interpretation (e.g., Combreau et al., 2011; Battley et al., 2012). We propose a more straightforward analytical framework, called PELT-TREE method, able to detect multiple changes in movement behavior in order to optimize and standardize the analysis of individual movement patterns. Our aim was to analyze individual movement patterns by detecting key timings of migration while minimizing the subjectivity inherent to visual interpretation of satellite tracking data. At a time where it is essential that biologists detect subtle responses to environmental changes, reliable and replicable estimation of migration patterns is essential.
We demonstrate that a multiple change point algorithm, the PELT algorithm (Killick et al., 2012), already proven useful in other fields (Koop and Potter, 2004; Olshen et al., 2004; Reeves et al., 2007; Killick et al., 2010), can be used to analyze animal tracking locations as they are just another kind of time series data. The timing of movement was deciphered by the algorithm for the nine migrant Macqueen's Bustards and the PELT-TREE method seems to stand out by its ability to highlight fine patterns in movement. The segments obtained by the change point analysis highlighted the complexity of the migration strategy of this species making any visual analysis more than subjective, e.g., bird 5863 in the case study.
The PELT-TREE analytical framework is easy to implement as it requires only few steps with no a priori assumptions on movement characteristics. Even though some choices have to be made at each step, they are dictated by the study objectives, the nature of the data set and the biology of the species. The PELT-TREE framework requires 3 steps. First, data need to be organized as a time series, i.e., a sequence of measurements regularly spaced in time. The choice of time lag is ultimately driven by the objective of the study and the characteristics of the tracking data available which result from: (1) the initial settings of the tracking devices (often trade-offs to maximize the number of locations while optimizing battery lifespan) and (2) accuracy of locations, e.g., transmitters performances decrease typically when birds move fast (Nicholls et al., 2007). Here, we used daily locations, i.e., 24 h apart, in order to calculate daily travel distances, a suitable variable to describe bird migration (Gwinner, 1996; Alerstam, 2009, 2011) and because our objective was to decipher movement patterns of long migrant Macqueen's Bustards throughout a yearly cycle.
The second step involves running the PELT algorithm on the time series data and choices need to be made in the specification of the algorithm: 1- on the type of changes expected in the data (in the mean, in the variance or in the mean and variance); and 2- on the penalty method. We opted for the change in variance algorithm with the default penalty (i.e., SIC or BIC, Schwarz, 1978) which is among the most commonly used penalty. As Killick et al. (2012) states, this is one but several ways in which the data could be segmented. However, as shown in our simulation experiments and in Killick et al. (2012), this method appears computationally efficient, exact and versatile. One drawback of the method of change in variance, nevertheless, is that minimum segment length is two observations. This implies that one day migration/staging/non-migratory movement will, if detected, be associated in a segment with the previous or next observation. Furthermore, these one day migration/staging/non-migratory segments will lead to segments of small size which will inevitably violate the assumption of normality. Diagnosis for normality should always be performed and data transformation, e.g., Box-Cox transformation as in Killick et al. (2012), applied when required. In movement data, auto-correlation is a ubiquitous feature and another downside of the algorithm is that, as currently implemented, it is not possible to account for auto-correlation. One-way to circumvent, at least partially, the issue of autocorrelation would be to use a meaningful time lag that minimizes it. The option to account for autocorrelation will, however, be implemented into the “changepoint” R package in a near future (R. Killick, personal comm.). Our data presented some degree of positive auto-correlation for six out of nine birds, the consequence of which is likely an increased rate of false change points for the concerned birds as shown in our simulation Experiment 2 when the algorithm detected a couple of behavioral shifts when none were present, i.e., fake behavioral shifts. With positive auto-correlation, the change of variance option in the PELT should be the preferred option as any sudden perturbation (i.e., periods of increased or decreased mean) in the time series will tend to persist, inducing the appearance of a change in mean more likely to be detected by the change-in-mean algorithm. Finally, “gappiness” is also a common characteristic of movement data that can lead to false or imprecise behavioral shift. The data processing method (i.e., selecting one precise location per day) may lead to the absence of location on some days. Consequently, it might happen that the distance between two successive locations may not be a true daily distance but a linear distance between the current location and the next available location. If the individual was staging, missing data should not be an issue but if the individual was in movement, this might lead to a change point. With the rapid technological improvement of tracking tools, increase in the number of locations and their accuracy, will reduce “gappiness” and allow movement analysis at shorter time lags.
Change points obtained with the PELT algorithm partitioned the data into segments and the third step in the PELT-TREE method consists in characterizing these segments. The number of classes will obviously be contingent on the prior knowledge of the species (Guilford et al., 2009). Movement behavior of migrant Macqueen's Bustards typically consists of staging and movement phases (Combreau et al., 1999, 2011). Staging phases occur during migration (so called stopovers) and on wintering and breeding grounds (e.g., faithfulness to a feeding site, breeding sites). Seasonal and persistent travels between wintering and breeding grounds constitute migratory movements, contrasting with non-migratory movements, such as foraging and exploratory trips. The sample of data used to train the classification tree, i.e., training data, is fundamental to minimize misclassification. In such system where some degree of class imbalance can be expected (e.g., few instances or absence of non-migratory movement period compared to periods of staging), misclassification of the minority class is likely to happen as it is unlikely that the training set encompassed enough instances for the minority class.
Both simplistic and complex models are needed in a complementary way to understand and optimize the analyses of animal movement (Alerstam, 2011). Alongside Bayesian approaches that can help understanding the underlying process driving animal movement, the PELT-TREE method represents a simple and efficient tool in conservation and decision making by defining reliable temporal and spatial patterns in animal movements. Migratory species are key species, indicator of environmental health and depend on several habitats throughout the course of their migration. The PELT-TREE method could help better delineate home ranges, identify migration paths, for the implementation of protected areas and connectivity strategies. At the individual level, it can be applied at finer time scale for studying other behaviors such as foraging, nesting, and natal dispersal (Hilty et al., 2006). The PELT-TREE is not restricted to individual monitoring and could be applied to a wider range of data. For instance, the PELT-TREE could help detect changes in social group structure and interaction (e.g., individual departing from the group) using inter-individual distances as the variable. Technological improvement in wildlife monitoring will indisputably provide new opportunities for the study of animal behavior, bringing along huge and various data sets, a growing challenge for biologists, and this straightforward and standardized framework could be an asset in the attempt to decipher animal behavior.
Conflict of Interest Statement
The authors declare that the research was conducted in the absence of any commercial or financial relationships that could be construed as a potential conflict of interest.
Acknowledgments
The data were provided by the Emirate Center for the Conservation of the Houbara (ECCH) under the management of RENECO for Wildlife Preservation (www.reneco.org). We are grateful to HH Sheikh Mohammed Bin Rashid Al Maktum funder of the ECCH for his support, Frédéric Lacroix (General Manager of RENECO), Mohammed Beljafla (Director of ECCH) and Adeline Cadet (Project Operation Manager of ECCH). The authors wish to thank all Ecology staff involved in data collection, Pascale Reding for her support in GIS analysis and technical assistance on geographic map editing, Dr. Jason Taylor and Dr. Sabrina Servanty for their comments on earlier draft of the manuscript. We are also grateful to reviewers for their constructive comments that helped improve the manuscript.
Supplementary Material
The Supplementary Material for this article can be found online at: http://www.frontiersin.org/journal/10.3389/fevo.2014.00030/abstract
References
Alerstam, T. (2009). Flight by night or day? Optimal daily timing of bird migration. J. Theor. Biol. 258, 530–536. doi: 10.1016/j.jtbi.2009.01.020
Alerstam, T. (2011). Optimal bird migration revisited. J. Ornithol. 152, 5–23. doi: 10.1007/s10336-011-0694-1
Auger, I., and Lawrence, C. (1989). Algorithms for the optimal identification of segment neighbourhoods. Bull. Math. Biol. 51, 39–54. doi: 10.1007/BF02458835
Battley, P. F., Warnock, N., Tibbitts, T. L., Gill, R. E., Piersma, T., Hassell, C. J., et al. (2012). Contrasting extreme long-distance migration patterns in bar-tailed godwits Limosa lapponica. J. Avian Biol. 43, 21–32. doi: 10.1111/j.1600-048X.2011.05473.x
Bouten, W., Baaij, E. W., Shamoun-Baranes, J., and Camphuysen, K. C. J. (2013). A flexible GPS tracking system for studying bird behaviour at multiple scales. J. Ornithol. 154, 571–580. doi: 10.1007/s10336-012-0908-1
Breed, G. A., Costa, D. P., Jonsen, I. D., Robinson, P. W., and Mills-Flemming, J. (2012). State-space methods for more completely capturing behavioral dynamics from animal tracks. Ecol. Model. 235–236, 49–58. doi: 10.1016/j.ecolmodel.2012.03
Bridge, E. S., Thorup, K., Bowlin, M. S., Chilson, P. B., Diehl, R. H., Fléron, R. W., et al. (2011). Technology on the move: recent and forthcoming innovations for tracking migratory birds. Bioscience 61, 689–698. doi: 10.1525/bio.2011.61.9.7
Bunnefeld, N., Börger, L., Van Moorter, B., Rolandsen, C. M., Dettki, H., Solberg, E. J., et al. (2011). A model-driven approach to quantify migration patterns: individual, regional and yearly differences. J. Anim. Ecol. 80, 466–476. doi: 10.1111/j.1365-2656.2010.01776.x
Chevallier, D., Maho, Y., Brossault, P., Baillon, F., and Massemin, S. (2011). The use of stopover sites by black storks (Ciconia nigra) migrating between West Europe and West Africa as revealed by satellite telemetry. J. Ornithol. 152, 1–13. doi: 10.1007/s10336-010-0536-6
Combreau, O., Launay, F., Al Bowardi, M., and Gubin, B. (1999). Outward migration of Houbara bustards from two breeding areas in Kazakhstan. Condor 101, 159–164. doi: 10.2307/1370458
Combreau, O., Riou, S., Judas, J., Lawrence, M., and Launay, F. (2011). Migratory pathways and connectivity in Asian Houbara bustards: evidence from 15 years of satellite tracking. PLoS ONE 6:e20570. doi: 10.1371/journal.pone.0020570
Fiedler, W. (2009). New technologies for monitoring bird migration and behaviour. Ring. Migr. 24, 175–179. doi: 10.1080/03078698.2009.9674389
Guilford, T., Akesson, S., Gagliardo, A., Holland, R. A., Mouritsen, H., Muheim, R., et al. (2011). Migratory navigation in birds: new opportunities in an era of fast-developing tracking technology. J. Exp. Biol. 214, 3705–3712. doi: 10.1242/jeb.051292
Guilford, T., Meade, J., Willis, J., Phillips, R. A., Boyle, D., Roberts, S., et al. (2009). Migration and stopover in a small pelagic seabird, the Manx shearwater Puffinus puffinus: insights from machine learning. Proc. R. Soc. A Biol. Sci. 276, 1215–1223. doi: 10.1098/rspb.2008.1577
Gurarie, E., Andrews, R. D., and Laidre, K. L. (2009). A novel method for identifying behavioural changes in animal movement data. Ecol. Lett. 12, 395–408. doi: 10.1111/j.1461-0248.2009.01293.x
Gwinner, E. (1996). Circadian and circannual programmes in avian migration. J. Exp. Biol. 199, 39–48.
Hake, M., Kjellén, N., and Alerstam, T. (2001). Satellite tracking of Swedish Ospreys Pandion haliaetus: autumn migration routes and orientation. J. Avian Biol. 32, 47–56. doi: 10.1034/j.1600-048X.2001.320107.x
Hilty, J. A., Lidicker, W. Z. Jr., and Merenlender, A. M. (2006). Corridor Ecology: The Science and Practice of Linking Landscapes for Biodiversity Conservation. Washington DC: Island Press.
Horne, J. S., Garton, E. O., Krone, S. M., and Lewis, J. S. (2007). Analyzing animal movements using Brownian bridges. Ecology 88, 2354–2363. doi: 10.1890/06-0957.1
Jackson, B., Scargle, J. D., Barnes, D., Arabhi, S., Alt, A., Gioumousis, P., et al. (2005). An algorithm for optimal partitioning of data on an interval. Signal Process. Lett. IEEE 12, 105–108. doi: 10.1109/LSP.2001.838216
Jonsen, I. D., Flemming, J. M., and Myers, R. A. (2005). Robust state-space modeling of animal movement data. Ecology 86, 2874–2880. doi: 10.1890/04-1852
Jonsen, I. D., Myers, R. A., and Flemming, J. M. (2003). Meta-analysis of animal movement using state-space models. Ecology 84, 3055–3063. doi: 10.1890/02-0670
Killick, R., Eckley, I. A., Ewans, K., and Jonathan, P. (2010). Detection of changes in variance of oceanographic time-series using changepoint analysis. Ocean Eng. 37, 1120–1126. doi: 10.1016/j.oceaneng.2010.04.009
Killick, R., Fearnhead, P., and Eckley, I. A. (2012). Optimal detection of changepoints with a linear computational cost. J. Am. Statist. Assoc. 107, 1590–1598. doi: 10.1080/01621459.2012.737745
Kjellén, N., Hake, M., and Alerstam, T. (2001). Timing and speed of migration in male, female and juvenile Ospreys Pandion haliaetus between Sweden and Africa as revealed by field observations, radar and satellite tracking. J. Avian Biol. 32, 57–67. doi: 10.1034/j.1600-048X.2001.320108.x
Koop, G. M., and Potter, S. M. (2004). Forecasting and Estimating Multiple Change-Point Models with an Unknown Number of Change-Points. Department of Economics, University of Leicester.
Kranstauber, B., Kays, R., Lapoint, S. D., Wikelski, M., and Safi, K. (2012). A dynamic Brownian bridge movement model to estimate utilization distributions for heterogeneous animal movement. J. Anim. Ecol. 81, 738–746. doi: 10.1111/j.1365-2656.2012.01955.x
Limiñana, R., Soutullo, A., and Urios, V. (2007). Autumn migration of Montagu's harriers Circus pygargus tracked by satellite telemetry. J. Ornithol. 148, 517–523. doi: 10.1007/s10336-007-0182-9
Mellone, U., López-López, P., Limiñana, R., Piasevoli, G., and Urios, V. (2013). The trans-equatorial loop migration system of Eleonora's falcon: differences in migration patterns between age classes, regions and seasons. J. Avian Biol. 44, 417–426. doi: 10.1111/j.1600-048X.2013.00139.x
Morales, J. M., Haydon, D. T., Frair, J., Holsinger, K. E., and Fryxell, J. M. (2004). Extracting more out of relocation data: building movement models as mixtures of random walks. Ecology 85, 2436–2445. doi: 10.1890/03-0269
Nathan, R. (2008). An emerging movement ecology paradigm. Proc. Natl. Acad. Sci. U.S.A. 105, 19050–19051. doi: 10.1073/pnas.0808918105
Nicholls, D. G., Robertson, C. J. R., and Murray, M. D. (2007). Measuring accuracy and precision for CLS: argos satellite telemetry locations. Notornis 54, 137–157.
Olshen, A. B., Venkatraman, E. S., Lucito, R., and Wigler, M. (2004). Circular binary segmentation for the analysis of array−based DNA copy number data. Biostatistics 5, 557–572. doi: 10.1093/biostatistics/kxh008
Patterson, T. A., Thomas, L., Wilcox, C., Ovaskainen, O., and Matthiopoulos, J. (2008). State–space models of individual animal movement. Trends Ecol. Evol. 23, 87–94. doi: 10.1016/j.tree.2007.10.009
Reeves, J., Chen, J., Wang, X. L., Lund, R., and Lu, Q. Q. (2007). A review and comparison of changepoint detection techniques for climate data. J. Appl. Meteorol. 46, 900–915. doi: 10.1175/JAM2493.1
Schick, R. S., Loarie, S. R., Colchero, F., Best, B. D., Boustany, A., Conde, D. A., et al. (2008). Understanding movement data and movement processes: current and emerging directions. Ecol. Lett. 11, 1338–1350. doi: 10.1111/j.1461-0248.2008.01249.x
Schwarz, G. (1978). Estimating the dimension of a model. Ann. Statist. 6, 461–464. doi: 10.1214/aos/1176344136
Scott, A. J., and Knott, M. (1974). A cluster analysis method for grouping means in the analysis of variance. Biometrics 30, 507–512. doi: 10.2307/2529204
Skellam, J. G. (1951). Random dispersal in theoretical populations. Biometrika 38, 196–218. doi: 10.1093/biomet/38.1-2.196
Keywords: animal tracking, time series data, change point analysis, PELT algorithm, supervised classification tree, Chlamydotis macqueenii, migration
Citation: Madon B and Hingrat Y (2014) Deciphering behavioral changes in animal movement with a “multiple change point algorithm- classification tree” framework. Front. Ecol. Evol. 2:30. doi: 10.3389/fevo.2014.00030
Received: 07 April 2014; Accepted: 16 June 2014;
Published online: 02 July 2014.
Edited by:
José J. Lahoz-Monfort, University of Melbourne, AustraliaReviewed by:
Fernando Colchero, University of Southern Denmark, DenmarkYan Jiao, Virginia Polytechnic Institute and State University, USA
Eliezer Gurarie, University of Maryland, USA
Copyright © 2014 Madon and Hingrat. This is an open-access article distributed under the terms of the Creative Commons Attribution License (CC BY). The use, distribution or reproduction in other forums is permitted, provided the original author(s) or licensor are credited and that the original publication in this journal is cited, in accordance with accepted academic practice. No use, distribution or reproduction is permitted which does not comply with these terms.
*Correspondence: Bénédicte Madon, Reneco Wildlife Consultants LLC, Al Nahyan Compound Villa 27, Defense Rd., PO Box 61741, Abu Dhabi, UAE e-mail: benedicte.madon@gmail.com