Sequence similarity network reveals the imprints of major diversification events in the evolution of microbial life
 Shu Cheng1†
  Slim Karkar
 Eric Bapteste
 Nathan Yee
 Debashish Bhattacharya
- 1Department of Ecology, Evolution and Natural Resources, Rutgers University, New Brunswick, NJ, USA
- 2Unité Mixte de Recherche, Centre National de la Recherche Scientifique 7138, Evolution Paris Seine, IBPS, Université Pierre et Marie Curie, Paris, France
- 3Institute of Marine and Coastal Science, Rutgers University, New Brunswick, NJ, USA
- 4Department of Environmental Sciences, Rutgers University, New Brunswick, NJ, USA
- 5Environmental Biophysics and Molecular Biology Program, Institute of Marine and Coastal Science, Rutgers University, New Brunswick, NJ, USA
Ancient transitions, such as between life that evolved in a reducing versus an oxidizing atmosphere precipitated by the Great Oxygenation Event (GOE) ca. 2.4 billion years ago, fundamentally altered the space in which prokaryotes could derive metabolic energy. Despite fundamental changes in Earth's redox state, there are very few comprehensive, proteome-wide analyses about the effects of these changes on gene content and evolution. Here, using a pan-proteome sequence similarity network applied to broadly sampled lifestyles of 84 prokaryotes that were categorized into four different redox groups (i.e., methanogens, obligate anaerobes, facultative anaerobes, and obligate aerobes), we reconstructed the genetic inventory of major respiratory communities. We show that a set of putative core homologs that is highly conserved in prokaryotic proteomes is characterized by the loss of canonical network connections and low conductance that correlates with differences in respiratory phenotypes. We suggest these different network patterns observed for different respiratory communities could be explained by two major evolutionary diversification events in the history of microbial life. The first event (M) is a divergence between methanogenesis and other anaerobic lifestyles in prokaryotes (archaebacteria and eubacteria). The second diversification event (OX) is from anaerobic to aerobic lifestyles that left a proteome-wide footprint among prokaryotes. Additional analyses revealed that oxidoreductase evolution played a central role in these two diversification events. Distinct cofactor binding domains were frequently recombined, allowing these enzymes to utilize increasingly oxidized substrates with high specificity.
Introduction
A set of metabolic processes that evolved exclusively in microbes during the anoxic and reducing Archean eon experienced drastic redox-associated perturbations, such as changes in trace metal chemistry and bioavailability (Dupont et al., 2006). These perturbations led to variation in electron transfer processes in cells (Kim et al., 2013), although the core biological machines responsible for planetary biogeochemical cycles have survived intact (Falkowski et al., 2008). A recent protein sequence-based study revealed a rapid evolutionary innovation dominated by genes involved in electron transfer and respiratory pathways during the Archean Expansion (3.33 ~ 2.85 Ga) (David and Alm, 2011), which might be the consequence of redox selection on ancient prokaryotes. The Great Oxygenation Event (GOE), which occurred ca. 2.4 billion years ago (Ga), represents a major redox transition in the history of life, that accompanied the great changes in biochemistry and enzymology in the adaptation to O2 (Raymond and Segre, 2006; Jiang et al., 2012). The footprints of selection that acted on redox enzymes are also apparent in the evolution of protein structure across the GOE (e.g., Dupont et al., 2010; Kim et al., 2012).
Before the GOE (and in many environments thereafter), anaerobic metabolisms were the dominant forms of cellular energy generation. Phylogenetic studies indicate that sulfate reducers and methanogens are deeply rooted in the tree of life (Wagner et al., 1998; Slesarev et al., 2002), with geological evidence suggesting sulfate reduction may have evolved as early as 3.47 Ga (Shen et al., 2001). Isotopic analyses of banded iron formations also suggest the occurrence of dissimilatory iron reduction throughout the Archean eon (Johnson et al., 2008; Heimann et al., 2010). The origin and evolution of life is closely coupled to microbiology and geochemistry, and as the Earth became increasingly oxidized over time, novel electron acceptors formed, thereby creating new ecological niches to drive microbial adaptation (Falkowski et al., 2008). By 2.5 Ga, nitrate was transiently available in seawater, thereby enabling prokaryotic denitrification (Godfrey and Falkowski, 2009), and the formation of oxygenated conditions during the GOE allowed for the evolution of aerobic respiratory pathways. This perspective on major biogeochemical events provides the opportunity to study prokaryotes affiliated with different redox respiratory groups and the emergence of novel microbial lifestyles.
To gain insights into how ancient genomes may have adapted to changes in redox chemistry, here we present an analysis of 84 selected prokaryotic genera that span a variety of lifestyles, such as growth on CO2 and H2 as sole energy source and dissimilatory nitrate, iron, and sulfate reduction metabolisms. These represent broadly different prokaryotic lifestyles that evolved during the Archean eon and still exist today. Given the widespread occurrence of horizontal gene transfer (HGT) in prokaryotes (Ciccarelli et al., 2006; Dagan et al., 2008; Doolittle, 2009; Wylie et al., 2012), evident in the different metabolic lifestyles observed in sister taxa in a 16S rDNA tree (Figure S1A), we used pan-genomes (i.e., not specific taxa or lineages) to classify distinct respiratory/redox groups. The prokaryotic genera were categorized into four different redox groups: methanogens, obligate anaerobes, facultative anaerobes, and obligate aerobes. The analysis was focused primarily on Enzyme Commission (EC) class 1 (i.e., oxidoreductases) to search for the footprints of selection on microbial genomes over evolutionary timescales.
We recognized here that methanogens are comprised solely of archaebacteria, thereby imparting a strong, unavoidable phylogenetic signal to this redox group. This bias is however balanced by the fact that even though all methanogens are archaebacteria, not all archaebacteria are methanogens; i.e., they are also found in the other three redox groups. We addressed this issue in detail by using robust sequence similarity network analysis methods such as conductance. Other obligate anaerobes that respire a variety of compounds including sulfate, iron, and nitrate constitute another distinct group. Likewise, facultative aerobes that are capable of molecular oxygen respiration use the same compound range as obligate anaerobes in an anoxic environment. The methanogens and obligate anaerobic groups could have contained gene families associated with more ancient metabolisms on the strictly anoxic early Earth, whereas facultative aerobes and the group of obligate aerobes containing gene families associated with metabolisms that evolved after O2 became abundant. These four groups (Table 1 and Supplementary Table 1) of proteome data provide us with sets of genes associated with different respiratory lifestyles, in which we look for genetic similarities and differences to inspect energy metabolism derived genome evolution. To do so, pan-proteome sequence similarity networks (see Figure 1) derived from the 84 proteomes were labeled by the four redox groups. These networks offer both a local and a broad-scale perspective on similarities and differences between sequences found in each of these groups. Our hypothesis is that networks allow us to quantify primary sequences conservation (based on the amount of preserved connections between putative homologs from a particular redox class) and to estimate the specificity of sequences associated with a given lifestyle (based on the fact that sequences from a particular redox class preferentially connect in the graph). In particular, sequence similarity networks may unravel high levels of primary sequences conservation and high levels of preferential connection for organisms with some lifestyles, especially for broadly distributed, hence likely ancient, gene families (core genes). With the major goal of quantifying whether differences in lifestyles correlated with such detectable genetic changes, we identified two major evolutionary events that are identifiable in the core genes of extant prokaryote proteomes.
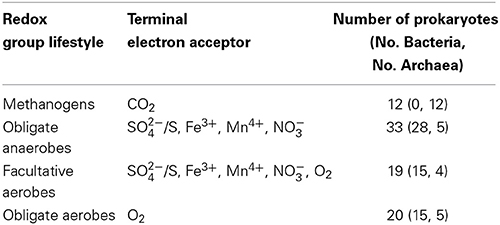
Table 1. The 84 prokaryote genomes classified into four groups of redox lifestyles that were used as input for this study.
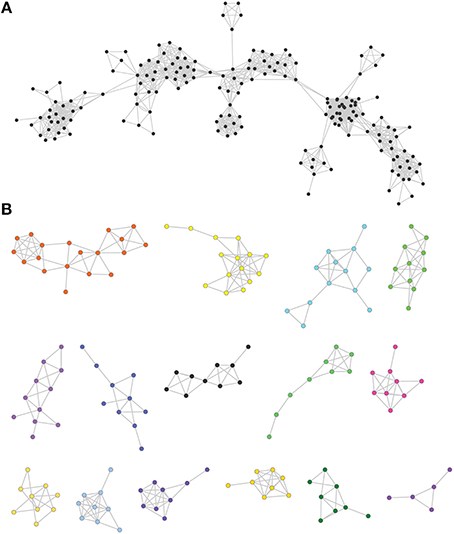
Figure 1. Examples of protein similarity networks. (A) An example of a principal connected component. (B) Examples of smaller connected components generated using network analysis.
Despite their strengths, it is important to note that sequence similarity networks are not phylogenies; i.e., they do not identify ancestral nodes or generate nested patterns expected from descent with modification. However, when one considers that the sequences under study evolved under a tree-like process, one could make explicit such an implicit phylogenetic structure underlying a sequence similarity network. This transformation from network to tree is described in papers such as Atkinson et al. (2009), Zhang et al. (2011), and Beaudet et al. (2013) which show that analysis of network modularity can provide rapid and relatively robust proxies for phylogenetic trees. We did not, however, exploit this property of networks in the current work.
Materials and Methods
Choice of Taxa
The 84 prokaryote genomes that had information available on selected terminal electron acceptors comprised 26 archaebacteria and 58 eubacteria that were classified into the following four putative redox-related groups: 20 obligate aerobes (OA), 19 facultative anaerobes (FA), 33 obligate anaerobes (OAN), and 12 methanogens (M; Table 1). These groups were selected to approximate the gene pools present in the major respiratory communities that evolved during the Archean eon. The methanogens were dealt with separately because of their highly specialized metabolism within archaebacteria. The obligate anaerobe group contains genes presumably associated with an ancient metabolism on the strictly anoxic early Earth, whereas the facultative aerobic and obligate aerobe groups contain genes associated with metabolisms that evolved after O2 became available. To gain a relatively unbiased sampling of the tree of life and to avoid oversampling particular, well-studied lineages, we used the 16S rDNA to identify sets of genomes with comparable phylogenetic divergences. Using this approach we included distinct taxa (i.e., excluding closely related sister groups) that have an equivalent pairwise sequence divergence (Kimura 2-parameter model) in the rDNA distance matrix (Supplementary Figure 1A). The mean and standard deviation of pairwise evolutionary distance across the 84 genomes was relatively uniform (0.26 ± 0.08; Supplementary Figure 1B), suggesting that we had sampled taxa with comparable genetic divergences within the tree of prokaryotes.
Proteome Networks
The program EGN (Halary et al., 2013) was used to calculate network parameters for all 84 selected genome-derived proteomes. The network edges in our analyses were established using the following criteria: protein sequence identity ≥40%, hit length must correspond to ≥20% of the smallest homolog, minimal hit length in amino acids is 25, and a BLASTP score <1e-5. Edges in homology-like networks were generated when the mutual match coverage (MMC) for a pair of sequences was ≥90, or 80, or 70% of both sequence lengths. Proteins were annotated using RPS-BLAST (Marchler-Bauer et al., 2011) against the TIGRFAMs database (Haft et al., 2003) with an e-value threshold of 1e-10. We also studied the distribution of proteins in the six EC classes (i.e., EC1: oxidoreductases, EC2: transferases, EC3: hydrolases, EC4: lyases, EC5: isomerases, and EC6: ligases) in the partial similarity and homology-like networks (see below). Random proteome sequence similarity networks were generated by randomly sampling the given distribution of four groups in each component, thus preserving the size of components and the frequencies of each group's label in the component.
Definition of Edges in Homology-Like Networks
Sequence similarity networks were composed of ranked connected components with the first component containing the largest number of protein sequences. We initially constructed the network using proteins with a minimum identity of 40% in which the MMC was ≥90% of the sequence lengths. We consider as putative homologs the members of a cluster of proteins identified by the BLASTP search, in which any pair of directly connected proteins could be aligned with one another over at least 90% of their individual lengths. Therefore, no true phylogenetic method was applied to define homology. This MMC cut-off resulted in edges in homology-like networks that limited the networks to putative homologs, removing almost half of the proteins from the original networks (see distribution of EC classes in these networks in Supplementary Figure 2). This network contained 20,518 components with a total of 128,726 proteins. More stringent protein sequence identity thresholds yielded networks with fewer connected proteins (i.e., fewer edges). However, ≥40% sequence identity could be used as a reasonable threshold to transfer the first three digits of an EC number and functional annotation (Tian and Skolnick, 2003). Therefore our definition of putative homologs provides a reasonable tradeoff between a sufficient number of proteins being included in components and the existence of biologically meaningful edges (i.e., a putative ancient shared function or ancestry). Our analyses are based on homology-like networks except EC1-specific cluster detection with respect to domain-associated evolutionary patterns.
Other Edges in (Partial) Similarity Networks
We also considered the sequence similarity network resulting from “partial homology” edges, that is, with no limit regarding MMC. In this more inclusive sequence similarity network (Haggerty et al., 2014; Jachiet et al., 2014), edges can correspond to a short region of a sequence such as shared (or conserved) functional domains. Therefore, when a pair of sequences display significant BLASTP similarity but cannot be aligned with each other over a significant proportion of their lengths, we note that this approach only provides information about partial similarities (i.e., not homology in the classic sense, using phylogenetics). These hits correspond to short regions of a sequence that may or may not represent shared functional domains, as well as inter-domains or terminal regions, which may not be related to function (e.g., active sites or regions important for macromolecular processes). Allowing this type of sharing of shorter DNA fragments in the network resulted in the union of several distinct components from the homology-like network into a single one. In fact, the (partial) similarity network exhibits 19,609 components, with a large, principal one (i.e., the giant connected component; GCC) grouping 9784 sequences. The EC1 content of this component was analyzed using cluster detection.
Test Networks
This analysis focused on testing several properties of the sequences, such as group composition, lengths, and the statistical validity of some indices. To this end, several other sequence similarity networks were built, relaxing the MMC criterion (hit coverage) from 90 to 80%, and finally to 70% in homology-like networks. No further analysis was done on these relaxed networks, and the present work focuses solely on homology and (partial) similarity network as described in the previous paragraphs.
Cluster Detection
We used the heuristic method that is based on modularity optimization (Blondel et al., 2008) to define clusters in the two largest components, from the 84 proteome-wide homology-like networks only (for group-specific representation) and with all (both [partial] similarity and homology-like) edges (for EC1-specific representation), respectively. Nodes in a given cluster are more connected to nodes of that cluster than to nodes outside the cluster. Moreover, this method provides a hierarchical cluster structure for the network, thereby giving access to different levels of resolution of cluster detection. We visualized the cluster structures provided by the algorithm at the first level (i.e., the most fine-grained resolution).
Core-Shell Components
Using the homology-like networks, we defined the core-shell classes of components based on percentages of all four groups of genomes present in the component. We did the relevant calculation using three given percentages (20, 50, and 80%). For example, the 80%-core components are those that included sequences from at least 80% of the genomes within each redox group, that is, at least 10 (for methanogens), 27 (for obligate anaerobes), 16 (for facultative aerobes) and 16 (for obligate aerobes) genomes included in the core component. Consequently, the remaining components were considered as 80%-shell components. There were 239, 106, and 39 core components for the 20, 50 and 80% core-shell splits, respectively.
Please note that with our current approach, evolutionary time can only be roughly approximated as a function of percent identity between sequences; i.e., the most similar sequences (e.g., with 100% identity) have likely diverged more recently than sequences that are less similar. Sequences in core components show low percent identity (e.g., 48% on average in the ≥40% identity homology-like network). These core functions are also likely to be more “ancient” because they are distributed across different redox groups by virtue of their conserved functions. Beyond this sort of inference about the age of gene families, we did not attempt to place a time framework for our network results; i.e., they show distributions but do not lead to inference of evolutionary time (i.e., as in David and Alm, 2011).
Normalized Counts of Edges in Homology-Like Networks in Intra- and Inter-Group Comparisons
Normalized edge counts in homology-like networks between pairwise proteins within group i (I = 1, 2, 3, 4) was the total number of edges in homology-like networks connecting proteins of group i (denoted Eij) divided by the number of all possible pairwise edges (i.e., ) where Ni is the number of proteins of group i present in the network or in a connected component. Normalized edge counts between groups i and j (i = 1, 2, 3, 4, i ≠ j) was the total number of edges connecting proteins of groups i and j (denoted Eij) divided by the number of possible edges between proteins of groups i and j; i.e., . Normalized edge counts of both intra- and inter-groups range between 0 and 1.
Group-Based Conductance
We calculated the group-based conductance as in Halary et al. (2010) for the core connected components reflecting putative homology (70 and 90% MMC) and partial similarity (no coverage threshold) networks with respect to the four redox groups: i.e., proteins were labeled by the group identity (i.e., methanogens, obligate anaerobes, facultative aerobes, obligate aerobes) of their corresponding genome. We used the formula in Leskovec et al. (2008): , where Eij is the number inter-group edges (from group i to any other group j), Eij is the number of intra-group edges, and Ei· is the number of edges that has node of group i as the ending or starting node. We also determined “cross group” conductance by defining groups that combine two labels. For example, the level of conductance of the methanogen and obligate anaerobe is reported as M + OAN. Random label simulations show that the conductance level is biased by the number of nodes, therefore it is not possible to test directly if group A shows more or less conductance than group B. However, for a given distribution (e.g., the conductance values for methanogens, computed over all core components), the difference between the real values and randomized simulation values indicate if the label (e.g., methanogens) exhibits a conductance that is lower than expected by chance (the random group simulations where gene labels had been shuffled). A conductance lower than expected by chance indicates that nodes of the given label are significantly more connected to themselves than to any other group.
Results and Discussion
Protein Similarity Networks as a Complement to Phylogenetic Approaches
Sequence similarity networks tools are of growing importance because they allow comparative analysis of massive datasets without the need for multiple sequence alignments (Yona et al., 2000; Frickey and Lupas, 2004; Atkinson et al., 2009; Bapteste et al., 2012, 2013). This is a major advantage because alignment and phylogenetic analysis of as few as 10,000 sequences becomes computationally demanding, leading to errors and poor resolution of nodes. This is caused by the decreasing number of phylogenetically informative sites in an alignment as sequence numbers rise (Frickey and Lupas, 2004). Sequence similarity networks allow the analysis of very large datasets and they become more reliable as datasets increases in size because the larger number of pairwise relationships resolved within networks leads to a more accurate placement of sequences among putative homologs (Frickey and Lupas, 2004).
The recognition that sequence similarity can be used to generate informative large-scale maps of genetic diversity is attributed to Tatusov et al. (1997). These maps were first used to provide a framework for gene classification (Tatusov et al., 1997), in which natural groups that have likely evolved from a single ancestral gene and preserved their function in their different hosts were defined. Therefore, whereas these graphs presented a global view of motif conservation across sequences due to the combination of both tree-like and non-tree-like evolution of the sequences, the networks were often analyzed using clustering methods to identify “natural” homologous families with a tree-like evolution. In contrast, superfamilies and higher groups showing similarities between sequences were less systematically explored (Sasson et al., 2003; Atkinson et al., 2009; Matsui et al., 2013; Rappoport et al., 2013). The outcome was that total sequence space was not exploited but rather the network structure was used to focus on local regions such as clusters, and more rarely families of motifs, superfamilies, or larger sets (Matsui et al., 2013). Here we adopt not only the clustering perspective (when we construct homology-like networks with ≥90 or ≥70% coverage, see Methods) but also explicitly use the global organization of sequence similarity maps to quantify the similarity between all sequences present in each respiratory group (when we relax this coverage condition in (partial) similarity networks). This allows us to gain insights into the evolutionary processes that generated sequences diversity (Camoglu et al., 2006). Simply put, we compare genetic diversity of sequences found in different redox classes of organisms and inspect whether these sequences are co-localized on the networks and their topological properties, using a measure called conductance which quantifies whether sequences from the same redox groups preferentially connect together. This approach is significantly different from, and complementary with, previous work done by David and Alm (2011) that relied on phylogenetic methods to generate a specific timeline for protein family evolution that spanned the GOE. Sequence similarity networks by their nature do not provide a direction to evolution but rather represent the simultaneous relationships of all proteins that fulfill a particular pairwise BLAST cut-off value. In particular, they allow to test whether the maximum amount of possible connections between putative homologs from a given redox group is realized in the network. If not, a lesser number of connections indicate a greater divergence between these putative homologs than that used to define the minimal similarity threshold. In other words, low values of this index for a tested group suggest major changes in primary sequences within such group. Therefore, by addressing a broader evolutionary scale than is usually possible with phylogenetic trees, networks can reveal whether microbial genomes with a given lifestyle encode families and superfamilies of sequences that are similar to each other and presumably reflect the same evolutionary processes in terms of sequence divergence.
Interpreting Sequence Similarity Networks
In sequence similarity networks, each node (circle) represents a protein sequence from the dataset. Two nodes are connected by an edge (a line linking two nodes) if the pair of sequences fulfills chosen similarity criteria such as percentage identity and coverage (i.e., the ratio between the length of the matching parts and the total length of any two sequences). These criteria are applied in a BLAST all-versus-all analysis to produce a table of pairwise hits. Sequence similarity networks are displayed and analyzed as a set of connected components, that is, a partition of the network into sets of nodes for which there is an interconnecting path. This partition defines groups of putative homologous sequences or gene families, when the coverage between sequences is high. Selecting different criteria (i.e., BLAST cut-offs) will produce different networks and components from the same dataset. A stringent criterion (high percent protein identity, high MMC) will result in numerous, small, connected components of very similar sequences. A lower threshold will result in larger components (presumably representing more ancient relationships) being identified among the sequences.
Partial similarity edges (introduced while lowering the minimal coverage and similarity thresholds) also usually results in a significant fraction of the sequences forming a single principal connected component (Figure 1A), because partial similarity between sequences created for example by domain sharing introduces additional connections between the nodes of the network (Haggerty et al., 2014), along with several very small other connected components (Figure 1B). In this principle component, clustering methods are used to define subgraphs (parts of the component) that are densely connected and can be thought of as gene families. Therefore, using different thresholds, connected components take on different sizes (e.g., different numbers of elements and edges) and shapes (e.g., different topologies) that reflect different outcomes of the evolutionary process (see Figure 2 for an illustration of how protein evolution can affect network structure). Within a given component, nodes have different relationships that can be quantified using several topological coefficients (e.g., high primary sequence conservation associated with a lifestyle producing high levels of preserved connections, and eventually high levels of preferential connections). However, it should be noted that our analysis was not intended to dissect the distribution of domains in multi-domain proteins. Nor was it meant to study horizontal gene transfer or to elucidate the distribution of sequence motifs in proteins (see Figure 2).
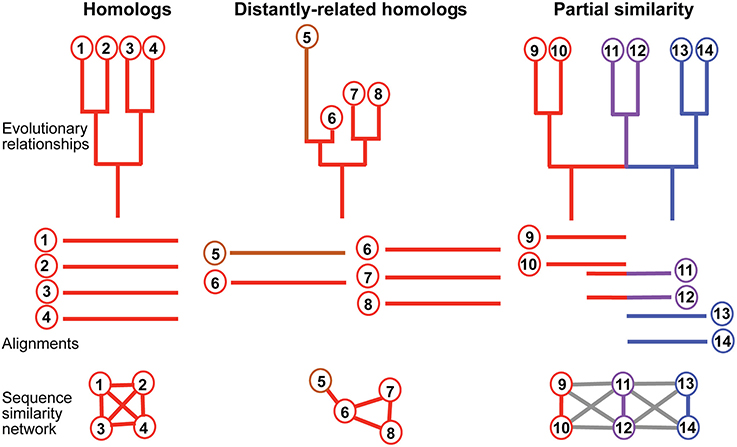
Figure 2. Relationship between phylogenetic structure and network output. Phylogenetic structures describing evolutionary relationships between sequences (nodes). Top panel, from left to right: phylogenetic trees and a 2-rooted network. Edges are colored to reflect its lineage of origin, to the exception of the fast evolving sequence 5, colored in brown. Composite sequences 11 and 12 are in purple. Middle panel: corresponding alignments that could be realized for sequences with such relationships. 5 is too divergent from 7 and 8 to be aligned simultaneously with them, but 6 is not. Bottom panel: corresponding sequence similarity networks. Red, blue and purple edges indicate homology-like connections, gray edges indicate a partial similarity between connected nodes.
It should also be remembered that ancient relationships, such as putative “deep-time” homology are notoriously difficult to uncover using sequence similarity alone (e.g., Bolten et al., 2001; Sober and Steel, 2002; Collins et al., 2003). Therefore, it is expected that many genuine, ancient connections between proteins will not be recovered in our sequence similarity networks. Furthermore, because the traces of ancient relationships tend to be erased, some of the observed network connections may correspond to relatively recent history. In this case, the events of diversification we describe may be more recent than we suggest here. It is clear that oxygen levels have climbed to considerably higher levels in our planet when compared to the levels achieved by the GOE, and this could have impacted the sequence make-up in a very defined manner that is not apparent to us. Nonetheless, we do not favor this alternative interpretation of the network data because our analyses focused on the loss of connections within core gene families; i.e., families present across all (or most) taxa under consideration. Hence these connections were likely present early on in evolution, suggesting that at least for these families, some ancient relationships were not lost and could still be detected and analyzed.
Finally, one could be concerned that archaebacterial sequences, on average shorter than eubacterial sequences, may behave differently from eubacterial sequences for the coverage threshold used in our analysis. We investigated this possible issue by analyzing the sequence length of the core gene families for three networks: i.e., two homology-like networks (using 90 and 70% coverage thresholds) and the (partial) similarity network, where no coverage threshold was applied. The results of this analysis (Supplementary Figure 3) show that using either the 90 or 70% sequence coverage threshold, archaebacterial sequences lengths from group 1 (i.e., only archaebacterial data) are not significantly different than sequences from other groups. Thus, difference in sequence size cannot be invoked to explain their highly conserved and preferential connections. Only the analysis using the (partial) similarity network (no coverage threshold) shows that sequences from a single archaebacterial phylum (Crenarchaeota) are shorter than the other sequences in this network (see the GCC result in Supplementary Figure 4). This difference is also reflected at the level of redox group membership, with group 1 exhibiting shorter sequences than the others. However, these differences do not concern core gene families in homology-like networks, therefore these shorter sequences do not bias our topological indexes (neither sequence conservation nor conductance measures). Supplementary Figures 3, 4 show that no significant difference in sequence lengths is observed for taxonomic groups for these gene families.
One could however still be concerned that discarding shorter sequences from core gene families constrains archaebacterial sequences to a single phylum; i.e., thereby introducing a strong phylogenetic signal in our network. This is not the case because sequences from both archaebacterial phyla in our analysis are present at 90 and 70% coverage thresholds. In fact, because archaebacterial sequences are present in the four redox groups, we could compare sequences lengths at the phylum rather than the group level (see Supplementary Figure 4). Again, at 90 or 70% coverage, the two archaebacterial phyla did not exhibit markedly different sequence lengths when compared to other phyla. Taken together, these observations support interpretations other than taxonomic origin or length bias as explanation for the significant differences in the patterns of connections between putative homologs in core gene families belonging to different redox groups.
We also addressed the potential impact of recent HGT on our sequence similarity networks by studying all proteins within the most inclusive network that had a protein identity >90%. Such a high similarity between sequences from different taxa may indicate recent genetic exchanges, because the average sequence identity among all the proteomes arising from the different genomes was 48.4% with a maximum value of 67.3% mean protein identity between any two genomes. In contrast, our analysis shows that only 0.83% of the edges was shared at >90% protein identity. This value may be considered an estimate of the maximum extent of potential, recent HGTs in our network. Given this low number, we surmise that edges resulting from recent HGTs make a minor contribution to our network results. This outcome make sense given that we took care in our approach to sample distantly related lineages from the prokaryotic tree of life.
Pan-Proteome Networks of the Four Respiratory Communities
Here the selected 84 proteomes were labeled according to their redox group designation and homology-like networks were constructed from these data (e.g., Halary et al., 2010; Beauregard-Racine et al., 2011; Bapteste et al., 2012). Summary statistics of networks at different thresholds (cut-offs) of sequence identity are shown in Supplementary Table 2. We operated under the hypothesis that putative homologs with the highest protein sequence identity (i.e., 100%) are likely to be more closely related than ones with lower identity (e.g., sequences with only 50% identity; Dagan et al., 2008; Halary et al., 2010). Therefore, we assumed that sequences that had less time to diverge would be more similar than sequences that could accumulate mutations for a longer period. Under that hypothesis, the ≥40% identity homology-like networks used here include proteins that share more ancient relationships than the 100% identity networks. The detection of putative homologs or “cluster of homologous genes” (Halary et al., 2010) in the 84 prokaryotes resulted in the two principal components being composed of 1759 and 540 proteins. Given the complexity of this dataset, we focused on these principal components and analyzed them primarily through the lens of EC1 enzyme distribution because these are most relevant to our goal of understanding redox transitions over evolutionary time. For reference however, the distribution of the different EC enzyme classes in the homology-like networks i (Supplementary Figure 2) shows that ca. 30% of annotated EC enzymes fall in the EC1 class.
We first analyzed the structure and content of the two largest graphs using non-overlapping clusters that are exclusive, densely connected regions (e.g., distinct strongly connected subgraphs within a network; Blondel et al., 2008). These clusters identified 51 first-level clusters of different sizes in the largest component (Figure 3A). The densely connected clusters (i.e., pie-charts) of the networks that include the four redox groups are predominant with respect to clusters comprised of a single redox group. This suggests that prokaryotic (archaebacterial and eubacterial) proteomes share many anciently derived putative homologs that evolved before the split of these two domains of life. With the thresholds used here, we did not detect a bias that would lead to exclusion of a domain or lifestyle from our sequence similarity networks (e.g., Lapierre and Gogarten, 2009). Therefore, our approach allows the comparison of patterns of connections between putative homologs from organisms belonging to different redox classes.
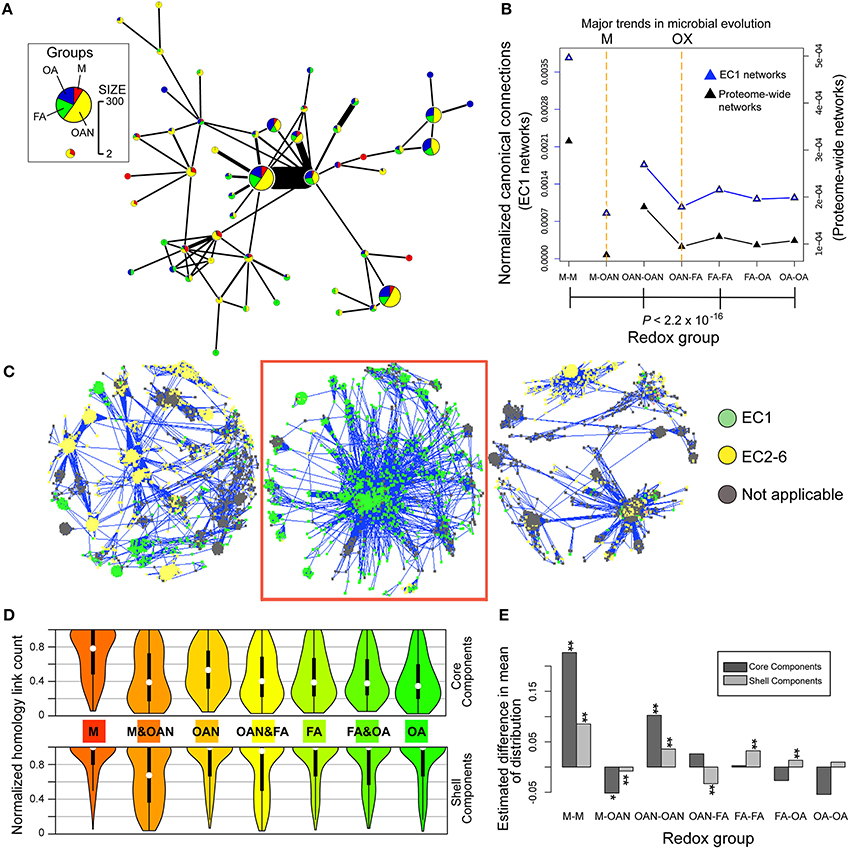
Figure 3. Results of homology-like network analysis of prokaryotic proteomes. (A) Protein clusters (Louvain communities) distribution of the largest component composed of 1759 sequences in our sample of 84 prokaryote genomes. This result demonstrates that the largest clusters include members of all four redox groups (1: M, methanogens; 2: OAN, obligate anaerobes; 3: FA, facultative aerobes; 4: OA, obligate aerobes). (B) Decreased normalized canonical connections (P = 2.2 × 10⁻¹⁶, chi-square test) in the total proteome networks (black triangles) across the four redox groups, shows the existence of two transitions in microbial lifestyles. The first is from a methanogenic (M event) to a non-methanogenic anaerobic lifestyle and the second is from an anaerobic to an aerobic lifestyle across the OX event. The same pattern of normalized canonical connections is found for EC1 networks (in which only EC1 enzymes were used, blue triangles). (C) Three large components found in the 84-genome protein network. Edges in homology-like networks between pairs of proteins in the network are shown as blue lines. The proteins are colored according to their membership in the six EC categories. The boxed component is EC1.1.1.100 (3-oxoacyl-[acyl-carrier-protein] reductases). (D) Homology-family-based normalized connection counts for core components (upper half of panel) and shell components (lower half of panel) at 80% core/shell separation. These violin plots show the median as a white dot, a vertical black thick line is used to indicate 50% of the median values and the symmetrical smoothed density curve of the distribution. (E) Analysis of the significance of the homology-family-based normalized connection counts as measured by the difference in the mean of the distribution between the actual data and simulated data from 100 random networks (*0.005 < P < 0.05, **P < 0.005, Kolmogorov–Smirnov test).
We then checked that the MMC (see Methods) condition used to construct our homology-like networks was not introducing a bias in the detection of connections between putative homologs. High MMC (i.e., 90%) means that any connected sequence can be aligned with respect to ≥90% of its length with its direct neighbor in the graph. For this reason, this threshold guarantees that directly connected sequences are putative homologs, because they are defined by more than partial similarities with one another. These latter similarities, for example, caused by domain sharing would typically result in lower MMC values between sequences. Therefore, when the MMC condition is enforced, sequences with greatly different lengths will not connect directly with each other; i.e., at 90% MMC, the lengths of direct neighbors cannot differ by more than 10%; at 70% MMC, the lengths of direct neighbors cannot differ by more than 30%. This is an important property of our graphs, because large variations in size for homologous sequences would prevent the direct connection of putative homologs with widely different lengths.
This property helps us to interpret patterns of connections in our graphs. A lack of direct connection between sequences belonging to different redox groups may indicate significant differences in sequence length associated with a given lifestyle. In contrast, high conservation of direct connections between sequences from the same redox group may indicate that no detectable length variation in its gene families occurred during the evolution of this group. However, some differences in sequences length between taxa may also result from their different phylogenetic histories. If closely related taxa tend to host homologs with more similar lengths (e.g., Brocchieri and Karlin, 2005), a genealogical signal would impact the structure of our graphs. Should homolog sizes differ greatly between distinct taxonomic groups (e.g., archaebacteria and eubacteria), these variations could produce preferential connections between closely related taxa for reasons reflecting their phylogenetic history rather than lifestyle adaptations. This hypothetical situation would make the interpretation of the topology of shell genes particularly problematic, for example those exclusively found in group 1 (methanogens), because it might not be possible to determine whether preferential conserved connections between these homologs have causes rooted in shared genealogy or in the shared lifestyle of these taxa (or both).
Yet, shell gene families were not used as evidence to make our claims regarding sequence conservation and conductance measures within and between redox groups. We relied instead on the topological analysis of core gene families, in which organisms from all taxonomic classes and redox groups are represented, and for which we tested that sequences from different redox and taxonomic groups did not show unequal lengths (see above).
Genetic Diversification Events Inferred by Loss of Canonical Connections
We tested whether putative homologs in organisms associated with different redox groups had comparable conservation of their primary sequences, and, if not, whether putative homologs from organisms from different redox classes showed markedly different levels of sequence conservation. We reasoned that at least some widely shared gene families are possibly of ancient provenance, with members that diverged from an ancestral sequence. Consistent with this idea, limited divergence from such a canonical sequence would preserve similarity between putative homologs, and introduce edges in our homology-like networks. To quantify the potential impact of redox conditions on prokaryote genomes, we calculated a normalized value for the proportion of edges in homology-like networks [i.e., MMC (initially) ≥90% of sequence length (see Methods)] between sequences from each redox group and from different redox groups in the homology-like network. Here, core genes would typically have a value of 1, because they are shared (with sufficiently preserved primary sequences) by all genomes. These values, referred to as normalized canonical connections, were calculated for all proteins or only for EC1 enzymes using both intra- and inter-redox group comparisons. The results of this analysis for all proteins suggested two major evolutionary events, characterized by a significant decrease (P < 2.2 × 10⁻¹⁶, chi-square test) in the number of canonical connections within the proteomes of obligate anaerobes, facultative aerobes, and obligate aerobes when compared to methanogens (we refer to this as the “M” event) and within the two aerobic groups (facultative aerobes and obligate aerobes) when compared to proteomes derived from taxa that grow in anoxic environments (i.e., methanogens and obligate anaerobes; we refer to this as the “OX” event; Figure 3B and Supplementary Figure 5). The OX event is explained by the presence of canonical connections that are unique and relatively conserved in primary sequence in anaerobic taxa. This pattern also held for EC1 enzymes. Examination of EC1 dominated components and the tightly clustered EC1 enzymes (Figure 3C) shows they are involved in conserved metabolic pathways of fatty acid and phospholipid metabolism, central intermediary metabolism, amino acid biosynthesis, and energy metabolism. We attempted to avoid potential biases associated with edge counts in homology-like networks based on the stringent length coverage of ≥90% for any pair of connected sequences that defines an edge in these networks and which may result in biased connections between sequences toward one group (e.g., if protein lengths varied in genomes as a result of the transition to an oxidizing atmosphere). This was accomplished by relaxing the coverage criterion to ≥80 and to ≥70%. These changes did not however impact appreciably the differences in canonical connection counts across the four groups (Supplementary Figure 5B).
What events could have produced such a loss in canonical connections? In homology-like networks, two sequences are directly connected when they align over at least 70, 80, or 90% of their entire length. Connections between putative homologs can then be lost if some (not all) of the sequences were significantly reduced or increased in length. This could result, for example if inter-domain linker sequences, perhaps associated with the intrinsic disorder of proteins, grew or shrunk in size. Gene remodeling resulting in the reordering of domains would also eliminate the connection, because two sequences with similar domains in a different order would not align over >70–90% of their lengths. Gradual divergence, modifying the primary sequences beyond the chosen threshold of similarity (here ≥40% identity) would also result in the loss of a canonical connection between putative homologs. Only structural analyses that investigate the topology of proteins, or fine-grained analyses of highly conserved motifs associated with molecular functions may be able to substantiate such instances of deep-time homology. Regardless of its cause, we surmise that a lack of connection corresponds to a significant genetic change for these gene families.
To gain more detailed insights into patterns of sequence conservation in families of putative homologs, we distinguished between “core” and “shell” families (components) based on percent representation of taxa from the four redox groups in each component. Core homologs were broadly distributed across the redox groups, often with conserved functions (e.g., replication, translation, and energy homeostasis) (Lapierre and Gogarten, 2009; Korona, 2011). We do not infer that these core genes comprise a minimal prokaryote genome, but rather they share the particular network characteristic of being broadly distributed across all taxa during prokaryote evolution (and therefore may code for general cellular functions rather than for adaptations to a particular lifestyle). Normalized edge counts in homology-like networks per component for both intra- and inter-redox group comparisons were calculated for the distribution of the data at 80% core/shell separation (Figure 3D; see Supplementary Figure 6 for results of analysis using 50 and 20% core/shell separations). These results also reveal a significant decrease (P < 0.001, Kolmogorov–Smirnov test) in the number of canonical sequence connections from methanogens to obligate aerobes in core components (Figure 3D, upper part of panel). Notably, only in the core methanogen group did the peak of the data distribution approach 1 (i.e., complete set of connections), suggesting substantial sequence conservation of proteins in these anaerobes. In terms of the OX event, core sequences within groups with anaerobic lifestyles (obligate anaerobes, facultative aerobes) had significantly greater mean canonical connections than in control, randomized networks (Figure 3E). This surprising result indicates a divergence affecting even anciently derived core homologs that were presumably under high evolutionary constraint that correlates with the two diversification events in prokaryotic lifestyles. This is unexpected because their wide distribution across taxa suggests that such core genes are not likely to be involved in specific adaptations to a respiratory lifestyle. In contrast, shell sequences maintained a high number of connections within all four redox groups (Figure 3D, lower part of panel) consistent with the notion that adaptation to a new lifestyle can involve the gain or the selection of group-specific gene families.
It is one thing to measure the extent of primary conservation of sequences within a redox class, but it is yet another thing to test whether sequences associated with a given lifestyle are distinguishable from their putative homologs associated with another lifestyle. If putative homologs from organisms belonging to distinct redox groups are not randomly mixed, but occupy different regions of the graph describing similarities for their gene family, a structure will be detectable in individual connected component. Namely, sequences displaying distinctive molecular features will connect with one another in these graphs more than they will connect to sequences associated with different lifestyles, because these latter lack typical network “signatures” for the tested redox group. We searched for such structure using group-based conductance. These analyses were done for the connected components that reflected homology (i.e., 90% coverage threshold, ≥40% protein similarity). First, for each component, we computed the conductance of sequences from different redox classes and groups of redox classes. Second, we computed the conductance of these groups, for the same component, for sequences with randomized labels. Sequences from a group connect preferentially together with some significance when their conductance is significantly lower than the conductance obtained for their corresponding groups of randomized sequences. Remarkably, sequences from the M group had significantly lower conductance indicating these sequences present distinguishable features from sequences from the other groups (a possible result of the “M” event) (see Figure 4). The same was true for sequences from the OAN groups, as well as for sequences from the (M + OAN) groups considered together (a possible result of the “OX” event), showing that sequences from anaerobic organisms were markedly distinguishable from sequences in aerobic organisms in our networks. This structure in our graphs; e.g., the fact that sequences in anaerobes and aerobes tend to be more dissimilar than similar with one another, was confirmed by the significantly low conductance from sequences from the FA group and from the (FA + OA) groups considered together, isolating these sequences from their putative homologs in M and AON organisms. Finally, we addressed the potential for phylogenetic bias for the M group given that all of its members are derived from one phylogenetic group, the archaebacteria. Here we calculated conductance for the methanogens alone versus the non-methanogenic archaebacteria and found that both have very similar medians and ranges (i.e., non-significant differences), suggesting that methanogenesis does not bias the results any more than would be expected for other archaebacterial lifestyles (see Supplementary Figure 7).
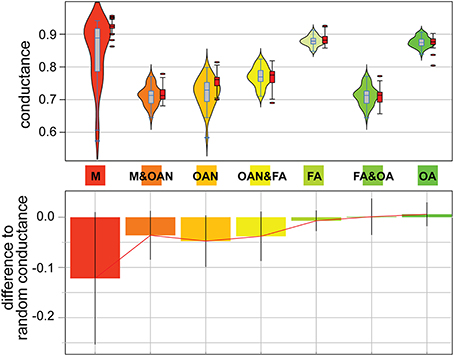
Figure 4. Analysis of network conductance. Group-based conductance distributions (upper panels) for core components of the four redox groups under study (M, methanogens; OAN, obligate anaerobes; FA, facultative aerobes; OA, obligate aerobes) and 3 pairs of combined groups. Violin plots use blue outlined rectangles (black for an example simulation for each group), a line to indicate the median, a vertical gray box (red for simulations) to show 50% of the median values, and a symmetrical smoothed density curve that shows the distribution of the data. Outliers to the experimental and randomized distributions are shown as ovals. The lower panel shows the difference in mean values between the experimental and the randomized data (using 1000 simulations) that employ random labeling.
Role of EC1 Enzymes in the M and OX Events
What evolutionary processes explain the two major genetic diversification events in microbial life identified here? Although a challenging issue to address, inspection of enzymatic electron transfer reactions is likely to provide important insights into this problem. Regardless of efficiency of energy release, all redox lifestyles examined in this work rely on an electron transfer chain whose terminal electron acceptors have been specified (Table 1). Enrichment analysis of the catalysts (EC1 enzymes) present in the (partial) similarity network reveals that the loss of canonical protein connections in groups was balanced by increased use of oxidoreductases with a broader array of electron donors/acceptors (Figure 5). This indicates that a series of electron and proton transfer molecules have significantly contributed to the development of redox lifestyles. For example, representation of the highly conserved enzyme nitrogenase (included in EC 1.18.6 in Figure 5) that is involved in nitrogen fixation is significantly reduced at the M event, whereas, as expected, cytochrome c oxidase (included in EC 1.9.3 in Figure 5), the last enzyme transferring electrons to molecular oxygen in the respiratory electron transport chain, shows increasing representation in the two groups of aerobes. Strikingly, the oxygen-dependent EC1 enzymes, but not all EC1 enzymes (Supplementary Figure 8), exhibit a marked difference (P < 2.2 × 10⁻¹⁶, chi-square test; Figure 5 green, bordered area) with respect to the OX event, consistent with the phylogenetic analysis of David and Alm (2011). Many of the enzymes (i.e., genes and gene families) that are responsible for electron transfer and participate in respiratory pathways emerged under strictly anaerobic conditions but expanded after the GOE.
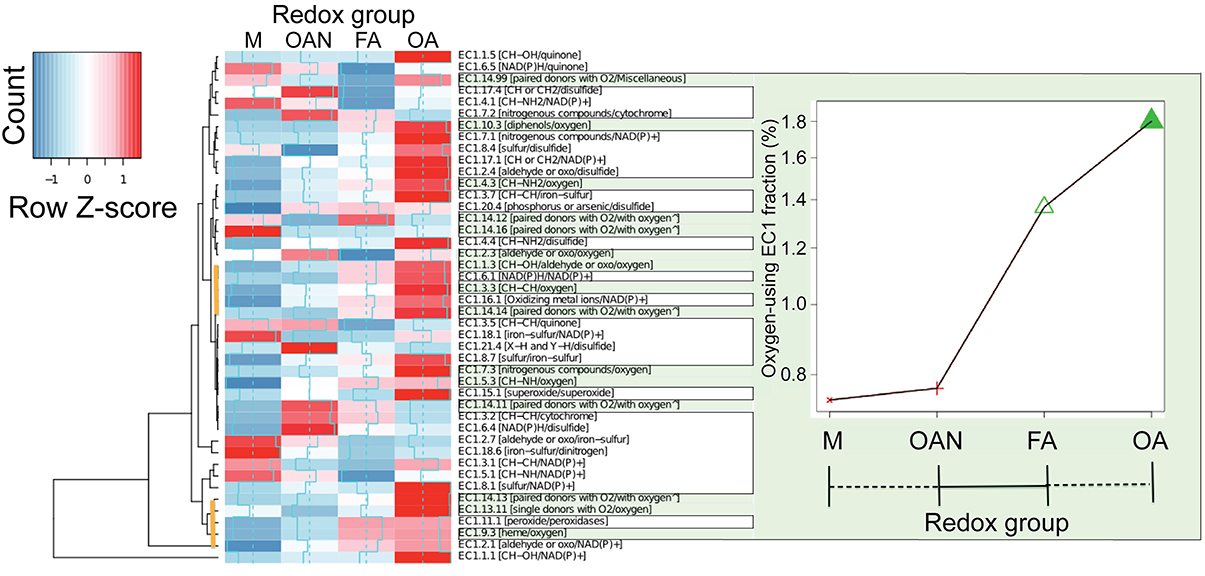
Figure 5. Distribution of EC1 enzymes across the four redox groups. The occurrence and abundance of EC1 enzymes (showing three digits of the EC numbers followed by the electron donors/acceptors in square brackets) across the two major microbial lifestyle transitions described in the text (M, methanogens; OAN, obligate anaerobes; FA, facultative aerobes; OA, obligate aerobes). The values are normalized by dividing by the number of proteins present in the (partial) similarity network within the four redox groups. Rows are centered and scaled by subtracting the mean of each row divided by the standard deviation (Row Z-score). The ∧ mark indicates the incorporation in the enzyme of one or two atoms of O2. Cumulative values for oxygen-dependent EC1 enzymes (green outlined panel) show significant differences (P = 2.2 × 10⁻¹⁶, chi-square test) only between anaerobic and aerobic groups. Two clusters of EC1 enzymes that provide strong evidence for the anaerobic to aerobic (OX) lifestyle transition are marked with the vertical brown lines in the cluster diagram.
Finally, we used an even more inclusive network, the (partial) similarity network, featuring both homology-like and partial similarities between sequences to investigate whether the extant diversity of EC1 enzymes is derived from variation associated with an ancestral DNA sequence, or whether, in addition to the standard descent with modification pathway, a diversity of different DNA regions had been recruited to build genes that encode extant EC1 enzymes. Indeed, as a first approximation, the two types of edges in this network provide insights into two distinct evolutionary processes: divergence (roughly represented by homology-like edges), and domain sharing, fusion, or fission events (roughly represented by partial similarity edges). We thus tested whether EC1 enzymes were connected by homology-like edges or by partial similarity edges. To allow its visualization, this graph was clustered using Louvain communities (Blondel et al., 2008), whereby nodes represent densely connected regions of sequences (Figure 6). Interestingly, only partial similarity edges linking clusters of EC1 sequences are present in the GCC of this network, indicating the important role of domain recombination in EC1 enzyme evolution, which could have been linked to ancient shifts in trace metal bioavailability (Dupont et al., 2006). Annotations of functions present in the GCC are found in Supplementary Figure 9 and Supplementary Table 3. In addition, EC1-specific cluster analysis reveals that EC1 proteins were not derived from a single ancestral DNA sequence but rather through recruitment from a diverse array of genetic sources, because EC1 sequences occupy indirectly connected regions of the graph. For example, EC 1.12 and EC 1.3.99 have evolved from distinct (i.e., not closely related) DNA sources not involved in catalyzing electron transfer, whereas EC 1.7.2 and EC 1.1.1 have evolved from distinct existing pools of EC1-demarcated sequences. Apparently, the latter pattern predominates in EC1 evolution, whereby distinct cofactor binding domains were frequently recombined, allowing the enzymes to utilize increasingly oxidized substrates with high specificity (Kim et al., 2013). Remarkably, the graph indicates a strong global structure, whereby clusters of EC1 sequences are not randomly distributed over this map of genetic diversity. These enzymes are primarily located in two regions, suggesting that EC1 sequences recombine preferentially with other EC1 sequences; i.e., a group of sequence motifs exist that are shared by EC1 enzymes.
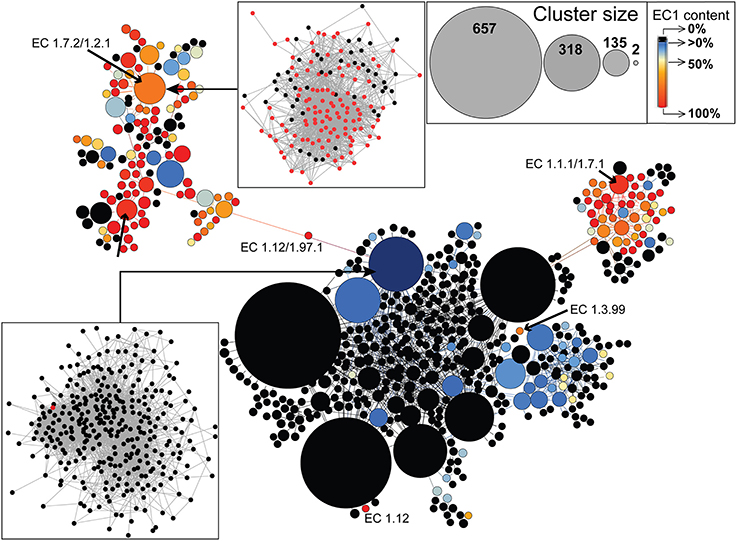
Figure 6. Evolution of EC1 enzymes in prokaryotes. EC1-specific protein cluster distribution for the largest component of the inclusive (partial) similarity network including both homology-like and partial similarity edges. The size of the nodes is proportional to the size of the protein clusters (see top right inset), with black circles indicating the absence of EC1 enzymes, whereas blue to red circles indicate an increasing representation of EC1 enzymes with the darkest red being 100% EC1 representation. The bottom left inset shows a case with only one EC1 enzyme present in the protein cluster, whereas the upper left inset shows a protein cluster with 60% EC1 enzyme representation. Six representative EC1 involved clusters have been annotated to illustrate patterns of gene origin.
To summarize, in this study we hypothesized that extant metabolisms in each of the four redox groups rely on specific shared proteins and protein families (especially EC class 1) associated with them that could allow us to gain insights into ancient genome complements and how evolution acted upon them across a broad range of redox conditions. We recognized of course that extant genomes and gene contents are proxies for ancient lineages; i.e., many of the latter have not left descendants and gene evolution is not “frozen in time.” Nonetheless, natural selection that acted on genes and gene families associated with different microbial lifestyles in the ancient Earth are also expected to apply to modern taxa. The strong influence of HGT assures that adaptive genes would not remain captive in particular lineages of prokaryotes but over time spread into other lineages that share similar selective constraints. Using this framework, application of sequence similarity network methods allowed us to identify two major evolutionary transitions in microbial genomes that reflect the changing redox environment on our planet. The broader implication of our study is to underline the central role of prokaryotes as the ultimate stewards of our planet. Our analysis clearly shows they adapted to massive transitions in the different redox microenvironments. Prokaryotes are highly successful recyclers of genetic material and have redistributed their genomes across countless lineages and made ancient core gene families (i.e., the “classics”) valuable, however dynamic, in the new microbial “market.” Future work extending to a broader group of lifestyles may help decipher the evolutionary history of the full ensemble of microbial-derived electronic circuits (Falkowski et al., 2008).
In terms of methodology, sequence similarity networks allowed us to unravel patterns of connections between sequences, and low or high conductance is one such pattern. In other words, we used our approach first to describe the data (at various levels of stringency, see Supplementary Table 2). We observed that sequences from core gene families associated with some redox groups were more similar with one another than they were to sequences from other redox groups. We proposed a possible biological interpretation for these patterns and similarities. This interpretation was based on the one hand on the notion of descent with modification; i.e. the idea that putative homologs had diverged from a common ancestral sequence, and on the other hand, on the notion that sequences are not randomly distributed in genomes because redox lifestyle and gene content positively correlate with these constraints. We further proposed that organisms with similar lifestyle tend to have similar sequences as the result of a process of sequence divergence driven by geochemical pressures, acting on the genomes, surprisingly including conserved, core gene families. Another much more ambitious way to approach this problem (and clearly a future challenge for network methods) might be to first elaborate a null model of genome and sequence evolution, simulate these genes and genomes, and second to generate null sequence similarity networks for the simulated data. Thereby, topological features (such as modularity) of these null networks could be compared with real sequence similarity networks, such as those presented in this paper.
Author Contributions
Debashish Bhattacharya, Shu Cheng, and Eric Bapteste conceived the research in collaboration with Nathan Yee and Paul Falkowski. Shu Cheng and Slim Karkar generated all of the network analyses and interpreted the results in collaboration with Debashish Bhattacharya, Eric Bapteste, Nathan Yee, and Paul Falkowski. Debashish Bhattacharya and Eric Bapteste wrote the paper in collaboration with Shu Cheng and Slim Karkar.
Conflict of Interest Statement
The authors declare that the research was conducted in the absence of any commercial or financial relationships that could be construed as a potential conflict of interest.
Acknowledgments
This research was funded by the Gordon and Betty Moore Foundation through Grant GBMF2807 awarded to Paul Falkowski and by a grant from Region Ile-de-France to Slim Karkar. Eric Bapteste was funded by the European Research Council under the European Community's Seventh Framework Programme (FP7/2007-2013, Grant Agreement Number 615274). We thank Arik Harel and Debashish Bhattacharya lab members for helpful discussions. We thank Philippe Lopez, Pierre-Alain Jachiet, James McInerney, and Michel Habib for critical discussions about network methods. We are grateful to the reviewers of this manuscript for their constructive comments.
Supplementary Material
The Supplementary Material for this article can be found online at: http://www.frontiersin.org/journal/10.3389/fevo.2014.00072/abstract
References
Atkinson, H. J., Morris, J. H., Ferrin, T. E., and Babbitt, P. C. (2009). Using sequence similarity networks for visualization of relationships across diverse protein superfamilies. PLoS ONE 4:e4345. doi: 10.1371/journal.pone.0004345
Pubmed Abstract | Pubmed Full Text | CrossRef Full Text | Google Scholar
Bapteste, E., Lopez, P., Bouchard, F., Baquero, F., McInerney, J. O., and Burian, R. M. (2012). Evolutionary analyses of non-genealogical bonds produced by introgressive descent. Proc. Natl. Acad. Sci. U.S.A. 109, 18266–18272. doi: 10.1073/pnas.1206541109
Pubmed Abstract | Pubmed Full Text | CrossRef Full Text | Google Scholar
Bapteste, E., van Iersel, L., Janke, A., Kelchner, S., Kelk, S., McInerney, J. O., et al. (2013). Networks: expanding evolutionary thinking. Trends Genet. 29, 439–441. doi: 10.1016/j.tig.2013.05.007
Pubmed Abstract | Pubmed Full Text | CrossRef Full Text | Google Scholar
Beaudet, D., Terrat, Y., Halary, S., de la Providencia, I. E., and Hijri, M. (2013). Mitochondrial genome rearrangements in glomus species triggered by homologous recombination between distinct mtDNA haplotypes. Genome Biol. Evol. 5, 1628–1643. doi: 10.1093/gbe/evt120
Beauregard-Racine, J., Bicep, C., Schliep, K., Lopez, P., Lapointe, F.-J., and Bapteste, E. (2011). Of woods and webs: possible alternatives to the tree of life for studying genomic fluidity in E. coli. Biol. Dir. 6:39. doi: 10.1186/1745-6150-6-39
Pubmed Abstract | Pubmed Full Text | CrossRef Full Text | Google Scholar
Blondel, V., Guillaume, J.-L., Lambiotte, R., and Lefebvre, E. (2008). Fast unfolding of communities in large networks. J. Stat. Mech. 2008:P10008. doi: 10.1088/1742-5468/2008/10/P10008
Bolten, E., Schliep, A., Schneckener, S., Schomburg, D., and Schrader, R. (2001). Clustering protein sequences–structure prediction by transitive homology. Bioinformatics 17, 935–941. doi: 10.1093/bioinformatics/17.10.935
Pubmed Abstract | Pubmed Full Text | CrossRef Full Text | Google Scholar
Brocchieri, L., and Karlin, S. (2005). Protein length in eukaryotic and prokaryotic proteomes. Nucleic Acids Res. 33, 3390–3400. doi: 10.1093/nar/gki615
Pubmed Abstract | Pubmed Full Text | CrossRef Full Text | Google Scholar
Camoglu, O., Can, T., and Singh, A. K. (2006). Integrating multi-attribute similarity networks for robust representation of the protein space. Bioinformatics 22, 1585–1592. doi: 10.1093/bioinformatics/btl130
Pubmed Abstract | Pubmed Full Text | CrossRef Full Text | Google Scholar
Ciccarelli, F. D., Doerks, T., Von Mering, C., Creevey, C. J., Snel, B., and Bork, P. (2006). Toward automatic reconstruction of a highly resolved tree of life. Science 311, 1283–1287. doi: 10.1126/science.1123061
Pubmed Abstract | Pubmed Full Text | CrossRef Full Text | Google Scholar
Collins, L. J., Poole, A. M., and Penny, D. (2003). Using ancestral sequences to uncover potential gene homologues. Appl. Bioinform. 2, S85–S95.
Dagan, T., Artzy-Randrup, Y., and Martin, W. (2008). Modular networks and cumulative impact of lateral transfer in prokaryote genome evolution. Proc. Natl. Acad. Sci. U.S.A. 105, 10039–10044. doi: 10.1073/pnas.0800679105
Pubmed Abstract | Pubmed Full Text | CrossRef Full Text | Google Scholar
David, L. A., and Alm, E. J. (2011). Rapid evolutionary innovation during an Archaean genetic expansion. Nature 469, 93–96. doi: 10.1038/nature09649
Pubmed Abstract | Pubmed Full Text | CrossRef Full Text | Google Scholar
Doolittle, W. F. (2009). The practice of classification and the theory of evolution, and what the demise of Charles Darwin's tree of life hypothesis means for both of them. Phil. Trans. R. Soc. Lond. B Biol. Sci. 364, 2221–2228. doi: 10.1098/rstb.2009.0032
Pubmed Abstract | Pubmed Full Text | CrossRef Full Text | Google Scholar
Dupont, C. L., Yang, S., Palenik, B., and Bourne, P. E. (2006). Modern proteomes contain putative imprints of ancient shifts in trace metal geochemistry. Proc. Natl. Acad. Sci. U.S.A. 103, 17822–17827. doi: 10.1073/pnas.0605798103
Pubmed Abstract | Pubmed Full Text | CrossRef Full Text | Google Scholar
Dupont, C. L., Butcher, A., Valas, R. E., Bourne, P. E., and Caetano-Anollés, G. (2010). History of biological metal utilization inferred through phylogenomic analysis of protein structures. Proc. Natl. Acad. Sci. U.S.A. 107, 10567–10572. doi: 10.1073/pnas.0912491107
Pubmed Abstract | Pubmed Full Text | CrossRef Full Text | Google Scholar
Falkowski, P. G., Fenchel, T., and Delong, E. F. (2008). The microbial engines that drive Earth's biogeochemical cycles. Science 320, 1034–1039. doi: 10.1126/science.1153213
Pubmed Abstract | Pubmed Full Text | CrossRef Full Text | Google Scholar
Frickey, T., and Lupas, A. (2004). CLANS: a Java application for visualizing protein families based on pairwise similarity. Bioinformatics 20, 3702–3704. doi: 10.1093/bioinformatics/bth444
Pubmed Abstract | Pubmed Full Text | CrossRef Full Text | Google Scholar
Godfrey, L. V., and Falkowski, P. G. (2009). The cycling and redox state of nitrogen in the Archaean ocean. Nat. Geosci. 2, 725–729. doi: 10.1038/ngeo633
Haft, D. H., Selengut, J. D., and White, O. (2003). The TIGRFAMs database of protein families. Nucleic Acids Res. 31, 371–373. doi: 10.1093/nar/gkg128
Pubmed Abstract | Pubmed Full Text | CrossRef Full Text | Google Scholar
Haggerty, L. S., Jachiet, P. A., Hanage, W. P., Fitzpatrick, D. A., Lopez, P., O'Connell, M. J., et al. (2014). A pluralistic account of homology: adapting the models to the data. Mol. Biol. Evol. 31, 501–516. doi: 10.1093/molbev/mst228
Pubmed Abstract | Pubmed Full Text | CrossRef Full Text | Google Scholar
Halary, S., Leigh, J. W., Cheaib, B., Lopez, P., and Bapteste, E. (2010). Network analyses structure genetic diversity in independent genetic worlds. Proc. Natl. Acad. Sci. U.S.A. 107, 127–132. doi: 10.1073/pnas.0908978107
Pubmed Abstract | Pubmed Full Text | CrossRef Full Text | Google Scholar
Halary, S., McInerney, J. O., Lopez, P., and Bapteste, E. (2013). EGN: a wizard for construction of gene and genome similarity networks. BMC Evol. Biol. 13:146. doi: 10.1186/1471-2148-13-146
Pubmed Abstract | Pubmed Full Text | CrossRef Full Text | Google Scholar
Heimann, A., Johnson, C. M., Beard, B. L., Valley, J. W., Roden, E. E., Spicuzza, M. J., et al. (2010). Fe, C, and O isotope compositions of banded iron formation carbonates demonstrate a major role for dissimilatory iron reduction in ~2.5Ga marine environments. Earth Planet. Sci. Lett. 294, 8–18. doi: 10.1016/j.epsl.2010.02.015
Jachiet, P. A., Colson, P., Lopez, P., and Bapteste, E. (2014). Extensive gene remodeling in the viral world: new evidence for nongradual evolution in the mobilome network. Genome Biol. Evol. 6, 2195–2205. doi: 10.1093/gbe/evu168
Pubmed Abstract | Pubmed Full Text | CrossRef Full Text | Google Scholar
Jiang, Y. Y., Kong, D. X., Qin, T., Li, X., Caetano-Anolles, G., and Zhang, H. Y. (2012). The impact of oxygen on metabolic evolution: a chemoinformatic investigation. PLoS Comp. Biol. 8:e1002426. doi: 10.1371/journal.pcbi.1002426
Pubmed Abstract | Pubmed Full Text | CrossRef Full Text | Google Scholar
Johnson, C. M., Beard, B. L., Klein, C., Beukes, N. J., and Roden, E. E. (2008). Iron isotopes constrain biologic and abiologic processes in banded iron formation genesis. Geochim. Cosmochim. Acta 72, 151–169. doi: 10.1016/j.gca.2007.10.013
Kim, K. M., Qin, T., Jiang, Y. Y., Chen, L. L., Xiong, M., Caetano-Anollés, D., et al. (2012). Protein domain structure uncovers the origin of aerobic metabolism and the rise of planetary oxygen. Structure 20, 67–76. doi: 10.1016/j.str.2011.11.003
Pubmed Abstract | Pubmed Full Text | CrossRef Full Text | Google Scholar
Kim, J. D., Senn, S., Harel, A., Jelen, B. I., and Falkowski, P. G. (2013). Discovering the electronic circuit diagram of life: structural relationships among transition metal binding sites in oxidoreductases. Phil. Trans. R. Soc. Lond. B Biol. Sci. 368, e20120257. doi: 10.1098/rstb.2012.0257
Pubmed Abstract | Pubmed Full Text | CrossRef Full Text | Google Scholar
Korona, R. (2011). Gene dispensability. Curr. Opin. Biotechnol. 22, 547–551. doi: 10.1016/j.copbio.2011.04.017
Pubmed Abstract | Pubmed Full Text | CrossRef Full Text | Google Scholar
Lapierre, P., and Gogarten, J. P. (2009). Estimating the size of the bacterial pan-genome. Trends Genet. 25, 107–110. doi: 10.1016/j.tig.2008.12.004
Pubmed Abstract | Pubmed Full Text | CrossRef Full Text | Google Scholar
Leskovec, J., Lang, K. J., Dasgupta, A., and Mahoney, M. W. (2008). “Statistical properties of community structure in large social and information networks,” in Proceedings of the 17th International World Wide Web Conference (New York, NY: ACM), 695–704.
Marchler-Bauer, A., Lu, S., Anderson, J. B., Chitsaz, F., Derbyshire, M. K., Deweese-Scott, C., et al. (2011). CDD: a Conserved Domain Database for the functional annotation of proteins. Nucleic Acids Res. 39, D225–D229. doi: 10.1093/nar/gkq1189
Pubmed Abstract | Pubmed Full Text | CrossRef Full Text | Google Scholar
Matsui, M., Tomita, M., and Kanai, A. (2013). Comprehensive computational analysis of bacterial CRP/FNR superfamily and its target motifs reveals stepwise evolution of transcriptional networks. Genome Biol. Evol. 5, 267–282. doi: 10.1093/gbe/evt004
Pubmed Abstract | Pubmed Full Text | CrossRef Full Text | Google Scholar
Rappoport, N., Linial, N., and Linial, M. (2013). ProtoNet: charting the expanding universe of protein sequences. Nat. Biotechnol. 31, 290–292. doi: 10.1038/nbt.2553
Pubmed Abstract | Pubmed Full Text | CrossRef Full Text | Google Scholar
Raymond, J., and Segre, D. (2006). The effect of oxygen on biochemical networks and the evolution of complex life. Science 311, 1764–1767. doi: 10.1126/science.1118439
Pubmed Abstract | Pubmed Full Text | CrossRef Full Text | Google Scholar
Sasson, O., Vaaknin, A., Fleischer, H., Portugaly, E., Bilu, Y., Linial, N., et al. (2003). ProtoNet: hierarchical classification of the protein space. Nucleic Acids Res. 31, 348–352. doi: 10.1093/nar/gkg096
Pubmed Abstract | Pubmed Full Text | CrossRef Full Text | Google Scholar
Shen, Y., Buick, R., and Canfield, D. E. (2001). Isotopic evidence for microbial sulphate reduction in the early Archaean era. Nature 410, 77–81. doi: 10.1038/35065071
Pubmed Abstract | Pubmed Full Text | CrossRef Full Text | Google Scholar
Slesarev, A. I., Mezhevaya, K. V., Makarova, K. S., Polushin, N. N., Shcherbinina, O. V., Shakhova, V. V., et al. (2002). The complete genome of hyperthermophile Methanopyrus kandleri AV19 and monophyly of archaeal methanogens. Proc. Natl. Acad. Sci. U.S.A. 99, 4644–4649. doi: 10.1073/pnas.032671499
Pubmed Abstract | Pubmed Full Text | CrossRef Full Text | Google Scholar
Sober, E., and Steel, M. (2002). Testing the hypothesis of common ancestry. J. Theor. Biol. 218, 395–408. doi: 10.1016/S0022-5193(02)93086-9
Pubmed Abstract | Pubmed Full Text | CrossRef Full Text | Google Scholar
Tatusov, R. L., Koonin, E. V., and Lipman, D. J. (1997). A genomic perspective on protein families. Science 278, 631–637.
Tian, W., and Skolnick, J. (2003). How well is enzyme function conserved as a function of pairwise sequence identity? J. Mol. Biol. 333, 863–882. doi: 10.1016/j.jmb.2003.08.057
Pubmed Abstract | Pubmed Full Text | CrossRef Full Text | Google Scholar
Wagner, M., Roger, A. J., Flax, J. L., Brusseau, G. A., and Stahl, D. A. (1998). Phylogeny of dissimilatory sulfite reductases supports an early origin of sulfate respiration. J. Bacteriol. 180, 2975–2982.
Wylie, K. M., Truty, R. M., Sharpton, T. J., Mihindukulasuriya, K. A., Zhou, Y., Gao, H., et al. (2012). Novel bacterial taxa in the human microbiome. PLoS ONE 7:e35294. doi: 10.1371/journal.pone.0035294
Pubmed Abstract | Pubmed Full Text | CrossRef Full Text | Google Scholar
Yona, G., Linial, N., and Linial, M. (2000). ProtoMap: automatic classification of protein sequences and hierarchy of protein families. Nucleic Acids Res. 28, 49–55. doi: 10.1093/nar/28.1.49
Pubmed Abstract | Pubmed Full Text | CrossRef Full Text | Google Scholar
Zhang, S. B., Zhou, S. Y., He, J. G., and Lai, J. H. (2011). Phylogeny inference based on spectral graph clustering. J. Comput. Biol. 18, 627–637. doi: 10.1089/cmb.2009.0028
Pubmed Abstract | Pubmed Full Text | CrossRef Full Text | Google Scholar
Keywords: microbial evolution, redox enzymes, sequence similarity network analysis, conductance, Great Oxygenation Event, respiratory lifestyles
Citation: Cheng S, Karkar S, Bapteste E, Yee N, Falkowski P and Bhattacharya D (2014) Sequence similarity network reveals the imprints of major diversification events in the evolution of microbial life. Front. Ecol. Evol. 2:72. doi: 10.3389/fevo.2014.00072
Received: 08 July 2014; Accepted: 16 October 2014;
Published online: 05 November 2014.
Edited by:
Rodney L. Honeycutt, Pepperdine University, USAReviewed by:
Gustavo Caetano-Anollés, University of Illinois, USAMarco Fondi, University of Florence, Italy
Copyright © 2014 Cheng, Karkar, Bapteste, Yee, Falkowski and Bhattacharya. This is an open-access article distributed under the terms of the Creative Commons Attribution License (CC BY). The use, distribution or reproduction in other forums is permitted, provided the original author(s) or licensor are credited and that the original publication in this journal is cited, in accordance with accepted academic practice. No use, distribution or reproduction is permitted which does not comply with these terms.
*Correspondence: Eric Bapteste, Unité Mixte de Recherche, Centre National de la Recherche Scientifique 7138, Evolution Paris Seine, IBPS, Université Pierre et Marie Curie, 75005 Paris, France e-mail: eric.bapteste@snv.jussieu.fr;
Debashish Bhattacharya, Department of Ecology, Evolution and Natural Resources, Institute of Marine and Coastal Science, Rutgers University, 59 Dudley Road, Foran Hall 102, New Brunswick, NJ 08901, USA e-mail: debash.bhattacharya@gmail.com
† These authors have contributed equally to this work.