A statistical approach to identify candidate cues for nestmate recognition
 Jelle S. van Zweden
 Luigi Pontieri
 Jes S. Pedersen
- 1Laboratory of Socioecology and Social Evolution, Department of Biology, KU Leuven, Leuven, Belgium
- 2Centre for Social Evolution, Department of Biology, University of Copenhagen, Copenhagen, Denmark
The ability of social insects to discriminate nestmates (NMs) from non-nestmates (nNMs) is mainly achieved through chemical communication. To ultimately understand this recognition and its decision rules, identification of the recognition cues is essential. Although recognition cues are most likely cuticular hydrocarbons (CHCs), identifying the exact cues for specific species has remained a daunting task, partly due to the sheer number of odor compounds. Perhaps unsurprisingly, one of the few species where the recognition cues have been identified, Formica exsecta, has only around ten major hydrocarbons on its cuticle. In this study we use previous results of this species to search for nestmate recognition cues (NMR cues) in two other species of ants, Camponotus aethiops, and Monomorium pharaonis. Employing chemical distances and observed aggression between colonies, we first ask which type of data normalization, centroid, and distance calculation is most diagnostic to discriminate between NMR cues and other compounds. We find that using a “global centroid” instead of a “colony centroid” significantly improves the analysis. One reason may be that this new approach, unlike previous ones, provides a biologically meaningful way to quantify the chemical distances between NMs, allowing for within-colony variation in recognition cues. Next, we ask which subset of hydrocarbons most likely represents the cues that the ants use for nestmate recognition, which shows less clear results for C. aethiops and M. pharaonis than for F. exsecta, possibly due to less than ideal datasets. Nonetheless, some compound sets performed better than others, showing that this approach can be used to identify candidate compounds to be tested in bio-assays, and eventually crack the sophisticated code that governs nestmate recognition.
Introduction
Kin recognition is a fundamental ability that allows organisms both to avoid inbreeding and to direct cooperative behavior toward related individuals (Hepper, 1991). In the eusocial insects (termites, ants, some bees and wasps), nestmate recognition—the ability to discriminate nestmates (NMs) from non-nestmates (nNMs)—is the primary form of kin recognition, since colonies usually consist of closely related family groups. Nestmate recognition is mainly chemical in nature and based on colony-specific cuticular hydrocarbon profiles (Hölldobler and Michener, 1980; Bonavita-Cougourdan et al., 1987; Clément and Bagnères, 1998; Singer, 1998; van Zweden and d'Ettorre, 2010). These cuticular lipids, synthesized by the animals themselves (Howard and Blomquist, 2005; van Zweden et al., 2010), and partly obtained from environmental sources (Obin and Vander Meer, 1988; Woodrow et al., 2000; Buczkowski et al., 2005), are typically mixed throughout the colony by means of liquid food transfer, grooming, and exchange through nest material (Soroker et al., 1995; d'Ettorre et al., 2006; Couvillon et al., 2007; van Zweden et al., 2010; Bos et al., 2011). Direct evidence for the use of hydrocarbons in nestmate recognition has been obtained in several ant and bee species, by testing the level of aggression toward NMs supplemented with synthetic hydrocarbons (Lahav et al., 1999; Dani et al., 2005; Ozaki et al., 2005; Martin et al., 2008b; Guerrieri et al., 2009), or to inert materials treated with either the hydrocarbon profile of fellow workers or synthetic mixtures of hydrocarbons (Wagner et al., 2000; Akino et al., 2004; Greene and Gordon, 2007; Martin et al., 2008b). The use of these manipulative experiments has allowed researchers to provide not only direct evidence about the involvement of cuticular hydrocarbons (CHCs) in nestmate recognition, but also information about which compounds constitute the nestmate recognition signal in specific species. For example, Martin et al. (2008b) showed that Formica exsecta workers were less aggressive toward glass beads coated with their colony-specific Z-9-alkene profile than when the beads were covered with either a linear alkane or an alkene profile that did not match their colony odor. Furthermore, workers whose cuticles were supplemented with a synthetic Z-9-alkene were aggressed significantly more often than workers treated with a synthetic alkane by nestmate workers. Together, these experiments provided the first direct evidence that Z-9-alkenes constitute the nestmate recognition cues (NMR cues) in this ant species. Further knowledge of the evolutionary, ecological, and physiological features of nestmate recognition relies on such direct tests to identify the exact recognition cues. However, these manipulative experiments are hampered by the fact that social insect species often have many different compounds on their cuticle (Blomquist and Bagnères, 2010). It is both time-consuming and difficult to synthesize every compound, and if undertaken, it would still be near impossible to test all combinations and interactions of compounds. Hence, a statistical approach is needed to highlight candidate compounds for actual testing in bio-assays.
Since NMR cues are expected to be uniform within colonies and variable between colonies, a relatively simple statistical analysis may give us a first clue as to which compounds follow this pattern. Martin et al. (2008a,b) used within-colony correlation and species-level variation of the relative amounts of CHCs to show that in the wood ant F. exsecta the group of (Z)-9-alkenes, and in F. fusca the group of dimethyl pentacosanes, were the most likely NMR cues. In a similar fashion, van Zweden and d'Ettorre (2010) suggested ranking compounds according to their “diagnostic power” (DP)—the ratio of between- and within-colony standard deviation—to measure how likely they are to be NMR cues. In the carpenter ant Camponotus aethiops, this method highlighted predominantly 5-(di)methyl alkanes as likely candidates (van Zweden et al., 2009). These approaches, however, cannot stand alone as they are not taking the actual recognition behavior into account. The pattern that we expect NMR cues to follow is that the more two colonies differ in these cues, the easier it will be for the insects to recognize that they belong to different colonies, and the higher or more frequent aggression should be. This may not be a linear relationship, rather a step or sigmoid function (van Zweden and d'Ettorre, 2010), but the positive relationship between chemical distance and aggression is expected nonetheless. Indeed, this was found in F. exsecta for the (Z)-9-alkenes, but not for linear alkanes, again giving credit to the former as NMR cues (Martin et al., 2012).
The discovery of the exact cues used for nestmate discrimination in F. exsecta, knowing their pattern of within- and between-colony variation, and their relationship with the behavioral response of the individuals, may help us to search for similar compounds in other social insects. Furthermore, we can use this information to compare the efficiency of commonly used statistical procedures to highlight candidate compounds, and to develop new statistical methods with improved power and accuracy. The aim of this study was therefore to use chemical and behavioral data from F. exsecta to: (1) identify specific sets of compounds that might constitute the NMR cues in two other ant species, C. aethiops and the pharaoh ant, Monomorium pharaonis. (2) investigate which method of variable selection (functional group, DP and variable clustering) leads to better identification of relevant sets of compounds, and (3) evaluate and compare the power of different combinations of data transformation and chemical distance calculation in differentiating between true NMR cues and other compounds.
Materials and Methods
Datasets Analyzed
We compiled data sets of CHCs and corresponding measurements of aggression between colonies, for three different ant species: F. exsecta (Martin et al., 2012), C. aethiops (van Zweden et al., 2009), and M. pharaonis (Chapter 2 in Pontieri, 2014).
In addition, we created a simulated “ideal” dataset (Simulated) based on the F. exsecta dataset. This simulated dataset served a double purpose. First, it was used to illustrate the properties of CHC data and how different methods of data transformation can affect the degree of interdependence that compositional data naturally possess (Figure 1). Second, because we know which compounds constitute the NMR cues in both this simulated and the F. exsecta dataset, we used these to test the efficiency of different statistical procedures to correctly discriminate NMR cues from other compounds.
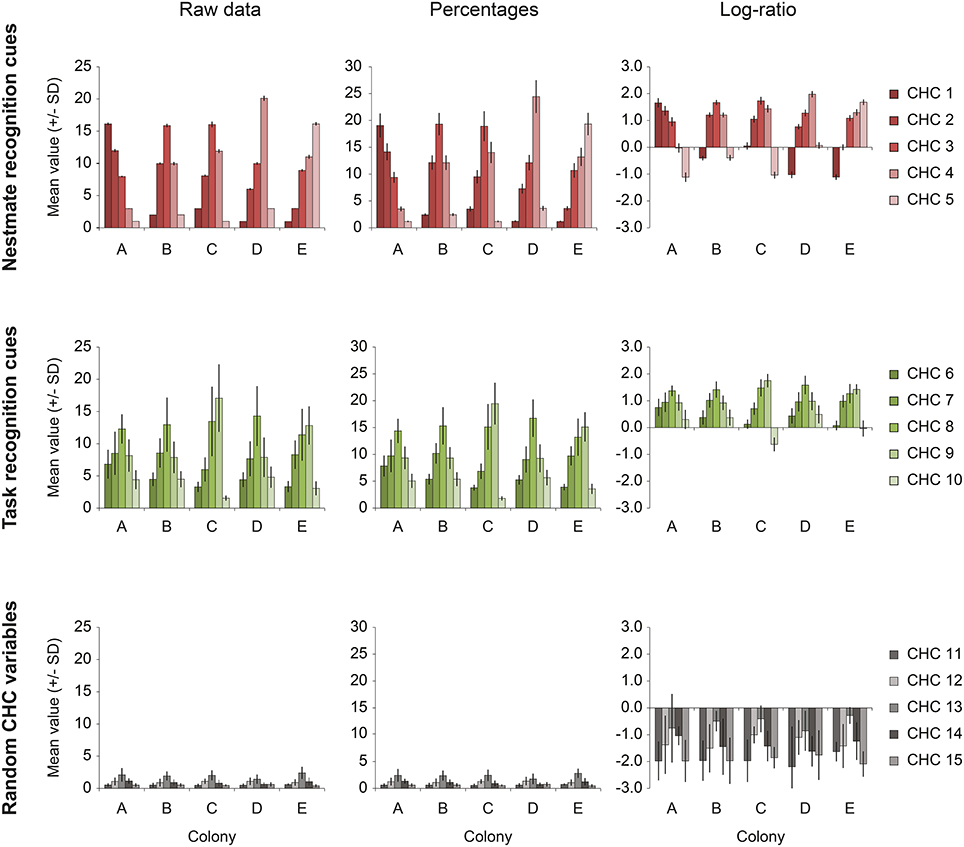
Figure 1. The effect of percentage- and log-ratio normalization. The data from the Simulated dataset illustrate the extent to which the different normalizations affect the interdependence of compositional data. Each row shows one of the three sets of five variables [upper row, nestmate recognition (NMR) cues; middle row, task recognition cues; bottom row, random CHC variables]. The average amount (± SD) of each compound in each set is showed for each of the five colonies present in the dataset (colonies A–E). The left column (Raw data) shows the original pattern (before concentration variability was introduced). The middle and right column show the distribution after normalization to percentages and by log-ratio transformation (Aitchison, 1986). Even though the nestmate recognition cues (upper row) are very homogeneous amongst nestmates, as is shown by the small standard deviation, they are strongly affected by other hydrocarbon variables when normalization to percentages is done (“closure effect”). Log-ratio transformed data suffers less of this effect, as is shown by the relatively small standard deviations of NMR cues.
Formica exsecta
The narrow-headed ant or excised wood ant, F. exsecta, is a species for which quite a lot is known about its nestmate recognition system (Martin et al., 2008b, 2012; Martin and Drijfhout, 2009). A clear difference in aggression between NMs and nNMs has been observed, even when CHC profiles are quite similar (Martin et al., 2012). The CHC profile is relatively simple and consists of 10–12 (Z)-9-alkenes and linear alkanes (pairwise corresponding in chain-length), of which the composition of alkenes appears to encode the nestmate recognition signal (Martin et al., 2008a), and some additional compounds present in low concentration. The CHC dataset (courtesy of Stephen J. Martin) consisted of 33 colonies from the same population, each containing information on 10 CHCs [(Z)-9-C23:1to n-C31] and five individual workers (Martin et al., 2012; Table S1). The aggression dataset contained 24 non-nestmate (nNM) colony combinations and five nestmate (NM) colony combinations. For each of the combinations, 10 ant workers were placed on the mound of the opponent colony (and also vice versa for 10 out of 24 nNM combinations) and the first five interactions were recorded and classified as aggressive or non-aggressive, leading to 50–100 interactions per combination (Data Sheet 1).
Camponotus aethiops
An Italian population of this carpenter ant has been subject to several studies related to nestmate recognition (van Zweden et al., 2009; Bos et al., 2010, 2011; Stroeymeyt et al., 2010). The data used is from a study where colonies were kept in the laboratory for 1 year (van Zweden et al., 2009). Colony CHC profiles were quantified at regular intervals and their inter-colony aggression was tested by one-on-one aggression tests in a neutral arena at two time points during this year. The CHC profile consists of linear and (di)methylated alkanes (van Zweden et al., 2009). The CHC dataset consisted of six colonies, each containing information on 36 identified CHC peaks and 10 individuals (five individuals at two time points; Data Sheet 1). The aggression dataset contained eight nNM and three NM colony combinations, each replicated 12 times (Data Sheet 1). For each replicate, ants were staged one-on-one in a neutral arena and when biting or abdomen flexing occurred, the interaction was classified as aggressive.
Monomorium pharaonis
The invasive pharaoh ant is known for having many queens breeding in each colony (polygyny) and low levels of nestmate recognition, despite unrelated colonies being genetically highly differentiated (Schmidt et al., 2010). CHC profiles were found to be colony-specific, but there was no clear relationship between hydrocarbon distance and aggression, and in only one of two data sets higher aggression between nNMs than between NMs was found (Schmidt et al., 2010). The CHC dataset used here (Chapter 2 in Pontieri, 2014) consisted of 16 colonies, each containing information on 45 CHC peaks (linear and (di)methylated alkanes and alkenes) and 1–4 individual samples (each sample was an extract of five workers joined in a vial). Two of the 45 peaks were discarded as they could not be identified, thus resulting in 43 compound variables (Data Sheet 1). The aggression dataset used is of an experiment in which pairs of colonies were given the opportunity to fuse or not (Chapter 2 in Pontieri, 2014). Colonies were maintained in individual plastic boxes connected by a vinyl tube to a common foraging arena and allowed to interact for 10 days. The number of fighting pairs of ants was recorded 12 times over the course of the assay and, when any fighting pair was found, the trial was classified as aggressive. Twelve nNM colony combinations were each replicated six times and 16 NM combinations were each replicated three times (Data Sheet 1).
Simulated data
A total of five colony profiles (Colonies A–E) of 15 CHCs was constructed (Figure 1, left column; Data Sheet 2), each containing 10 individual samples. The 15 CHCs were divided into three groups of five that approximate the simple structure observed for the CHC profile of F. exsecta: five NMR cues that differ most between colonies but not within; five task cues that have high amounts in foragers and low amounts in nurses, similar to Pogonomyrmex barbatus and F. exsecta (Wagner et al., 2001; Martin and Drijfhout, 2009); and five random CHCs that have high within-colony variability, low between-colony variability, and are present in low amounts, similar to Martin and Drijfhout (2009) (Figure 1, left column; Data Sheet 2). Each CHC group in the dataset had a set distribution of constant values within colonies, and random numbers with a given standard deviation were created around each of these constants (Data Sheet 2). To explain how the data were created, we will use the example of colony A. The set distribution of NMR cues was 16, 12, 8, 3, 1 (CHC 1–5, respectively). Using each of these constants as the mean, 10 individual samples were created by drawing random numbers with a standard deviation of 2% of the mean. Similarly, the set distribution of means for task cues was 8, 10, 16, 10, 6 (CHC 6–10, respectively) for foragers and 4.8, 6.0, 9.6, 6.0, 3.6 for nurses (i.e., the same relative proportion, but lower amounts), from which the 10 individual samples (5 foragers and 5 nurses) received a random value with a standard deviation of 20%. Lastly, the random CHCs had a distribution of means of 0.5, 1, 2, 1, 0.5 (CHC 11–15, respectively) from which the 10 individuals received a random values with a standard deviation of 50%. Finally, all these data (5 colonies × 10 individuals × 15 CHCs) were then per individual multiplied by a random number (mean ± SD = 3 ± 1) to mimic random concentration differences that might occur in extractions of real animals, and which necessitate normalization of the data (Data Sheets 1, 2).
In addition, an artificial data file on aggression behavior was created with 10 encounters between each of the colony combinations (N = 10 combinations) and 10 encounters between nestmate combinations (N = 5 combinations). Aggression between NMs was always zero, whereas that between non-nestmate colony combinations followed a similar gradual change as the colony odor variation (Figure 1), i.e., there was maximum aggression in colony A vs. E, whereas there were fewer aggressive encounters between other combinations (Data Sheet 1).
Selection of Candidate Compounds
Since not all compounds function as NMR cues, it is important to select compound sets that together might make up the NMR cues. However, there are many different combinations of compound possible (e.g., with the 45 compounds of the M. pharaonis dataset there are 35,184,172,088,831 different possible combinations), so we have to rely on different strategies than simply going through each of these. There is, however, a range of methods of variable selection to identify coherent groups which follow correlated patterns in chemical profiles (henceforth “compound set”). Here we test three methods that are appropriate to our type of data. Two of these methods have been proposed in previous studies: functional groups (Dani et al., 2005; Martin and Drijfhout, 2009) and DP (van Zweden et al., 2009). In addition, we tested the efficiency of a third approach called “variable clustering” where compounds are grouped according to their degree of covariance using the R package ClustOfVar (Chavent et al., 2012; Data Sheet 4).
The first strategy is to subdivide the CHC variables into functional groups: linear alkanes, alkenes, 3-methyl alkanes, etc. This is based on the finding of previous studies that different structural class of hydrocarbons can have a differential importance in nestmate recognition. In the paper wasp Polistes dominulus the topical application of linear alkanes on the cuticle of anesthetized workers did not elicit an aggressive response by NMs once the individual was reintroduced in the nest, but the application of alkenes or methyl branched alkanes did have this effect (Dani et al., 2001). Alkenes were also found to play a major role in nestmate recognition compared to linear alkanes in the honeybees and in F. exsecta (Dani et al., 2005; Martin et al., 2008b). Compounds in each of these sets often share a large part of their biosynthetic pathway (Blomquist, 2010), and thus should both correlate with each other and experience the same genetic and physiological constraints. For example, the different methylated alkanes originate simply due to the incorporation of a propionyl-CoA instead of a malonyl-CoA during chain elongation (Morgan, 2004; Blomquist, 2010). The biosynthesis of unsaturated hydrocarbons, alkenes, likely involves an extra Δ9 desaturase step (Badouin et al., 2013), which may therefore result in a higher degree of decoupling of the relative expression of saturated and unsaturated hydrocarbons, such as for example is seen in F. exsecta (Martin and Drijfhout, 2009). This subdivision into functional groups resulted in 3–6 compound sets for the different datasets (see Data Sheet 3).
The second strategy is to first determine which compounds vary most between colonies and least within colonies, as would be expected for compounds that function as NMR cues (van Zweden and d'Ettorre, 2010). The ratio of between-colony standard deviation over pooled within-colony standard deviation, also termed DP, can be calculated for each compound separately (after normalization to percentages or using an log-ratio transformation, see below), after which the compounds can be ranked according to this number. For each dataset and normalization, we made four compound sets: higher than average diagnostic power (High DP), lower than average diagnostic power (Low DP), the five compounds with the highest diagnostic power (Highest 5 DP), and the five compounds with the lowest diagnostic power (Lowest 5 DP; see Data Sheet 3 for the DP value of each compound).
A third strategy is to assess the correlation between compounds (e.g., Martin et al., 2008a), so that we can group co-varying compounds directly into homogeneous clusters. Strongly co-varying variables should bring approximately the same information, so reducing the number of variables could simplify further data analysis. Principal Component Analysis (PCA) could be used to indicate such co-varying variables as well as reduce the number of variable dimensions. However, it might be difficult to find objective ways to group the variables based purely on PCA as this does not provide any statistical basis to determine a cut-off point. Instead, here we use a cluster method based on squared correlations as developed in the R package ClustOfVar (Chavent et al., 2012; Data Sheet 4). The advantage provided by this function relative to a PCA is that once compounds are clustered in homogeneous groups, it is possible to verify the stability of these groups by a bootstrap approach. We used the stability function to determine the best aggregation level, but set this to a maximum of five clusters for simplicity. This analysis was performed using the raw data, i.e., without prior normalization (see Data Sheet 3 for the exact compounds in each set).
Choice of Calculation Method
Chemical distances between colonies can be calculated in a variety of ways. In Martin et al. (2012), the authors based their analysis on a single approach: first normalizing the raw CHC data to percentages, then calculating an average colony odor (group centroid), and finally calculating the absolute distance (Manhattan distance) between these average odors. However, combining different approaches for each of the three steps in the calculation can result in at least 12 different methods for calculating the chemical distance.
Firstly, raw CHC data can also be normalized using the log-ratio transformation (Aitchison, 1986):
where yij is the transformed peak area of the ith CHC component of the jth individual, xij is the untransformed peak area of the ith component of the jth individual, and g(Xj) is the geometric mean peak area of all components of the jth individual. This method of normalization may be superior to percentage-based normalization because of the reduction of the so-called “closure effect” (Figure 1). This effect can hinder the analysis of compositional data in the sense that the variation of one variable can greatly influence the variation of another variable, because of their interdependence.
Secondly, using a group centroid, the distance between NMs is zero by definition, leading to a slight imbalance in the distribution of distances when both nestmate and non-nestmate distances are calculated. That is, even when colonies have very high variability in their CHC profiles and chemical distances between NMs are actually very high, the calculated distances are still zero. To overcome this shortcoming we here suggest the use of what we term a “global centroid” (Figure 2). In this case, the average odor of all individuals in the colony combination is calculated, after which the average distance to this average odor is taken as the chemical distance. When two colonies are further apart in chemical space, this distance will still be higher than two colonies that are close. In addition, the distance between NMs actually depends on their differences in individual odor profiles.
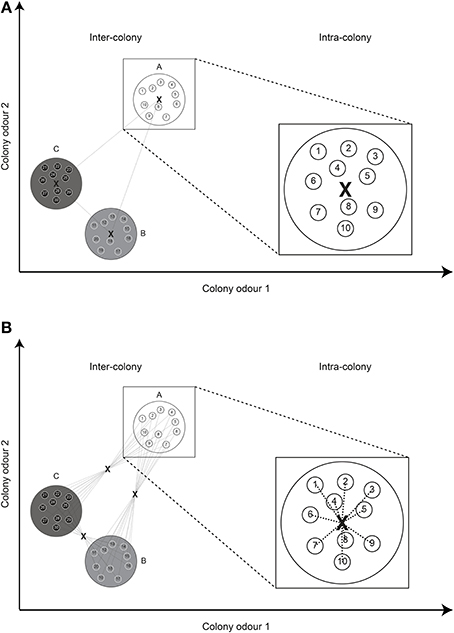
Figure 2. Group centroid vs. global centroid. (A) Using the “group centroid,” a single distance is calculated between the average odors (X) of two colonies (inter-colony). The distance between nestmates (intra-colony) is necessarily always zero. (B) Using a “global centroid,” the average odor of all individuals in a combination is first calculated, after which the average distance to this centroid is taken as the chemical distance. The distance between nestmates depends on the intra-colony variation in odor profile. For simplicity, the Euclidean distance and only two odor dimensions are depicted.
Thirdly, the actual distance calculation can be done in at least three different ways, of which the Manhattan distance is one. Another commonly used distance calculation is the usual square distance or Euclidean distance, the square root of the sum of squared differences (see also Figure 2). A third possibility is to first reduce chemical space of the data set using PCA and then take the absolute distance on the first axis (PC1). There exists a whole array of other distance calculation possibilities, such as the Mahalanobis distance. However, this distance measure requires the inverse of the variance–covariance matrix, which is singular in the case of more variables than samples and is generally ill-conditioned if variables are highly correlated such as with GC-MS chromatograms (Christensen and Tomasi, 2007). Therefore, in this study we limited ourselves to these three methods that are commonly used and statistically well-founded (Christensen and Tomasi, 2007; Martin et al., 2012).
Overall, this gives 12 different combinations to calculate the chemical distance between colonies, i.e., normalization (percentages or log-ratio-transformed), centroid (group or global), and distance calculation (Manhattan distance, Euclidean distance, or PC1) give 2 × 2 × 3 = 12 different ways to calculate chemical distance. For every dataset, and for every selected compound set, these distances were calculated using R 3.0.2 (R Core Team, 2013; Data Sheet 4).
Chemical Distance as a Predictor of Observed Aggression
Even though aggression was measured in different ways in the different study species (van Zweden et al., 2009; Martin et al., 2012; Chapter 2 in Pontieri, 2014), we could translate this in all three cases into the proportion of behaviors or encounters that were aggressive. The chemical distances based on the different compound sets (all compounds, functional groups, high/low diagnostic power, clusters of variables) and the 12 different combinations of calculation methods were regressed against the proportion of aggressive behaviors/encounters, by fitting a general linear model (GLM) with quasi-binomial errors and a logit link function, using R 3.0.2 (R Core Team, 2013; Data Sheet 4). For each model run the deviance explained by chemical distance was extracted for further analysis.
To test which of the 12 combinations of calculation methods most accurately identifies NMR cues over other cues, we used the fact that we know which—compounds constitute the NMR cues in the F. exsecta and Simulated datasets. In the F. exsecta dataset these are the (Z)-9-alkenes and in the Simulated dataset these are CHC 1–5. As a good analysis methodology should be able to differentiate between NMR cues and other cues on the cuticle, we can therefore search for the combination of methods that maximizes the difference between explained deviance of these compounds and the explained deviance of other compounds. Hence, we took the ratio of explained deviance from the regressions with the NMR cues [respectively (Z)-9-alkenes and CHC 1–5] over the explained deviance from the regressions with task cues (respectively n-alkanes and CHC 6–10) in both datasets and used these as the dependent variable in a GLM with Gaussian errors and “normalization,” “centroid,” and “distance calculation” as the explanatory variables.
To test which compound set most likely includes the NMR cues in C. aethiops and M. pharaonis, respectively, the explained deviance of the regressions across the 12 combinations for each of the compound sets was used as the dependent variable in a GLM with Gaussian errors and “compound set,” “normalization,” “centroid,” and “distance calculation” as the explanatory variables.
Results
The Most Diagnostic Combination of Calculation Methods
In the F. exsecta dataset, the most diagnostic combination (i.e., the combination of normalization, centroid, and distance calculation that most accurately differentiates between NMR cues and other compounds) is using normalization to percentages, a global centroid and PC1 distance, as this gave the highest ratio between the explained deviance of NMR cues over the explained deviance of task cues (Z-9-alkenes/linear alkanes = 753.08/127.45 = 5.91; see also Figure 3). Overall, the global centroid and PC1 distance both gave significantly higher deviance ratios compared to group centroid and Manhattan distance (Table 1). Normalization using the log-ratio transformation or using the Euclidean distance measure did not have such an effect (Table 1). Similarly, in the simulated dataset, centroid and distance had significant effects on the deviance ratios (Table 1). The most diagnostic combination was obtained through the combined usage of log-ratio transformation, global centroid, and PC1 distance (NMR cues/Task cues = 77.59/23.97 = 3.23), although using the same combination with percentage normalization instead gave a similar result (76.32/23.93 = 3.19). When NM control encounters were removed (i.e., similar to Martin et al., 2012) before fitting the regression models, the effect of distance calculation disappeared in both datasets (Table 1). The significant effect of centroid calculation did, however, disappear in the simulated dataset but not in the F. exsecta dataset (Table 1; see also Figure 3). In this case, the most diagnostic combination for the F. exsecta dataset was log-ratio transformation, global centroid, and Manhattan distance (436.66/58.60 = 7.45), and for the simulated dataset it was log-ratio transformation, group centroid, and PC1 distance (4.85/0.13 = 38.05).
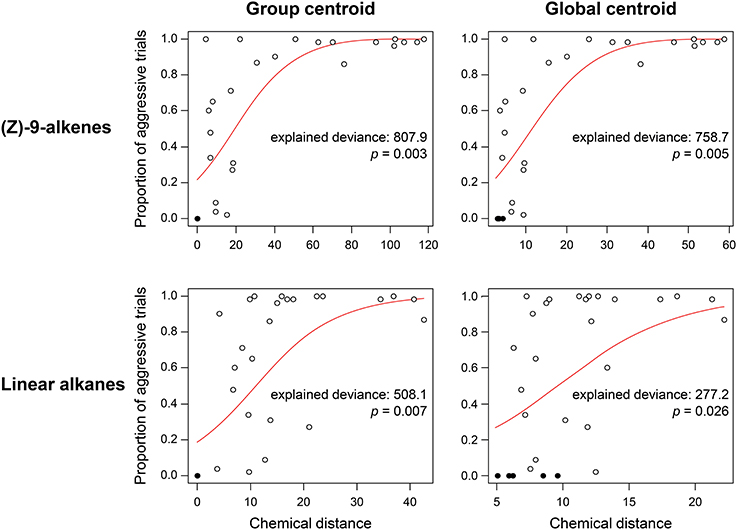
Figure 3. Regressions of chemical distance against observed aggression in the Formica exsecta dataset, illustrating the effect of using group vs. global centroid. Statistics are derived from a GLM with quasi-binomial errors and a logit link function. Closed circles, nestmate control trials, open circles, non-nestmate trials. Using the global centroid, the ratio in explained deviance between (Z)-9-alkenes and linear alkanes is higher than when using the group centroid (2.74 vs. 1.59).
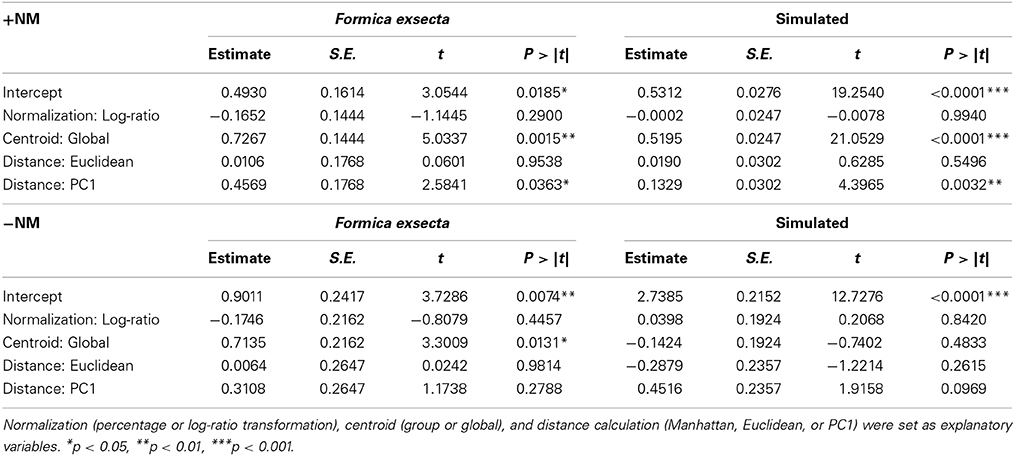
Table 1. The effect of combination of calculation methods on the ratio of explained deviance of known nestmate recognition cues (Z-9-alkenes and CHC 1-5) and explained deviance of task cues (linear alkanes and CHC 6-10).
The Compound Set that Best Explains Aggression
Based on all combinations of calculation methods, the explained deviance of the regressions using the All compound set (i.e., all compounds in the CHC profile) did not perform very well in the F. exsecta dataset (Figure 4A). The Alkene compound set explained between-colony aggression significantly better than when using All or Linear (Figure 4A). Ranking by diagnostic power resulted in approximately the same set of compounds (see Data Sheet 3) and thus a very similar pattern in explained deviances. The cluster analysis, on the other hand, resulted in the alkenes being split into two separate groups (Data Sheet 3; Cluster 1: C23:1, C25:1, and C31:1; Cluster 2: linear alkanes; Cluster 3: C27:1 and C29:1), both of which did not explain aggression as well as the five alkenes together (Figure 4A). This pattern hardly changed when looking only at the best combination (stars in Figure 4), although with percentage normalization, Cluster 1 ranked almost as high as the Alkene compound set. The highest level of explained deviance in this case was found when using only above-average diagnostic power compounds (High DP; C23:1, C27:1, C29:1, and C31:1). Hence, the (Z)-9-alkenes can indeed be considered the most likely NMR cues, confirming earlier findings that these compounds modulate inter-colony aggression (Martin et al., 2008b, 2012).
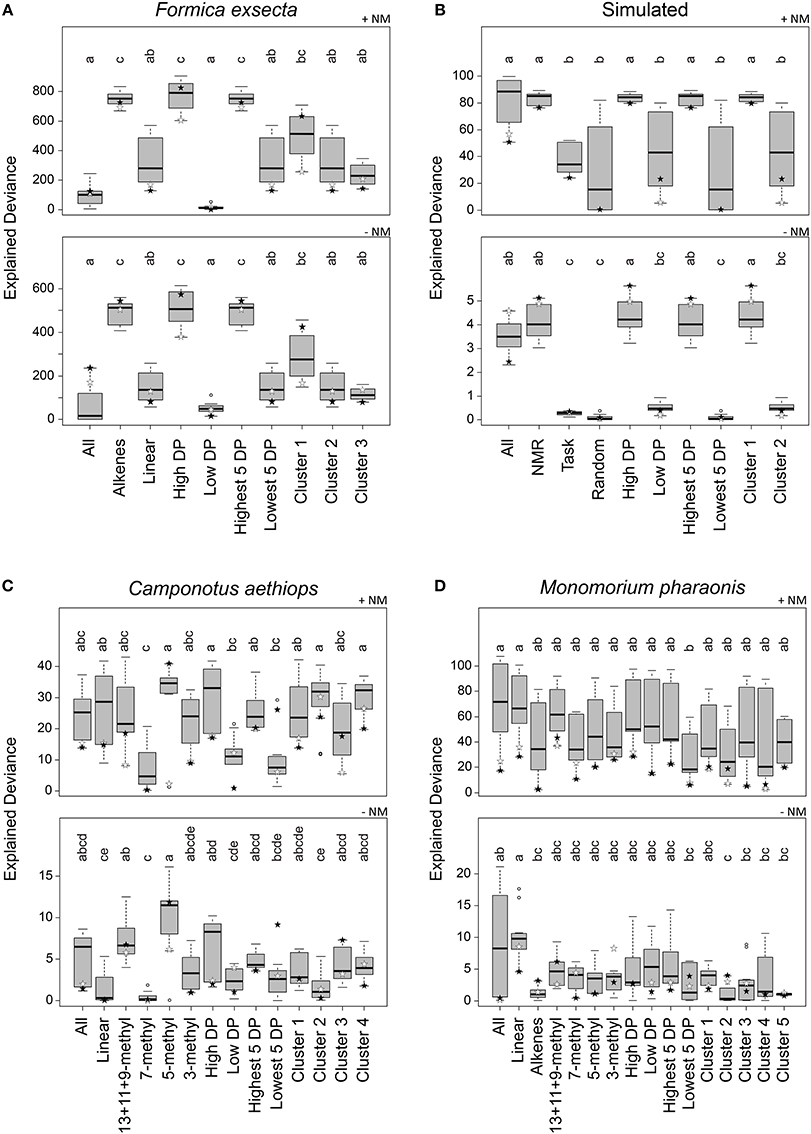
Figure 4. Explained deviance in observed aggression by compound sets over 12 combinations of normalization, centroid, and distance calculation. Datasets: (A) Formica exsecta, (B) Simulated data, (C) Camponotus aethiops, and (D) Monomorium pharaonis. +NM denotes regressions with nestmate controls included, −NM denotes regressions without nestmate controls. Within panels, compound groups with different letters are significantly different from each other (Kruskal–Wallis test with multiple comparisons, p < 0.05). Stars depict the most diagnostic permutation (global centroid and PC1 distance; black, percentage normalization, white, log-ratio transformed).
In the Simulated dataset we found a similar pattern as in the F. exsecta dataset, potentially because it was in part based on a comparable number of compounds and the chemical/behavioral patterns observed in this ant species. Using either All, NMR cues, High DP, Highest 5 DP, or Cluster 1 (each of which contained all or most of CHC 1–5; see Data Sheet 3) gave significantly higher explained deviance than the other compound sets (Figure 4B). If, however, we look only at the best combination (global centroid, PC1 distance), we find that the explained deviance of the All compound set dropped somewhat, whereas using compound sets NMR cues, High DP, Highest 5 DP, or Cluster 1 gave similarly high levels of explained deviance. It is interesting to note here that the combinations using Manhattan or Euclidean distance and group centroid resulted in explained deviances of the Random compound set that were almost equally as high as those of the NMR cues.
In the C. aethiops dataset, using either the compound set 5-methyl, High DP, Cluster 2 or Cluster 4, resulted in the best explained deviances (Figure 4C). High DP and Cluster 4 also had an overrepresentation of 5-methyl compounds, where the High DP compound set also included 13+11+9-methyl and 3-methyl alkanes, and Cluster 4 also included 7-methyl and 3-methyl alkanes (Data Sheet 3). Cluster 2 predominantly included linear alkanes and a 5-methyl alkane (Data Sheet 3). Based on these results, the 5-methyl alkanes seem the most likely compound set to start testing in bio-assays. This is, though, still quite a limited dataset, given that we only have 11 colony combinations with 12 trials each to identify NMR cues amongst 36 compounds. In comparison, the F. exsecta dataset has 29 colony combinations with 50–100 interactions each to identify NMR cues amongst 10 compounds, which likely gives a much better resolution.
In the M. pharaonis dataset, nothing explained between-colony aggression better than all compounds together (Figure 4D), but when only taking into account the most diagnostic combination, the linear and 13+11+9-methyl alkanes appear to be the best candidate compound sets. Here too, we have a more limited dataset than for F. exsecta, having 28 colony combinations, each with 3–6 trials, to differentiate amongst 45 compounds. An additional issue here may also be the coarse measure of aggression, where very aggressive and mildly aggressive colony combinations were both scored as aggressive. This may account for a low resolution in the obtained deviances.
Discussion
Identification of Likely Nestmate Recognition cues in C. aethiops and M. pharaonis
Altogether, we have shown that the method of regressing observed aggression on chemical distance is capable of identifying likely NMR cues, since the known NMR cues in the F. exsecta and Simulated datasets are indeed correctly identified. On the other hand, the picture is much less clear in the two other datasets, both of which also contain many more compounds (10 and 15 vs. 36 and 45). Moreover, the majority of the compounds found in C. aethiops and M. pharaonis share biosynthetic pathways, leading to high levels of multicollinearity. Hence, it is difficult to see whether the lack of a clear pattern in the latter two datasets is statistical or behavioral in nature. It is unlikely to be due to the number of compound variables, as that should be counteracted by the data selection (functional groups, ranking by diagnostic power, or variable clustering), which resulted in equally small compound sets as in the F. exsecta and Simulated datasets. A more likely explanation is the shared-biosynthetic-pathway and multicollinearity issue, as this results in different compound sets having similar chemical distances between a given combination of colonies, and hence similar explained deviances. Unfortunately, we currently have no means to test if 5-methyl hydrocarbons are indeed the true NMR cues of C. aethiops, which could confirm or disprove that this statistical method filters out the proper set of compounds.
Another possibility, one which we deem more likely in the case of M. pharaonis, is that any difference in odor profile leads to aggression, giving rise to a pattern where no single compound set explains aggression better than all compounds taken together. In the case of M. pharaonis, there is the additional issue that overt aggression is not readily expressed, which may result in a higher error rate in transcribing this behavior to data that correctly describes their true recognition of nNMs. The fact that the aggression data of M. pharaonis here is based on the number of trials where fighting was observed clearly does not offset this problem, since a trial with 20 couples fighting was classified as equal to a trial where only a single couple was fighting. We would have opted for this more fine-grained data, if we would also have had an estimate of the number of couples not fighting, but that was not the case. In the case of M. pharaonis, we may have yet another issue, which is that they also produce some alkaloids, monomorines (Ritter et al., 1973; Jackson et al., 2007), which we did not include in the data analysis but may be responsible for colony identity. If so, that would explain why we could not find a clear pattern amongst the hydrocarbons. The lack of resolution in M. pharaonis dataset might also be due to the fact that, due to the small size of these ants, we had to pool five individuals into one sample of hydrocarbon extract to obtain a readable chemical profile. This procedure may have homogenized the compounds that actually have high inter-individual variability and, in turn, masked the truly homogeneous NMR cues and rendered it much less likely to differentiate between these and other compounds. Although the pooling procedure might have masked the NMR cues in M. pharaonis, it gives us the opportunity to stress the fact that the methods outlined in this paper rely on high-resolution data, both in terms of behavioral data and chemical data, in order to get the desired discriminative power.
Compound Selection Methods
The use of diagnostic power may prove to be quite fruitful in this type of analysis, despite the fact that this data selection method was outperformed by subdivision into functional groups in the C. aethiops and M. pharaonis datasets. The High DP compound sets contained approximately the NMR cues in the F. exsecta and Simulated datasets, and thus gave high explained deviances, so this simple ranking can be helpful when the NMR cues are not known. It is only in the M. pharaonis dataset that High DP and Highest 5 DP compound sets did not result in higher explained deviances than Low DP and Lowest 5 DP, but that might also be due to the peculiarity in nestmate recognition of this species.
Variable clustering was less successful, as can be seen in the results for F. exsecta. Here, the breakdown of the five alkene compounds into two separate clusters resulted in much lower explained deviances for both clusters. In the Simulated dataset variable clustering did identify the NMR cues as a single cluster, but in both the C. aethiops and the M. pharaonis datasets this variable selection method was outperformed by the subdivision into functional groups. In the C. aethiops dataset, Cluster 2 and Cluster 4 gave high explained deviances when the regressions were run with nestmate controls, but this effect disappeared when these controls were omitted—showing that these clusters cannot account for the differences in aggression between colonies as well as 5-methyl alkanes can.
Best Combination of Calculation Methods
The use of log-ratio normalization did not have a very profound effect on our data analysis (Table 1), as compared to percentage normalization. Nonetheless, this normalization method is still recommended, also for other types of multivariate analyzes, because of the aforementioned lessened effect of “closure.”
The use of a global centroid appears to be a superior alternative to the group centroid when calculating chemical distances to detect NMR cues (Table 1). The main reason for this is not likely to be that using this centroid results in an increased fit for NMR cues, but rather that it results in a worse fit for other compounds. Using the group centroid, within-colony chemical distances are (incorrectly) zero by definition, whereas the global centroid allows within-colony variation in relative compound abundances to be taken into account in the regressions. And this difference in centroid usage has less of an effect on NMR cues than on other compounds because of their uniformity. The other compounds are likely subject to more random variation or variation related to other functions than nestmate recognition, such as task or reproductive state. In nestmate controls, such variation translates into chemical distances above zero, while there is still low or no aggression observed, leading to a worse fit of the regression than for NMR cues (Figure 3). Because of their uniformity, these NMR cues will experience lower chemical distances within colonies, which matches better with the low aggression between NMs. However, the effect appears to be even stronger than that, because the global centroid still comes out as significant in non-nestmate encounters of the F. exsecta dataset (Table 1). This is likely because of the same reason though: the low variance of NMR cues within colonies means that using a group or a global centroid approach does not greatly alter between-colony chemical distances, so that the explained deviances resulting from the regressions are very similar. The difference between these types of centroids is more pronounced with the higher within-colony variances of other compounds. Using the global centroid, these within-colony variances affect between-colony chemical distances in a more unpredictable way and apparently decrease the explained deviance even further as compared to using the group centroid approach.
The usage of PC1 distance, rather than Manhattan or Euclidean distance, also significantly increased the deviance ratios in both datasets (Table 1). Since this ratio is mostly increased because of a decrease in the denominator, it is perhaps best to first look at what happens when linear alkanes or task cues are entered as the compound set in the regression. PCA searches for the axis of maximum variance in the data, which then becomes the first principal axis or PC1, and variation perpendicular to this axis is filtered out when PC1 is used in further analysis (in our case this means that the distances on PC1 are taken as the chemical distances between individuals and colonies). Now, when a compound set such as linear alkanes or task cues is used, there will be some colony-specificity but the major variation in the data is related to task. Therefore, PC1 will encompass this task-related variation and filters out most of the colony-specific variation. For NMR cues, this should obviously not be the case. Comparatively, when using the Manhattan or Euclidean distance, all variation in the relative abundances of the compounds is taken into account and no such filtering is done.
Conclusions
Ultimately, NMR cues should be identified by means of bio-assays that manipulate the odor profiles and test the effect of this manipulation on the aggression of the insects, but the extension of statistical methods provided in this study may be useful in identifying likely candidate compounds. The best strategy is potentially to first perform all forms of variable selection described above (functional groups, diagnostic power and variable clustering) with nestmate controls, after which the different compound sets are tested in regressions using solely non-nestmate encounters. Only when a compound set can significantly explain the variation in aggression observed between different combinations of non-nestmate colonies can it be classified as a good candidate set. The same analysis can also be done with more power: instead of using colony averages, the chemical profile of the interacting individuals in single aggression tests can be analyzed and their distances regressed against the observed aggression. We also encourage the use of our new method of centroid calculation (i.e., the “global centroid” method) as alternative to the group centroid. First, the global centroid allows a better discrimination of NMR cues relative to other compounds, as was shown by our analysis of the F. exsecta and the simulated datasets. Second, it gives the possibility of calculating a chemical distance between NMs.
Overall, we think that the methods reported here can lead to the identification of NMR cues in more species, so that the study of the evolutionary and physiological underpinnings of these cues can be further elucidated. Lastly, we would also like to call out to anyone with a similar dataset of aggression and potential recognition cues to come forward and contact one of the authors. Perhaps together we can make sense of the NMs recognition cues of your study species.
Author Contributions
Jelle S. van Zweden, Luigi Pontieri, and Jes S. Pedersen conceived the study, Jelle S. van Zweden, and Luigi Pontieri performed the analyses, Jelle S. van Zweden, Luigi Pontieri, and Jes S. Pedersen wrote the manuscript.
Conflict of Interest statement
The authors declare that the research was conducted in the absence of any commercial or financial relationships that could be construed as a potential conflict of interest.
Acknowledgments
Jelle S. van Zweden was supported by the Research Foundation Flanders (FWO). Luigi Pontieri and Jes S. Pedersen were funded by a grant from the Danish National Research Foundation (grant number DNRF57). We thank all members of the Laboratory for Socioecology and Social Evolution (Leuven) and of the Centre for Social Evolution (Copenhagen) for the stimulating working environments.
Supplementary Material
The Supplementary Material for this article can be found online at: http://www.frontiersin.org/journal/10.3389/fevo.2014.00073/abstract
References
Akino, T., Yamamura, K., Wakamura, S., and Yamaoka, R. (2004). Direct behavioral evidence for hydrocarbons as nestmate recognition cues in Formica japonica (Hymenoptera: Formicidae). Appl. Entomol. Zool. 39, 381–387. doi: 10.1303/aez.2004.381
Badouin, H., Belkhir, K., Gregson, E., Galindo, J., Sundström, L., Martin, S. J., et al. (2013). Transcriptome characterisation of the ant Formica exsecta with new insights into the evolution of desaturase genes in social Hymenoptera. PLoS ONE 8:e68200. doi: 10.1371/journal.pone.0068200
Blomquist, G. J. (2010). “Biosynthesis of cuticular hydrocarbons,” in Insect Hydrocarbons: Biology, Biochemistry, and Chemical Ecology, eds G. J. Blomquist and A.-G. Bagnères (Cambridge: Cambridge University Press), 35–52.
Blomquist, G. J., and Bagnères, A.-G. (2010). Insect Hydrocarbons: Biology, Biochemistry, and Chemical Ecology. Cambridge: Cambridge University Press.
Bonavita-Cougourdan, A., Clément, J., and Lange, C. (1987). Nestmate recognition: the role of cuticular hydrocarbons in the ant Camponotus vagus Scop. J. Entomol. Sci. 22, 1–10.
Bos, N., Grinsted, L., and Holman, L. (2011). Wax on, wax off: nest soil facilitates indirect transfer of recognition cues between ant nestmates. PLoS ONE 6:e19435. doi: 10.1371/journal.pone.0019435
Pubmed Abstract | Pubmed Full Text | CrossRef Full Text | Google Scholar
Bos, N., Guerrieri, F. J., and d'Ettorre, P. (2010). Significance of chemical recognition cues is context dependent in ants. Anim. Behav. 80, 839–844. doi: 10.1016/j.anbehav.2010.08.001
Buczkowski, G., Kumar, R., Suib, S. L., and Silverman, J. (2005). Diet-related modification of cuticular hydrocarbon profiles of the Argentine ant, Linepithema humile, diminishes intercolony aggression. J. Chem. Ecol. 31, 829–843. doi: 10.1007/s10886-005-3547-7
Pubmed Abstract | Pubmed Full Text | CrossRef Full Text | Google Scholar
Chavent, M., Simonet, V. K., Liquet, B., and Saracco, J. (2012). ClustOfVar: an R package for the clustering of variables. J. Stat. Softw. 50, 1–16.
Christensen, J. H., and Tomasi, G. (2007). Practical aspects of chemometrics for oil spill fingerprinting. J. Chromatogr. A 1169, 1–22. doi: 10.1016/j.chroma.2007.08.077
Pubmed Abstract | Pubmed Full Text | CrossRef Full Text | Google Scholar
Clément, J.-L., and Bagnères, A.-G. (1998). “Nestmate recognition in termites,” in Pheromone Communication in Social Insects: Ants, Wasps, Bees and Termites, eds R. K. Vander Meer, M. D. Breed, K. E. Espelie and M. L. Winston (Boulder, CO: Westview Press), 126–155.
Couvillon, M. J., Caple, J. P., Endsor, S. L., Kaercher, M. H., Russell, T. E., Storey, D. E., et al. (2007). Nest-mate recognition template of guard honeybees (Apis mellifera) is modified by wax comb transfer. Biol. Lett. 3, 228–230. doi: 10.1098/rsbl.2006.0612
Pubmed Abstract | Pubmed Full Text | CrossRef Full Text | Google Scholar
Dani, F. R., Jones, G. R., Corsi, S., Beard, R., Pradella, D., and Turillazzi, S. (2005). Nestmate recognition cues in the honey bee: differential importance of cuticular alkanes and alkenes. Chem. Senses 30, 477–489. doi: 10.1093/chemse/bji040
Pubmed Abstract | Pubmed Full Text | CrossRef Full Text | Google Scholar
Dani, F. R., Jones, G. R., Destri, S., Spencer, S. H., and Turillazzi, S. (2001). Deciphering the recognition signature within the cuticular chemical profile of paper wasps. Anim. Behav. 62, 165–171. doi: 10.1006/anbe.2001.1714
d'Ettorre, P., Wenseleers, T., Dawson, J., Hutchinson, S., Boswell, T., and Ratnieks, F. L. W. (2006). Wax combs mediate nestmate recognition by guard honeybees. Anim. Behav. 71, 773–779. doi: 10.1016/j.anbehav.2005.05.014
Pubmed Abstract | Pubmed Full Text | CrossRef Full Text | Google Scholar
Greene, M. J., and Gordon, D. M. (2007). Structural complexity of chemical recognition cues affects the perception of group membership in the ants Linephithema humile and Aphaenogaster cockerelli. J. Exp. Biol. 210, 897–905. doi: 10.1242/jeb.02706
Pubmed Abstract | Pubmed Full Text | CrossRef Full Text | Google Scholar
Guerrieri, F. J., Nehring, V., Jørgensen, C. G., Nielsen, J., Galizia, C. G., and d'Ettorre, P. (2009). Ants recognize foes and not friends. Proc. R. Soc. B Biol. Sci. 276, 2461–2468. doi: 10.1098/rspb.2008.1860
Pubmed Abstract | Pubmed Full Text | CrossRef Full Text | Google Scholar
Hölldobler, B., and Michener, C. D. (1980). Mechanisms of identification and discrimination in social Hymenoptera. Life Sci. R. 18, 35–58.
Howard, R. W., and Blomquist, G. J. (2005). Ecological, behavioral, and biochemical aspects of insect hydrocarbons. Annu. Rev. Entomol. 50, 371–393. doi: 10.1146/annurev.ento.50.071803.130359
Pubmed Abstract | Pubmed Full Text | CrossRef Full Text | Google Scholar
Jackson, D. E., Martin, S. J., Ratnieks, F. L. W., and Holcombe, M. (2007). Spatial and temporal variation in pheromone composition of ant foraging trails. Behav. Ecol. 18, 444–450. doi: 10.1093/beheco/arl104
Lahav, S., Soroker, V., Hefetz, A., and Vander Meer, R. K. (1999). Direct behavioral evidence for hydrocarbons as ant recognition discriminators. Naturwissenschaften 86, 246–249. doi: 10.1007/s001140050609
Martin, S. J., and Drijfhout, F. P. (2009). Nestmate and task cues are influenced and encoded differently within ant cuticular hydrocarbon profiles. J. Chem. Ecol. 35, 368–374. doi: 10.1007/s10886-009-9612-x
Pubmed Abstract | Pubmed Full Text | CrossRef Full Text | Google Scholar
Martin, S. J., Helanter,ä, H., and Drijfhout, F. P. (2008a). Colony-specific hydrocarbons identify nest mates in two species of Formica ant. J. Chem. Ecol. 34, 1072–1080. doi: 10.1007/s10886-008-9482-7
Pubmed Abstract | Pubmed Full Text | CrossRef Full Text | Google Scholar
Martin, S. J., Vitikainen, E., Drijfhout, F. P., and Jackson, D. (2012). Conspecific ant aggression is correlated with chemical distance, but not with genetic or spatial distance. Behav. Genet. 42, 323–331. doi: 10.1007/s10519-011-9503-0
Martin, S. J., Vitikainen, E., Helanter,ä, H., and Drijfhout, F. P. (2008b). Chemical basis of nest-mate discrimination in the ant Formica exsecta. Proc. R. Soc. B Biol. Sci. 275, 1271–1278. doi: 10.1098/rspb.2007.1708
Pubmed Abstract | Pubmed Full Text | CrossRef Full Text | Google Scholar
Obin, M. S., and Vander Meer, R. K. (1988). Sources of nestmate recognition cues in the imported fire ant Solenopsis invicta Buren (Hymenoptera: Formicidae). Anim. Behav. 36, 1361–1370. doi: 10.1016/S0003-3472(88)80205-7
Ozaki, M., Wada-Katsumata, A., Fujikawa, K., Iwasaki, M., Yokohari, F., Satoji, Y., et al. (2005). Ant nestmate and non-nestmate discrimination by a chemosensory sensillum. Science 309, 311–314. doi: 10.1126/science.1105244
Pubmed Abstract | Pubmed Full Text | CrossRef Full Text | Google Scholar
Pontieri, L. (2014). Discrimination Behavior in the Supercolonial Pharaoh Ant. Ph.D. dissertation, University of Copenhagen.
R Core Team (2013). R: A Language and Environment for Statistical Computing. Vienna: R Foundation for Statistical Computing.
Ritter, F. J., Rotgans, I. E. M., Talman, E., Verwiel, P. E. J., and Stein, F. (1973). 5-methyl-3-butyl-octahydroindolizine, a novel type of pheromone attractive to Pharaoh's ants (Monomorium pharaonis (L.). Experientia 29, 530–531. doi: 10.1007/BF01926645
Schmidt, A. M., d'Ettorre, P., and Pedersen, J. S. (2010). Low levels of nestmate discrimination despite high genetic differentiation in the invasive pharaoh ant. Front. Zool. 7:20. doi: 10.1186/1742-9994-7-20
Pubmed Abstract | Pubmed Full Text | CrossRef Full Text | Google Scholar
Singer, T. L. (1998). Roles of hydrocarbons in the recognition systems of insects. Am. Zool. 38, 394–405. doi: 10.1093/icb/38.2.394
Soroker, V., Vienne, C., and Hefetz, A. (1995). Hydrocarbon dynamics within and between nestmates in Cataglyphis niger (Hymenoptera: Formicidae). J. Chem. Ecol. 21, 365–378. doi: 10.1007/Bf02036724
Pubmed Abstract | Pubmed Full Text | CrossRef Full Text | Google Scholar
Stroeymeyt, N., Guerrieri, F. J., Van Zweden, J. S., and d'Ettorre, P. (2010). Rapid decision-making with side-specific perceptual discrimination in ants. PLoS ONE 5:e12377. doi: 10.1371/journal.pone.0012377
Pubmed Abstract | Pubmed Full Text | CrossRef Full Text | Google Scholar
van Zweden, J. S., Brask, J. B., Christensen, J. H., Boomsma, J. J., Linksvayer, T. A., and d'Ettorre, P. (2010). Blending of heritable recognition cues among ant nestmates creates distinct colony gestalt odours but prevents within−colony nepotism. J. Evol. Biol. 23, 1498–1508. doi: 10.1111/j.1420-9101.2010.02020.x
Pubmed Abstract | Pubmed Full Text | CrossRef Full Text | Google Scholar
van Zweden, J. S., Dreier, S., and d'Ettorre, P. (2009). Disentangling environmental and heritable nestmate recognition cues in a carpenter ant. J. Insect Physiol. 55, 159–164. doi: 10.1016/j.jinsphys.2008.11.001
Pubmed Abstract | Pubmed Full Text | CrossRef Full Text | Google Scholar
van Zweden, J. S., and d'Ettorre, P. (2010). “Nestmate recognition in social insects and the role of hydrocarbons,” in Insect Hydrocarbons: Biology, Biochemistry and Chemical Ecology, eds G. J. Blomquist and A.-G. Bagnères (Cambridge: Cambridge University Press), 222–243.
Wagner, D., Tissot, M., Cuevas, W., and Gordon, D. M. (2000). Harvester ants utilize cuticular hydrocarbons in nestmate recognition. J. Chem. Ecol. 26, 2245–2257. doi: 10.1023/A:1005529224856
Wagner, D., Tissot, M., and Gordon, D. (2001). Task-related environment alters the cuticular hydrocarbon composition of harvester ants. J. Chem. Ecol. 27, 1805–1819. doi: 10.1023/A:1010408725464
Pubmed Abstract | Pubmed Full Text | CrossRef Full Text | Google Scholar
Keywords: cuticular hydrocarbons, principal component analysis, log-ratio transformation, global centroid, chemical distance, Formica exsecta, Camponotus aethiops, Monomorium pharaonis
Citation: van Zweden JS, Pontieri L and Pedersen JS (2014) A statistical approach to identify candidate cues for nestmate recognition. Front. Ecol. Evol. 2:73. doi: 10.3389/fevo.2014.00073
Received: 15 August 2014; Paper pending published: 17 September 2014;
Accepted: 19 October 2014; Published online: 06 November 2014.
Edited by:
Patrizia d'Ettorre, University Paris 13 - Sorbonne Paris Cité, FranceReviewed by:
Caroline Marie Nieberding, Université Catholique de Louvain, BelgiumAnne-Geneviève Bagnères, Centre National de la Recherche Scientifique, France
Michael John Greene, University of Colorado Denver, USA
Heikki Helanterä, University of Helsinki, Finland
Copyright © 2014 van Zweden, Pontieri and Pedersen. This is an open-access article distributed under the terms of the Creative Commons Attribution License (CC BY). The use, distribution or reproduction in other forums is permitted, provided the original author(s) or licensor are credited and that the original publication in this journal is cited, in accordance with accepted academic practice. No use, distribution or reproduction is permitted which does not comply with these terms.
*Correspondence: Jelle S. van Zweden, Laboratory of Socioecology and Social Evolution, Department of Biology, KU Leuven, Naamsestraat 59, PO Box 2466, 3000 Leuven, Belgium e-mail: jelle.vanzweden@bio.kuleuven.be