The spatial information content of the honey bee waggle dance
 Roger Schürch1,2*
  Francis L. W. Ratnieks1
- 1Laboratory of Apiculture and Social Insects, School of Life Sciences, University of Sussex, Brighton, UK
- 2Clinical Trials Unit, University of Bern, Bern, Switzerland
In 1954, Haldane and Spurway published a paper in which they discussed the information content of the honey bee waggle dance with regard to the ideas of Norbert Wiener, who had recently developed a formal theory of information. We return to this concept by reanalyzing the information content in both vector components (direction, distance) of the waggle dance using recent empirical data from a study that investigated the accuracy of the dance. Our results show that the direction component conveys 2.9 bits and the distance component 4.5 bits of information, which agrees to some extent with Haldane and Spurway's estimates that were based on data gathered by von Frisch. Of course, these are small amounts of information compared to what can be conveyed, given enough time, by human language, or compared to what is routinely transferred via the internet. Nevertheless, small amounts of information can be very valuable if it is the right information. The receivers of this information, the nestmate bees, know how to react adaptively so that the value of the information is not negated by its low information content.
1. Introduction
In 1954, Haldane and Spurway (1954) published a paper in the scientific journal Insectes Sociaux with the title “A statistical analysis of communication in Apis mellifera and a comparison with communication in other animals.” Haldane and Spurway (1954), using the data set of Karl von Frisch, looked at the waggle dance communication using an information theory approach, at least in terms of the direction communicated by a dancing bee (von Frisch, 1946, 1967). Of course, von Frisch's primary target was to understand the dance language, not to obtain a precise calibration to study where the bees had foraged: he chose to work only with good dancers (Chittka and Dornhaus, 1999), which seems to underestimate systematically the error present in the dances (Schürch and Couvillon, 2013; Schürch et al., 2013) and therefore bias the data.
Many years have now passed since the original paper, and we have a better understanding of what—and how well—the bees indicate with their dance (Couvillon, 2012; Couvillon et al., 2012; Schürch et al., 2013). Therefore, we were interested to revisit the ideas and theories put forward by Haldane and Spurway (1954) by analyzing them with our own calibration data from Schürch et al. (2013).
Here we first present the components of information theory that are necessary to understand the information content of events with continuous outcomes, such as foraging distance and direction. We then apply the theory thus presented to the data from our previous calibration experiment (Schürch et al., 2013). Our estimates should give a more accurate depiction of the information content of the dance and therefore will have implications for research on the evolution of the waggle dance communication.
2. Information and Communication
When a bee performs a waggle dance, she transfers information to her unoccupied nestmates about the location of a resource, for example food or a new nest site she has visited (von Frisch, 1946, 1967). In information theory, information is defined as a reduction in uncertainty (Shannon, 1948). Hence, from an information theory viewpoint, a dancing bee will reduce in her dance followers the uncertainty of where she, the dancer, has been collecting her food, or where she has found a suitable nest site. Information theory affords us a way of quantifying the initial uncertainty and the uncertainty remaining after a dance has occurred, which therefore allows for a quantification of the information.
The uncertainty in information theory is usually termed entropy and commonly represented by the symbol H (Shannon, 1948; Norwich, 1994). If we first consider a random event with x discrete outcomes and the probability of the ith possible outcome has probability pi, H is defined as
For example, in the case of waggle dance communication, the outcomes could represent honey bee foraging distances in hundreds of meters, that is we look at the probabilities that a returned forager has foraged at 0–100 (i = 1), 100–200 (i = 2), 200–300 (i = 3), … meters, and pi is the probability that a forager has foraged in the ith interval. In words, the uncertainty H is the sum of the weighted logarithms of the probabilities of the outcomes (Norwich, 1994). Choosing the base of the logarithm in the calculation of H is arbitrary. In computer science, the choice falls on base 2 because it reflects the on/off state of electronic switches, and the unit of H is the familiar bit. Following Norwich (1994) we use base e and natural units here, but we then convert our calculations to bits:
If information is the reduction in entropy, then, when H is reduced completely because we observe one of the discrete x outcomes, then information,  , is given by = H.
In our example of honey bee foraging distances measured in hundreds of meters, we would exactly know whether a bee has foraged between 200 and 300 m, or 300 and 400 m. Of course, interference may prevent the dance followers from exactly determining the duration of a dance's waggle run that reflects the foraging distance, or dancing bees may be constrained in how accurately they can dance (Tanner and Visscher, 2010; Couvillon et al., 2012; Preece and Beekman, 2014). For a dance follower, or for human observers, some residual uncertainty may remain, and hence the number of possible intervals at which a bee could have foraged after we have observed her dance is greater than 1, and < H (Figure 1).
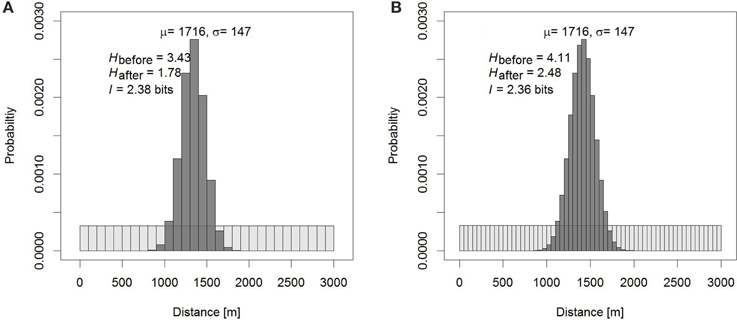
Figure 1. Information of the dance as the reduction in uncertainty in the dance. (A) If we know that a bee has foraged between 0 and 3 km, but not where, our prior knowledge attributes equal probabilities to the possibilities that the bee has visited any of 30 × 100 m bins (light gray bins). Knowing how the dance translates into distance, after observing the dance our uncertainty is reduced to a narrower area around the estimated distance μ, which is dependent on the standard deviation σ (dark gray bins). The difference between our prior uncertainty and the uncertainty that remains after observing the dance is the information communicated by the dance. The uncertainties, the entropies H, depend on the size of the bins, but the information does not. In (B), smaller bins have been chosen, and the entropies increase compared to (A), but the information does not change other than that the measurement of is more accurate.
Norwich (1994) gives an example related to language transmission over a noisy channel, for example a radio. We are asked to consider 10 possible numerals that are equally probable to be transmitted, so that entropy equals log 10. The spoken words for “five” and “nine” can be confused. So, even after one has heard the spoken numeral, there may be some uncertainty about whether “five” or “nine” was uttered at the sender's end. If after the transmission the probabilities of confusing “five” with “nine” and vice versa are equal, the entropy has been reduced from log 10 to log 2, but not to log 1 = 0. The information in this case is given by the uncertainty before hearing the word minus the uncertainty remaining after hearing the word, that is

From the definition of entropy, it also follows that the information, , depends on the set of values of the a priori probabilities, pi. If we observe the dances of marked bees that have been trained to feeders at known distances, we cannot gain information about foraging distance by observing waggle run durations. The received information is not an absolute quantity (Norwich, 1994).
Regarding the waggle dance communication, we are now only left with one thing to consider. The foraging distance, as well as the directional component, are not communicated discretely but on a continuous scale. Let us suppose that the probability density function p(x) represents the probability of a bee having foraged at distance x. Let x be measured in meters, and Δx is the constant length between discrete partitions of the continuous foraging distance. Then p(x)Δx = p(500)(1) is a reasonable approximation to the probability that the foraging distance of a returned forager selected at random from the population will be found to have foraged between 500 and 500 + 1 m. We can also choose a convenient upper limit for our considerations; 14 km is maximum foraging distance in bees reported in the literature and seems a reasonable choice (Eckert, 1933). We could fragment the probability density function into a number of narrow rectangles with Δx = 1 m and calculate the entropy H:
Note that if we would change our unit of measurement of bee foraging distances to cm, the uncertainty expressed by the entropy H would increase. If, on the other hand, we would take coarser measurements, say if we measured foraging distance in km, H would decrease. Similarly, we would see a change in the information conveyed by waggle dances. If we changed our unit of measurement to cm, we could receive a higher quantity of information, and with smaller and smaller units of measurement (Δx → 0), we could in the end obtain an infinite quantity of information (Norwich, 1994). This is a question of resolution.
Of course, we do not gain an unlimited amount of information from a dance, because Δx is not getting smaller without boundaries. The accuracy with which the foraging distance of a bee can be estimated from observing a dance is limited (Schürch et al., 2013), and this seems to be true also for nestmates, not only human observers (Seeley and Visscher, 1988; Towne and Gould, 1988; Tautz and Sandeman, 2003). It is unlikely that the accuracy of the measurement is as small as 1 m. Therefore, there is little point to measuring H with Δx = 1 m other than convenience, and therefore, we do not obtain an infinite quantity of information from a measurement of foraging distances through the waggle dance.
Luckily for us, while the differential entropy Hafter tends toward infinity, for our practical considerations, it does not play a role. Since the terms that tend toward infinity in both Hbefore and Hafter are the same, they cancel each other out when the difference is formed. As our prior expectations of where a bee has been, that is Hbefore is also increasing as our measuring intervals decrease, = Hbefore − Hafter approaches a constant as measuring intervals get smaller and smaller. For the purpose of measuring the information content empirically, it should therefore suffice to use discrete approximations for estimating Hbefore and Hafter.
Using the information theory outlined above, we chose to pursue the procedure outlined below. When observing foragers that have returned, but before having observed their dances, we assume a flat prior knowledge: in terms of the direction the forager has flown, we give equal probability to any possible angle on the interval [0, 2π). Similarly, we assume that the probability that a bee has flown any distance in the potential foraging range from [0, 14 km) is equal to any other distance. That is, for both vector components, we assume uniform random distributions for our pi before we observe the dance. How wide should our intervals for the pi be? Should we measure distance in meters, or tens or hundreds of meters? In reality, the measurement would be a continuous one. If we were interested in the uncertainty before or after observing a dance exclusively, we would run into problems if we choose infinitesimally fine resolutions (Δx → 0) for our measurements. As outlined above, for continuous random variables, entropy tends to infinity. As we also have seen, the information = Hbefore − Hafter will quickly approach our desired value, as we choose finer and finer resolutions. We therefore think it sufficient to consider a discrete approximation of our random variables, for distance, for example on the meter scale because that is convenient. To measure the information contained in both vector components, we use a numerical approach.
In our calibration experiment, we used normal errors to model the waggle run duration–distance calibration, and for the angles, we used the von Mises distribution. We will need to be able to calculate the probability densities for both vector components to calculate the entropy after observing a dance (Hafter) using the respective probability distribution. To calculate Hafter for the distance, we calculate the probabilities pi at each discrete step i using the built-in function dnorm in R (R Core Team, 2013) using our empirical estimates of how accurately we could measure distance (Schürch et al., 2013; Couvillon et al., 2014a,b). To calculate Hafter for the direction component of the vector, we used the dvonmises function from the circular package (Agostinelli and Lund, 2013) in R for all discrete steps i. Once we have pi, we can then calculate the information easily, which we will do here for distance and direction separately. The programs to estimate the respective information contents can be found in the electronic Supplementary Material.
3. Distance
As the information gained when observing the waggle dance depends on the prior information available, much in our calculations depends on the choice of the functions for these prior expectations. If we observe a bee that we know is a returning forager, for example because she is trophallaxing, what is our knowledge? In a previous paper on the waggle run duration–distance calibration, we have argued that we only really know that the bee has not been further than 14 km (Eckert, 1933; Schürch et al., 2013), and we attributed equal probabilities to all distances between 0 and 14 km as our prior knowledge. We follow this argument here as well. However, we would like to caution the reader that we will probably get an estimate of the maximum information that can be transferred by the dance. An experienced forager (or human dance decoder) who has followed many dances on a given day already could “gain” less knowledge, because, for example, she already knows that average foraging distances are much shorter than the 14 km maximum foraging range.
Calculating Hbefore is straight-forward. If we measure foraging distance in meters, the probability pi that a bee has visited any given ith distance is 1/14,000 for each of the is, and the entropy is
For the Hafter we have to discretize the continuous normal distribution and calculate the probability density at each step i
where μ is the mean and σ is the standard deviation of the normal distribution. Both these parameters can be estimated from observed dances using our calibration curve (Schürch et al., 2013; Couvillon et al., 2014a,b). Briefly, to get the probability distributions of foraging distances in Couvillon et al. (2014b) and Couvillon et al. (2014a) we used a linear calibration model using Gibbs sampling (described in Schürch et al., 2013, R and jags scripts for the calibration are available as Supplementary Material). From the posterior samples of this model (N = 1000 per dance) we then calculated the mean and the standard deviation for a given dance. Table 1 lists these parameters from 10 dances of Couvillon et al. (2014a) selected at random. Note that for the calculation of the Hafter, we have used 100 dances selected at random to calculate a mean μ = 1716.011 m and a mean σ = 147.246 m. We then use a computer program (see Supplementary Material) to calculate Hafter and consequently . If we do that, we get
and hence

or 4.53 bits.
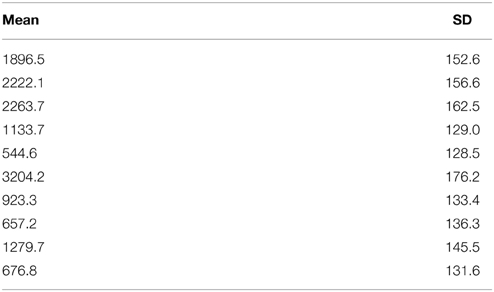
Table 1. Ten randomly selected dances from Couvillon et al. (2014a).
4. Direction
As for distance, we calculate the information of the directional component. Calculating Hbefore is once again straight-forward. The number of steps i will depend on how we divide the circle. For example, if we divide the circle into 16 slices, our step size will be π/8. Through trial and error, we found that a step size of π/512 is sufficient for an accurate measurement of the information content. Hbefore is then simply
For the calculation of Hafter we employ the same method as in the distance situation, replacing the normal probability density function with the probability density function of the von Mises distribution:
where μ is the mean direction, κ is the concentration parameter and I0 is the modified Bessel function of order 0. We used the circular package in R to calculate these probability densities (see Supplementary Material). We find that for μ = 0 and κ = 24.9 (Schürch et al., 2013), the entropy is
and the information in the directional component is

or 2.90 bits.
5. The Total Information in the Dance
The benefit of our recent approach to map the dance as a cloud of probabilities instead of a single point (Schürch et al., 2013; Couvillon et al., 2014a; Garbuzov et al., 2014) will now also allow us for the first time to calculate the combined spatial information directly (see Figure 2). We can overlay a finite landscape with a grid, and based on the simulated dances used in Couvillon et al. (2014a), we can calculate the probability that each of the squares in the grid has been visited. If each dance is represented by many simulations, the probability that a grid square had been visited by that dance was calculated as the number of simulated dances falling on that square divided by the total number of simulated dances.
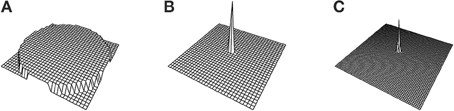
Figure 2. If we lay a grid over a finite landscape, we can calculate for each grid square the probability that a dance has pointed to it. In (A) we see depicted the prior probability assuming equal probability for each square within a 14 km radius. In (B,C) we depict the probabilities after a dance has been observed for 1750 and 875 m grid square length, respectively. This corresponds to the 3rd and 4th iteration in Figure 3.
We can again use a uniform prior expectation that each square has been visited, that is, our prior expectation of the probability that any square has been visited are assumed to be equal for all squares. We can calculate both Hbefore and Hafter, and then the information is the reduction of the uncertainty. The electronic Supplementary Material provides an R script calculating the information on an ever finer grid. Our numerical computations demonstrate that for our prior assumption of uniform probability within a 14 km radius, and as we choose finer and finer grid squares, the information content of the dance approaches a value around 7.3 bits (Figure 3).
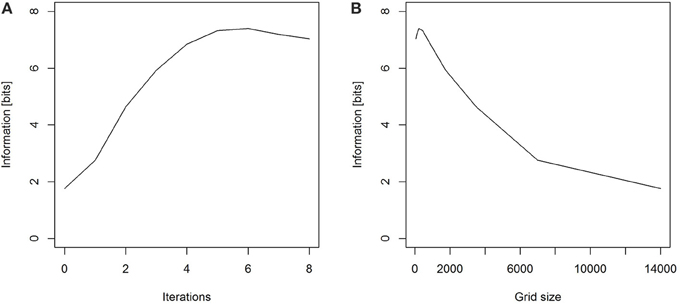
Figure 3. (A) As the number of iterations increases and hence (B) the size of the squares in the grid decreases, the information gained by observing a dance approaches a value of around 7.3 bits.
Note that for the calculation of information on the grid, we are now also limited by the number of simulated dances predicted from the calibration curve, and the smallest grid size we have chosen here is approximately 110 m. If we choose smaller grid sizes for 1000 simulations per dance, the probability landscape becomes discontinuous. More specifically, some of the grid squares will have no simulated dances on them, even though the probability that the general area had been visited was high. In that situation our discrete calculations do not reflect the true uncertainty anymore.
6. Discussion
Here we have shown, using previously published waggle dance calibration and waggle dance data, how to calculate the information content of the waggle dance. We also present an update on how much information is conveyed in waggle dances. In our first approach, where we discretized the distance and angular outcomes, we were able to calculate that the information about foraging distance conveyed by the dancing bees amounts to 4.53 bits, and that the angular information is 2.90 bits, for a summed information content of 7.43 bits. In a second approach, we have used simulated locations based on 10 waggle dances (N = 1000 per dance from Couvillon et al., 2014a) to show that the combined information content of the dance is about 7.3 bits, agreeing well with the single dance components measurement of information.
More than half a century has passed since the last attempt to calculate the information in the dance (Haldane and Spurway, 1954). Haldane and Spurway's seminal paper used data from von Frisch (1946). Since von Frisch and his pupils were more interested in the principles of the dance language instead of quantifying the information, they sought to eliminate variation in their experiments as much as possible (Chittka and Dornhaus, 1999), which creates difficulties for the calculation of information, as such calculations depend on this variation (Shannon, 1948; Norwich, 1994). Furthermore, Haldane and Spurway did not calculate the information for the distance component (Haldane and Spurway, 1954), which we have now done. We thought it therefore prudent to calculate the information conveyed by dancing bees by using our recent calibration and waggle dance data (Schürch et al., 2013; Couvillon et al., 2014a).
Our measurement for the angular information differs slightly from Haldane and Spurways (2.9 vs. 2.0 Haldane and Spurway, 1954), which could potentially be explained by a few reasons. First, as we have pointed out before, Haldane and Spurway used data that were not collected in a manner that would make it suitable for the calculation of information. Secondly, the data they used were from a different bee sub-species. If there are dialects among bee species (Boch, 1956; Su et al., 2008), then the information contained in the dance might also differ from species to species (but see Dyer and Seeley, 1991).
We cannot compare our calculated information for distance with other values in the literature. Additionally, as this calculation depends on the prior distribution, comparing values will also only make sense if these prior assumptions are the same. For example, our decision to assume a uniform prior distribution is somewhat arbitrary, even if the interval over 0–14 km is based on the literature (Eckert, 1933), which probably gives a physiological upper limit for foraging distance. In our environment, in vicinity of the Laboratory of Apiculture and Social Insects in Sussex, bees seem not forage at distances greater than 7 km (Couvillon et al., 2014a,b). If we were to use only half the distance for our prior uniform distribution, the estimate of information changes accordingly (3.56 bits for a 7 km uniform prior). Of course, the same is true when using our second approach, where we calculated the information from a grid. We therefore urge the reader to focus not only on the specific values presented in this or any other paper. Clearly, more calibration data covering the whole diversity of honey bee races and species in a range of environments will be necessary to get a clearer understanding on how much information is in the dance.
Despite the limitations outlined above, our calculations are a first step, and important questions arise from the calculations. For example, how much information in a dance is useful to a colony? Is one bit of spatial information helpful, that is, fly north or south? How useful are two bits that could communicate four directions unambiguously (north, east, south, west)? And how much better are the 2.9 bits, that is sectors of the circle of about 50°, that bees communicate? Much will probably depend on the environment (Sherman and Visscher, 2002; Donaldson-Matasci and Dornhaus, 2012; Okada et al., 2012), or the benefits of the spatial information may also depend on colony size (Donaldson-Matasci et al., 2013). For example, if a hive were situated in the middle of a large-scale farming landscape with mass flowering crops, a dance with relatively little information might be informative, whereas in a more fragmented landscape with small flower patches, more information will be necessary to allow a dance follower to find an advertised resource. Future honey bee foraging models should incorporate variability in the dance's information to investigate the relationship between spatial information content and adaptiveness of the dance.
Funding
RS has been funded by Rowse Honey.
Author Contributions
FLWR contributed to the concept and the writing of the manuscript. RS contributed to the concept, the numerical calculations, and the writing of the manuscript.
Conflict of Interest Statement
The authors declare that the research was conducted in the absence of any commercial or financial relationships that could be construed as a potential conflict of interest.
Acknowledgments
We thank Margaret Couvillon for sharing her waggle dance data.
Supplementary Material
The Supplementary Material for this article can be found online at: http://www.frontiersin.org/journal/10.3389/fevo.2015.00022/abstract
References
R Core Team (2013). R: A Language and Environment for Statistical Computing. Vienna: R Foundation for Statistical Computing.
Agostinelli, C., and Lund, U. (2013). R Package Circular: Circular Statistics (version 0.4-7). Venice: Department of Environmental Sciences, Informatics and Statistics, Ca' Foscari University; San Luis Obispo, CA: Department of Statistics, California Polytechnic State University.
Boch, R. (1956). Die Tänze der Bienen bei nahen und fernen Trachtquellen. Z. Vergl. Physiol. 38, 136–167. doi: 10.1007/BF00338624
Chittka, L., and Dornhaus, A. (1999). Comparisons in physiology and evolution, and why bees can do the things they do. Cienc. Int. 2, 1–17.
Couvillon, M. J., Phillipps, H. L. F., Schürch, R., and Ratnieks, F. L. W. (2012). Working against gravity: horizontal honeybee waggle runs have greater angular scatter than vertical waggle runs. Biol. Lett. 8, 540–543. doi: 10.1098/rsbl.2012.0182
PubMed Abstract | Full Text | CrossRef Full Text | Google Scholar
Couvillon, M., Schürch, R., and Ratnieks, F. (2014a). Dancing bees communicate a foraging preference for rural lands in high level agri-environment schemes. Curr. Biol. 24, 1212–1215. doi: 10.1016/j.cub.2014.03.072
PubMed Abstract | Full Text | CrossRef Full Text | Google Scholar
Couvillon, M. J., Schüch, R., and Ratnieks, F. L. (2014b). Dancing bees provide an integrated seasonal picture of foraging challenges. PLoS ONE 9:e93495. doi: 10.1371/journal.pone.0093495
Couvillon, M. (2012). The dance legacy of Karl von Frisch. Insect. Soc. 59, 297–306. doi: 10.1007/s00040-012-0224-z
Donaldson-Matasci, M. C., and Dornhaus, A. (2012). How habitat affects the benefits of communication in collectively foraging honey bees. Behav. Ecol. Sociobiol. 66, 583–592. doi: 10.1007/s00265-011-1306-z
Donaldson-Matasci, M. C., DeGrandi-Hoffman, G., and Dornhaus, A. (2013). Bigger is better: honeybee colonies as distributed information-gathering systems. Anim. Behav. 85, 585–592. doi: 10.1016/j.anbehav.2012.12.020
Dyer, F. C., and Seeley, T. D. (1991). Dance dialects and foraging range in three asian honey bee species. Behav. Ecol. Sociobiol. 28, 227–233. doi: 10.1007/BF00175094
Garbuzov, M., Schürch, R., and Ratnieks, F. L. W. (2014). Eating locally: dance decoding demonstrates that urban honey bees in Brighton, UK, forage mainly in the surrounding urban area. Urban Ecosyst. 1573–1642. doi: 10.1007/s11252-014-0403-y
Haldane, J., and Spurway, H. (1954). A statistical analysis of communication in Apis mellifera and a comparison with communication in other animals. Insectes Soc. 1, 247–283. doi: 10.1007/BF02222949
Okada, R., Akamatsu, T., Iwata, K., Ikeno, H., Kimura, T., Ohashi, M., et al. (2012). Waggle dance effect: dancing in autumn reduces the mass loss of a honeybee colony. J. Exp. Biol. 215(Pt 10), 1633–1641. doi: 10.1242/jeb.068650
PubMed Abstract | Full Text | CrossRef Full Text | Google Scholar
Preece, K., and Beekman, M. (2014). Honeybee waggle dance error: adaption or constraint? unravelling the complex dance language of honeybees. Anim. Behav. 94, 19–26. doi: 10.1016/j.anbehav.2014.05.016
Schürch, R., and Couvillon, M. (2013). Too much noise on the dance floor: intra- and inter-dance angular error in honey bee waggle dances. Commun. Integr. Biol. 6, 1–3. doi: 10.4161/cib.22298
Schürch, R., Couvillon, M. J., Burns, D., Tasman, K., Waxman, D., and Ratnieks, F. L. (2013). Incorporating variability in honey bee waggle dance decoding improves the mapping of communicated resource locations. J. Comp. Physiol. A Neuroethol. Sens. Neural Behav. Physiol. 199, 1143–1152. doi: 10.1007/s00359-013-0860-4
PubMed Abstract | Full Text | CrossRef Full Text | Google Scholar
Seeley, T., and Visscher, P. (1988). Assessing the benefits of cooperation in honeybee foraging: search costs, forage quality, and competitive ability. Behav. Ecol. Soc. 22, 229–237. doi: 10.1007/BF00299837
Shannon, C. E. (1948). A mathematical theory of communication. Bell Syst. Tech. J. 27, 379–423. doi: 10.1002/j.1538-7305.1948.tb01338.x
Sherman, G., and Visscher, P. K. (2002). Honeybee colonies achieve fitness through dancing. Nature 419, 920–922. doi: 10.1038/nature01127
PubMed Abstract | Full Text | CrossRef Full Text | Google Scholar
Su, S., Cai, F., Si, A., Zhang, S., Tautz, J., and Chen, S. (2008). East learns from west: asiatic honeybees can understand dance language of european honeybees. PLoS ONE 3:e2365. doi: 10.1371/journal.pone.0002365
PubMed Abstract | Full Text | CrossRef Full Text | Google Scholar
Tanner, D. A., and Visscher, P. K. (2010). Adaptation or constraint? reference-dependent scatter in honey bee dances. Behav. Ecol. Sociobiol. 64, 1081–1086. doi: 10.1007/s00265-010-0922-3
PubMed Abstract | Full Text | CrossRef Full Text | Google Scholar
Tautz, J., and Sandeman, D. C. (2003). Recruitment of honeybees to non-scented food sources. J. Comp. Physiol. A Neuroethol. Sens. Neural. Behav. Physiol. 189, 293–300. doi: 10.1007/s00359-003-0402-6
PubMed Abstract | Full Text | CrossRef Full Text | Google Scholar
Towne, W. F., and Gould, J. L. (1988). The spatial precision of the honey bees' dance communication. J. Insect Behav. 1, 129–155. doi: 10.1007/BF01052234
PubMed Abstract | Full Text | CrossRef Full Text | Google Scholar
von Frisch, K. (1946). Die Tänze der Bienen. Österr. Zool. Z. 1, 1–148. doi: 10.1007/978-3-642-94916-6_2
Keywords: honey bee, waggle dance, information theory, spatial information, Apis mellifera
Citation: Schürch R and Ratnieks FLW (2015) The spatial information content of the honey bee waggle dance. Front. Ecol. Evol. 3:22. doi: 10.3389/fevo.2015.00022
Received: 05 December 2014; Accepted: 24 February 2015;
Published: 18 March 2015.
Edited by:
Madeleine Beekman, The University of Sydney, AustraliaReviewed by:
Timothy Martin Schaerf, The University of Sydney, AustraliaMartin Middendorf, University of Leipzig, Germany
Copyright © 2015 Schürch and Ratnieks. This is an open-access article distributed under the terms of the Creative Commons Attribution License (CC BY). The use, distribution or reproduction in other forums is permitted, provided the original author(s) or licensor are credited and that the original publication in this journal is cited, in accordance with accepted academic practice. No use, distribution or reproduction is permitted which does not comply with these terms.
*Correspondence: Roger Schürch, Clinical Trials Unit, University of Bern, Finkenhubelweg 11, 3012 Bern, Switzerland roger.schuerch@ctu.unibe.ch