Using response surface methods to explore and optimize mating disruption of the leafminer Phyllocnistis citrella (Lepidoptera: Gracillariidae)
 Denis S. Willett
 Lukasz L. Stelinski
 Stephen L. Lapointe
- 1Department of Entomology and Nematology, Citrus Research and Education Center, University of Florida, Lake Alfred, FL, USA
- 2US Horticultural Research Laboratory, Agriculture Research Service, United States Department of Agriculture, Fort Pierce, FL, USA
The application of synthetic sex pheromones to disrupt mating of agricultural pests can be an effective and environmentally friendly alternative to pesticide applications. Optimizing mating disruption through examination of multiple interrelated variables may contribute to wider adoption in agriculture, especially in situations where pheromone synthesis is expensive. Simulations and field experiments designed to produce response surfaces by varying the distribution and number of pheromone dispensers suggested procedures whereby understanding optimization might be increased over that resulting from more common experiments focusing on one factor at a time. Monte Carlo simulations of a spatially explicit agent-based model resulted in nonlinear disruption profiles with increasing point source density. Field trials conducted in citrus infested by the leafminer Phyllocnistis citrella varied the amount of pheromone applied at each point source and point source density using attractive and non-attractive disruption blends. Trap catch disruption in the field resulted in nonlinear disruption profiles similar to those observed with simulations. Response surfaces showed an interaction between the amount of pheromone applied and the number of point sources for the attractive blend, but not for the non-attractive blend. Disruption surfaces were combined with cost curves to optimize trap catch disruption under real world cost constraints. The methods used here highlight the importance of experiment design for understanding the underlying biological dynamics governing mating disruption and optimizing its implementation.
Introduction
Mating disruption, the application of synthetic sex pheromones to prevent mating in agricultural pest species, has been promoted as an environmentally friendly complement to pesticide management. Since the first field trials in 1967 (Gaston et al., 1967), mating disruption has proven an effective management technique, particularly against moth pests such as the codling moth, Cydia pomonella (Cardé and Minks, 1995; Cardé, 2007). While mating disruption has been successfully implemented for a variety of pest species on approximately 770,000 ha worldwide (Witzgall et al., 2010), increases in the efficacy and efficiency of pheromone deployment may be achieved with new research and development methods facilitating increased adoption of mating disruption in agriculture.
Previous approaches to optimization of mating disruption strategies have used combinations of theory (Cardé and Minks, 1995; Miller et al., 2006a), modeling (Miller et al., 2006b; Byers, 2009, 2012), simulation (Byers, 2007), and field trials (Stelinski et al., 2008; Lapointe et al., 2009; Miller et al., 2010; Reinke et al., 2014) to both understand the mechanisms underlying mating disruption and improve its efficacy.
Validating theory through judicious design of models, simulations, and experiments is essential for understanding the phenomenon of mating disruption of insect pests and optimizing its practical implementation in agriculture. Here we determine the effect of dispensers, pheromone release, and their interaction, presenting examples of hypothetical outcomes from simulations along with original data from field experiments. Simulations extend the work of Byers (2007) by varying dispenser number and pheromone amount using Monte Carlo methods with a spatially explicit agent-based model consisting of a virtual field into which male moths, female moths, traps and dispensers are placed, interact, and are observed over multiple time steps. Results from the simulation are compared with data from field experiments using the attractive blend of two pheromone components of the leafminer, Phyllocnistis citrella Stainton (Lepidoptera: Gracillariidae), and a non-attractive “off-ratio” blend consisting of only one of the pheromone components. Because the two component blend [a 3:1 blend of (Z,Z,E)-7,11,13-hexadecatrienal:(Z,Z)-7,11-hexadecadienal] is attractive to P. citrella in Florida (Lapointe et al., 2006), we postulated that disruption using this blend occurs competitively; attractive point sources compete with females. Because the off-ratio single component blend [(Z,Z,E)-7,11,13-hexadecatrienal] is non-attractive (Stelinski et al., 2008), we presumed that disruption with this blend would occur non-competitively. Further investigation of the underlying categories of disruption was conducted using Miller-Gut and Miller-de Lame diagnostic plots (Miller et al., 2006a,b). As in the simulations, field trials varied dispenser number and pheromone amount. Results are presented using response surface modeling to convey underlying interactions among factors. These response surface models are then used to optimize performance given grower requirements and actual costs of application.
Materials and Methods
Simulation
A Monte Carlo simulation of a spatially explicit agent-based model was used to generate hypothetical outcomes of mating disruption while varying the number of pheromone point sources (number of dispensers) and pheromone amount (radius of effectiveness). The simulation is similar in many respects to that done by Byers (2007) in that the radius of effectiveness is roughly analogous to the two dimensional effective attraction radius used by Byers (2007, 2008, 2012). For each simulation, 100 males and 100 females were randomly placed into a virtual field following a random uniform distribution. The appropriate number of traps and pheromone point sources (dispensers) were placed into the field using a circle-packing algorithm to ensure uniformity of coverage (Bedward, 2010). Females, traps, and dispensers were assigned equivalent radii of effectiveness within which they could affect males. Under competitive disruption scenarios, males were attracted toward dispensers. Under noncompetitive disruption scenarios, males within a dispenser's radius of effectiveness were “jammed” and could not orient to females. Mating and trap catch were reported for each time step in a given scenario; each simulation scenario was replicated 1000 times. For each scenario, trap catch disruption (TCD) was calculated by comparing reported trap catch (TCR) with trap catch (TCC) from a control scenario (a simulation without dispensers) using the form TCD = 1 − and converted to a percentage. The simulation was implemented using the R computing language version 3.1.1 (R Core Team, 2013). Code and documentation can be found in the Supplementary Materials.
Field Trial
Dispensers (DCEPT CLM™) were provided by ISCA Technologies Inc., Riverside, CA, loaded with 2.7 mg of (Z,Z,E)-7,11,13-hexadecatrienal or 3.6 mg of a 3:1 blend of (Z,Z,E)-7,11,13-hexadecatrienal:(Z,Z)-7,11-hexadecadienal. [Note the 3.6 mg total amount for the blend reflects an equivalent amount of triene (2.7 mg) and diene (0.9 mg)].
A D-optimal amount x aggregation design was generated sufficient to detect quadratic curvature in both dimensions (aggregation and amount) using Design-Expert software (v.8, Stat-Ease Inc., Minneapolis, MN, USA). The design varied the amount of pheromone per point source and the aggregation of point sources and consisted of 20 runs (Table 1). The design provided 8 degrees of freedom for lack of fit and 6 for pure error. The same design was used for both the triene and 3:1 blend for a total of 40 runs. Each run corresponded to a 38.1 × 49.4 m plot consisting of 45 trees of mature grapefruit (Citrus paradisi) arranged in 5 rows of 9 trees each. Rows were 7.6 m apart and spacing between trees within rows was 5.5 m; area of plots was approximately 0.2 ha each with buffer zones of equal or greater size between plots. Monitoring traps (Pherocon VI Delta, Trece, Inc., Adair OK) with lures (IT203, ISCA Technology Inc.) containing the attractive 3:1 blend were placed in the center of each plot; sticky liners from the monitoring traps were recovered on a roughly weekly basis depending on field conditions for the duration of the field trial. Plots were randomly distributed within the grapefruit blocks selected for the study; plots were selected to minimize the number of missing trees. The grove was located in northwestern St. Lucie County, FL at 27° 30′N, 80° 38′W. The experiment was implemented on July 25, 2014 and conducted for 77 days until September 10, 2014.
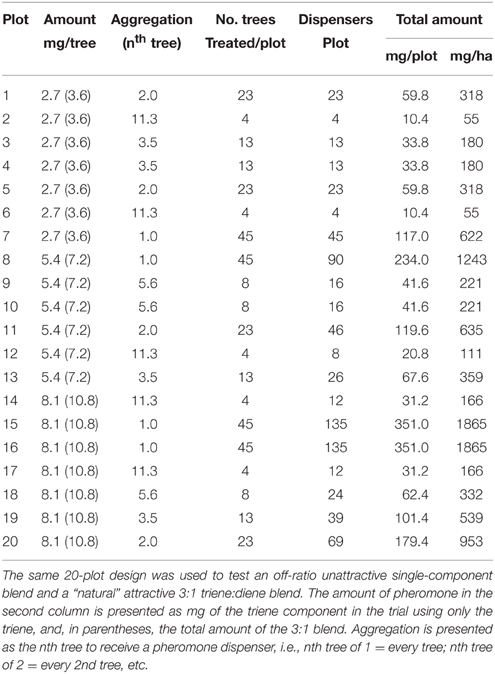
Table 1. Treatment combinations and parameters of two field trials using a D–optimal design to study the effect of amount of pheromone, aggregation of release points and their interaction on trap catch disruption for Phyllocnistis citrella.
Profiles of trap catch (raw data and scaled by trap catch in control plots to allow comparisons over time) with increasing numbers of treated trees for both the 3:1 blend and triene only applications and for each amount were visually examined and transformed in accordance with Miller-Gut (profiles of the inverse of trap catch with increasing numbers of treated trees) and Miller-de Lame (profiles of trap catch with increasing trap catch by treated trees) diagnostic plots to further investigate the categories of disruption as inferred from the biology of P. citrella (Miller et al., 2006a).
Because both the release rate of pheromone and the natural background population of P. citrella varied over time, comparison of results across the course of the experiment required adjustments to the release rate and trap catch. Release profiles of active ingredient (AI) from the DCEPT dispensers used in this trial follow an exponential decay function of the form Remaining AI = e0.98−0.017*Days [P < 0.001, F(1, 78) = 675.6, R2 = 0.90] (SLL, unpublished). Using the exponential decay function, the amount of pheromone released over a given observation period was calculated by multiplying the amount of AI remaining at the beginning of the observation period by the percent dissipation of the AI during the observation period. To account for natural background population fluctuations and as a convenient proxy for mating disruption (measuring actual mating disruption would involve monitoring tethered virgin females; traps baited with attractive lures mimic and are an expedient proxy for actual females), trap catch disruption in treated plots was calculated by comparing trap catch in treated plots (TCT) with trap catch in the nearest control plots (TCC) via TCD = 1 − . Response surfaces were fit to trap catch disruption using the rsm package in R (Lenth, 2009; R Core Team, 2013) and Design-Expert (v.8, Stat-Ease Inc., Minneapolis, MN, USA). All models from single factor to cubic polynomials were considered; models were chosen based on low P-values, non-significant lack of fit, and high R2-values. Response surface models that passed the initial criteria were then examined as described in Anderson and Whitcomb (2005). Box–Cox power transformations (Box and Cox, 1964) were explored and deemed unnecessary. Residuals were examined to identify and prevent egregious violations of assumptions of normality and homoscedasticity. Data and code used to generate results are available upon request.
Optimization
Growers seek to optimize return on investment. In this case, mating disruption is subject to cost constraints. Those costs can be combined with response surface models to determine the most desirable combination of factors influencing disruption while minimizing costs. The cost of application for a grower is dependent on three factors: labor, dispensers, and AI. Each factor is dependent on the amount of AI applied, the number of dispensers applied, or a combination of the two. The cost of labor for a DCEPT application is $5.44/acre based on actual application times and prevailing 2014 labor rates in Florida (SLL, unpublished). A single DCEPT dispenser costs $0.04. The cost of application for 2.6 mg of triene as the AI applied to each tree, excluding labor but including the cost of dispensers, was 75 dollars per acre at 134 trees per acre. Back calculated from the per acre cost of product, the cost of triene as the AI was $0.20 per milligram. Multiplying that cost by the amount of AI applied and the number of trees treated resulted in the total cost of application for a given area. The diene component is 15 times less expensive than the triene; the cost of the blend (3:1 triene:diene) formulation is the cost of a triene application plus the cost of the diene component.
Cost curves were generated using the amount of pheromone necessary to achieve the release amounts from disruption trials at 10 weeks post-deployment and the number of treated trees for both triene only and blend applications to estimate cost of applications on a per acre basis. Cost curves were combined with trap catch disruption response surfaces to produce desirability curves according to:
Desirability can be thought of as the additional trap catch disruption obtained per unit cost. Based on our experience, we assume growers are unlikely to purchase a product that produces less than 90% trap catch disruption. Subtracting 0.9 from trap catch disruption results in positive desirability scores when trap catch disruption is >90%, and negative desirability scores when trap catch disruption is <90%. Desirability was scaled so that the resulting maximum equals one and can be interpreted as 100% desirable. Data and code used to generate results are available upon request.
Results
Simulation
Monte Carlo simulations of trap catch disruption (TCD) that varied radius of effectiveness (analogous to the amount of AI in each dispenser) and dispenser density resulted in nonlinear disruption profiles (Figure 1) for both attractive and non-attractive scenarios that at higher radii of effectiveness fit increasing exponential decay models of the form TCD ∝ (Table 2).
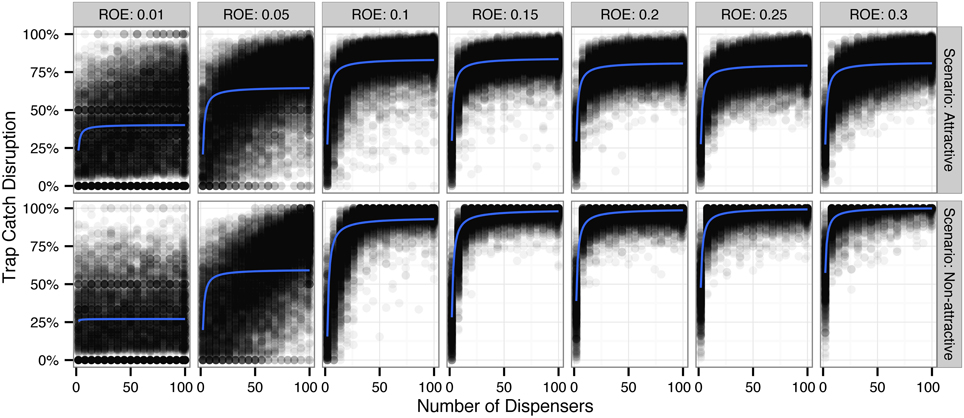
Figure 1. Simulated trap catch disruption (TCD) for attractive and non-attractive scenarios by radius of effectiveness (ROE). ROE is analogous to the amount of pheromone applied to each dispenser (point source). Blue lines indicate a fit using an increasing exponential decay model of the form TCD ∝ (see Table 2 for model diagnostics).
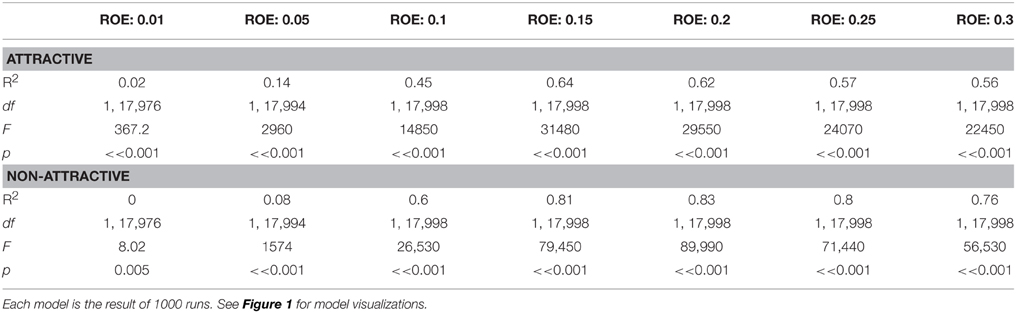
Table 2. Increasing exponential decay model summaries generated by Monte Carlo methods for simulated trap catch disruption under attractive and non-attractive scenarios.
Field Trial
Field data, examined with two-dimensional slices along a given amount deployed to the field (Figure 2), yielded nonlinear disruption profiles for both attractive (3:1 Blend) and non-attractive (Triene Only) disruption blends similar to those produced by the simulation (Figure 1). These two-dimensional slices are best explained (p < 0.0001 for all models; R2-values in Figure 2) by an increasing exponential decay model with the formula:
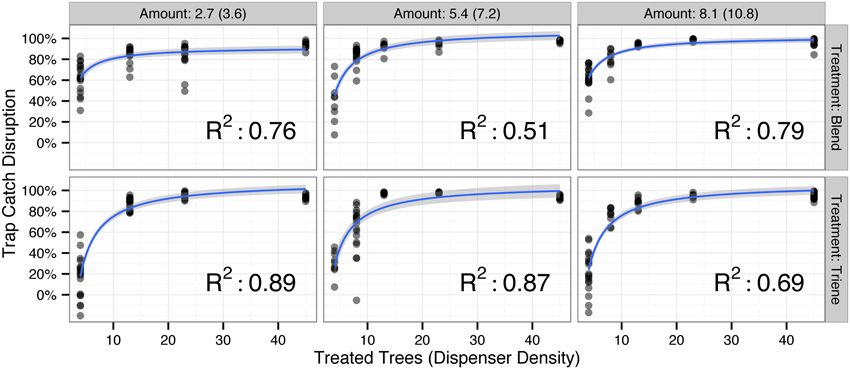
Figure 2. Observed trap catch disruption from field data by the amount (in mg/tree active ingredient) deployed to the field for both the triene only (non-attractive) and 3:1 triene:diene blend (attractive) treatment (total blend amount in parentheses). All nonlinear disruption profiles fit an increasing exponential decay model of the form Trap Catch Disruption ∝ with p-values < 0.0001 and R2-values depicted in the lower right corner of each plot. Points denote raw data; blue lines and shaded gray area denote model fit and model standard error respectively.
Investigation of categories of mating disruption using Miller-Gut and Miller-de Lame plots was conducted with comparison to expected profiles (Figure 3; Miller et al., 2006a). Raw data (Figure 4) did not perfectly fit expected profiles. Scaling trap catch (Figure 5) to account for background population variations resulted in non-linear profiles (Figure 5, top panel). Miller-Gut profiles could be loosely construed to match linear profiles, although R2-values for many amounts were small and, due to the transformation, violated assumptions of homoscedasticity (Figure 5, middle panel).
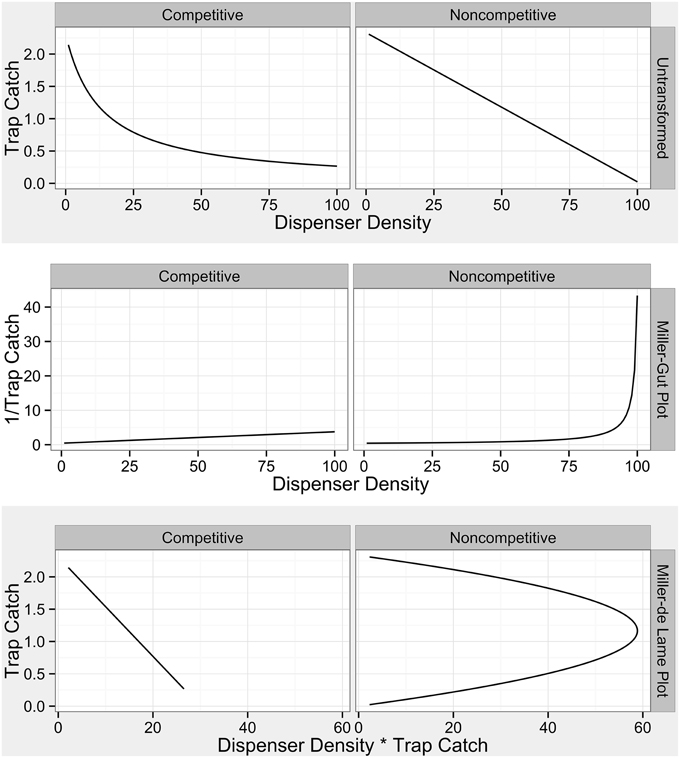
Figure 3. Diagnostic plots for categories of mating disruption from Miller et al. (2006a). Competitive disruption profiles are established in Equation 1 of Miller et al. (2006a) and noncompetitive profiles are established in equation 16 of Miller et al. (2006a).
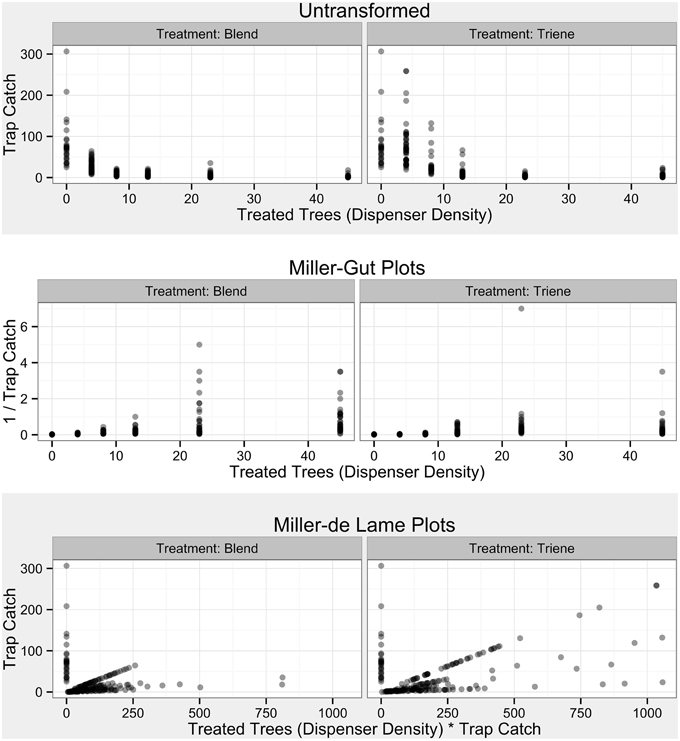
Figure 4. Raw Data from Field Trials by treatment and in accordance with diagnostic plots from Miller et al. (2006a). Transparent points denote specific observations; more opaque points indicate overlap of many points.
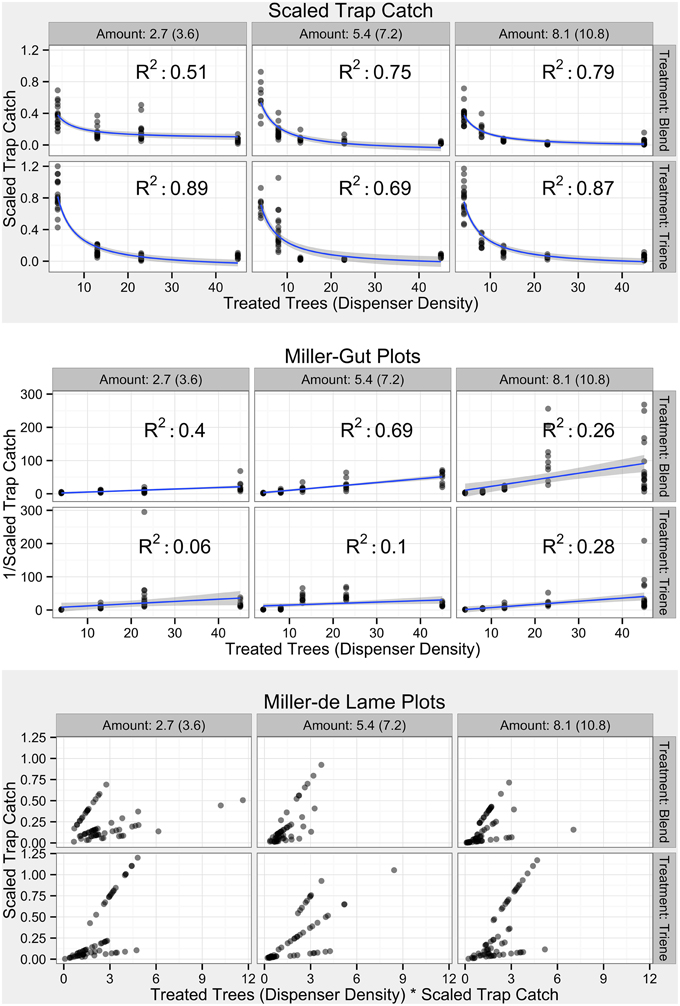
Figure 5. Field Diagnostic Plots by treatment and in accordance with diagnostic plots from Miller et al. (2006a). Transparent points indicate specific observations; more opaque points indicate overlap of many points. Blue lines and shaded gray areas in the untransformed plots (top shaded panel) indicate a model fit where Scaled Trap Catch ∝ and standard error respectively. Blue lines and shaded gray areas in the Miller-Gut plots (middle unshaded panel) indicate a linear model fit (despite heteroscedasticity) where ∝ Treated Trees and standard error respectively.
Further analysis using response surface methods revealed that while the number of treated trees (point sources) was significant in explaining trap catch disruption for both the attractive (3:1 blend) and non-attractive (triene only) treatments, the effect of release amount, and the interaction between release amount and number of treated trees was only significant for the attractive blend (Table 3). Response surfaces (Figure 6) indicate that high trap catch disruption (close to 100%) was achieved at high release amounts and treated trees for the attractive blend treatment. For the triene treatment, high disruption was achieved at high numbers of treated trees irrespective of amount.
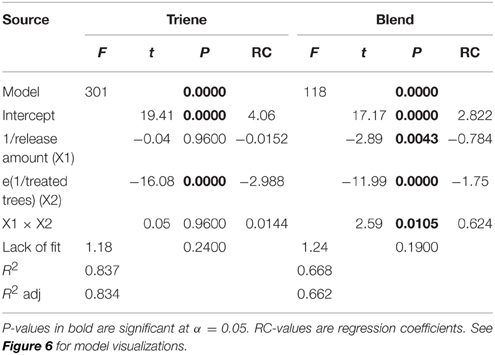
Table 3. ANOVA and model diagnostics for trap catch disruption response surfaces for both the 3:1 triene: diene blend (attractive blend) and triene only (non-attractive blend) treatment.
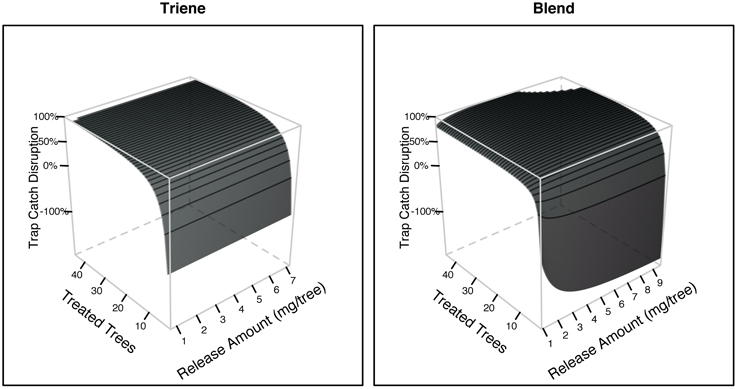
Figure 6. Trap catch disruption response surfaces derived from field data for both the 3:1 triene:diene blend (attractive) and triene only (non-attractive) treatment. Treated trees are the number of individual trees with dispensers in each plot (i.e., the number of point sources). Release amount is the amount of active ingredient emitted by dispensers calculated from dissipation profiles.
Optimization
Cost contour plots indicate an interaction between release amount and the number of treated trees, but the difference in costs between a 3:1 blend and triene application are insubstantial (Figure 7). Desirability contour plots suggest that choosing a triene application at a relatively low release rate with a point source density of approximately 89% (40 treated trees out of 45 total trees per plot) should be economically more desirable to growers than the 3:1 blend (Figure 8).
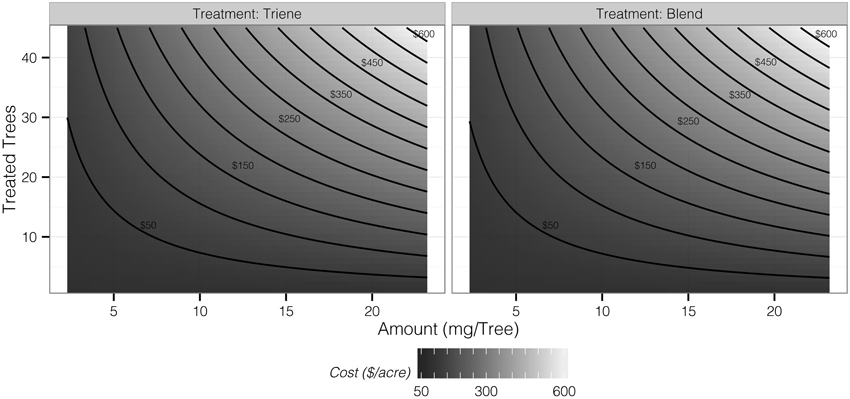
Figure 7. Contours of application cost per acre as determined by the number of treated trees and amount of triene component applied.
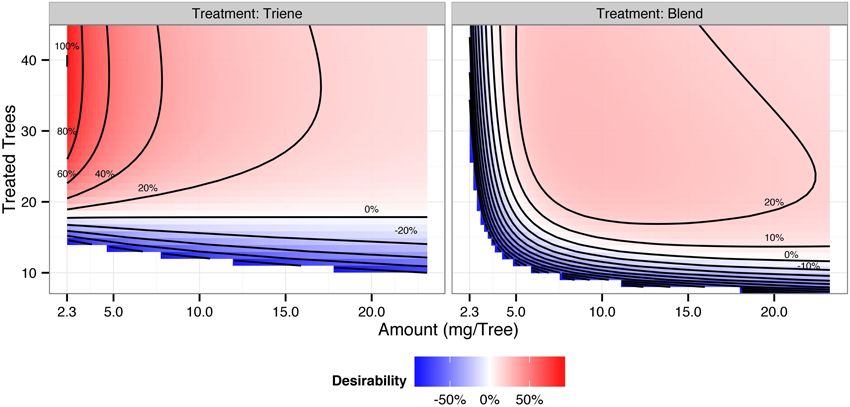
Figure 8. Desirability contours of a 3:1 triene:diene blend (attractive) and triene only (non-attractive) application. Desirability, interpreted as the additional trap catch disruption obtained per unit cost, is calculated according to , and is scaled so that 100% is the maximum desirability. Positive desirability scores reflect trap catch disruption above 90%; negative desirability scores reflect trap catch disruption below 90%.
Discussion
Both simulations and field data produced nonlinear disruption profiles with increasing number of point sources (dispensers in the simulation and number of treated trees in the field) for both attractive and non-attractive blends (3:1 blend and triene only field applications). Previous work has indicated that competitive and noncompetitive disruption scenarios could be differentiated based on differences in disruption profiles with increasing dispenser density along with diagnostic transformations (Miller et al., 2006a,b). Competitive disruption scenarios produce nonlinear disruption profiles, while noncompetitive disruption increases linearly with increasing point source density (Miller et al., 2006a,b). Transformations of competitive disruption profiles using diagnostic Miller-Gut plots are expected to produce linear profiles under competitive disruption and nonlinear profiles under noncompetitive disruption while Miller-de Lame transformations are expected to maintain linearity under competitive disruption and manifest a recurve under noncompetitive disruption (Miller et al., 2006a,b). Field data for both the 3:1 blend and triene only applications did not perfectly match expected disruption profiles due to the lack of low-density points in the experimental design. Because the objective of the field trial was to optimize disruption at high levels, lower density points were not practical and excluded from the design as they were a priori known to be ineffective. Indeed, P. citrella is an outlier taxonomically and in terms of trap catch (one thousand male moths a week is not uncommon) when compared to many previously studied systems (such as the codling moth where trap catch can be up to two orders of magnitude less).
Data from both the simulation and field trial also suggest that differentiation of mating disruption categories in this case may not be possible based on single factor disruption profiles alone. Results from attractive and non-attractive simulations produced nonlinear disruption profiles that fit increasing exponential decay models as do data from field applications of the attractive 3:1 blend and non-attractive triene treatments. It should be noted, however, that the degree of nonlinearity observed is heavily dependent on the sampling method. Sampling narrow ranges of point sources will tend to produce results that may appear to be linear as will considering only a few distinct point sources.
The nonlinear disruption profiles produced by the simulations and field data may be interesting, but they still use a single factor (number of point sources) to explain the observed phenomenon (trap catch disruption). While a single factor may be sufficiently significant in explaining trap catch disruption in the noncompetitive triene treated field plots, the significant interaction between release amount and treated trees in the attractive blend treatment suggest that the one factor at a time (OFAT) approach for exploring mating disruption may not be as useful as an approach that also considers interactions among multiple factors. Knowing that both the amount of pheromone present in a dispenser and the number of dispensers deployed affect trap catch disruption, and moreover interact, not only provides a basis for conjecture about the dynamics underlying the observed categories of mating disruption, but also allows for further optimization of mating disruption under field conditions, a result that is likely of greater value to practitioners of mating disruption.
Under our conditions and the range of pheromone emission rates tested, the amount of pheromone released per unit area did not affect trap catch disruption using the non-attractive (triene only blend) field scenario while it affected both trap catch disruption and interacted with the number of point sources with the attractive blend. While release amounts below an effective threshold may result in an effect of amount on the triene response surface, the range of values considered in this trial had no effect. Biologically, this suggests that the amount of AI needed to non-attractively camouflage, mask, or jam the true signals from available females is set at a certain threshold and additional triene above that threshold has no effect. Similarly, the interaction effect between amount of pheromone and number of devices under the attractive (3:1 blend) scenario could be a result of the increased attraction (or radius of attraction) of the dispensers with higher amounts.
The observed behaviors, however, exist and through the described design of experiments, can be integrated with real world costs to optimize return on investment for the grower. Attempting optimization through OFAT experiments or focusing solely on cost may result in incremental improvements but is unlikely to optimize implementation of mating disruption. Attempting to maximize (or minimize) one isolated parameter will likely occur at the loss of another. For example, maximizing trap catch disruption by focusing on optimal dispenser density will not provide information regarding the optimal amount of pheromone release and may prove too costly for practical application. Likewise, minimizing costs will likely result in ineffective applications. Optimization is not merely an improvement nor a demonstration that one outcome is better than another, but implies consideration of all relevant factors and identification of the particular combination of factor values that results in the most desirable outcome.
As demonstrated here, combining response surfaces from field trials with real world cost curves provides a desirability framework from which growers and researchers can make informed decisions about implementing mating disruption. In the case of mating disruption for P. citrella, a non-attractive blend (triene only) was more desirable than a more complete two-component blend primarily because the efficacy of the non-attractive blend depends solely on point source density irrespective of amount (i.e., there is no interaction between the two). Also, in this case it was not necessary to maximize the density of point sources. In the case of P. citrella, optimal point source density was approximately 89% (40 treated trees out of 45 trees per plot) using the non-attractive blend; beyond that point there was no additional benefit for trap catch disruption.
While applied here to disruption of leafminers in citrus, the methods of combining experimental design, response surface methods, and grower costs to identify optima are not unique nor system specific. Implemented more broadly, these methods could improve the efficiency and return on investment of mating disruption across a diversity of cropping systems. Ultimately, the results of such experimentation and implementation may improve our understanding of the underlying mechanisms governing mating disruption while optimizing its practical implementation.
Conflict of Interest Statement
The authors declare that the research was conducted in the absence of any commercial or financial relationships that could be construed as a potential conflict of interest.
Acknowledgments
We thank Rocco Alessandro, Justin George, Jiemin Liu, Larry Markle and Rylan Mermer (USDA-ARS, Ft. Pierce, FL) for assistance in deploying and monitoring the field trial and Xavier Martini (University of Florida, Lake Alfred, FL) for fruitful modeling discussions. ISCA Technologies, Inc. (Riverside, CA) provided lures and DCEPT CLM™ devices. Significant funding was provided by the Citrus Research and Development Foundation. Mention of a trademark or proprietary product does not constitute a guarantee or warranty of the product by the United States Department of Agriculture and does not imply its approval to the exclusion of other products that may also be suitable.
Supplementary Material
The Supplementary Material for this article can be found online at: http://www.frontiersin.org/journal/10.3389/fevo.2015.00030/abstract
References
Anderson, M. J., and Whitcomb, P. J. (2005). RSM Simplified: Optimizing Processes Using Response Surface Methods for Design of Experiments. New York, NY: Productivity Press.
Bedward, M. (2010). Circle Packing with R. Available online at: http://lastresortsoftware.blogspot.com/2010/07/circle-packing-with-r.html.
Byers, J. A. (2007). Simulation of mating disruption and mass trapping with competitive attraction and camouflage. Environ. Entomol. 36, 1328–1338. doi: 10.1603/0046-225X(2007)36[1328:SOMDAM]2.0.CO;2
PubMed Abstract | Full Text | CrossRef Full Text | Google Scholar
Byers, J. A. (2008). Active space of pheromone plume and its relationship to effective attraction radius in applied models. J. Chem. Ecol. 34, 1134–1145. doi: 10.1007/s10886-008-9509-0
PubMed Abstract | Full Text | CrossRef Full Text | Google Scholar
Byers, J. A. (2009). Modeling distributions of flying insects: effective attraction radius of pheromone in two and three dimensions. J. Theor. Biol. 256, 81–89. doi: 10.1016/j.jtbi.2008.09.002
PubMed Abstract | Full Text | CrossRef Full Text | Google Scholar
Byers, J. A. (2012). Modelling female mating success during mass trapping and natural competitive attraction of searching males or females. Entomol. Exp. Appl. 145, 228–237. doi: 10.1111/eea.12006
Cardé, R. T. (2007). “Using pheromones to disrupt mating of moth pests,” in Perspectives in Ecological Theory and Integrated Pest Management, eds M. Kogan and P. Jepson (Cambridge: Cambridge University Press), 122–170.
Cardé, R. T., and Minks, A. K. (1995). Control of moth pests by mating disruption: successes and constraints. Annu. Rev. Entomol. 40, 559–585. doi: 10.1146/annurev.en.40.010195.003015
Gaston, L., Shorey, H., and Saario, C. (1967). Insect population control by the use of sex pheromones to inhibit orientation between the sexes. Nature 213:1155.
Lapointe, S. L., Hall, D., Murata, Y., Parra-Pedrazzoli, A. L., Bento, J. M. S., Vilela, E. F., et al. (2006). Field evaluation of a synthetic female sex pheromone for the leafmining moth Phyllocnistis citrella (Lepidoptera: Gracillariidae) in florida citrus. Fl. Entomol. 89, 274–276. doi: 10.1653/0015-4040(2006)89[274:FEOASF]2.0.CO;2
Lapointe, S. L., Stelinski, L. L., Evens, T. J., Niedz, R. P., Hall, D. G., and Mafra-Neto, A. (2009). Sensory imbalance as mechanism of orientation disruption in the leafminer Phyllocnistis citrella: elucidation by multivariate geometric designs and response surface models. J. Chem. Ecol. 35, 896–903. doi: 10.1007/s10886-009-9674-9
PubMed Abstract | Full Text | CrossRef Full Text | Google Scholar
Lenth, R. V. (2009). Response-Surface Methods in R, Using rsm. Available online at: http://www.jstatsoft.org/v32/i07/.
Miller, J. R., Gut, L. J., de Lame, F. M., and Stelinski, L. L. (2006a). Differentiation of competitive vs. non-competitive mechanisms mediating disruption of moth sexual communication by point sources of sex pheromone (part I): theory. J. Chem. Ecol. 32, 2089–2114. doi: 10.1007/s10886-006-9134-8
PubMed Abstract | Full Text | CrossRef Full Text | Google Scholar
Miller, J. R., Gut, L. J., de Lame, F. M., and Stelinski, L. L. (2006b). Differentiation of competitive vs. non-competitive mechanisms mediating disruption of moth sexual communication by point sources of sex pheromone (part 2): case studies. J. Chem. Ecol. 32, 2115–2143. doi: 10.1007/s10886-006-9136-6
PubMed Abstract | Full Text | CrossRef Full Text | Google Scholar
Miller, J. R., McGhee, P. S., Siegert, P. Y., Adams, C. G., Huang, J., Grieshop, M. J., et al. (2010). General principles of attraction and competitive attraction as revealed by large-cage studies of moths responding to sex pheromone. Proc. Natl. Acad. Sci. U.S.A. 107, 22–27. doi: 10.1073/pnas.0908453107
PubMed Abstract | Full Text | CrossRef Full Text | Google Scholar
R Core Team. (2013). R: A Language and Environment for Statistical Computing. Available online at: http://www.r-project.org
Reinke, M. D., Siegert, P. Y., McGhee, P. S., Gut, L. J., and Miller, J. R. (2014). Pheromone release rate determines whether sexual communication of Oriental fruit moth is disrupted competitively vs. non-competitively. Entomol. Exp. Appl. 150, 1–6. doi: 10.1111/eea.12137
Stelinski, L. L., Miller, J. R., and Rogers, M. E. (2008). Mating disruption of citrus leafminer mediated by a noncompetitive mechanism at a remarkably low pheromone release rate. J. Chem. Ecol. 34, 1107–1113. doi: 10.1007/s10886-008-9501-8
PubMed Abstract | Full Text | CrossRef Full Text | Google Scholar
Witzgall, P., Kirsch, P., and Cork, A. (2010). Sex pheromones and their impact on pest management. J. Chem. Ecol. 36, 80–100. doi: 10.1007/s10886-009-9737-y
PubMed Abstract | Full Text | CrossRef Full Text | Google Scholar
Keywords: mating disruption, design of experiments (DOE), response surface methods, citrus leafminer, Phyllocnistis citrella
Citation: Willett DS, Stelinski LL and Lapointe SL (2015) Using response surface methods to explore and optimize mating disruption of the leafminer Phyllocnistis citrella (Lepidoptera: Gracillariidae). Front. Ecol. Evol. 3:30. doi: 10.3389/fevo.2015.00030
Received: 28 October 2014; Accepted: 07 March 2015;
Published: 25 March 2015.
Edited by:
Stefano Colazza, University of Palermo, ItalyReviewed by:
Stephen A. Teale, State University of New York College of Environmental Science and Forestry, USAJohn Allen Byers, United States Department of Agriculture-Agriculture Research Service, USA
Copyright © 2015 Willett, Stelinski and Lapointe. This is an open-access article distributed under the terms of the Creative Commons Attribution License (CC BY). The use, distribution or reproduction in other forums is permitted, provided the original author(s) or licensor are credited and that the original publication in this journal is cited, in accordance with accepted academic practice. No use, distribution or reproduction is permitted which does not comply with these terms.
*Correspondence: Stephen L. Lapointe, US Horticultural Research Laboratory, Agriculture Research Service, United States Department of Agriculture, 2001 South Rock Road, Fort Pierce, FL 34945, USA stephen.lapointe@ars.usda.gov