Tree diversity in southern California's urban forest: the interacting roles of social and environmental variables
 Meghan L. Avolio1*
  Diane E. Pataki1
  Thomas W. Gillespie2
  G. Darrel Jenerette3
  Heather R. McCarthy4
  Stephanie Pincetl5
  Lorraine Weller Clarke3†
- 1Department of Biology, University of Utah, Salt Lake City, UT, USA
- 2Department of Geography, University of California, Los Angeles, Los Angeles, CA, USA
- 3Department of Botany and Plant Sciences, University of California, Riverside, Riverside, CA, USA
- 4Department of Microbiology and Plant Biology, University of Oklahoma, Norman, OK, USA
- 5Institute of Environment and Sustainability, University of California, Los Angeles, Los Angeles, CA, USA
Socio-economic and environmental drivers are important determinants urban plant richness patterns. The scale at which these patterns are observed in different regions, however, has not been explored. In arid regions, where forests are not native, the majority of the urban forest is planted, and trees are presumably chosen for specific attributes. Here, we investigate the role of spatial scales and the relative importance of environmental vs. socio-economic drivers in determining the community structure of southern California's urban forest. Second, we assess the usefulness of ecosystem service-based traits for understanding patterns of urban biodiversity, compared with species composition data. Third, we test whether resident preferences for specific tree attributes are important for understanding patterns of species composition and diversity. We studied tree communities in 37 neighborhoods in three southern California counties (Los Angeles, Orange, and Riverside). The urban forest in southern California is very diverse with 114 species. Using multiple regression analyses we found socio-economic drivers were generally more important than environmental and the strength of the relationship between urban forest community structure and socio-economic drivers depended on whether we were analyzing within or across counties. There was greater tree richness in wealthier neighborhoods compared with less affluent neighborhoods across all counties and Orange County, but not in Los Angeles or Riverside counties alone. We also found a greater proportion of residential shade trees in hotter neighborhoods than in cooler neighborhoods, which corresponds with survey results of residents' preferences for tree attributes. Ultimately our study demonstrates that the species richness and functional traits of urban tree communities are influenced by managers' and residents' preferences and perceptions of urban tree traits.
Introduction
Urban forests are unique in that they are novel assemblages of native and exotic tree species (Kunick, 1987; Jim, 1993; Sjöman et al., 2012; Aronson et al., 2015) that are influenced by both biophysical (e.g., climatic factors) and human drivers (e.g., management and planting preferences; Sanders, 1984; Kunick, 1987; Talarchek, 1990). Accordingly, both socio-economic and environmental drivers are necessary to explain patterns of urban forest composition and cover. Within different cities, studies have found a negative relationship between tree cover and population density (Iverson and Cook, 2000; Clarke et al., 2013), a positive relationship between tree cover and income (Talarchek, 1990; Iverson and Cook, 2000; Lowry et al., 2011; Clarke et al., 2013), a positive relationship between tree cover and home or neighborhood age (Lowry et al., 2011), and a postivie relationship between tree cover and education (Heynen and Lindsey, 2003; Luck et al., 2009; Kendal et al., 2012b). To our knowledge, fewer studies have found relationship with urban forests and environmental drivers. In Salt Lake Valley, UT, Lowry et al. (2011) found greater tree cover in areas of higher precipitation, while in Los Angeles, CA, Clarke et al. (2013) found no relationship between tree cover and distance from the coast, an integrative measure of environmental conditions. Heynen and Lindsey (2003) found greater tree cover in areas with higher stream density and steeper slopes across urban areas in central Indiana. In addition to overall tree cover, understanding how sociological and biophysical drivers affect species richness and measures of community diversity is necessary for understanding the composition and drivers of urban forests.
Controls of diversity have been investigated in natural systems worldwide (Gaston, 2000), and the factors that influence diversity can vary depending on the scale being investigated (Whittaker et al., 2001; Field et al., 2009). Many drivers have analogs in urban ecosystems. Area is a key determinant of diversity, where larger areas can support more species (Gaston, 2000; Whittaker et al., 2001). In cities, population density can be indicative of available area for vegetation, as the aerial extent of vegetation generally declines with population density within cities (Jenerette et al., 2007). Time since disturbance is an important determinant of diversity (Whittaker et al., 2001), in that species richness increases during primary succession (Anderson, 2007). In cities, species richness has been shown to increase with time since development (Martin et al., 2004; Boone et al., 2009; Kirkpatrick et al., 2011; Clarke et al., 2013). This may be seen as analogous to time since disturbance, and therefore there are parallels between processes of community assembly in more natural vs. urban ecosystems. Household income has also been shown to positively correlate with species richness (Hope et al., 2003; Martin et al., 2004; Cook et al., 2012) and this relationship has been termed the “luxury effect” (Hope et al., 2003). However, how this relationship might be integrated into existing theories about ecological determinants of diversity in natural systems is less clear. Although, relationships between education and tree cover have been found, to our knowledge no study has linked education to biodiversity. How these different drivers of diversity influence tree diversity at different scales, from plot to neighborhood, municipal and larger regional scales, has not been investigated.
The urban forest as a whole can be considered a mosaic of smaller land parcels or patches, either public or private, that each have their own unique set of drivers (Sanders, 1984; Zipperer et al., 1997). On a large scale, municipalities or districts within cities have different levels of tree diversity (Jim and Liu, 2001a; Bourne and Conway, 2013). Within these governmental designations, tree diversity, richness, and species identity can also differ among land use types (e.g., commercial vs. transportation; Bourne and Conway, 2013; Clarke et al., 2013) and private (e.g., residential) vs. public trees (e.g., street trees) that are typically managed by the municipality (Maco and McPherson, 2002). Both residential and street trees have their own unique set of drivers (Roman and Scatena, 2011; Pincetl et al., 2012), which is reflected in street and residential trees having different traits and species composition (Jim, 1993; Kirkpatrick et al., 2011). Differences between street and residential trees likely reflect the different planting pressures and preferences of the city and private land owners (Jim, 1993; Kirkpatrick et al., 2011). Residential and street trees are chosen based on management requirements and desires for specific attributes (McBride and Jacobs, 1976), which change over time (McBride and Jacobs, 1976; Kunick, 1987; Pearce, 2013). Thus, there are multiple spatial scales, from municipalities to residential parcels, at which human preferences shape tree communities.
As ecosystems are transformed to urban areas, a series of filters change the composition of the component plant species, both limiting which species can survive in the new urban environment and adding desirable species that are planted (Williams et al., 2009). In arid and semi-arid cities, trees are not a key component of the native ecosystem and urban trees are planted as the city is built. In comparison, in mesic areas where trees are native, trees were removed as the city is built. Thus, key to predicting patterns of urban biodiversity is to understand resident preferences and how these preferences are reflected in plant assemblages, especially in arid and semi-arid cities. While studies have noted that the high proportion of flowering or fruit trees reflect resident desires for these traits (Jim, 1993; Cook et al., 2012), no study, to our knowledge, has directly linked resident preferences with patterns of urban tree diversity. In Australia, Kendal et al. (2012a) found that homeowner garden preferences were correlated with garden plant traits, and these relationships were stronger for residents who owned their homes for longer periods of time. It is unknown, however, if there are similar patterns across larger regional scales and for other types of planted urban vegetation.
Here, we investigated patterns of urban tree community composition in the Los Angeles Metropolitan area of southern California to determine whether these patterns are correlated with resident preferences. In a previous study, over 1000 residents across southern California were surveyed about their preferences for tree attributes (Pataki et al., 2013; Avolio et al., 2015). Low-income residents had a higher preference for fruit trees, and higher income residents expressed greater preferences to have trees in their yard than low-income residents (Avolio et al., 2015). Additionally, preferences for tree attributes were affected by local climatic conditions. For example, residents who lived in hotter areas had a greater preference for shade trees, and residents who lived in drier areas had a greater preference for trees that used less water (Avolio et al., 2015). Overall, certain tree attributes were more important than others, with aesthetics and provision of shade ranked particularly highly (Pataki et al., 2013; Avolio et al., 2015), however, we do not know whether resident preferences for tree attributes are actually reflected in compositional patterns of urban forests.
Traits are increasingly used in ecological studies (McGill et al., 2006) to understand plant distributions and responses to environmental change (Reich et al., 1997; Díaz et al., 1998) and urbanization (Vallet et al., 2010). Traits commonly used in ecological studies (Cornelissen et al., 2003), however, are not necessarily best suited for urban research, as many of these traits have no direct correlate with attributes chosen by city managers or residents (e.g., aesthetic attributes). To overcome this potential limitation, Pataki et al. (2013) proposed “ecosystem service-based traits” that are linked to known resident preferences, including: water requirements, size at maturity, and presence of showy flowers. Similarly, Zhang and Jim (2014), used similar traits and called them “ecological amenities,” evaluating whether urban trees provided seasonal changes in foliage color, shading, and edible fruit. In Taipei, Jim and Chen (2008) found that the main function of certain tree communities was to beautify the surrounding area. In Guangzhou, China, Jim and Liu (2001b) found that the most important ecological amenity in roadsides was shade, while in parks it was flower or fruit provision, demonstrating that different areas are managed to provide different functions. Thus, studying tree traits that are important for land mangers (e.g., city parks departments, residential home owners) may be key to a predictive understanding of community composition patterns of urban forests.
We had three objectives in this study. Our first objective was to investigate the relative importance of socio-economic and environmental factors in determining patterns of community diversity and cover of the urban forest in southern California at county and regional scales. Our second objective was to determine whether there are discernable spatial patterns in urban forest species composition and the distribution of traits. We hypothesized that there would be differences among counties and tree types (street vs. residential trees) in species composition and functional trait richness because of different actors involved in making planting decisions. We also hypothesized that traits would be more useful for differentiating between counties and tree types than species composition because the majority of trees in LA are planted rather than naturally regenerating. We propose that planted trees may largely be chosen for specific traits (ecosystem service-based traits) rather than for species composition per se. Our third objective was to evaluate whether residents' preferences for specific tree attributes are reflected in the composition of the urban tree community, for example, whether there are more shade trees in hotter neighborhoods. An understanding of these patterns can contribute to general theories of species assemblages in cultivated gardens and planted urban forests.
Methods
Study Location and Data Collection
Urban forest composition was inventoried across three southern California counties: Los Angeles, Orange, and Riverside in 2010 and 2011. Within each county 12 or 13 neighborhoods (37 in total) were selected to span a range of income and age of development within each county, which were determined using historical records and census tract data (Figure 1; Supplementary Table 1). Neighborhood boundaries were determined from local on-line sources (Supplementary Table 1), and on average there were 7.5 census tracts per neighborhood (Supplementary Table 1). In Los Angeles, all neighborhoods where trees were surveyed were in the city of Los Angeles, while in Orange and Riverside counties, the neighborhoods where trees were surveyed spanned 11 and 4 cities, respectively. In Riverside, seven of the neighborhoods were in the City of Riverside. In each neighborhood, ten 22.4 m in diameter circular plots (0.04 hectare) were randomly placed. Data was collected according to the protocol in the Urban FOREst Effects (UFORE) model, now iTree Eco (USDA, 2011). This involves counting and identifying each tree and the overall tree cover of each plot. Land use type (i.e., park, residential, commercial) was also classified according to the iTree criteria and each tree was designated as either a street tree or not. Of the species recorded, seven were shrubs or vines that were trained to grow as trees and were excluded from our analyses (for example, Bougainvillea glabra).
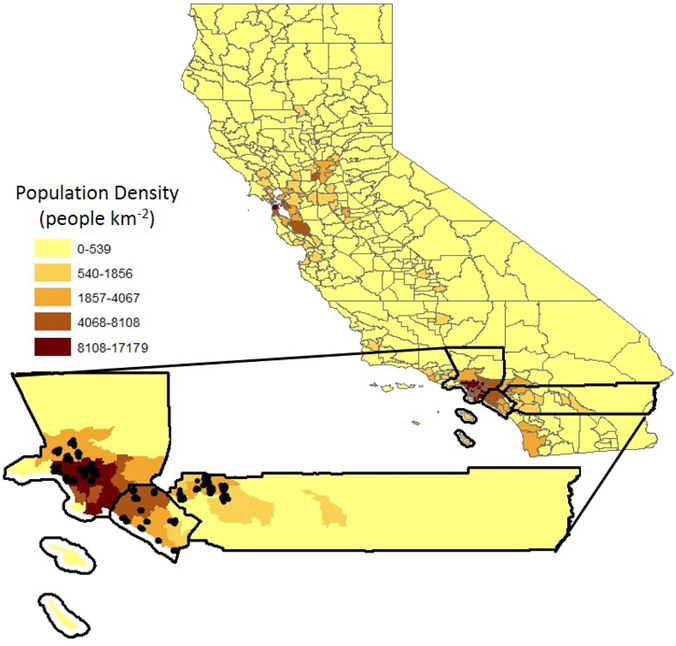
Figure 1. Locations of sampled plots across the 37 neighborhoods and three counties. The plots are clustered in neighborhoods.
Socio-Economic and Environmental Variables
The plots were geocoded (ArcGIS 9.2, ESRI, 2006) and overlaid with environmental and socio-economic variables. Climate variables (temperature, annual maximum; precipitation, average annual) were acquired from the PRISM Climate Group at Oregon State University at a 1 km pixel size (Corvallis, OR, 2012) and averaged over a 30 year period (1981–2010). Population density at the tract level were taken from the 2010 U.S. census demographic profile 1 (DP1). Median family income, year the homes were built and proportion of the population with a college degree or higher were taken at the block group level from the American Community Survey from 2006–2011 (United States Census Bureau, 2012). The average of all plots in a neighborhood were used for all subsequent analyses. Across all counties, the neighborhoods spanned a range of both environmental and socio-economic factors (Table 1), none of which were correlated with one-another (Supplementary Figure 1), except income and education. Overall, Riverside was hotter and drier than Los Angeles and Orange counties (Table 1); both Orange and Riverside were more recently developed than Los Angeles; Orange County had a higher income than Riverside; and there was the higher population density in Los Angeles (Table 1).
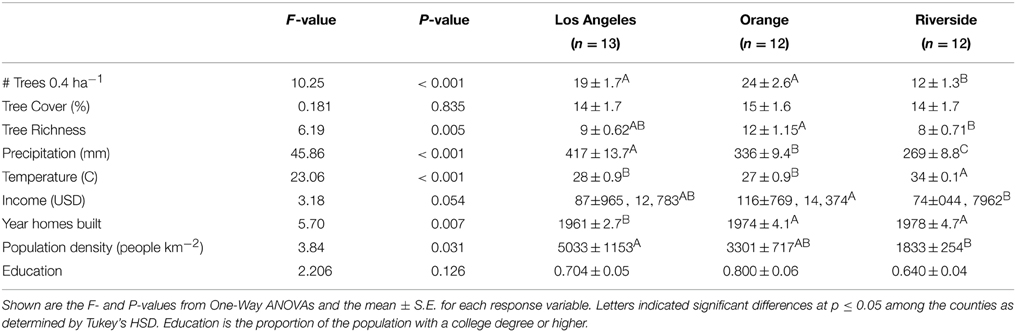
Table 1. Differences among counties.
Ecosystem Service-Based Traits and Classifications
Based on a previous survey of residents in southern California, we focused on ecosystem service-based traits that were found to be important to residents (Pataki et al., 2013; Avolio et al., 2015; Supplementary Table 2). Trait data for each tree species were collected from three sources: University of Florida's horticultural database (http://hort.ifas.ufl.edu/database/trees/trees_scientific.shtml), California Polytechnic State University's Urban Forest Ecosystems Institute database (http://selectree.calpoly.edu/), and from Sunset's Western Garden Book (Brenzel, 2001). Traits were classified at the species rather than the individual tree level. For example, a species that will provide a high degree of shade at maturity was counted as a shade tree, regardless of its current size and how much shade it actually provided. We utilized this method with the assumption that trees are likely procured and planted for their advertised traits, usually at maturity, and younger trees when they are planted might not yet possess the desired traits. See Supplementary Table 2 for a list of the ecosystem service-based traits used in this paper, traits are bolded and italicized here. The provision of shade had three categories with three being the highest shading potential. Flowering had three categories; 0 for species that did not flower (i.e., coniferous trees) or species with inconspicuous flowers (i.e., maple trees), (1) for trees whose flowers are visible (i.e., citrus trees) and (2) for trees that had large showy flowers (i.e., Jacaranda trees). We used two categories for fruiting depending on whether the species provides an edible product. We also used two categories for fall color depending on the presence of showy fall foliage. We used two categories of fruit showiness that depended on whether the fruit or berries are very visible. Overall, we derived a general category of “showiness” as an integrative measure of beauty. We calculated overall showiness as the sum of the flowering, fall color and showy fruit categories. Higher numbers indicated that a tree was more visually distinctive. Growth rate had three categories: 1 ≤ 38 cm year−1, 2 = 39–76 cm year−1, and 3 ≥ 77 cm year−1. Water requirement was derived from the Western Garden Book (Brenzel, 2001) with a scale of 0–3. Zero was little to no water needs, (1) was used for species reported to require less than regular watering (every 2–3 weeks), (2) was used for species reported to need regular watering, and (3) was for species reported to require wet soils. Most of the species in this study were 1–3. Damaging roots were quantified with three categories depending on the degree to which roots could cause damage to the yard and sidewalk. The tendency to drop litter was quantified with two binary categories as well as NA for species for which there was insufficient information. The phenology of leaves was categorized as deciduous, evergreen or semi-evergreen. We also derived an index of tree maintenance as the sum of fruiting, high water requirement (water requirement > 2), dropping of debris, and deciduousness which ranged from 0 to 4. Native and palm both had two categories depending on whether the species was native to southern California or a palm species, respectively. Lastly, leaf color, leaf type (broad, needle, scaly), and flower color were determined, leaf color did not take into account if the leaf changed colors in the fall. Trees that did not flower or have visible flowers had NA for flower color.
Tree Types
We used the Calflora (www.calflora.org) database to determine tree species (as defined by Calflora) that can regenerate naturally and have been recorded in Los Angeles, Orange, and Riverside counties (136 native species and 113 exotic species). The Calflora does not consider elevation, and species that are native only to higher elevation areas are still considered native when sampled at lower elevations. Any species we recorded that was not in the Calflora database we considered cultivated and not able to regenerate naturally in southern California.
Data Analysis
All data analyses were conducted in R (R Core Development Team, Vienna, Austria) and statistical significance was considered at α = 0.05. Environmental and socio-economic data were averaged across all plots at the neighborhood level. Tree data from each plot were summed at the neighborhood level because the iTree plots were small and many contained only 1 tree species. Thus, we considered all 10 iTree plots as necessary to adequately sample a single neighborhood, and the unit of replication was the neighborhood. The components of the urban forest were measured three ways: (1) all trees in all land use types, (2) street trees only across all land use types, and (3) non-street trees in plots where the land use was classified residential or multi-family. These three categories are hereafter referred to as “all tree,” “street tree,” and “residential tree” data, respectively. We calculated tree richness, Shannon's diversity, evenness (Shannon's diversity/log (species richness) and Whittaker's Index for beta diversity in the Vegan package (Oksanen et al., 2013). Three neighborhoods had no street trees and two neighborhoods had no residential trees; thus these were excluded from the appropriate analyses. Tree cover was summed across all 10 plots and divided by 1000, and thus is percent cover.
For traits, we evaluated the proportion of trees in each neighborhood that had specific traits (e.g., proportion of trees that provided high shade). We quantified the proportion of trees that had the highest shading potential (3), the highest water requirement (3), the presence of visible and recognizable flowers (1 or 2), the fastest growth rate (3), the most destructive root systems (3), a showiness variable of > 1, and maintenance value > 2. All other traits were binary. We performed stepwise multiple regressions with residential trees only to assess the degree to which expressed preferences of residents matched attributes of the urban forest. We performed a functional trait analysis to determine the functional dispersion of each neighborhood with dbFD in the FD package (Laliberté and Legendre, 2010), which takes into account both the dissimilarity of traits as well as the abundance of each species. For these analyses, we used Gower dissimilarity to determine how much neighborhoods differed in tree traits. Gower allows for both continuous and categorical traits to be analyzed simultaneously, thus all traits were included in these analyses.
One-Way ANOVAs were used to determine differences among counties in their urban forest, environmental and socio-economic variables. Two-Way ANOVAs were used to determine whether there were differences between street and residential trees across the three counties for both measures of diversity and traits. We used Tukey's HSD for all post-hoc testing. To study relationships between environmental and socio-economic drivers with the urban forest we performed forward and backwards stepwise multiple regressions using the MASS package (Venables and Ripley, 2002). We used the relaimpo package to calculate partial regression coefficients (Groemping, 2006). Although income and education were correlated, they were never both selected for inclusion in a final multiple regression model, which eliminated any problems of collinearity.
We tested for multivariate differences in street and residential trees as well as street trees in the different counties based on species composition and trait data with non-metric multidimensional scaling using metaMDS in the Vegan package (Oksanen et al., 2013). For neighborhood differences based on species composition we used Bray-Curtis dissimilarity, while for traits we used Euclidian distance based on the proportion of trees with a particular trait. Using the adonis function in the Vegan package, we performed permutational multivariate ANOVA to test whether the patterns of community and trait dissimilarity were significant. Lastly, to determine the relationship between geographic distance among neighborhoods and tree community similarity based on both presence/absence species data and traits, we performed Mantel correlations using the Vegan package. Geographic distances were calculated in ArcGIS using the measure tool. Species composition differences among neighborhoods were calculated using Jaccard dissimilarity and trait differences (all proportional traits) were calculated using Euclidean distance. We performed Mantel correlations for all trees, street trees, and residential trees.
Results
Southern California's Urban Forest
Overall we found 114 trees species in the surveyed neighborhoods. Using the classifications provided by Calflora, we found that of these species 7% were native, 46.5% were exotic but can regenerate naturally, and 46.5% were exotics that cannot reproduce naturally and must be planted and maintained by residents. We found 64 tree species in Los Angeles County, 75 in Orange County and 45 in Riverside County. All counties had similar beta diversity (~0.835) and demonstrated high turnover in species across neighborhoods within a county. The most common tree species was Mexican fan palm (Washingtonia robusta) followed by queen palm (Arecastrum romanzoffianum) and Mediterranean cypress (Cupressus sempervirens). Of these three most common species, W. robusta and C. sempervirens can reproduce naturally, while A. romanzoffianum cannot. However, most of the trees we encountered were planted by residents or the city and were not growing spontaneously. We found that the most common tree species varied by county as well as tree type (street or residential; Figure 2). Only one of the most common species was native, Quercus agrifolia. There were also differences among counties where Orange and Los Angeles counties had a greater number of trees per neighborhood than Riverside County, and neighborhoods in Orange County had greater tree richness than Riverside (Table 1). We also found some differences in land use type where residential areas had the greatest number of tree species and tree cover while utility areas had the fewest number of species and vacant lots had the least tree cover (Table 2).
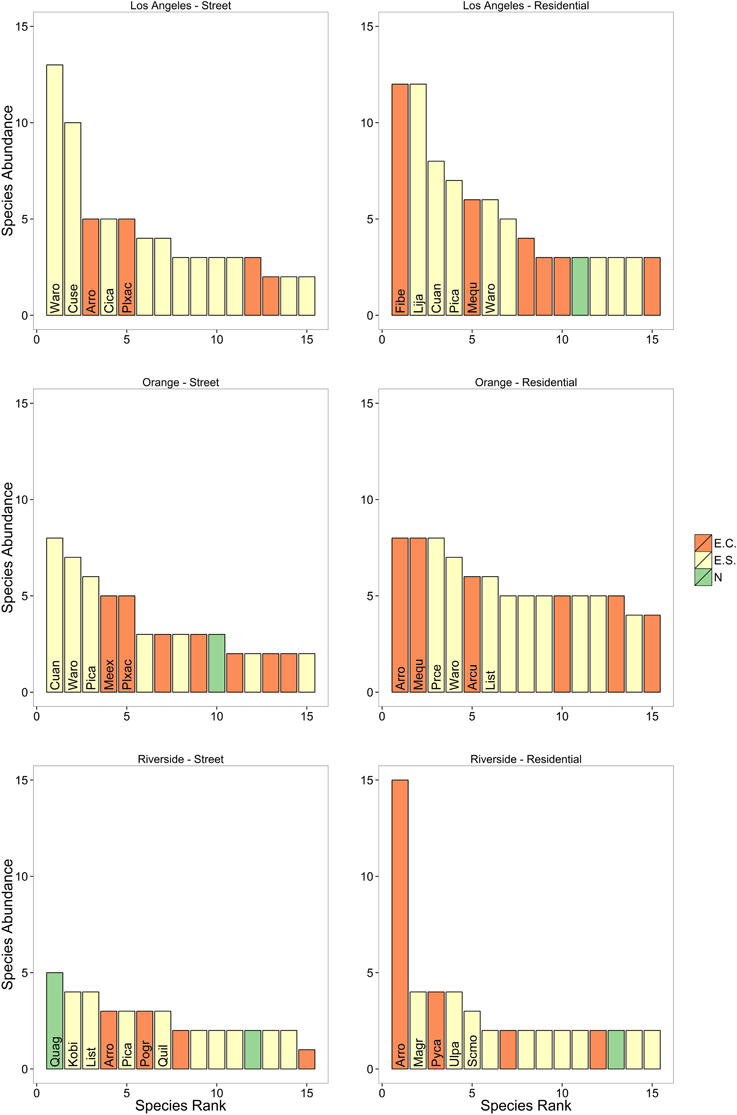
Figure 2. Rank abundance curves for the 15 most common street and residential trees across the three counties. Also shown are whether the species is native (N), is exotic but can reproduce naturally or spontaneously (ES), or is an exotic species that must be cultivated (EC). The names of most common 5–7 species are provided. Note that although many of the trees are exotic but can reproduce spontaneously, the majority of trees were still planted. This is especially true for the street trees. Species codes: Archontophoenix cunninghamiana (Arcu); Arecastrum romanzoffianum (Arro); Cinnamomum camphora (Cica); Cupaniopsis anacardioides (Cuan); Cupressus sempervirens (Cuse); Ficus benjamina (Fibe); Koelreuteria bipinnata (Kobi); Ligustrum japonicum (Lija); Liquidambar styraciflua (List); Magnolia grandiflora (Magr); Melaleuca quinquenervia (Mequ); Metrosideros excelsus (Meex); Pinus canariensis (Pica); Platanus x acerifolia (Plxac); Podocarpus gracilior (Pogr); Prunus cerasifera (Prce); Pyrus calleryana (Pyca); Quercus agrifolia (Quag); Quercus ilex (Quil); Ulmus parvifolia (Ulpa); Schinus molle (Scmo); Washingtonia robusta (Waro).
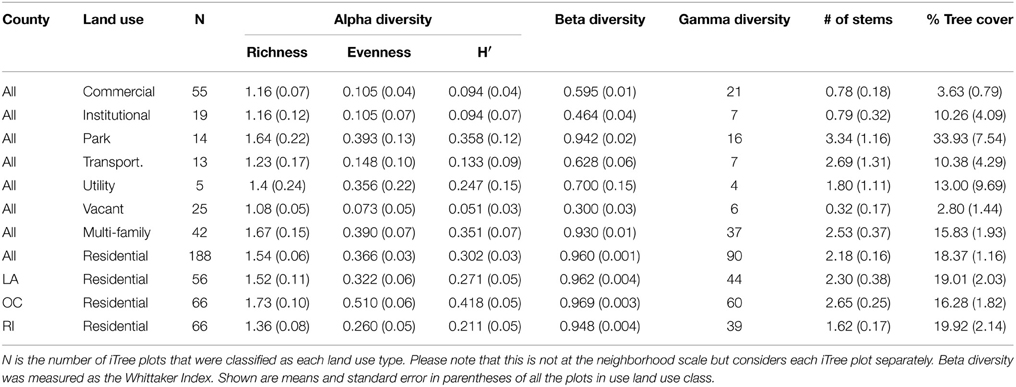
Table 2. Patterns of tree community diversity by land-use type across three counties in southern California.
Determinants of Urban Forest Structure and Richness
Overall, socio-economic drivers had a greater effect on urban forest structure than environmental drivers, with neighborhood income, year the neighborhood was built, and proportion of residents with a college degree or higher being the most important (Table 3). We also found that drivers differed depending on scale, either across all counties or within counties (Table 3). There were more trees in wealthier neighborhoods (Figure 3, Table 2) across all counties and Orange County, and there were also more trees in older neighborhoods in Orange County (Figure 3, Table 3). There was greater tree cover in more educated neighborhoods (Figure 3, Table 3) across all counties, and within Riverside County there was greater cover in older neighborhoods (Figure 3, Table 3). Across all counties and in Orange County alone there was greater richness in wealthier neighborhoods, and in Orange County only there was greater richness in older neighborhoods (Figure 3, Table 3). In Los Angeles County only, there was greater tree richness in neighborhoods where residents were more educated (Figure 3, Table 3). Across all counties, functional dispersion was not explained by any environmental or socio-economic drivers, but was negatively related to income in Riverside County only (Figure 3, Table 3).
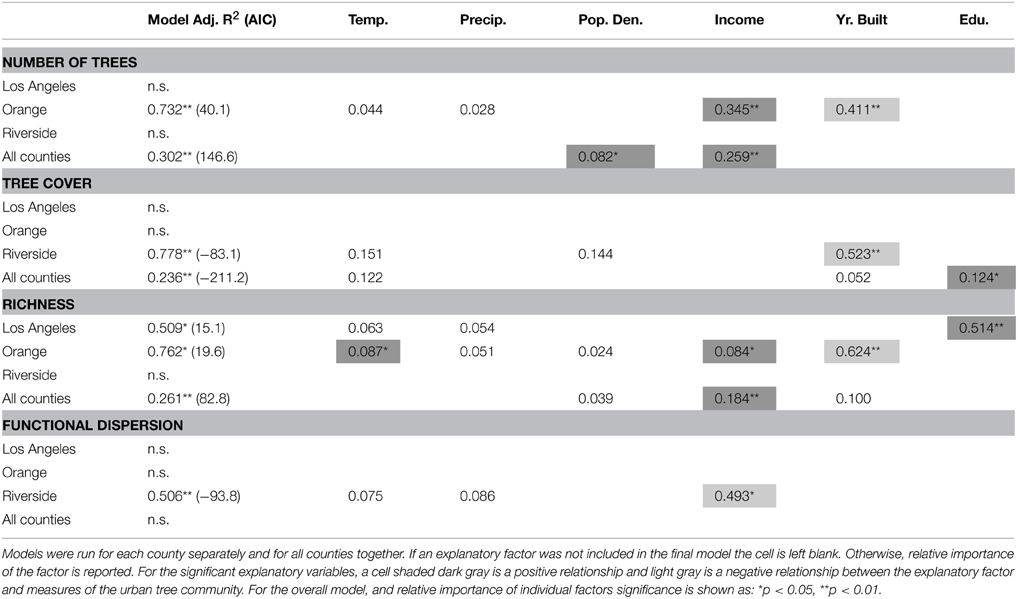
Table 3. Relationships of between characteristics of the urban forest for all trees with socio-economic and environmental drivers.
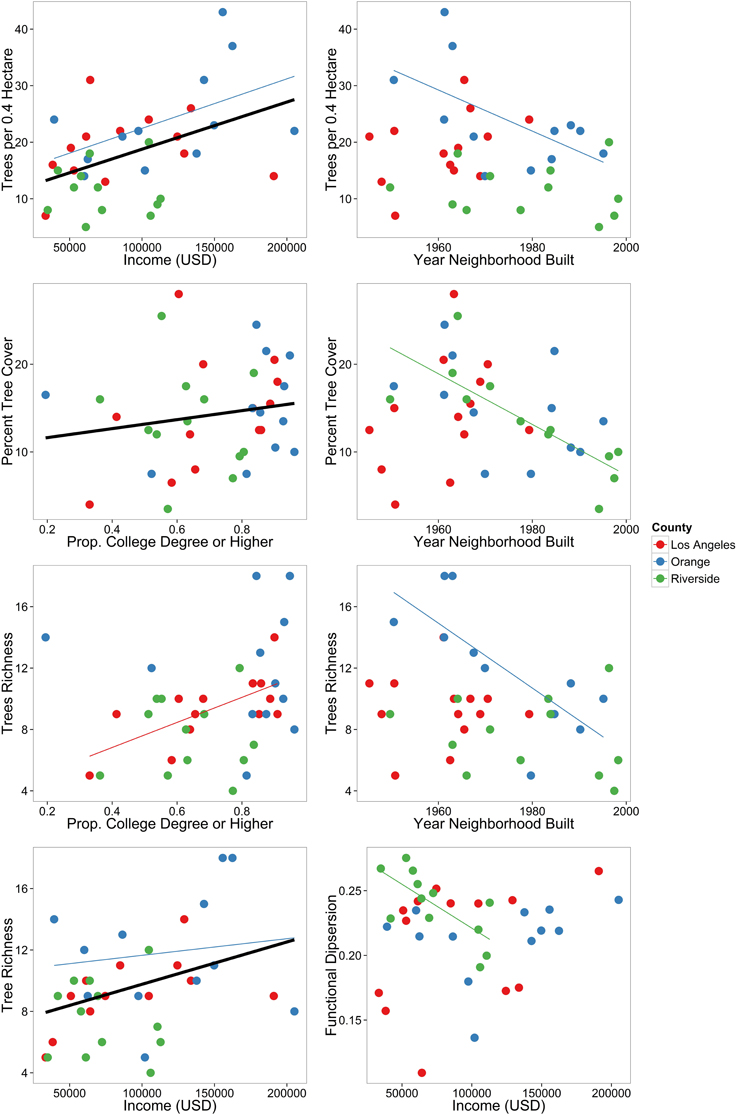
Figure 3. Overall patterns of urban forest characteristics in urbanized southern California. Data are for all neighborhoods across the three counties. A regression line is only shown for significant relationships. Black thick lines are the relationships across all counties, and thinner gray-scale lines are the relationships within each county.
Patterns of Urban Forest Diversity, Composition, and Traits
When only looking at street and residential trees across the three counties, we found an interaction between county and tree type for tree richness (Table 4; Figure 4A), where in both Los Angeles and Riverside there was similar tree richness between street and residential trees, but in Orange County there was greater tree richness of residential trees compared with street trees. There was an effect of county for proportion of shade trees (Table 4), where there were more shade trees in Riverside compared with Los Angeles (data not shown). We found more differences between tree types (street and residential trees) than among counties based on their traits (Table 4). A greater proportion of street trees provided shade compared with residential trees (Table 4; Figure 4B), while a greater proportion of residential trees provided fruit compared with street trees (Table 4). We also found that a greater proportion of residential trees had high water requirements (Table 4; Figure 4C) and a greater proportion had higher maintenance needs (Table 4; Figure 4D) compared with street trees.
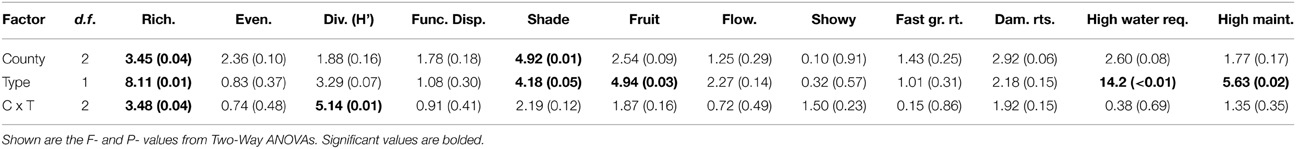
Table 4. Differences between counties and tree type (street or residential) in community diversity and traits.
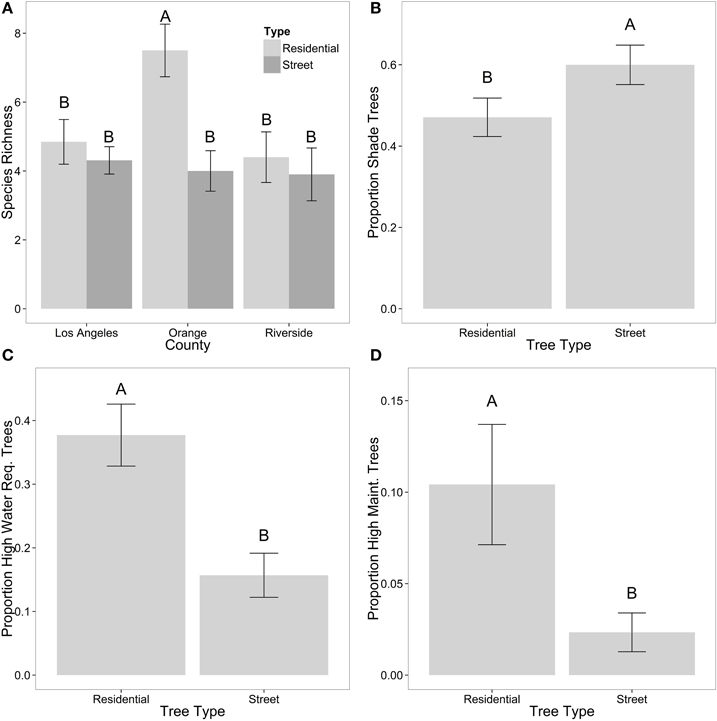
Figure 4. Patterns of community diversity across counties and tree types in species richness (A), proportion of shade trees (B), proportion of trees with high water requirements (C), and proportion of trees that are high maintenance (D). Shown are means ± standard error. Letters denote significant differences p ≤ 0.05.
There were no differences in species composition (Figure 5A; p = 0.488) between street and residential trees, although we were able to detect overall trait differences between street and residential trees (Figure 5C; p = 0.009). Similarly, we tested for differences among counties in street tree composition. For both species composition (Figure 5B; p = 0.133) and traits (Figure 5D; p = 0.534) there were no differences in street trees among counties.
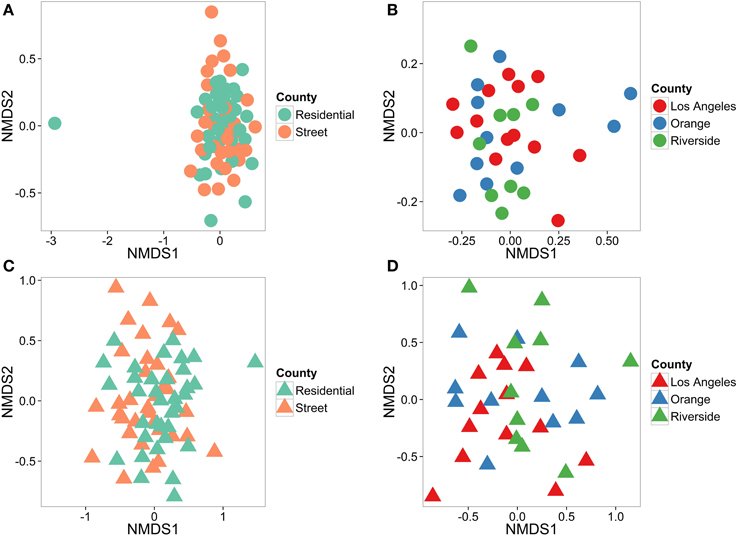
Figure 5. Differentiation of tree types across counties (street and residential) and counties (street trees only). We were unable to differentiate between street and residential trees (A, stress = 0.149), or between counties (B, stress = 0.104) using species composition data. Using trait data, we were able to detect differences between street and residential trees (C, stress = 0.198), but not counties using all traits (D, stress = 0.157). Species data is shown in circles and trait data in triangles.
Neighborhoods that were closer together did not have more similar tree communities for all trees (r = 0.0336, p = 0.224) and residential trees only (r = 0.0144, p = 0.350). For street trees only, we found that neighborhoods that were close together did have more similar tree species composition (r = 0.0774, p = 0.050). There were no distinguishable patterns in trait similarity and distance among neighborhoods for all trees (r = −0.0345, p = 0.749), street trees (r = −0.0697, p = 0.994), or residential trees (r = −0.018, p = 0.593).
Links between Residential Preferences and Residential Trees Communities
We found more residential trees in higher income neighborhoods (Table 5) and that temperature alone explained 26% of variation in the proportion of shade trees, where hotter neighborhoods had a greater proportion of shade trees (Table 5; Figure 6). There was a higher proportion of fruiting trees in older neighborhoods, more flowering trees in neighborhoods where residents were more educated, and a lower proportion of showy trees in neighborhoods with higher population densities (Table 5). For undesirable traits, we found a greater proportion of trees with damaging roots in hotter, drier neighborhoods (Table 5). Lastly, we found a lower proportion of high maintenance trees in newer neighborhoods (Table 5).
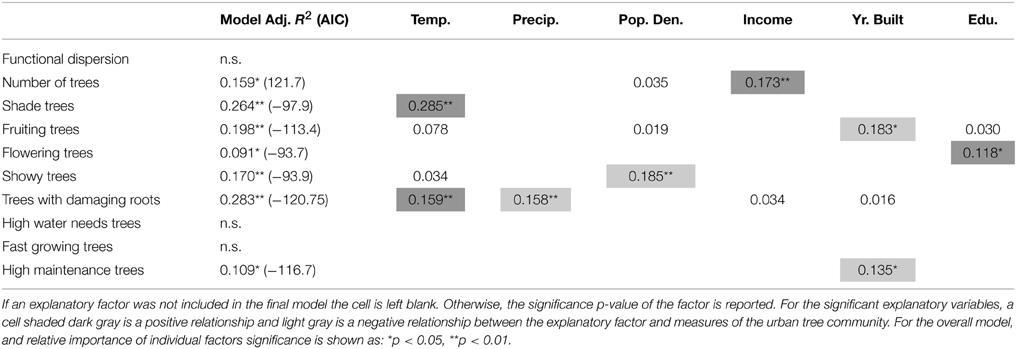
Table 5. Relationships of residential trees' functional dispersion, number of trees, and proportion of trees with a particular trait and socio-economic and environmental drivers.
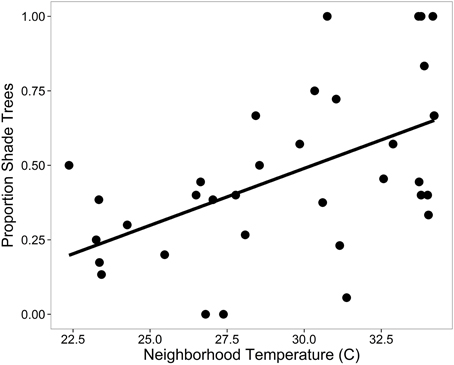
Figure 6. The relationship between the proportion of trees that provide significant shade and local neighborhood temperature of residential trees. See Table 4 for significance.
Discussion
Urban ecosystems are increasing in area worldwide (Grimm et al., 2008) and yet, we have relatively little ecological theory to understand what controls population and community processes in urban forests. The current lack of understanding is associated with the complex and varied ways residents shape urban plant communities. In semi-arid and arid cities, urbanization increases the number of trees overall, and this pattern appears to be quite generalizable (McBride and Jacobs, 1976; Zipperer et al., 1997; Jenerette et al., 2013). Given that a large proportion of trees in these cities are planted, it seems reasonable to assume that sociological drivers are important determinants of richness and that attributes of these trees should be related to the preferences and management concerns of the actors who select trees. Here, we found that a new set of ecosystem service-based traits are very useful for understanding drivers of urban forest composition.
Southern California's Urban Forest
We found over 10 fold more exotic species than native species in southern California. Southern California is naturally an ecosystem where trees were not a dominant feature of the landscape at low elevations prior to urbanization (Rundel and Gustafson, 2005), and a general trend of more exotic tree species in urban areas has been found elsewhere (Aronson et al., 2015). The vegetation of southern California was surveyed in the 1980's (Miller and Winer, 1984) and street trees were surveyed in 1990's (Lesser, 1996). In 1984, the most common trees were California fan palm (Washingtonia filifera), Italian cypress (Cupressus sempervirens), and Monterey pine (Pinus radiata; Miller and Winer, 1984). All three species were found in our study; however, now the most common species is the exotic Mexican fan palm (W. robusta) and Monterey pine was not very common. In 1996, the most common street trees were American sweetgum (Liquidambar styraciflua), southern magnolia (Magnolia grandifolia), and holly oak (Quercus ilex; Lesser, 1996), and the most recently planted street trees were American sweetgum; crape myrtle (Lagerstroemia indica), and London planetree (Platanus x acerifolia; Lesser, 1996). Of the most commonly planted species in 1996 both American sweetgum and London planetree were among the five most common species. Many of the species that dominated our survey in 2010 were not as common 20–30 years ago, which may reflect the changing nature of resident preferences and species that are available in nurseries, which do change over time (Pincetl et al., 2013).
Determinants of Urban Forest Structure and Richness
In contrast to Kendal et al. (2012b), who found that biophysical factors explained patterns of richness, we found that only socio-economic factors were significant, which is similar to patterns in Phoenix, AZ (Hope et al., 2003). One possible reason for this is the location of this research in southern California. Southern California has historically been described as a “Garden of Eden” (Pincetl et al., 2013). The temperatures are mild and with rampant irrigation urban plants are not reliant on rainwater. This is one possible reason why we did not find an effect of precipitation; trees are heavily irrigated in southern California (Pataki et al., 2011). The effect of climate and environmental conditions is most likely much stronger in cities where temperatures are more extreme.
Similar to other studies, we found greater species richness in higher income neighborhoods (Hope et al., 2003; Martin et al., 2004), although to our knowledge this is the first study to find this pattern when focusing on trees only. In a previous study that focused on the city of Los Angeles, Clarke et al. (2013) found that tree diversity was interactively affected by both development age and household income, where older, wealthier neighborhoods had the highest richness and new low income neighborhoods had the lowest richness. In southern California, maintenance costs of trees include irrigation (Pataki et al., 2011), which may enable wealthier areas to have greater tree cover (Jenerette et al., 2013). Income can also result in greater richness through complex social interactions, termed the “ecology of prestige” (Grove et al., 2006, 2014), whereby homeowner's desire to create an aesthetic that is associated with wealth. In addition to income, we found a marginally significant effect of neighborhood age (p = 0.06) with higher diversity in older neighborhoods. In Orange County, however, neighborhood age was the best predictor of richness and explained over 60% of variation in species richness. In Los Angeles County we found education was the best predictor or richness, explaining 62% of variation in richness. To our knowledge we are the first study to link education to biodiversity, other studies have found an effect of education on tree cover only (Heynen and Lindsey, 2003; Luck et al., 2009; Kendal et al., 2012b). In Los Angles, income was not included in the final multiple-regression model, suggesting that the education effect is not that these residents had more money. Instead, our findings suggests that education could be affecting ones attitude toward the importance of urban forests and trees in general, resulting in more pro-environmental behavior (Chen et al., 2011). Lastly, we did not find an effect of population density, perhaps because most neighborhoods were characterized by relatively high population density (Figure 1) and thus there was not much variation in this driver.
We also found the scale at which we were looking, within or across counties, affected drivers of the urban forest. For example, we were unable to detect a relationship between tree richness and socio-economic or environmental variables in Riverside County. This suggests that similar to natural areas, the scale at which diversity is assessed can be an important determinant of the associated drivers (Whittaker et al., 2001; Field et al., 2009). Hence, at the county scale there is reduced range of values to correlate with diversity relative to the regional scale, similar to findings in natural ecosystems (Field et al., 2009) in which drivers of diversity are more difficult to detect at smaller spatial scales. For example, there was a reduced range of neighborhood ages in Los Angles compared with Riverside and Orange Counties. Further, while we chose neighborhoods to span a range of income and age, we only sampled 10 neighborhoods per county, and perhaps a more exhaustive sampling would have revealed more patterns.
Patterns of Urban Forest Diversity, Composition, and Traits
We found differences among counties, land use types, and street and residential trees in multiple measures of community diversity. Among land use types we found the highest species richness in parks and residential properties and the lowest in vacant lots and intuitional properties (Table 2). We also found differences between street and residential trees and an interaction with county, where there was greater richness of residential trees in Orange County but not in Los Angeles and Riverside Counties. Jim (1993) also found greater residential tree diversity than street tree diversity within a neighborhood of Hong Kong. Overall, we found different levels of species richness depending on land use types and tree types (residential vs. street), which may reflect the many different managers and drivers of the urban forest.
We postulate that residents may be less concerned with individual species, with which they are often unfamiliar, and more concerned with the functional and visual attributes that species provide. Trait identification and classification may be more informative than species identity and richness. When we compared traits of residential and street trees we found that residential areas had a greater proportion of fruiting trees and street trees had lower water requirements and needed less maintenance, but there was no significant difference in species composition between street and residential trees. Taken together, residents may plant trees more for provisioning ecosystem services while city managers are more concerned with tree water requirements and maintenance.
Neighborhoods that were closer together had more similar street tree species than neighborhoods farther apart. Although patterns of spatial auto-correlation are commonly found in natural ecosystems (Koerner and Collins, 2013), previous studies on urban vegetation did not find evidence of spatial auto-correlation (Hope et al., 2003; Clarke et al., 2013). We only found evidence of spatial auto-correlation with street trees, not all trees or residential trees, which could be caused by similar planting choices within municipalities or neighborhoods closer together may have been developed at similar times and reflect the planting preferences of that time period. Overall, our findings suggest that neighborhoods within cities might have more similar tree communities than neighborhoods in different cities.
Links between Residential Preferences and Residential Trees Communities
Avolio et al. (2015) surveyed of preferences of residents across five southern California counties, including Los Angeles, Orange, and Riverside. This survey included residents in the neighborhoods studied here, however, we are not able to link preferences of residents in those specific neighborhoods with traits of trees in their neighborhood due to limitation of the dataset. Based on previous findings about the preferences of urban residents in southern California for specific tree attributes, we hypothesized that these preferences would shape the traits of the urban forest. For example, wealthier residents in southern California ranked the importance of having trees in their yard more highly than lower income residents (Avolio et al., 2015), and correspondingly we found more residential trees in higher income neighborhoods than lower income neighborhoods. Residents that lived in hotter areas had a greater preference for shade trees (Avolio et al., 2015), and here we found more shade trees in hotter neighborhoods. This is contrary to patterns expected based on biophysical drivers of forest processes alone, in that leaf area generally declines with increasing temperature (Cornelissen et al., 2003). Hence, planting preferences may completely overcome biophysical drivers and limitations. Although residents in more arid areas had a greater preference for trees that required less water (Avolio et al., 2015), we did not find that drier neighborhoods had more drought tolerant trees; tree watering requirements were not explained by any of the independent variables. This may be partially explained by the low cost of water in southern California, such that irrigation requirements may not have historically played an important role in decision-making about trees. Similarly, although provision of fruit was more important to low income than high-income residents (Avolio et al., 2015), here we found that the proportion of fruit trees was not related to income. A possible cause of this mismatch between resident preferences and traits of the urban forest is that monetary limitations may restrict the ability of lower income residents to create tree communities that match their preferences. By comparing stated preferences with patterns of urban forest diversity and traits we found that resident preferences are reflected in traits of the urban forest, and that the strength of this relationship may be modified by resident's income.
Conclusion
In southern California we found a diverse urban forest primarily composed of exotic species. Overall, socio-economic variables better explained variation in species richness, number of trees, tree cover, and functional dispersion than environmental variables. Additionally, we found that within county drivers of the urban forest were not the same at larger geographic scales, highlighting the need for ecologists to study the scale at which drivers of urban diversity are most influential. We found linkages between resident preferences for specific tree attributes and the actual distribution of functional traits in the urban forest. For example, we found that residents in hotter neighborhoods have a greater tendency to prefer shade trees, and currently this is manifest in more shade trees in hotter neighborhoods. Overall our results show that the majority of tree species in the urbanized region of southern California are exotic species, about half of which need to be actively planted by humans for their survival. As such, the attributes or traits that residents and managers use to select which species to plant are key to understanding patterns of urban vegetation.
Author Contributions
MA analyzed the data. MA and DP wrote the manuscript. DP, SP, GJ, and TG designed the experiment. HM and LC collected the data. All authors edited and revised drafts of the manuscript, approved the final version and agree to be held accountable for the work.
Conflict of Interest Statement
The authors declare that the research was conducted in the absence of any commercial or financial relationships that could be construed as a potential conflict of interest.
Acknowledgments
This research was supported by National Science Foundation grants DEB 0919381 and 0919006, IOS 1147057, and EAR 1204442.
Supplementary Material
The Supplementary Material for this article can be found online at: https://www.frontiersin.org/article/10.3389/fevo.2015.00073
References
Anderson, K. (2007). Temporal patterns in rates of community change during succession. Am. Nat. 169, 780–793. doi: 10.1086/516653
Aronson, M. F. J., Handel, S. N., La Puma, I. P., and Clemants, S. E. (2015). Urbanization promotes non-native woody species and diverse plant assemblages in the New York metropolitan region. Urban Ecosyst. 18, 31–45. doi: 10.1007/s11252-014-0382-z
Avolio, M. L., Pataki, D. E., Pincetl, S., Gillespie, T. W., Jenerette, G. D., and McCarthy, H. R. (2015). Understanding preferences for tree attributes: the relative effects of socio-economic and local environmental factors. Urban Ecosyst. 18, 73–86. doi: 10.1007/s11252-014-0388-6
Boone, C. G., Cadenasso, M. L., Grove, J. M., Schwarz, K., and Buckley, G. L. (2009). Landscape, vegetation characteristics, and group identity in an urban and suburban watershed: why the 60s matter. Urban Ecosyst. 13, 255–271. doi: 10.1007/s11252-009-0118-7
Bourne, K. S., and Conway, T. M. (2013). The influence of land use type and municipal context on urban tree species diversity. Urban Ecosyst. 17, 329–348. doi: 10.1007/s11252-013-0317-0
Brenzel, K. N. (ed). (2001). Sunset Western Garden Book, 7th Edn. Menlo Park, CA: Sunset Published Co.
Chen, X., Peterson, M. N., Hull, V., Lu, C., Lee, G. D., Hong, D., et al. (2011). Effects of attitudinal and sociodemographic factors on pro-environmental behaviour in urban China. Eniron. Conserv. 38, 45–52. doi: 10.1017/S037689291000086X
Clarke, L. W., Jenerette, G. D., and Davila, A. (2013). The luxury of vegetation and the legacy of tree biodiversity in Los Angeles, CA. Landsc. Urban Plan. 116, 48–59. doi: 10.1016/j.landurbplan.2013.04.006
Cook, E. M., Hall, S. J., and Larson, K. L. (2012). Residential landscapes as social-ecological systems: a synthesis of multi-scalar interactions between people and their home environment. Urban Ecosyst. 15, 19–52. doi: 10.1007/s11252-011-0197-0
Cornelissen, J. H. C., Lavorel, S., Garnier, E., Díaz, S., Buchmann, N., Gurvich, D. E., et al. (2003). A handbook of protocols for standardised and easy measurement of plant functional traits worldwide. Aust. J. Bot. 51, 335–380. doi: 10.1071/BT02124
Díaz, S., Cabido, M., and Casanoves, F. (1998). Plant functional traits and environmental filters at a regional scale. J. Veg. Sci. 9, 113–122. doi: 10.2307/3237229
Field, R., Hawkins, B. A., Cornell, H. V., Currie, D. J., Diniz-Filho, A. F., Guégan, J.-F., et al. (2009). Spatial species-richness gradients across scales: a meta-analysis. J. Biogeogr. 36, 132–147. doi: 10.1111/j.1365-2699.2008.01963.x
Grimm, N. B., Faeth, S. H., Golubiewski, N. E., Redman, C. L., Wu, J., Bai, X., et al. (2008). Global change and the ecology of cities. Science 319, 756–760. doi: 10.1126/science.1150195
Groemping, U. (2006). Relative importance for linear regression in r: the package relaimpo. J. Stat. Softw. 17, 1–27.
Grove, J. M., Locke, D. H., and O'Neil-Dunne, J. P. M. (2014). An ecology of prestige in New York City: examining the relationships among population density, socio-economic status, group identity, and residential canopy cover. Environ. Manage. 54, 402–419. doi: 10.1007/s00267-014-0310-2
Grove, J. M., Troy, A. R., O'Neil-Dunne, J. P. M., Burch, W. R. Jr., Cadenasso, M. L., and Pickett, S. T. A. (2006). Characterization of households and its implications for the vegetation of urban ecosystems. Ecosystems 9, 578–597. doi: 10.1007/s10021-006-0116-z
Heynen, N., and Lindsey, G. (2003). Correlates of urban forest canopy cover: implications for local public works. Public Works Manag. Policy. 8, 33–47. doi: 10.1177/1087724X03008001004
Hope, D., Gries, C., Zhu, W., Fagan, W. F., Redman, C. L., Grimm, N. B., et al. (2003). Socioeconomics drive urban plant diversity. Proc. Natl. Acad. Sci. U.S.A. 100, 8788–8792. doi: 10.1073/pnas.1537557100
Iverson, L., and Cook, E. (2000). Urban forest cover of the Chicago region and its relation to household density and income. Urban Ecosyst. 4, 105–124. doi: 10.1023/A:1011307327314
Jenerette, G. D., Harlan, S. L., Brazel, A., Jones, N., Larissa, L., and Stefanov, W. L. (2007). Regional relationships between surface temperature, vegetation, and human settlement in a rapidly urbanizing ecosystem. Landsc. Ecol. 22, 353–365. doi: 10.1007/s10980-006-9032-z
Jenerette, G. D., Miller, G., Buyantuev, A., Pataki, D. E., Gillespie, T. W., and Pincetl, S. (2013). Urban vegetation and income segregation in drylands: a synthesis of seven metropolitan regions in the southwestern United States. Environ. Res. Lett. 8:044001. doi: 10.1088/1748-9326/8/4/044001
Jim, C. Y., and Chen, W. Y. (2008). Pattern and divergence of tree communities in Taipei's main urban green spaces. Landsc. Urban Plan. 84, 312–323. doi: 10.1016/j.landurbplan.2007.09.001
Jim, C. Y., and Liu, H. T. (2001a). Patterns and dynamics of urban forests in relation to land use and development history in Guangzhou City, China. Geogr. J. 167, 358–375. doi: 10.1111/1475-4959.00031
Jim, C. Y., and Liu, H. T. (2001b). Species diversity of three major urban forest types in Guangzhou City, China. For. Ecol. Manage. 146, 99–114. doi: 10.1016/S0378-1127(00)00449-7
Jim, C. Y. (1993). Trees and landscape of a suburban residential neighbourhood in Hong Kong. Landsc. Urban Plan. 23, 119–143. doi: 10.1016/0169-2046(93)90112-Q
Kendal, D., Williams, K. J. H., and Williams, N. S. G. (2012a). Plant traits link people's plant preferences to the composition of their gardens. Landsc. Urban. Plan. 105, 34–42. doi: 10.1016/j.landurbplan.2011.11.023
Kendal, D., Williams, N. S. G., and Williams, K. J. H. (2012b). Drivers of diversity and tree cover in gardens, parks and streetscapes in an Australian city. Urban For. Urban Green. 11, 257–265. doi: 10.1016/j.ufug.2012.03.005
Kirkpatrick, J. B., Daniels, G. D., and Davison, A. (2011). Temporal and spatial variation in garden and street trees in six eastern Australian cities. Landsc. Urban Plan. 101, 244–252. doi: 10.1016/j.landurbplan.2011.02.029
Koerner, S. E., and Collins, S. L. (2013). Small-scale patch structure in North American and South African grasslands responds differently to fire and grazing. Landsc. Ecol. 28, 1293–1306. doi: 10.1007/s10980-013-9866-0
Kunick, W. (1987). Woody vegetation in settlements. Landsc. Urban Plan. 14, 57–78. doi: 10.1016/0169-2046(87)90006-5
Laliberté, E., and Legendre, P. (2010). A distance-based framework for measuring functional diversity from multiple traits. Ecology 91, 299–305. doi: 10.1890/08-2244.1
Lowry, J. H., Baker, M. E., and Ramsey, R. D. (2011). Determinants of urban tree canopy in residential neighborhoods: Household characteristics, urban form, and the geophysical landscape. Urban Ecosyst. 15, 247–266. doi: 10.1007/s11252-011-0185-4
Luck, G. W., Smallbone, L. T., and O'Brien, R. (2009). Socio-economics and vegetation change in urban ecosystems: patterns in space and time. Ecosyst. 12, 604–620. doi: 10.1007/s10021-009-9244-6
Maco, S., and McPherson, E. (2002). Assessing canopy cover over streets and sidewalks in street tree populations. J. Arboric. 28, 270–277.
Martin, C. A., Warren, P. S., and Kinzig, A. P. (2004). Neighborhood socioeconomic status is a useful predictor of perennial landscape vegetation in residential neighborhoods and embedded small parks of Phoenix, AZ. Landsc. Urban Plan. 69, 355–368. doi: 10.1016/j.landurbplan.2003.10.034
McBride, J., and Jacobs, D. (1976). Urban forest development: a case study, Menlo Park, California. Urban Ecol. 2, 1–14. doi: 10.1016/0304-4009(76)90002-4
McGill, B. J., Enquist, B. J., Weiher, E., and Westoby, M. (2006). Rebuilding community ecology from functional traits. Trends Ecol. Evol. 21, 178–185. doi: 10.1016/j.tree.2006.02.002
Miller, P., and Winer, A. (1984). Composition and dominance in Los Angeles Basin urban vegetation. Urban Ecol. 8, 29–54. doi: 10.1016/0304-4009(84)90005-6
Oksanen, J., Blanchet, F. G., Kindt, R., Legendre, P., Minchin, P. R., O'Hara, R. B., et al. (2013). vegan: Community Ecology Package. R package version 2.0-9. Available online at: http://CRAN.R-project.org/package=vegan
Pataki, D., McCarthy, H., Gillespie, T., Jenerette, G. D., and Pincetl, S. (2013). A trait-based ecology of the Los Angeles urban forest. Ecosphere 4:art72. doi: 10.1890/ES13-00017.1
Pataki, D. E., McCarthy, H. R., Litvak, E., and Pincetl, S. (2011). Transpiration of urban forests in the Los Angeles metropolitan area. Ecol. Appl. 21, 661–677. doi: 10.1890/09-1717.1
Pearce, L. (2013). Using size class distributions of species to deduce the compositional dynamics of the private urban forest. Arboric. Urban For. 39, 74–84.
Pincetl, S., Gillespie, T., Pataki, D. E., Saatchi, S., and Saphores, J.-D. (2012). Urban tree planting programs, function or fashion? Los Angeles and urban tree planting campaigns. GeoJournal 78, 475–493. doi: 10.1007/s10708-012-9446-x
Pincetl, S., Prabhu, S. S., Gillespie, T. W., Jenerette, G. D., and Pataki, D. E. (2013). The evolution of tree nursery offerings in Los Angeles County over the last 110 years. Landsc. Urban Plan. 118, 10–17. doi: 10.1016/j.landurbplan.2013.05.002
Reich, P. B., Walters, M. B., and Ellsworth, D. S. (1997). From tropics to tundra: global convergence in plant functioning. Proc. Natl. Acad. Sci. U.S.A. 94, 13730–13734. doi: 10.1073/pnas.94.25.13730
Roman, L. A., and Scatena, F. N. (2011). Street tree survival rates: meta-analysis of previous studies and application to a field survey in Philadelphia, PA, USA. Urban For. Urban Green. 10, 269–274. doi: 10.1016/j.ufug.2011.05.008
Rundel, P. W., and Gustafson, R. (2005). Introduction to the Plant Life of Southern California. University of California Press, Los Angeles.
Sanders, R. (1984). Some determinants of urban forest structure. Urban Ecol. 8, 13–27. doi: 10.1016/0304-4009(84)90004-4
Sjöman, H., Östberg, J., and Bühler, O. (2012). Diversity and distribution of the urban tree population in ten major Nordic cities. Urban For. Urban Green. 11, 31–39. doi: 10.1016/j.ufug.2011.09.004
Talarchek, G. (1990). The urban forest of New Orleans: an exploratory analysis of relationships. Urban Geogr. 11, 65–86. doi: 10.2747/0272-3638.11.1.65
Vallet, J., Daniel, H., Beaujouan, V., Rozé, F., and Pavoine, S. (2010). Using biological traits to assess how urbanization filters plant species of small woodlands. Appl. Veg. Sci. 13, 412–424. doi: 10.1111/j.1654-109X.2010.01087.x
Venables, W. N., and Ripley, B. D. (2002). Modern Applied Statistics with S. New York, NY: Springer.
Whittaker, R. J., Willis, K. J., and Field, R. (2001). Scale and species richness: towards a general, hierarchical theory of species diversity. J. Biogeogr. 28, 453–470. doi: 10.1046/j.1365-2699.2001.00563.x
Williams, N. S., Schwartz, M. W., Vesk, P. A., McCarthy, M. A., Hahs, A. K., Clemants, S. E., et al. (2009). A conceptual framework for predicting the effects of urban environments on floras. J. Ecol. 97, 4–9. doi: 10.1111/j.1365-2745.2008.01460.x
Zhang, H., and Jim, C. Y. (2014). Species diversity and performance assessment of trees in domestic gardens. Landsc. Urban Plan. 128, 23–34. doi: 10.1016/j.landurbplan.2014.04.017
Keywords: ecosystem services, functional traits, Los Angeles, resident preferences, tree diversity
Citation: Avolio ML, Pataki DE, Gillespie TW, Jenerette GD, McCarthy HR, Pincetl S and Clarke LW (2015) Tree diversity in southern California's urban forest: the interacting roles of social and environmental variables. Front. Ecol. Evol. 3:73. doi: 10.3389/fevo.2015.00073
Received: 08 May 2015; Accepted: 23 June 2015;
Published: 21 July 2015.
Edited by:
Jeremy Lundholm, Saint Mary's University, CanadaReviewed by:
Nicholas Williams, University of Melbourne, AustraliaPuay Yok Tan, National University of Singapore, Singapore
Copyright © 2015 Avolio, Pataki, Gillespie, Jenerette, McCarthy, Pincetl and Weller-Clarke. This is an open-access article distributed under the terms of the Creative Commons Attribution License (CC BY). The use, distribution or reproduction in other forums is permitted, provided the original author(s) or licensor are credited and that the original publication in this journal is cited, in accordance with accepted academic practice. No use, distribution or reproduction is permitted which does not comply with these terms.
*Correspondence: Meghan L. Avolio, Department of Biology, University of Utah, 257 S 1400 E Salt Lake City, UT 84112, USA, meghan.avolio@gmail.com
†Present Address: Lorraine Weller Clarke, College of Agriculture, Urban Stainability and Environmental Sciences, University of the District of Columbia, Washington, USA