Automatic methods for long-term tracking and the detection and decoding of communication dances in honeybees
 Fernando Wario
 Benjamin Wild
 Margaret J. Couvillon
 Raúl Rojas1
  Tim Landgraf
- 1FB Mathematik und Informatik, Freie Universität Berlin, Berlin, Germany
- 2Laboratory of Apiculture and Social Insects, School of Life Sciences, University of Sussex, Brighton, UK
The honeybee waggle dance communication system is an intriguing example of abstract animal communication and has been investigated thoroughly throughout the last seven decades. Typically, observables such as waggle durations or body angles are extracted manually either directly from the observation hive or from video recordings to quantify properties of the dance and related behaviors. In recent years, biology has profited from automation, improving measurement precision, removing human bias, and accelerating data collection. We have developed technologies to track all individuals of a honeybee colony and to detect and decode communication dances automatically. In strong contrast to conventional approaches that focus on a small subset of the hive life, whether this regards time, space, or animal identity, our more inclusive system will help the understanding of the dance comprehensively in its spatial, temporal, and social context. In this contribution, we present full specifications of the recording setup and the software for automatic recognition of individually tagged bees and the decoding of dances. We discuss potential research directions that may benefit from the proposed automation. Lastly, to exemplify the power of the methodology, we show experimental data and respective analyses from a continuous, experimental recording of 9 weeks duration.
Introduction
A honeybee colony is a striking example of a complex, dynamical system (Seeley, 1995; Bonabeau et al., 1997). It is capable of adapting to a variety of conditions in an ever-changing environment. Intriguingly, the colony's behavior is the product of myriads of interactions of many thousand individuals, who each measure, evaluate and act on mostly local cues. Besides the mechanisms that regulate individual behavior, the flow (and hence processing) of information in the network of individuals is a crucial factor for the emergence of unanimous colony behavior (Hölldobler and Wilson, 2009). The most prominent example of honeybee social interaction, the waggle dance, has been investigated intensely throughout the last seven decades (Von Frisch, 1965; Seeley, 1995; Grüter and Farina, 2009), still leaving some important questions unanswered.
Foragers or swarm scouts, who have found a profitable resource or new nest site return to the hive and perform symbolic body movements on the comb surface or directly on the swarm. Intriguingly, properties of the dance correlate with properties of the resource in the field. It was Karl von Frisch who postulated that bees showing high interest in the dance can decode the information content and exhibit a high probability of finding the advertised site (Von Frisch, 1965; Seeley, 1995; Riley et al., 2005). The waggle dance consists of two portions, a waggle run in which the dancer shakes her body laterally while moving forward on the comb surface; and a return run in which the dancer circles back to initiate a new waggle run from her previous approximate starting location (Von Frisch, 1965; Landgraf et al., 2011). Return runs are alternatingly performed clockwise and counterclockwise, consecutive waggle runs exhibit an angular difference inversely proportional to the target distance (Von Frisch, 1965; Weidenmüller and Seeley, 1999; Tanner and Visscher, 2010; Landgraf et al., 2011). Distance from the hive to the food or nest site is encoded in the duration of the dancer's waggle oscillation; direction from the hive to the resource is encoded in the body angle in the waggle phase relative to the vertical (Von Frisch, 1965). The quality of the resource is reflected in the absolute number of waggle run repetitions and inversely proportional to the return run duration: profitable resources are advertised with longer dancer exhibiting a higher waggle production rate (Seeley et al., 2000). Interested bees (dance followers) track the movements, decode relevant information and search for the resource in the field (Seeley, 1995; Biesmeijer and Seeley, 2005; Riley et al., 2005; Menzel et al., 2011; Al Toufailia et al., 2013a). Successful finders may themselves return to the hive and dance, resulting in a cascade of recruitment. The positive feedback nature of the waggle dance can be regulated by a negative feedback mechanism, the stop signal. Foragers, nest scouts or follower bees knock their head against the dancer's body in conjunction with a short burst of thorax vibrations. Waggle dancers are more likely to stop dancing after receiving the stop signal, as has been observed in the context of swarming (Seeley et al., 2012) and foraging (Nieh, 1993, 2010; Kirchner, 1994; Pastor and Seeley, 2005). The waggle dance/stop signal system therefore is a wonderful example of how multi-individual interactions, such as between dancers and dance followers, may result in a collective behavior, such as the adaptive, colony-level exploitation of dynamic resource availability (Seeley et al., 1991; Seeley, 2010).
However, even this well-investigated communication system offers ample room for further research. If, for example, two individuals meet as dancer and follower, it is still unknown which factors determine this event. How does one bee become a dance follower? Surely, some general requirements, like the respective motivational state, must be met for the follower. But that specific animal might not follow other dances prior to the focal one. Does random dance-attending (Bozic and Valentincic, 1991) increase her likelihood to follow any dance? Or can we identify preferences for certain dance locations on the comb, dance properties or even dancer identities? How do dancer and follower find each other? Do dancers seek followers, or vice versa? Does the follower's history of in-hive interactions determine future decisions to follow specific dances, and if so, how far back in time can specific experiences influence this decision?
In decades since the waggle dance was first discovered (Von Frisch, 1965), most analysis on the waggle dance has moved from a real-time collection of dance data (Visscher, 1982; Waddington et al., 1994; Steffan-Dewenter and Kuhn, 2003) to one that occurs after the fact from video, using a manual (e.g., Beekman and Ratnieks, 2000), semi-automatic (e.g., De Marco et al., 2008) or automatic technique (e.g., Landgraf et al., 2011) for the extraction of focal properties. This allows the analysis of many individuals simultaneously by replaying the video as often as necessary and improves the spatial and temporal data resolution. However, like most video analysis, it is limited by either technical parameters (disk space, temporal, and spatial recording resolution) or available personnel for analyzing the video to extract the data: oftentimes the analysis takes a multiple of the video's real-time duration.
The dancer and the message she is communicating has been thoroughly investigated (Von Frisch, 1965; Seeley, 1995, 2010). However, the dance is not self-contained. It is likely embedded in a network of, potentially still unknown, interactions. Previous experience plays an important role in attracting a follower to certain dances (Grüter et al., 2008; Grüter and Ratnieks, 2011; Al Toufailia et al., 2013b) or, after following the dance, in her propensity to attempt finding the location of the advertised site. This experience might include in-hive interactions as well. Since these memories can build up over many days, we need to observe the individuals over a broad timespan of up to a few weeks. Rather than starting the recording when a waggle dance occurs, we need to track any given follower back in time. Optimally, we would like to record her entire life.
However, this is only possible with appropriate automation for a hierarchy of tasks such as image acquisition and storage, animal identification and tracking, and the recognition of focal behaviors. Overall, this constitutes a considerable technical challenge. Especially the automatic recognition of interaction types seems infeasible, since some behaviors involve subtle body movements, which are hard to detect for machine vision systems. However, some interaction types, such as the waggle dance, the dance-following behavior and the exchange of food exhibit properties that seem sufficiently discriminable so that their characteristics can be formulated in a respective detection algorithm. Such automation would provide datasets of unprecedented magnitude in the duration of data collection, the number of traced individuals, and the bandwidth of detectable behaviors. This would allow for profound and comprehensive analyses of the interplay of individual and colony behavior.
Computer programs are increasingly used to help annotating or measuring parameters of animal behavior in video data (Noldus et al., 2001; Pérez-Escudero et al., 2014). A few automatic procedures have been proposed to track unmarked bees (Landgraf and Rojas, 2007; Kimura et al., 2011, 2014), but none are applicable for long-term tracking because of the high degree of ambiguity in the appearance of unmarked bees, frequent occlusions and the property of foragers to leave the hive. To our knowledge, tracking and identification software for uniquely marked bees has not been proposed yet. Only one marker-based system was developed in Lausanne (Mersch et al., 2013) for the use with a few hundred ants which were kept in an open arena. The ID tags used in these experiments were rectangular and planar. It is unknown whether this system can be used with bees. In the liveliness of a hive, tags supposedly have to tightly adapt to the round thorax to ensure their sustained hold over weeks.
The automatic detection of honeybee dances has been proposed earlier (Kimura et al., 2011). However, the analysis is reportedly 360 times slower than real-time and cannot reveal the identity of the dancer. To our knowledge, no system is available for the continuous long-term tracking of uniquely identifiable bees and the automatic recognition of the waggle dance, the dance-following behavior and trophallaxis.
In this contribution, we propose such a system, in the following called the BeesBook system. It comprises the automatic recording and storage of high-resolution images, an on-line waggle dance detection software, computer vision software for recognizing and identifying uniquely marked bees and post-processing software for various tasks such as the recognition of follower bees and trophallaxis. The system is conceived as a budget-priced framework for the incremental development of software and hardware components. This way, the BeesBook system can be used to detect other focal behaviors in dance-unrelated research. The paper is organized in two parts: A thorough technical description of the system and the experimental validation, including the quantification of performance measures for the system's components. We will conclude with a discussion of the system's current and future capabilities, and provide examples of further applications in and beyond the waggle dance communication.
Beesbook: Tracking All Bees in the Hive
Hive and Recording Setup
A modified one-frame honeybee observation hive with a custom glass replacement mechanism is used. Bees frequently smear small portions of honey, wax, and propolis on the glass, which impairs the image quality. The custom hive allows replacing the glass once it is necessary without having to open it. The hive stands in an aluminum scaffold that holds infrared LED cluster lamps and six cameras in total (shown in Figure 1). The entire skeleton is enveloped with IR reflector foil that has small embossments for light dispersion. The foil reflects 80% of infrared light and helps creating a homogeneous ambient lighting which reduces reflections on the glass pane or the tags.
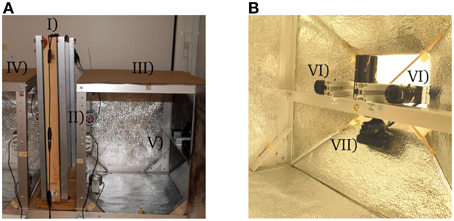
Figure 1. (A) Experimental setup: (I) observation hive, (II) infra-red lamps, (III) right side of observation cage, (IV) left side of observation cage, (V) right side camera array. (B) Detailed view of a camera array: (VI) high resolution cameras, (VII) PS3Eye webcam.
Individual Block-code Tags (“Circulatrix”)
To optimally exploit the space on a bee's thorax and to create a smooth surface that endures heavy duty activities, we have designed a circular, curved tag (Figure 2). The tag adapts to the thorax and displays a ring divided in 12 segments, each of which holds one bit of information. The center of the tag is divided into two semicircular segments, which are used to determine the tag's orientation and to align the decoder properly. A fully functioning, queen-right observation hive can be populated by approximately 2000 worker bees. Twelve bits of information are sufficient to encode the identity of a maximum of 4096 animals. In case fewer animals are used, a coding scheme that allows for error detection or correction can be employed. If for example a single bit is spare, it could be used as a parity bit. If three or more bits are spare, Huffman coding (Huffman, 1952) can be employed. The tags are printed on backlit polyester film by a commercial print shop and manually punched out. This procedure bends the tags for optimal fit to the bees' thorax.
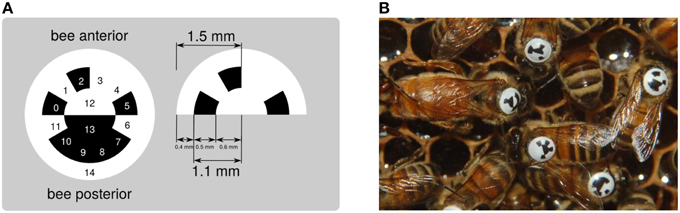
Figure 2. (A) The circular matrix design exhibits 15 regions used to represent a unique binary code (cells 0–11), to encode the tag's orientation (cells 12 and 13) and produce a clear contrast with the bee thorax (ring 14). (B) Tagged bees inside the hive.
Bee Marking Procedure
Bees are marked prior to the start of the video recording with the help of coworkers over a period of several hours. We use two hives: one standard observation hive containing the unmarked colony and one modified observation hive to which the individuals are transferred once they have been marked. We extract approximately 50 bees from the original hive at a time into a tubular container with a vacuum cleaner and distribute single bees to marking personnel. First, hair is removed from the thorax, then shellac is dispersed onto it, and finally the tag is attached with the white semi-circle rotated toward the anterior. Tagged bees are then put in a small container. Once all bees of that batch have been tagged, the bees are poured to the hive entrance hole (which now connects to the new hive). This procedure is repeated with all remaining, untagged bees from the original hive. The queen is handled differently. After tagging, she is introduced to the hive through a separate entrance. The tags have been tested previously. Almost all bees survive the tagging procedure and behave normally with the tags. Only a small fraction (< 7%) of the tags wears off before the animals reach their natural life expectancy (6–7 weeks). By the time of writing this article, after more than 8 months, the queen's tag was still properly attached.
Cameras and Camera Modifications
Four high-resolution cameras (PointGrey Flea3) are employed to observe the surface of the comb, two per side. They feature a 1/2.5″ CMOS color sensor with a resolution of 12 megapixels (4000 × 3000 pixels) and are connected to the central recording computer via USB3. We use inexpensive 12 mm lenses (RICOH FL-CC1214A-2M). Two additional cameras (PS3Eye webcams) are connected to a second personal computer. Each of these cameras observes the full comb side at 320 × 240 pixels resolution. The PS3Eye cameras are low cost (10 $) and deliver uncompressed images at 120 fps using a modified third party driver (“CL Eye”). Both camera types are shipped with an infrared block filter glass. We replaced the one of the Flea3 with a cold light mirror with the same refraction index (bk Interferenzoptik bk-HT-45-B). This modification renders the Flea3 an inexpensive alternative to similar IR-sensitive cameras. To optimize the performance of the PS3Eye, not only the IR block filter was removed, but also the original lens was replaced with an 8 mm IR corrected Megapixel lens (Lensagon BM8018), in order to fit the new lens to the camera a customized 3D printed lens mount was produced.
Software
The implemented functionalities of the BeesBook system are divided into three software suites that reflect the experimental chronology: (I) data acquisition with online dance detection, (II) offline image processing on a supercomputer, and (III) data post processing.
Data Acquisition and Data Hierarchy
One personal computer (PC1) is used for image acquisition and transfer. Another computer (PC2) is running the online dance detection algorithm. The acquisition computer queries 3.5 frames per second from each high-res camera and stores each image using JPEG compression (95% quality). A second program on PC1 bundles images to packages of 512 MB size (256 images per archive) and transfers them to the Zuse Institute Berlin (ZIB), where the HLRN (North German Supercomputing Alliance) provides sufficient storage space. A subset of the data, currently 6 stripes of 10 min duration (distributed over the day), is stored on a local storage device (QNAP NAS). PC2 analyzes the images of the PS3Eye webcams in real-time and stores frame coordinates and 20 × 20 pixel image regions for each detected waggle run. These data are mirrored onto the NAS completely. The detection method is described in Section Automatic Waggle Dance Detection and Decoding. Possible errors of any of the above programs are exported to a log file and signaled to the administrator via email. In case a program crashes or freezes (which renders them unable to report errors themselves), so-called watchdog programs are used for the automatic recognition of critical events and the termination of unresponsive processes. These events are rare but might lead to substantial data loss.
We organize all data in a hierarchy of data levels. The raw image recordings represent the lowest, most fundamental level. The computer vision software searches and decodes circulatrix tags in these image recordings (see Section Image Analysis) and creates the next level of data, the bee detections. This data, in turn, serves as input for the tracking software that identifies corresponding detections in time (see Section Tracking and Temporal ID Filter). The trajectory level is then analyzed primarily by behavior recognition algorithms which create the upmost data level representing the focal behaviors. Except the raw image level, all other data levels are efficiently organized in a spatial database (see Section Database Design).
Image Analysis
We have developed computer vision algorithms to locate and to decode the circulatrix tags in high-res images. The image processing software, from here on called “pipeline,” is organized in five layers, each of which processes the results of the previous one.
(1) Preprocessor: The first layer processes the original camera frame. Throughout the experiment, lighting conditions were optimized. To normalize the brightness in the darker recordings shot in the beginning of the experiment, histogram equalization is applied. Some areas on the comb exhibit empty cells whose sharp edges would impair the performance of later stages. We have designed a spatial frequency filter to attenuate comb cell edges. Full honey cells are very bright in the image and also lead to false positives in the next stage. A special image heuristic recognizes patches of honey cells which are then ignored downstream.
(2) Tag localization: This layer detects image regions that contain strong edges and therefore likely exhibit circulatrix tags. Those are identified by detecting a multitude of strong edges in close proximity. This definition applies to other objects in the image as well but reduces the amount of pixels that enter downstream stages drastically. Initially, the first derivative of the image is computed using a Sobel filter. The result is binarized (only pixels on strong edges are retained), eroded and dilated (Serra, 1986) to remove noise and to join adjacent patches. Large binary patches are reported as regions of interest to the next layer.
(3) Ellipse fitting: This layer detects elliptic contours in the regions of interest. We use a probabilistic Hough transform (Xie and Ji, 2002) to find likely ellipse configurations defined by a high amount of edge pixels agreeing with an ellipse equation for a range of plausible parameter values (we exclude heavily rotated tags since those are likely to be decoded incorrectly).
(4) Grid fitting: For each ellipse that has been detected, this layer fits a three-dimensional model (“Grid”) of the circulatrix tag to the underlying image. When rotated in space, the contour of the circular tag becomes an ellipse in the camera image. There are two possible 3D rotations of a circular contour that project to a given ellipse in the image. We identify the two sets of rotation parameters from the ellipse parameters and apply a gradient ascent from the two starting configurations. The quality of the fit is expressed by a scoring function that evaluates a) the homogeneity of the pixel brightness in each cell (Fisher, 1936) and b) the match of the outer Grid contour to the image edges. The three best Grid configurations are reported to the decoder layer.
(5) Decoding: Each ring segment of the grid represents either a “0” (black) or a “1” (white). The sequence of zeros and ones constitutes the unique identifier of the bee. Local contrast enhancement is applied to account for light intensity gradients on the circulatrix tag. The decoder computes a statistic of the brightness of all underlying pixels for each ring segment to classify the cells to either of the two classes and reports the number as the final result.
Each layer of the image processing pipeline extracts more information from an initial detection (see Figure 3). For every pipeline layer a confidence value is calculated. Only if the confidence value of the current layer exceeds a certain reliability threshold, its result is reported to the following stage. In layer 3, for example, this confidence value correspond to the number of edge pixels that accord with an ellipse equation. The ellipses detected in layer 3 are assumed to identify a tag and are therefore reported as the most basic part of any detection. In layer 4, if more than one grid can be matched to the image with a sufficient confidence value, the respective grid configuration (center coordinate, scale and three rotation angles) is added to a list and the best three configurations are reported to the next layer. Similarly, the last layer reports up to three IDs for every grid configuration, yielding up to 9 different output configurations.
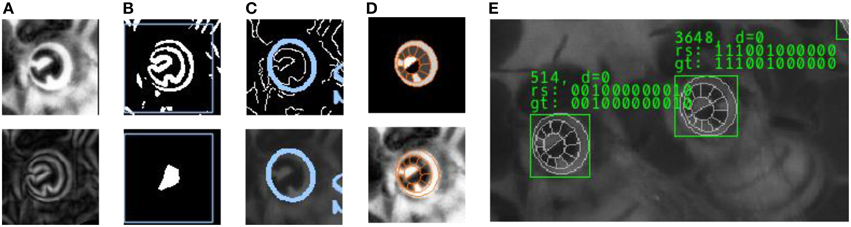
Figure 3. Intermediate processing stages for tag detection and decoding. (A) Histogram equalization and Sobel edge detection. (B) Edge binarization and morphological operations in the Localizer layer. Only regions of interest (marked with a blue rectangle) are processed in the next layer. (C) Ellipse fit using probabilistic Hough transform. (D) 3D Grid model and fit to underlying image. (E) Result: The sequence of 0's and 1's is determined in the Decoder layer, based on the fit of the tag model. For a subset of the image data we have created a reference “ground truth” that is used to validate the output of the pipeline.
The pipeline has various parameters such as thresholds for the edge detection or the number of iterations of the morphological operations (48 parameters in total). Manually determining the optimal combination of parameters can be very time consuming and might result in a suboptimal performance. We use a global optimization library (Martinez-Cantin, 2014) to automatically select the best set of parameters.
Highly parallelized image analysis on supercomputer
A prototypical data acquisition over 60 days would produce a total of four cameras 3.5/s·60 s/min·60 min/h·24 h/d·60 d = 72.576.000 images. The image processing on the supercomputer reduces the raw image data (~170 Terabytes), corresponding to the lowest data level, to a few hundred Gigabytes of second-level data. If the analysis of a single image would take 1 s, the complete analysis would take almost 3 years. To speed up this process, we use computing and storage resources granted by the North German Supercomputing Alliance (HLRN). The image data are stored on the supercomputer's file system, which circumvents additional data transfers. The HLRN houses a Cray XC30 supercomputer, which features 1872 compute nodes with 24 CPU cores each (this yields a total of 44928 processors). The system has 117 TiB of RAM and 4.2 Petabyte of hard disk space, organized as RAID 6. The image analysis is partitioned into jobs that each run on a single image at a time. The degree of parallelism can vary from a few hundred to a few thousand jobs as determined by the Cray's scheduler (a program that automatically selects jobs from a list of ready jobs). Some of the supercomputer's components are still in development and might prevent an arbitrary job from finishing its analysis. Since it is impossible to check manually if 72 million result files have been written to disk, we have implemented a recovery system that automatically detects and recovers from failures in the job submission and execution phase. The results of the decoding process are stored in a.csv file for each image.
Post-processing
The image analysis is a data reduction step which creates the basic data level for all further analyses. The tracking algorithm (Section Tracking and Temporal ID Filter) creates the trajectory data level which links detections over time. Both data levels are used for detecting focal behaviors (dance, dance-following and trophallaxis detection, see Section Identification of Dancers, Followers, and Trophallaxis).
Database design
Due to performance reasons, all post-processing steps are designed to query data from a specialized database. The detection datasets produced by the pipeline are uploaded to a PostgreSQL database which holds all available information as described in Post-processing. The detections are organized in the form of a table with each row representing a detection. We have recorded 65 million images, each of them containing up to several hundreds of tags. Therefore, several billions of detections have to be stored. We have implemented interface functions into the database to accelerate interaction with the data. If, for example, we would like to know all neighboring bees of a focal bee, this query is optimized on the database level. The data has to be processed before uploaded to the database. To this time, the data processing and upload process takes approximately 90% of the recording period's duration but runs in parallel to the image processing. The analyses described in the following query data from the database, process it on local PCs and enrich particular entries in the database with additional information, such as corrected IDs, associations to trajectories or behavior labels.
Tracking and temporal ID filter
Keeping track of individuals through consecutive frames is a crucial procedure because it creates motion paths that may be required for behavior analyses. Under optimal circumstances, tracking an individual and generating its path is as simple as connecting consecutive detections of the same ID. However, the decoder layer might extract erroneous IDs for a variety of reasons (see discussion). In this case, merely connecting successive appearances of the same ID would yield erroneous tracks. To address this problem we have developed tracking software which links consecutive detections through time by selecting the best match among a number of candidate detections. The tracking process pursues two goals: the generation of reliable motion paths of single individuals and the correction of misread IDs.
Our solution to this problem is a probabilistic approach. For an arbitrary track T, containing consecutive detections up to time t, we maintain a probability distribution Pt reflecting all previous ID measurements. All detections in frame t + 1 within a certain range are evaluated following a criterion that comprises:
• the Euclidian distance of the track's last detection to a candidate detection
• a distance measure of Pt and the putative next detection's ID
• a convergence criterion for Pt
• an image processing error estimate representing the likelihood of misread bits in the ID
The information contained in the new candidate detection is integrated into the probability distribution Pt via a Markov process: Pt+1 = Pt * p, where p is a probability distribution estimated from the detection at time t + 1. The probability of misreading a bit is influenced by neighboring bits. For example, due to image blur, it might be more likely to read a single white bit as a black one when it is enclosed by two black bits. We have estimated the probability of all possible errors for all combinations of three consecutive bits (using manually tracked ground truth). After integrating the a-priori information p, Pt represents the current likelihood for each bit to have a certain value. A convergence value can be computed over Pt to express our confidence in the current ID estimate. In timestep t + 1, we assign each detection to the most likely path Tj using a greedy selection scheme (the decision to assign a detection to a path is immutable even if future information renders it suboptimal). If no match for a single detection can be found with sufficient confidence, a new path with a new probability distribution is initialized.
The tracking must handle two problematic scenarios. (1) Newly appearing detections and (2) detections that disappear.
In the former case, no history of detections can be used to determine the most probable ID. The probability distribution has not yet converged (see Figure 4 Top). If a track cannot be elongated enough, it stays anonymous.
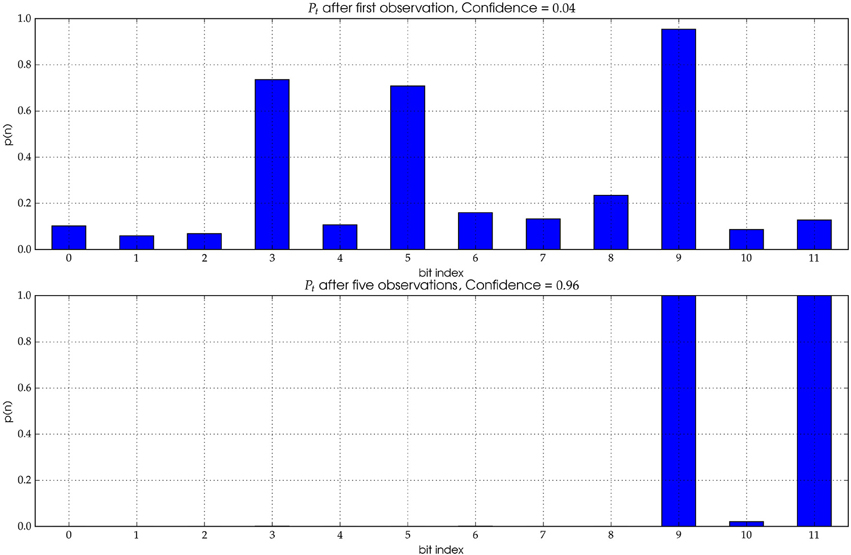
Figure 4. The distribution Pt represents the likelihood for each individual bit to be of value “1.” Top: A single observation yields a distribution with significant uncertainty (see text for details). The correct ID for the underlying image is (000000000101). However, the most likely ID according to the initial distribution is (000101000100), i.e., the first observation exhibits three wrong bits. Bottom: After five observations the distribution has mostly converged and the true ID can be extracted with high confidence.
The greedy assignment of all detections to a path can only be guaranteed to be correct when no detections are missing. In this case the tracker might erroneously assign a detection in the vicinity of the actual tag. This is problematic for quickly moving bees since the motion blur increases the likelihood of a missing detection (see discussion). If we were not able to find a likely match, we add placeholder detections to the path. After exceeding the certain number of consecutive placeholder detections the path sequence is finalized (no further detections can be added).
Identification of dancers, followers, and trophallaxis
Due to motion blur and the low sampling frequency, the IDs of waggle dancing bees are hard to determine from the high-res image data. Therefore, we use an automatic waggle dance detection algorithm that runs in parallel with the image acquisition, detecting the location of the dancer in real-time (see Section Automatic Waggle Dance Detection and Decoding for details). However, due to low sensor resolution, it is not possible to extract the bee's ID in those recordings. Another post-processing step is performed to find the ID of the respective waggle dancers in the previously described high-resolution dataset. Apart from waggling, a dancer exhibits other features that, in combination with the dance detection data, we can use to identify her with high accuracy. First, dancers alternatingly perform waggle and return runs. Only the former is likely to be missing in the dataset. This “on-off” pattern is reflected in the trajectories. We look for those patterns and quantify their periodicity and regularity (all return and waggle runs should have similar length, respectively). Second, the start and end positions of the waggle run often exhibit readable tags. The dance detection results in a location on the comb, the dance angle and a duration which - together with an average forward motion in the waggle phase - define an axis that dancers align to. If detections close to start and end point of a waggle run agree in orientation and ID they are collected to the candidate set. A third feature we test for is the turn of the animal of almost 360° in the return runs. For a single waggle run, there might be a few detections that exhibit those features sufficiently. Over many waggle runs the ID of the dancer can be determined with high accuracy. Followers are easier to find. The criterion animals have to satisfy is (1) proximity to the dancer and (2) the body oriented toward the dance position. Animals that engage in trophallaxis can be recognized as well. Therefore, four consecutive, non-moving detections in head-to-head configuration are sought and reported.
Automatic Waggle Dance Detection and Decoding
The waggle motion creates motion blur in the high-resolution recordings but can be detected in high-speed video. The dancer swings her body laterally at a frequency of around 13 Hz. A pixel in the image corresponds to a small area on the comb surface. If this point measurement over time intersects with a waggle dancing bee we obtain samples that reflect her surface texture and motion dynamics combined. Since bees contrast with the background, we observe brightness changes with spectral components of either the waggle frequency or harmonics. At the core, our automatic waggle dance detector evaluates how well, for a given pixel coordinate, the temporal variation of its brightness matches this “waggle frequency.” The camera observes the full comb with an image resolution of 320 × 240 pixels. This corresponds to a resolution of ~1 mm/pixel, or approximately 60 pixels/bee (Figure 5). For each of the 320 × 240 = 76800 pixel locations the most recent 32 values of their temporal evolution are stored in a ring buffer. When a new frame arrives, the oldest pixel value is overwritten. We then calculate a statistical measure of how well the pixel brightness evolution matches the waggle frequency by correlating the input signal with a number of cosine and sine signals with different target frequencies. Neighboring locations exhibiting that property are then clustered in a second step. If the detection is sustained over time, the image location and the respective sub-images (an image sequence of 20 × 20 pixels size) are stored to disk. It is possible to extract waggle duration and waggle orientation as well. The former is identified by the duration of consecutive detections; the orientation is defined by the first principal component (Hotelling, 1933) of the image locations of all consecutive detections. The software can be used either in conjunction with the high-resolution tracking system or as a stand-alone tool to anonymously detect and decode dances. Image coordinates as reported by the software can automatically be rectified with the help of a user defined area whose dimensions are known. We describe the evaluation procedure for this system in Section Dataset 2: Dance Detection and Decoding and report the respective results in Section Dance Detection and Decoding.
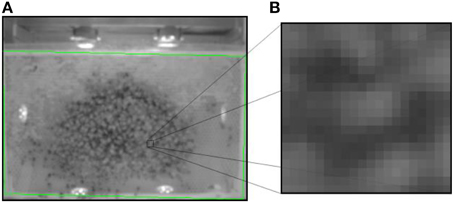
Figure 5. A screenshot of the waggle detection camera stream. (A) The green rectangle demarcates the comb borders. Note the low image resolution. Waggle dance detections are reported with their image and comb frame coordinates and a (B) sub-image of 20 × 20 pixels size (shown right).
Experimental Validation and Results
Datasets
Two separate honeybee colonies were used to experimentally validate the function of the described system and system components. Therefore, two datasets were recorded.
Dataset 1: Tag Detection and Decoding
We have continuously recorded all animals of a small colony (< 2000 marked individuals) from July 24th until September 25th 2014 (63 full days). Most bees were marked 1 day prior to the start of the recording. During the first week, young bees were tagged and introduced to the experimental hive on the day they emerged from a separate, incubated brood comb kept under standard conditions at 34.5°C (Crailsheim et al., 2013). High-resolution images were transferred to the remote storage location. One of the four cameras failed 1 day prior to the experiments. Unfortunately, it took the manufacturer 3 weeks to replace the camera. Thus, one quarter of the comb could not be observed and around six million images are missing from the expected number of 72 million. In the beginning of the experiment we optimized parameters such as illumination, camera position and camera viewing angles. No data was recorded in the maintenance periods (~4 million images). This yielded 65 million recorded images in total. Approximately 6% of the total data was mirrored locally. Over the entire period the dance detection software observed both sides of the comb and saved detections to disk. These data were mirrored as well. Results of an analysis of dataset 1 are reported in Section Tag Detection and Decoding. The validation of this dataset spans different data levels. The image analysis recognizes and decodes the circulatrix tags and stores separate detections per timestep. To validate this software component we manually fitted a three-dimensional model of a tag in a number of image recordings we randomly picked from dataset 1. This “ground truth” serves as a reference (for location, orientation and identity). Each software layer (see Section Image Analysis) is validated separately by calculating two common performance measures, recall and precision. Those reflect the proportion of the reference data that were correctly identified, and the proportion of the reported detections that are correct, respectively. The tracking software, i.e., the component that connects corresponding detections through time, is validated on a different ground truth reference. Fifty animals were traced manually with custom software by selecting the correct detection (as produced by the pipeline) with the mouse pointer. The validation analysis investigates the correctness of the path and the ID obtained from consecutive measurements over time.
Dataset 2: Dance Detection and Decoding
A second observation hive (two frames, located at 52.457075, 13.296055) was used to detect and decode dances in an unmarked colony. The recording period spanned 57 days (July 04th to September 1st 2014). We employed two cameras to observe the lower comb from both sides. Bees were trained over 2 days to a feeder that was moved in an arc around the hive. The feeder was first moved north (115 m) and then moved east along a street perpendicular to the initial flight route until a distance of 180 m was reached. The feeder was then moved along a small road decreasing distance to the hive down to 80 m (E-SE direction). From there the feeder was moved to its final destination (52.455563, 13.298462) 235 m, 135° east from north, as seen from the hive.
We created a reference dataset to validate the dance detection and decoding software by randomly selecting waggle detections from the results set after the recording period. The detections were visualized in a graphical user interface and a human observer classified the sequence of images to either correctly contain a dance or not. By dragging a line over the image the bee's orientation was manually approximated. Since we selected test data post-hoc from the results only waggle detections were reviewed. Thus, it was not possible to gauge how many dances were missed (false negative rate) or to manually define the correct dance duration (the software might have detected the waggle too late and stored only a fraction of the complete image sequence). We therefore ran the software on a set of video recordings containing waggle dances to the same feeder recorded in 2008. We reduced the image resolution to match the recording resolution of the PS3Eye. The frame rate was 100 Hz in both sources. Tracking data was available for this dataset (Landgraf et al., 2011) which was used to measure false negative rate and to evaluate dance duration and detection position accuracy.
The automatically extracted dance parameters in the training period were translated to field locations. To this end, dance duration and orientation were averaged over consecutive detections. Thus, the average waggle run was projected to the field with respect to the azimuth at the time of the first waggle run. Dances with less than four waggle detections or waggle durations smaller than 200 ms were discarded (see discussion). The obtained field locations were mapped using Matlab and cartographical material provided by OpenStreetMap.
Results
Tag Detection and Decoding
Runtime and performance
We have invested a significant amount of time in the optimization of the tag decoding software with respect to the runtime. Still, on a single processor, the image analysis takes approximately 500 times longer than real-time (86 years for the dataset at hand). The image analysis run on the supercomputer takes only 10% of the original recording time (average numbers of processors used: 1000).
We have evaluated the results of the tag detection and decoding software with respect to manually defined ground truth. All layers yield high rates in recall (how much of the ground truth could correctly be identified) and precision (how much of the software output is actually covered by ground truth data).
Up to 88% of the tags can be recognized. Only 65% of the detections can be decoded correctly for a given image recording. However, 94% of the decoded IDs have less than three misidentified bits. It is important to note that those detections are still valuable as the true ID can be retrieved via probabilistic filtering (see Section Tracking and Temporal ID Filter). As an additional way to measure the decoder's accuracy, we checked the number of misread bits on the decoded IDs. This metric known as Hamming distance (Hamming, 1950) has an average value of 0.74.
Tracking and dancer identification
We manually tracked 50 bees over a time period of 240 frames by mouse-clicking the detection that corresponds to the focal bee. The performance of the tracking algorithm was then evaluated by comparing its output to the ground truth paths.
There are two functionalities of the tracking algorithm that were validated. The core component of the tracking is the probabilistic filter we employ to integrate consecutive measurements to robustly obtain the true ID of the animal (see Section Tracking and Temporal ID Filter). The filter has to be robust against two types of errors. First, incorrect ID decodings coming from the pipeline and second, incorrect detection assignments in the tracking process. The former error has been quantified and is used in the filter (see Figure 4). The latter introduces incorrect positions and IDs to the path. Since this might not be completely avoidable, this error should not affect the outcome of the ID filter process. To investigate how robust our filter algorithm is, we introduced incorrect IDs to paths of a manually tracked animal. The paths were unfiltered, i.e., they exhibited IDs that were pairwise similar but not equal (see Section on decoder accuracy Runtime and Performance). With 10% incorrect IDs along the path, the algorithm was able to recover the correct ID after approximately 50 observations. Even when one third of the IDs are erroneous the correct ID can be obtained in most cases after approximately 100 observations (see Figure 6 for details).
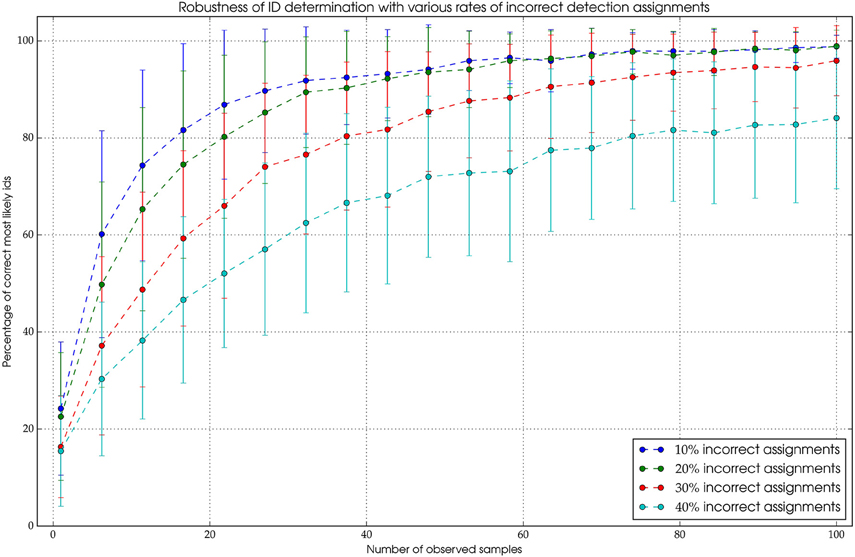
Figure 6. The mechanism is highly robust against erroneous assignments. Even when 30% of the assigned detections are originating from different bees, it's possible to extract the correct ID with a high probability after a sufficient amount of observations.
To assess the quality of the paths generated by the algorithm we compared how many detections along the ground truth path were correctly assigned to the same path. In the tracking algorithm a minimum value for the similarity of new ID and time-filtered ID along the current path has to be set. This threshold might be chosen such that only very similar detections are added. This would produce piecewise trajectories, each with high precision. By relaxing the threshold the resulting trajectories are longer but the probability that incorrect detections have been added is increased. Using a manually chosen threshold, we found that most bees (>90%) can be tracked with high precision (>99% of correctly assigned detections, see Figure 7). Note that results may vary significantly in quality depending on the activity of the focal animal (see Discussion).
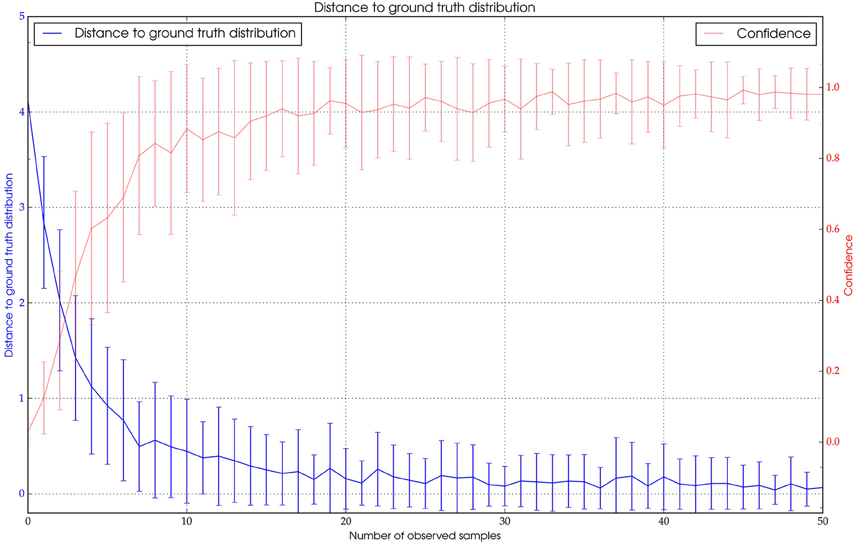
Figure 7. Blue: The distance of Pt to the expected ground truth distribution over the number of observations. Red: The confidence value of Pt.
Dance Detection and Decoding
Detection Performance
For validation, 1000 random samples were drawn from 220127 waggle run detections. Seventy-nine percent of the manually reviewed detections were dances (false positive rate is 21%). The same software produced significantly better results on high-speed videos of dances. Almost all dances could be detected (recall 96.4%) with low numbers of false detections (precision: 89.5%). This difference was likely caused by the inferior optics of the webcams.
The positional error is in both planar dimensions almost zero (mean: 0.02 mm with std: 1.7 mm).
Decoder performance
The proposed method overestimates dance duration by an average of 98 ms (std: 139 ms). The angular error of single waggle run detections is in average 1.7° and has a standard deviation of 22°. By averaging over a minimum of four waggle runs the error standard deviation decreases significantly (SD: 12°). Note that short dances due to the nature of the method are reported with higher angular error and influence the overall error. Discarding short waggle runs (< 200 ms), the angular error's standard deviation is 5°.
Dance maps
To exemplify the use cases of the waggle dance detection we have mapped all dances of foragers in a second observation hive. Figure 8 shows the endpoints of a vector obtained from averaging the duration and angle of a minimum of four consecutive waggle runs and projecting them to the field using the sun's Azimuth. On the test day, we detected 471 dances with an average of 6.75 waggle runs per dance. The average dance angle matches the expected angle derived from the feeder location almost exactly (134 and 136°, respectively). Still, dances to other directions were detected. There is notable spread around the hive, which in close range is more likely to arise from incorrect detections, since the method of extracting the dance angle is error prone in short waggle runs. It is not unlikely, however, that bees have foraged not exclusively on the artificial feeder. The spread around the feeder location is notable and matches the angular standard deviation of previously reported dances to the same location (SD: 28°, see Landgraf et al., 2011).
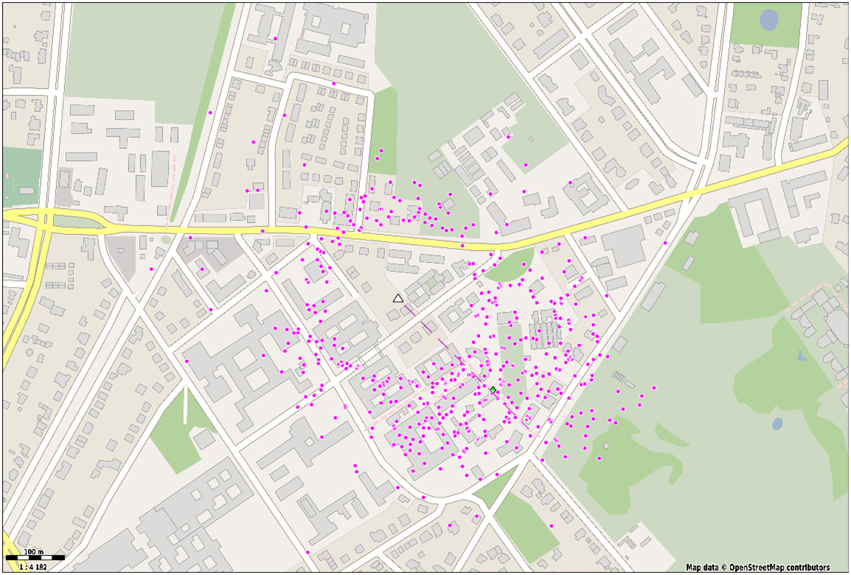
Figure 8. Dance detections (waggle duration and direction) were averaged over at least four waggle runs and translated to a field location with respect to the sun's Azimuth. A linear mapping was used to convert waggle duration to metric distance Each dot represents a waggle dance with at least four waggle runs. The hive is depicted with a white triangle. The dashed line represents the average dance direction.
Discussion
We described an automatic observation system with its respective hardware and software components for the automatic detection, identification and tracking of marked honeybees. The system can automatically detect and decode honeybee communication dances and related behaviors such as dance-following and trophallaxis. The BeesBook system is unique in its spatial and temporal resolution and its capacity to reflect the complex interplay of a few thousand individuals within the hive over large time windows.
We see potential use of our automation in many aspects of waggle dance research. Basic biological investigations have in the past been limited in scope because it was impossible to reliably track enough individual workers for long enough to create a holistic understanding of worker-worker interactions or to build up a forager profile. For example, it would be fascinating to have knowledge of foraging locations that a dancer previously communicated and to consider this information if the dancer then becomes a follower. Given that foragers relate private information (e.g., memory of a resource) to social information (Grüter et al., 2008, 2013) the BeesBook system can help to investigate this relationship. Another useful application of the proposed system would be applied investigations. A dance indicates a positive assessment and represents an integrated signal that the forage or nestsite is valuable (Seeley, 1994, 2010; Seeley and Buhrman, 2001; Couvillon et al., 2014a). Decoding and plotting many dances from an area can indicate locations of high or low interest and may even help land managers evaluate the landscape for bee sustainability and nature conservation (Couvillon et al., 2014b). Additionally, because the honey bees are “sampling” from the environment, their dances could also help with environmental risk assessment, as the products of the forage could concurrently be tested for chemicals. Being able to decode large numbers of dances could help pollination services, as beekeepers would possess very quickly an idea of when the bees are visiting a target crop.
Besides dance communication, the BeesBook system can facilitate various scientific investigations in wider contexts, such as network analysis, self-organization and the emergence of specific colony behavior. Tracking large numbers of individuals over long periods of time might reveal detailed characteristics of the network dynamics of disease spread (Naug, 2008) and collective anti-pathogen defenses (Theis et al., 2015). The distribution of pesticides in the hive or the effect of various environmental stress factors on the colony behavior and the intriguing field of division of labor (Robinson, 1992) could be observed in unprecedented detail. Network studies (Croft et al., 2008) might be applied to honeybees as well as research investigating the effect of individual differences (Réale et al., 2007) on the group behavior.
We believe the BeesBook datasets have great potential to foster a pervasive understanding of societies in general. We support interdisciplinary research and plan to grant public access to our data so that the members of the scientific community can analyze it in the context of their respective areas of interest.
Automation might enable many high impact applications, but also entails significant challenges, costs and peculiarities associated with the acquisition, storage, analysis and interpretation of “big” data. The efforts described in this paper comprise the recording and analysis of only one rather small colony. Although memory and computational costs decline exponentially and the aforementioned requirements will become affordable soon, one still might have to carefully balance reasons for using such a system.
The size of the various datasets, common network bandwidths and/or relatively low local storage capacities render the manual review of recordings and tracks a very time consuming task. Thus, most of the results obtained by either the computer vision or the post-processing software can only be trusted on the statistical level, as determined under average conditions.
While it is impractical to grant access to our raw data (due to data volume), it is much more feasible to share the post-processed data levels. This, however, would require high confidence in the correctness of the data, since there would be no way of validating the data without the image recordings. It's noteworthy that accurately validating the performance of the individual system components itself is a significant challenge. As demonstrated, the performance of the system depends on multiple factors. For example, there are days a colony may be calm, with only a small proportion of quickly moving bees. The system would be able to detect and decode most bees with high accuracy. Under certain circumstances, however, the same colony can exhibit an increased activity level with almost all bees moving very fast. The quality of the decodings will be affected significantly; the dance detection system might produce more false alarms. Other factors such as colony size play a role as well (yielding more or less occlusions). The colony state must therefore be registered and a mapping to an expected system quality level needs to be devised in order to be able to interpret and judge the data correctly.
The data levels generated by the BeesBook system are still incomplete in the proportion of correctly tracked and identified bees, but they constitute the most detailed and extensive dataset available. In order to improve accuracy and reliability, we currently enhance some of its components.
In the forthcoming season we will sustain the proportion of marked bees during the whole season by replacing capped brood combs with empty combs periodically every 3 weeks. The brood will then be incubated and newly emerging bees will be tagged and re-introduced to the hive.
The hardware components will be significantly improved. In the upcoming season we use a bigger room, what makes possible using better optics (lenses with larger focal length and a lower degree of peripheral blur). We have built a bigger scaffold with the capacity for more light sources. Hence, we will use lower exposure durations to minimize motion blur, which was the prominent cause for missing or erroneous detections.
We have identified two software components whose improvement will have a positive impact on the overall system performance. We currently test a replacement for the localizer layer based on deep convolutional networks (Krizhevsky et al., 2012) that reduces the number of false positives significantly. This enables the tracking the create trajectories with less gaps, which in turn renders the ID filter more successful.
The tracking software currently uses a greedy selection scheme. For every timestep detections are added to the path, irrespective of future information that might render this decision suboptimal. In the future we plan using a non-greedy selection scheme: In each time step up to three detections (possible continuations of the path) will be collected. All three are then traced in future frames and, in the worst case, they too are elongated with three potential candidates each (yielding nine possible tracks). In each time step, a fourth hypothesis will be incorporated, representing the possibility that the tag could not be detected. This creates a detection graph that might contain cycles (a detection in time t has at least two possible paths ending in the same location at time t + n, with n > 1). These cyclic graphs are finally pruned by deleting less probable paths (with regard to its accumulated Pt). The tracking is computationally expensive. The more layers in time the graph is allowed to have, the more numerous the possibilities and the longer the computation but also the more precise the ID assignment and the tracking will become.
While the BeesBook components already produce valuable data, convenience functions to access, integrate, compare and test the data are still in development. To exemplify the power of the data integration we have tracked a randomly selected dancer and have manually combined the available data as depicted in Figure 9. A video that shows raw image recordings zoomed in on the focal animal can be found in the Supplementary Information (Video 1).
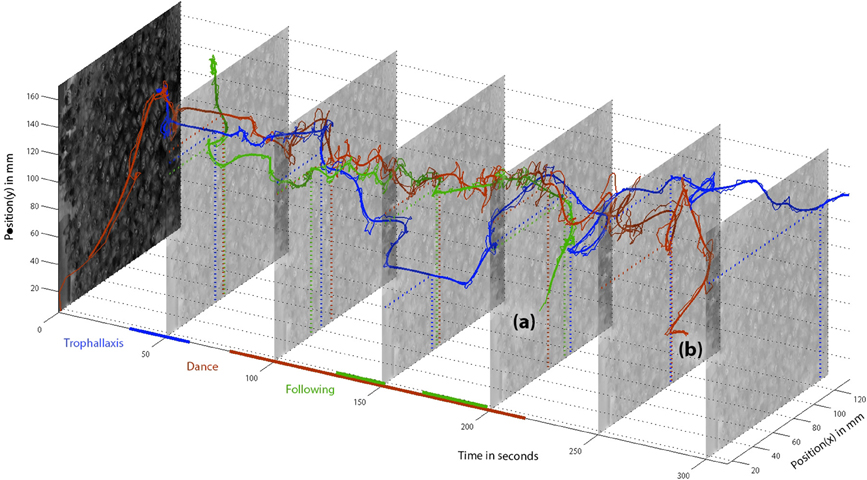
Figure 9. Positions of dancer “3007” (red), follower “2641” (green), and food receiver “3464” (blue) over time. Detected behaviors are depicted as colored lines along the time axis. The dancer was initially detected at the comb periphery, directly moves to her future dance location and engages in trophallaxis, recognizable by the blue and red parallels around t = 50 s. The food receiver stays in close contact with the dancer only shortly and leaves the dance floor. She finds another food receiver at t = 150 (again, the straight blue line segment reflects her motionlessness). The bee “2641” meets the dancer around the time of the first trophallaxis and stays in her vicinity for about a minute until she starts following. The follower leaves the dance comb (a) before the dancer does (b). Afterwards, both bees were not detected in the hive for more than 5 min. Therefore, we assume both bees left the hive.
In the upcoming months we will finish the image analysis and complete the data analysis with respect to social structures in the dance context by the end of the year. In the summer months we will record a new dataset which will be analyzed over the winter months. We hope, by that time, we will be able to grant public access to the most complete honeybee colony motion and behavior dataset, the virtual hive.
Conflict of Interest Statement
The authors declare that the research was conducted in the absence of any commercial or financial relationships that could be construed as a potential conflict of interest.
Acknowledgments
The authors thank the North-German Supercomputing Alliance (HLRN) for their generous support of the project with storage and computing resources. We are indebted to two anonymous reviewers for their valuable and extensive comments that helped improving the paper substantially. BeesBook was created by many individuals in a great team effort. The authors thank R. Deisel, B. Laubisch, L. Mielke, J. Mischek, Y. Marchenko, A. Rau, A. Saadeh, C. Tietz, S. Wichmann, and M. Ziese for their substantial contribution and support in the last years of system development. This work is funded in part by the German Academic Exchange Service (DAAD).
Supplementary Material
The Supplementary Material for this article can be found online at: https://www.frontiersin.org/article/10.3389/fevo.2015.00103
References
Al Toufailia, H., Couvillon, M., Ratnieks, F., and Grüter, C. (2013a). Honey bee waggle dance communication: signal meaning and signal noise affect dance follower behaviour. Behav. Ecol. Sociobiol. 67, 549–556. doi: 10.1007/s00265-012-1474-5
Al Toufailia, H., Grüter, C., and Ratnieks, F. L. (2013b). Persistence to unrewarding feeding locations by honeybee foragers (Apis mellifera): the effects of experience, resource profitability and season. Ethology 119, 1096–1106. doi: 10.1111/eth.12170
Beekman, M., and Ratnieks, F. L. W. (2000). Long-range foraging by the honeybee, Apis mellifera l. Funct. Ecol. 14, 490–496. doi: 10.1046/j.1365-2435.2000.00443.x
Biesmeijer, J., and Seeley, T. (2005). The use of waggle dance information by honeybees throughout their foraging careers. Behav. Ecol. Sociobiol. 59, 133–142. doi: 10.1007/s00265-005-0019-6
Bonabeau, E., Theraulaz, G., Deneubourg, J.-L., Aron, S., and Camazine, S. (1997). Self-organization in social insects. Trends Ecol. Evol. 12, 188–193. doi: 10.1016/S0169-5347(97)01048-3
Bozic, J., and Valentincic, T. (1991). Attendants and followers of honey bee waggle dances. J. Apic. Res. 30, 125–131.
Couvillon, M. J., Schürch, R., and Ratnieks, F. L. (2014a). Dancing bees communicate a foraging preference for rural lands in high-level agri-environment schemes. Curr. Biol. 24, 1212–1215. doi: 10.1016/j.cub.2014.03.072
Couvillon, M. J., Schürch, R., and Ratnieks, F. L. W. (2014b). Waggle dance distances as integrative indicators of seasonal foraging challenges. PLoS ONE 9:e93495. doi: 10.1371/journal.pone.0093495
Crailsheim, K., Brodschneider, R., Aupinel, P., Behrens, D., Genersch, E., Vollmann, J., et al. (2013). Standard methods for artificial rearing of Apis mellifera larvae. J. Apic. Res. 52:52.1.05. doi: 10.3896/IBRA.1.52.1.05
Croft, D. P., James, R., and Krause, J. (2008). Exploring Animal Social Networks. Princeton, NJ: Princeton University Press.
De Marco, R. J., Gurevitz, J. M., and Menzel, R. (2008). Variability in the encoding of spatial information by dancing bees. J. Exp. Biol. 211, 1635–1644. doi: 10.1242/jeb.013425
Fisher, R. A. (1936). The use of multiple measurements in taxonomic problems. Ann. Eugen. 7, 179–188. doi: 10.1111/j.1469-1809.1936.tb02137.x
Grüter, C., Balbuena, M. S., and Farina, W. M. (2008). Informational conflicts created by the waggle dance. Proc. Biol. Sci. 275, 1321–1327. doi: 10.1098/rspb.2008.0186
Grüter, C., and Farina, W. M. (2009). The honeybee waggle dance: can we follow the steps? Trends Ecol. Evol. 24, 242–247. doi: 10.1016/j.tree.2008.12.007
Grüter, C., and Ratnieks, F. L. (2011). Honeybee foragers increase the use of waggle dance information when private information becomes unrewarding. Anim. Behav. 81, 949–954. doi: 10.1016/j.anbehav.2011.01.014
Grüter, C., Segers, F. H. D., and Ratnieks, F. L. (2013). Social learning strategies in honeybee foragers: do the costs of using private information affect the use of social information? Anim. Behav. 85, 1443–1449. doi: 10.1016/j.anbehav.2013.03.041
Hamming, R. W. (1950). Error detecting and error correcting codes. Bell Syst. Tech. J. 29, 147–160. doi: 10.1002/j.1538-7305.1950.tb00463.x
Hölldobler, B., and Wilson, E. (2009). The Superorganism: The Beauty, Elegance, and Strangeness of Insect Societies. New York, NY: W. W. Norton & Company, Inc.
Hotelling, H. (1933). Analysis of a complex of statistical variables into principal components. J. Educ. Psychol. 24, 417–441, 498–520. doi: 10.1037/h0071325
Huffman, D. (1952). A method for the construction of minimum-redundancy codes. Proc. IRE 40, 1098–1101. doi: 10.1109/JRPROC.1952.273898
Kimura, T., Ohashi, M., Crailsheim, K., Schmickl, T., Okada, R., Radspieler, G., et al. (2014). Development of a new method to track multiple honey bees with complex behaviors on a flat laboratory arena. PLoS ONE 9:e84656. doi: 10.1371/journal.pone.0084656
Kimura, T., Ohashi, M., Okada, R., and Ikeno, H. (2011). A new approach for the simultaneous tracking of multiple honeybees for analysis of hive behavior. Apidologie 42, 607–617. doi: 10.1007/s13592-011-0060-6
Kirchner, W. (1994). Hearing in honeybees: the mechanical response of the bee's antenna to near field sound. J. Comp. Physiol. A 175, 261–265. doi: 10.1007/bf00192985
Krizhevsky, A., Sutskever, I., and Hinton, G. E. (2012). “Imagenet classification with deep convolutional neural networks,” in Advances in Neural Information Processing Systems, eds F. Pereira, C. J. C. Burges, L. Bottou, and K. Q. Weinberger (Lake Tahoe: Curran Associates, Inc.), 1097–1105.
Landgraf, T., and Rojas, R. (2007). Tracking Honey Bee Dances From Sparse Optical Flow Fields. Berlin: Free University Berlin.
Landgraf, T., Rojas, R., Nguyen, H., Kriegel, F., and Stettin, K. (2011). Analysis of the waggle dance motion of honeybees for the design of a biomimetic honeybee robot. PLoS ONE 6:e21354. doi: 10.1371/journal.pone.0021354
Martinez-Cantin, R. (2014). BayesOpt: a bayesian optimization library for nonlinear optimization, experimental design and bandits. J. Mach. Learn. Res. 15, 3735–3739.
Menzel, R., Kirbach, A., Haass, W.-D., Fischer, B., Fuchs, J., Koblofsky, M., et al. (2011). A common frame of reference for learned and communicated vectors in honeybee navigation. Curr. Biol. 21, 645–650. doi: 10.1016/j.cub.2011.02.039
Mersch, D. P., Crespi, A., and Keller, L. (2013). Tracking individuals shows spatial fidelity is a key regulator of ant social organization. Science 340, 1090–1093. doi: 10.1126/science.1234316
Naug, D. (2008). Structure of the social network and its influence on transmission dynamics in a honeybee colony. Behav. Ecol. Sociobiol. 62, 1719–1725. doi: 10.1007/s00265-008-0600-x
Nieh, J. (1993). The stop signal of honey bees: reconsidering its message. Behav. Ecol. Sociobiol. 33, 51–56. doi: 10.1007/BF00164346
Nieh, J. C. (2010). A negative feedback signal that is triggered by peril curbs honey bee recruitment. Curr. Biol. 20, 310–315. doi: 10.1016/j.cub.2009.12.060
Noldus, L., Spink, A., and Tegelenbosch, R. (2001). Ethovision: a versatile video tracking system for automation of behavioral experiments. Behav. Res. Methods Instrum. Comput. 33, 398–414. doi: 10.3758/BF03195394
Pastor, K. A., and Seeley, T. D. (2005). The brief piping signal of the honey bee: begging call or stop signal? Ethology 111, 775–784. doi: 10.1111/j.1439-0310.2005.01116.x
Pérez-Escudero, A., Vicente-Page, J., Hinz, R. C., Arganda, S., and de Polavieja, G. G. (2014). idTracker: tracking individuals in a group by automatic identification of unmarked animals. Nat. Methods 11, 743–748. doi: 10.1038/nmeth.2994
Réale, D., Reader, S. M., Sol, D., McDougall, P. T., and Dingemanse, N. J. (2007). Integrating animal temperament within ecology and evolution. Biol. Rev. 82, 291–318. doi: 10.1111/j.1469-185X.2007.00010.x
Riley, J. R., Greggers, U., Smith, A. D., Reynolds, D. R., and Menzel, R. (2005). The flight paths of honeybees recruited by the waggle dance. Nature 435, 205–207. doi: 10.1038/nature03526
Robinson, G. E. (1992). Regulation of division of labor in insect societies. Annu. Rev. Entomol. 37, 637–665. doi: 10.1146/annurev.en.37.010192.003225
Seeley, T. (1994). Honey bee foragers as sensory units of their colonies. Behav. Ecol. Sociobiol. 34, 51–62. doi: 10.1007/BF00175458
Seeley, T., Camazine, S., and Sneyd, J. (1991). Collective decision-making in honey bees: how colonies choose among nectar sources. Behav. Ecol. Sociobiol. 28, 277–290. doi: 10.1007/bf00175101
Seeley, T. D., and Buhrman, S. C. (2001). Nest-site selection in honey bees: how well do swarms implement the “best-of-n” decision rule? Behav. Ecol. Sociobiol. 49, 416–427. doi: 10.1007/s002650000299
Seeley, T. D., Mikheyev, A. S., and Pagano, G. J. (2000). Dancing bees tune both duration and rate of waggle-run production in relation to nectar-source profitability. J. Comp. Physiol. A 186, 813–819. doi: 10.1007/s003590000134
Seeley, T. D., Visscher, P. K., Schlegel, T., Hogan, P. M., Franks, N. R., and Marshall, J. A. R. (2012). Stop signals provide cross inhibition in collective decision-making by honeybee swarms. Science 335, 108–111. doi: 10.1126/science.1210361
Serra, J. (1986). Introduction to mathematical morphology. Comput. Vision Graph. Image Process. 35, 283–305. doi: 10.1016/0734-189X(86)90002-2
Steffan-Dewenter, I., and Kuhn, A. (2003). Honeybee foraging in differentially structured landscapes. Proc. Biol. Sci. 270, 569–575. doi: 10.1098/rspb.2002.2292
Tanner, D., and Visscher, P. (2010). Adaptation or constraint? Reference dependent scatter in honey bee dances. Behav. Ecol. Sociobiol. 64, 1081–1086. doi: 10.1007/s00265-010-0922-3
Theis, F. J., Ugelvig, L. V., Marr, C., and Cremer, S. (2015). Opposing effects of allogrooming on disease transmission in ant societies. Philos. Trans. R. Soc. Lond. B Biol. Sci. 370:20140108. doi: 10.1098/rstb.2014.0108
Visscher, P. K., and Seeley, T. D. (1982). Foraging strategy of honeybee colonies in a temperate deciduous forest. Ecology 63, 1790–1801. doi: 10.2307/1940121
Von Frisch, K. (1965). Tanzsprache und Orientierung der Bienen. Berlin; Heidelberg: Springer-Verlag.
Waddington, K., Herbert, T., Visscher, P., and Richter, M. (1994). Comparisons of forager distributions from matched honey bee colonies in suburban environments. Behav. Ecol. Sociobiol. 35, 423–429.
Weidenmüller, A., and Seeley, T. D. (1999). Imprecision in waggle dances of the honeybee (Apis mellifera) for nearby food sources: error or adaptation? Behav. Ecol. Sociobiol. 46, 190–199. doi: 10.1007/s002650050609
Keywords: waggle dance, honeybee, animal behavior, animal tracking, computer vision
Citation: Wario F, Wild B, Couvillon MJ, Rojas R and Landgraf T (2015) Automatic methods for long-term tracking and the detection and decoding of communication dances in honeybees. Front. Ecol. Evol. 3:103. doi: 10.3389/fevo.2015.00103
Received: 01 May 2015; Accepted: 20 August 2015;
Published: 25 September 2015.
Edited by:
Peter Schausberger, University of Natural Resources and Life Sciences Vienna, AustriaReviewed by:
Shawn M. Wilder, Oklahoma State University, USAStephan Wolf, Queen Mary University London, UK
Copyright © 2015 Wario, Wild, Couvillon, Rojas and Landgraf. This is an open-access article distributed under the terms of the Creative Commons Attribution License (CC BY). The use, distribution or reproduction in other forums is permitted, provided the original author(s) or licensor are credited and that the original publication in this journal is cited, in accordance with accepted academic practice. No use, distribution or reproduction is permitted which does not comply with these terms.
*Correspondence: Tim Landgraf, FB Mathematik und Informatik, Institut für Informatik, Freie Universität Berlin, Arnimallee 7, 14195 Berlin, Germany, tim.landgraf@fu-berlin.de
†These authors have contributed equally to this work.