Thermal Characterization of European Ant Communities Along Thermal Gradients and Its Implications for Community Resilience to Temperature Variability
 Xavier Arnan
 Nico Blüthgen
 Roberto Molowny-Horas
 Javier Retana3,4
- 1Departamento de Botânica, Universidade Federal de Pernambuco, Recife, Brazil
- 2Faculty of Biology, Technische Universität Darmstadt, Darmstadt, Germany
- 3CREAF, Cerdanyola del Vallès, Spain
- 4Univ Autònoma Barcelona, Cerdanyola del Vallès, Spain
Ecologists are increasingly concerned about how climate change will affect biodiversity yet have mostly addressed the issue at the species level. Here, we present a novel framework that accounts for the full range and complementarity of thermal responses present in a community; it may help reveal how biological communities will respond to climatic (i.e., thermal) variability. First, we characterized the thermal niches of 147 ant species from 342 communities found along broad temperature gradients in western Europe. Within each community, species' mean thermal breadth and the difference among species' thermal optima (thermal complementarity) were considered to define community thermal niche breadth—our proxy for community thermal resilience. The greater the range of thermal responses and their complementarity within a community, the greater the likelihood that the community could cope with novel conditions. Second, we used simulations to calculate how robust community thermal resilience was to random species extinctions. Community resilience was considered to be robust when random species extinctions largely failed to constrict initial community thermal breadth. Our results indicate that community thermal resilience was negatively and positively correlated with mean temperature and temperature seasonality, respectively. The pattern was reversed for robustness. While species richness did not directly affect community resilience to thermal variability, it did have a strong indirect effect because it determined community resilience robustness. Consequently, communities in warm, aseasonal regions are the most vulnerable to temperature variability, despite their greater number of species and resultant greater resilience robustness.
Introduction
The increase of 3.5°C in the Earth's mean temperature predicted to occur by 2100 (IPCC, 2013) will inevitably have tremendous consequences for species' distributions (e.g., Parmesan et al., 1999; Deutsch et al., 2008; Markovic et al., 2014). It will also ultimately affect biodiversity (Parmesan et al., 1999; Bellard et al., 2012; Peñuelas et al., 2013; Staudinger et al., 2013) and its associated ecosystem services (Díaz et al., 2005; Hooper et al., 2005; Balvanera et al., 2006; Cardinale et al., 2012). Although several studies have attempted to be proactive in predicting the effects of climate change on biodiversity, they have mainly adopted a species-level perspective (Mokany and Ferrier, 2011; Bellard et al., 2012). However, a community-centered perspective is crucial to understanding the consequences of climate change on biodiversity and its associated ecosystem services. This is because species do not usually live in isolation; instead, they form communities where they interact with each other, and often species respond to environmental changes as a group. More recently, several studies have examined community responses to climate change (Devictor et al., 2008; Kampichler et al., 2012; Lindström et al., 2013; Jarzyna et al., 2015; Nieto-Sánchez et al., 2015; Princé and Zuckerberg, 2015); nonetheless, our understanding of how climate change affects community-level biodiversity remains incomplete. Moreover, previous studies have focused on the alarming expected increase in global mean temperature. However, climate change is also predicted to result in increasingly variable conditions (Schär et al., 2004) and a higher frequency of extreme weather events whose consequences for communities may be more dramatic than those engendered by a simple shift in average conditions (Jentsch et al., 2009).
To deal with both variability in future climatic conditions in general and with shifts in thermal conditions in particular, it may be useful to assess community resilience to climatic variability. This could be accomplished by characterizing the full range of a community's thermal responses, which may have important implications for community persistence under future climatic conditions. As for species (Jiguet et al., 2006; Buckley and Kingsolver, 2012; Huey et al., 2012), communities with a greater range of climatic responses have a higher probability of being able to cope with new conditions. A species' thermal niche is defined by its thermal optimum and breadth (Figure 1A). A community's thermal niche is defined by using the combined individual niches of the species that coexist therein (Figure 1b1) to determine the community's thermal optimum and breadth (Figure 1b2). According to Kühsel and Blüthgen (2015), the range of thermal responses within a community (i.e., community thermal breadth) may be calculated using the mean thermal breadths of species within the community (Figure 1c1) and their complementarity (i.e., the differences among the species' thermal optima) (Figure 1c2). Some authors have suggested that niche complementarity may help buffer ecosystem processes against climatic fluctuations (Tilman, 1996; Doak et al., 1998). Specifically, thermal complementarity explains the diversity of thermal responses found within communities (Figure 1c2), which is also referred to as “response diversity.” Response diversity is the interspecific variability in response traits for species that perform particular ecosystem functions; it has been proposed to be an important stabilizing mechanism that may also be a key determinant of ecosystem resilience in the face of anthropogenic disturbance and environmental uncertainty (Elmqvist et al., 2003; Laliberté et al., 2010; Cariveau et al., 2013; Mori et al., 2013). Ecosystem resilience is defined as the maintenance of desirable conditions through the capacity of a system to respond to environmental changes so as to retain fundamental functionality (Mori et al., 2013). Indeed, our approach of resilience does not directly translate to a particular ecosystem function but to a taxonomically defined community.
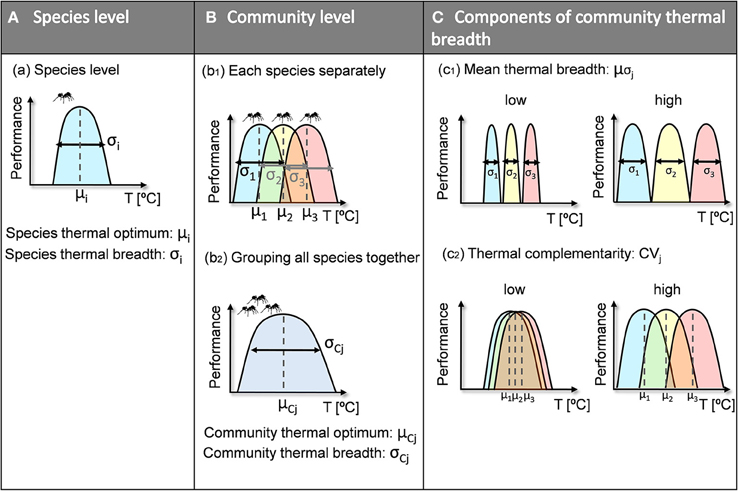
Figure 1. Conceptual framework of species- and community-level thermal niches. The thermal niche of a given species (A) is characterized by the species' thermal optimum (μi) and the species' thermal breadth (σi). The thermal niche of a given community (B) is defined by the individual thermal niches of the species it contains (b1). After all its species have been grouped together (b2), the community thermal niche is characterized by its thermal optimum (μCj) and thermal breadth (σCj). We chose community thermal breadth (C) as our measure of community thermal resilience, and it is composed of (c1) mean thermal breadth (μσj) and (c2) thermal complementarity (CVj). An increase in either of the two indices therefore increases community thermal breadth.
Complementarity can be defined in one of two ways: (1) as variation in thermal optima or (2) as thermal overlap. In this study, we used the former definition, which means that thermal complementarity and mean thermal breadth are theoretically independent components of community thermal breadth. Thus, both factors help increase community thermal breadth, i.e., community thermal resilience. Consequently, a continuous gradient of community thermal resilience can be established—from weakly to highly resilient communities—where resilience is determined by both the mean thermal breadth and the thermal complementarity of species within the community (Figure 2). At one extreme of the gradient are communities with high levels of both thermal complementarity (i.e., high diversity of thermal optima) and mean thermal breadth (i.e., high range of thermal tolerance), whose resilience to climatic variability will be the greatest (Figure 2, right side). At the other extreme are the most vulnerable communities, which are characterized by low thermal complementarity and low mean thermal breadth (Figure 2, left side).
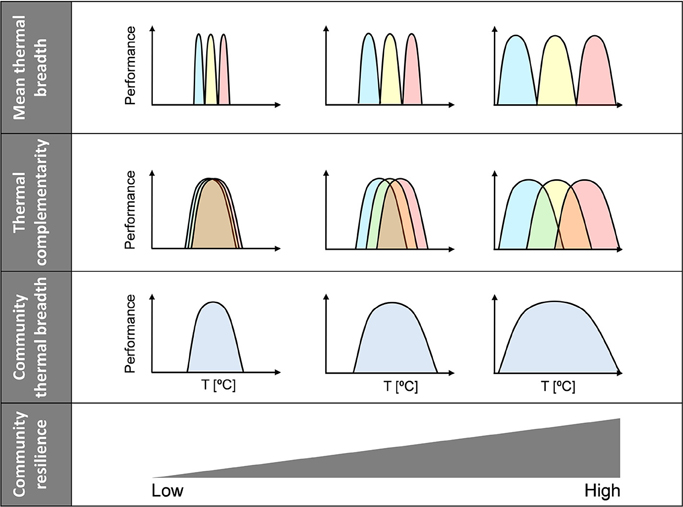
Figure 2. Community resilience scenarios. Relationships between community thermal resilience and community thermal breadth, mean thermal breadth, and thermal complementarity. Communities have been simplified to include three species and only extreme scenarios are depicted; note, however, that there might be a continuum of community resilience. Community thermal breadth increases from left to right because both mean thermal breadth and thermal complementarity increase.
Using this conceptual framework, and drawing on two macroecological hypotheses regarding species-specific thermal responses, we can predict the thermal resilience of communities along climatic gradients. The thermal adaptation hypothesis (Kaspari et al., 2015) states that species occurring in warmer areas are living closer to their thermal limits and display narrower thermal tolerances (Deutsch et al., 2008; Huey et al., 2009; Sunday et al., 2011). This hypothesis is based on two different general findings. First, in species, there is usually a positive correlation between upper and lower thermal limits (Angilletta, 2009), as a consequence of trade-offs between the adaptations that lower thermal limits and those that raise them (Hazel, 1995; Pörtner, 2001; Hochachka and Somero, 2002). Second, the mechanisms to deal with thermal limits are costly (Angilletta, 2009). Therefore, in warm areas, most species are packed into the upper part of the thermal space and therefore have high thermal optima. Because the costs of maintaining thermal tolerance to high temperatures do not allow species to invest in thermal tolerance to low temperatures, species will display low thermal breadth and low thermal complementarity, which should decrease community thermal breadth. According to the climatic variability hypothesis (Stevens, 1989), species occurring in more variable climates should have broader thermal tolerances (e.g., Addo-Bediako et al., 2000; Quintero and Wiens, 2013; Khaliq et al., 2014). Support for this hypothesis comes from a variety of taxonomic groups—both endotherms and ectotherms—found along climatic and latitudinal gradients (e.g., Addo-Bediako et al., 2000; Quintero and Wiens, 2013; Khaliq et al., 2014). This hypothesis implies that communities from regions with high thermal seasonality should display high mean thermal breadth. Communities in seasonal areas might also comprise a mixture of species of different origins that have experienced selection for different optimal conditions; consequently, such communities should also have high thermal complementarity. It follows that such communities should be the most resilient to the effects of climatic variability, the same way species are (Deutsch et al., 2008; Sunday et al., 2011). Overall, this suggests that community resilience to climatic variability should be higher in colder and more seasonal regions than in warmer and less seasonal regions.
However, these patterns might be masked by biodiversity, which may play a central role in ecosystem resilience in the face of change (e.g., Peterson et al., 1998; Tilman et al., 2006; Naeem et al., 2009). This is because species diversity often provides insurance against losses of single species (the insurance hypothesis; Hooper et al., 2005); species losses may result from climatic unpredictability or other types of disturbance or stochasticity. Thus, we predict that a positive relationship exists between species richness and the robustness of resilience (defined here as the persistence of a system characteristic, i.e., resilience, following a disturbance event) to species extinctions. If so, and given that species richness usually increases with temperature and aseasonality (e.g., Gaston, 2000; Dunn et al., 2009), we might expect community thermal resilience to be more vulnerable to species extinctions in regions where resilience is predicted to be greater, i.e., in colder and less thermally stable regions where species richness is the lowest. The future of these communities may therefore be at stake if diversity is not well preserved.
In this study, we present a novel conceptual framework for testing the ability of biotic communities to face variable thermal conditions along broad thermal gradients. In contrast to most recent studies exploring community-level thermal responses to climate change (Devictor et al., 2008; Kampichler et al., 2012; Nieto-Sánchez et al., 2015; Princé and Zuckerberg, 2015), our study addresses the full range of species-specific thermal responses present within communities rather than focusing exclusively on each species' thermal optimum. To develop this framework, we used ants (family Formicidae), which are an ideal study system in this context because they are geographically widespread, ecologically diverse, and one of the most abundant invertebrate groups in terrestrial ecosystems (Hölldobler and Wilson, 1990). First, using species climate envelopes, we characterized the thermal niches of 147 European ant species in 342 ant communities located across western Europe, thus covering a large latitudinal range. These communities encompass a wide range of thermal conditions and a high degree of species richness; the combined pool of species demonstrates greatly contrasting thermal responses. Second, we studied community-level changes in thermal niches along temperature gradients, namely gradients in mean annual temperature and temperature seasonality. We aimed to test two hypotheses. The first is that community thermal breadth (i.e., community thermal resilience) tracks climatic gradients, such that breadth is greatest in the coldest and most thermally seasonal regions. This pattern is predicted to result because thermal complementarity and mean thermal breadth should decrease along the mean annual temperature gradient but increase along the temperature seasonality gradient. The second is that the robustness of community resilience to species extinctions should be the lowest in regions where community resilience is highest. Note that our approach is based on the analyses of species climate niches, which in ants are strongly predicted by thermal physiological constraints (Arnan and Blüthgen, 2015).
Materials and Methods
Community and Species Data
We assembled species composition data from 342 local ant communities in western Europe, which represented coastal to continental climates. Our database includes primary data collected during the authors' own field work and data derived from an exhaustive search of the scientific literature. We only considered studies that contained species abundance or presence-absence data from single locations. These communities comprised a total of 147 ant species, belonging to 29 genera and 5 subfamilies. We focused our analyses on presence-absence data because they are more comparable among sites than abundance data, which tend to be measured in different ways (Arnan et al., 2014).
We gathered data on species records found on three large-scale websites that provide ant distribution maps (a site for Palaearctic and Macaronesian ants, http://www.formicidae.org; AntWiki, http://www.antwiki.org; and Ant Web, http://www.antweb.org). Using these records, between 10 and 758 observations were obtained for the 147 species studied (the average was 135 observations).
Climatic information for sites and species locations (from 1950 to 2000) was obtained from the WORLDCLIM database (http://www.worldclim.org/bioclim) using rasters with the highest available resolution (30 arc-s). Sites were classified according to their position along two temperature-related climatic gradients: the mean annual temperature gradient (MAT,°C) and the temperature seasonality gradient (TS, standard deviation of the MAT). Species thermal niches were characterized using the MAT values from the species records. We used means instead of, say, maxima and/or minima to avoid errors in the climatic measurements within some of the species' ranges (particularly the larger ranges; Gouveia et al., 2014). We obtained species climatic data from actual known localities rather than from predicted geographic distributions based on species distribution modeling.
Thermal Niches
To calculate the community thermal niche indices, we first characterized the species' thermal niches using two indices. It was assumed that the niches were well described by the mean and standard deviation of the thermal conditions in which the species occur. Species thermal niches often follow a Gaussian distribution (Huey and Kingsolver, 1993), which was also true of the niches of the subset of ant species used in this study (Arnan and Blüthgen, 2015). We calculated the following two species-level indices, which are illustrated in Figure 1A.
(1) The species thermal optimum (μi) for a species i was the mean of all the available MAT values for that species and was calculated as follows:
where index k was determined for the ni localities where species i had been observed.
(2) Species thermal breadth (σi) was the standard deviation of those MAT values and was determined using the following equation:
We then calculated the four following indices that characterized community-level thermal space (Figures 1B,C).
(1) The community thermal optimum μCj was defined as the mean of the observed MAT values for all the species present in a community j and represents the position of a given community in thermal space. It was calculated as follows:
where represents the total number of MAT records for the combined set of all species and sj (lowercase) is the set of species found in community j.
(2) Community thermal breadth σCj was defined as the standard deviation of all the observed MAT values for all the species present in a community j. It was calculated using the following equation:
This index σCj accounts for the size (i.e., range) of the thermal space occupied by ant species from a given community and was used as an estimate of community thermal resilience. Note that for both σCj and μCj, species are implicitly weighted by their number of occurrences, such that widely distributed species contribute more strongly to the overall distribution of MAT values.
(3) Thermal complementarity CVj was defined as the coefficient of variation of the thermal optima of a community's species and was calculated as follows:
where Sj (uppercase) is the total number of species in a community j (i.e., the ordinal of the set sj) and μj is the mean thermal optimum of that same community, which was calculated as follows:
This index CVj represents the diversity of thermal responses within a community j. (4) Mean thermal breadth μσj was defined as the mean thermal breadth of the species in a community j and was calculated as follows:
In theory, two factors can increase community thermal breadth: higher thermal complementarity and higher mean niche breadth (σCj = CVj × μσj). Thermal complementarity and mean thermal breadth are independent here because temperature has lower and upper limits.
Robustness Simulations
We also quantified the robustness of community thermal resilience (i.e., community thermal breadth) to random species extinctions. We considered that a community's resilience was robust when initial community thermal breadth tended to be maintained in spite of species extinctions. We used simulations in which we performed stepwise calculations of community thermal breadth per site, as we proceeded to remove one random species at a time until only one species was left. We carried out a total of 1000 such simulations. Note that the initial value for community thermal breadth was that of the original community (i.e., no species removed) and that the final value was the mean thermal breadth of the last remaining species (when all but one species had been removed). The relationship between mean community thermal breadth (out of the 1000 simulations) and the number of species removed (r) was then fitted to a geometrically declining function (Supplementary Appendix 1):
where σ0 corresponds to initial community thermal breadth, and a and b are parameters that needed to be fitted to the simulated decay curve. For the entire community (no species removed; r = 0, σCj (r = 0) = σ0). The curve described by σCj(r) has a slightly negative slope at small values of r but begins to drop more steeply at higher values. This approach satisfactorily estimated most of the simulation curves (mean of R2 = 0.987, range of R2 = 0.81–1).
To estimate the robustness of community thermal breadth to random species extinctions, we computed a tolerance index, Thalf, j. It was defined as the proportion of the initial species pool in a community j that would have to be removed to decrease community thermal breadth to halfway between its minimum and maximum. It is described by the following equation:
where σSj−1 is the thermal breadth after all but one species have been removed (for more details, see Supplementary Appendix 1). Low values of Thalf, j indicate that losing just a small proportion of the species pool can produce a strong decline in community thermal breadth (low robustness), whereas high values of Thalf, j indicate that a large proportion of the species pool must be lost to strongly decrease community thermal breadth (high robustness). Tolerance was calculated in relative terms to make it independent of the initial value of community thermal breadth and the size of the community species pool, thus allowing for comparisons among communities.
Statistical Modeling
First, we analyzed the relationships among the community thermal indices and the relationship between the indices and species richness by carrying out generalized least squares (GLS) models in R (R Development Core Team., 2014). These models can be used to account for correlated errors, such as those that result from spatial autocorrelation. To identify the optimal spatial correlation structure, we conducted model comparison using AIC; inspection of the residuals indicated that spatial effects could be almost entirely removed from all our models. Thermal complementarity and tolerance were arcsin transformed and species richness was natural log transformed to ensure residual normality.
Second, we carried out GLS models to analyze the relationships between the community thermal indices (community thermal breadth, thermal complementarity, mean species breadth, community thermal optimum, and tolerance) and the two temperature gradients (MAT and TS). Separate models were performed to relate each index to each gradient. To ensure that patterns along the temperature gradients were not random and/or mediated by variation in species richness, we used a simulation approach to create null distributions of expected thermal niche indices per plot. Specifically, we generated random communities by, first, fixing the number of species per community to the observed value and then drawing species at random from the entire species pool. The relationships between the mean index values obtained from the 100 simulations per plot and the temperature gradients were analyzed using GLS models, as above.
Results
Ant communities comprised 4–37 ant species (mean ± sd: 12.0 ± 6.6). First, we characterized the thermal niches of these species. Species thermal optima ranged from 4.17 (Formica uralensis) to 17.92°C (Cardiocondyla mauritanica) (12.48 ± 3.02), and species thermal breadth ranged from 0.23 (Cataglyphis floricola) to 4.66°C (Hypoponera punctatissima) (2.72 ± 0.73). Using the information for all the species within a community, we calculated the community-level thermal indices. Community thermal optima ranged from 7.71 to 15.34°C (13.13 ± 1.64), and community thermal breadth ranged from 2.36 to 4.85°C (3.40 ± 0.60). Thermal complementarity was between 0.02 and 0.42 (0.14 ± 0.08); mean thermal breadth was between 1.86 and 3.96°C (2.99 ± 0.45); and tolerance was between 0.40 and 0.93 (0.77 ± 0.11).
We then analyzed the relationships among the different community thermal indices (Supplementary Table 1, Supplementary Figure 1). Thermal complementarity (p < 0.0001, R2 = 0.83) and mean thermal breadth (p < 0.0001, R2 = 0.81) strongly explained variation in community thermal breadth (i.e., thermal resilience): the higher the value of one of these two indices, the higher a community's thermal breadth. The product of thermal complementarity and mean thermal breadth explained variation in community thermal breadth even better (R2 = 0.90), underscoring their synergistic effect. Thermal complementarity and mean thermal breadth were not strongly related (R2 = 0.55). Taken together, all these results lend support to our theoretical framework, in which we view thermal complementarity and mean thermal breadth as the two components that make up community thermal breadth (Figure 1). Tolerance, our measure of the robustness of community resilience to random species extinctions, was negatively related to thermal complementarity (p < 0.0001, R2 = 0.05) and mean thermal breadth (p < 0.0001, R2 = 0.14), as well as to community thermal breadth (p < 0.0001, R2 = 0.11) (Supplementary Table 1, Supplementary Figure 2). More generally speaking, tolerance and community thermal breadth were independent or complementary (low R2-values). However, the communities most resilient to climatic variability were, in turn, those communities whose resilience was less robust to species extinctions; their vulnerability seemed to be more influenced by mean thermal breadth rather than by thermal complementarity. Community thermal optima were strongly negatively related to community thermal breadth (p < 0.0001, R2 = 0.81), thermal complementarity (p < 0.0001, R2 = 0.67), and mean thermal breadth (p < 0.0001, R2 = 0.69), but weakly positively related to tolerance (p < 0.0001, R2 = 0.11) (Supplementary Table 1, Supplementary Figure 3).
Species richness was weakly negatively related to community thermal breadth (p = 0.0013, R2 = 0.06), thermal complementarity (p = 0.024, R2 = 0.02), and mean thermal breadth (p < 0.0001, R2 = 0.13). Community thermal optima were also weakly but positively related to species richness (p = 0.0001, R2 = 0.06). In our calculations, tolerance was assumed to be independent of species richness (since it involves the proportion of species lost); however, species richness nonetheless had a strong positive influence (p < 0.0001, R2 = 0.72) (Supplementary Table 1, Supplementary Figure 4).
Community thermal breadth, thermal complementarity, mean thermal breadth, community thermal optima, and tolerance were significantly related to the temperature gradients (Table 1). In agreement with the thermal adaptation hypothesis, we found that thermal complementarity and mean thermal breadth, and consequently community thermal breadth, were strongly negatively related to MAT (Figure 3). In contrast, community thermal optima were strongly and positively related to MAT. In agreement with the climatic variability hypothesis, we found that thermal complementarity and mean thermal breadth, as well as community thermal breadth, increased along the TS gradient (Figure 3). Taken altogether, these results indicate that ant communities in colder, more seasonal regions should best be able to respond to the climatic variability associated with climate change. However, tolerance was positively related to MAT, but negatively related to TS (Figure 4). Consequently, the communities with higher thermal resilience were also those whose resilience was less robust to random species extinctions.
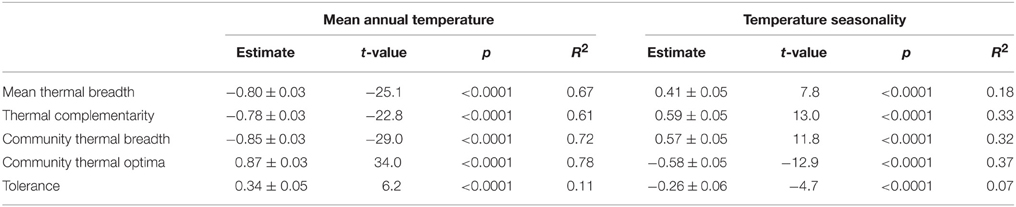
Table 1. Statistical output for the generalized least squares models of the effects of the temperature gradients on community thermal breadth, thermal complementarity, mean thermal breadth, community thermal optima, and tolerance.
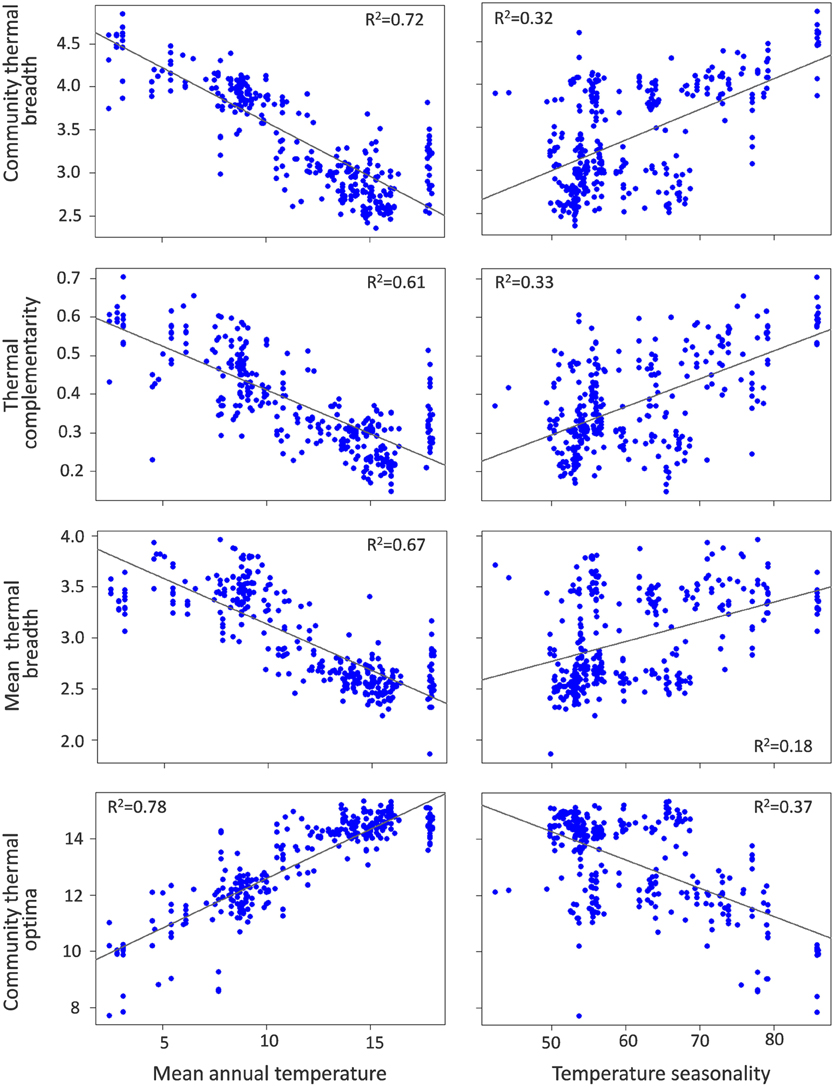
Figure 3. Relationships of community thermal breadth, thermal complementarity (arcsin transformed), and mean thermal breadth with mean annual temperature (MAT,°C) and temperature seasonality (TS, standard deviation of MAT).
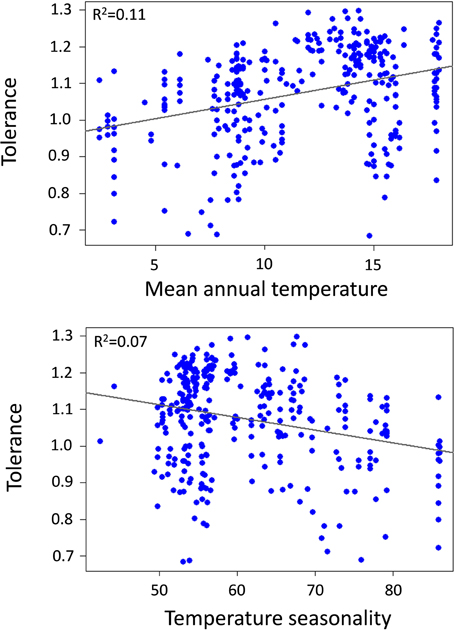
Figure 4. Relationship between tolerance (arcsin transformed) and mean annual temperature (MAT,°C) and temperature seasonality (TS, standard deviation of MAT).
The relationship between species richness and the temperature gradients was significant, but very weak (species richness vs. MAT: p = 0.0001, R2 = 0.05; species richness vs. TS: p = 0.048, R2 = 0.02; Supplementary Table 1). This finding suggests that species richness may have a very limited impact on the relationships between the community thermal indices and the temperature gradients. We also analyzed the relationships between the community thermal indices derived from our simulated communities and the temperature gradients. Unlike for the actual communities, most of the results for the simulated communities were not significant (Supplementary Table 2). When they were, the slopes and R2-values were much lower. However, the actual and simulated communities showed similar changes in tolerance along the temperature gradients (comparable slopes and R2-values). This finding suggests that variation in species richness was not important for the thermal resilience of ant communities, but did make a community's resilience more robust to random species extinctions, which confirms the relationship we observed between tolerance and species richness (see above).
Discussion
There is an urgent need for new approaches that can predict the impacts of climate change at the community level (Mokany and Ferrier, 2011; Bellard et al., 2012). In this study, we present a novel conceptual framework that can be used to test the ability of biotic communities to deal with the increasing variable thermal conditions and extreme weather events associated with climate change. This framework utilizes the full range of thermal responses shown by communities, as well as response complementarity. As far as we know, this is the first time a test of community thermal resilience to climatic variability along broad thermal gradients has been proposed. Our results provide strong support for the hypothesis that community thermal breadth (our measure of community thermal resilience) in western European ant communities is much lower in warmer, less seasonal regions, which in turn implies that these regions are the most vulnerable to climatic variability. As of yet, central and eastern Europe are experiencing the greatest increases in interannual climatic variation (Schär et al., 2004; IPCC, 2013), but fortunately the regions' low temperatures and high seasonality also make them the most resilient. Our results are supported by recent research. For instance, Princé and Zuckerberg (2015) analyzed the changes that took place over a 22-year period in winter bird communities in North America, and they found that bird communities at southern latitudes were the most affected by climatic variability. Jarzyna et al. (2015) found that bird communities in fragmented landscapes are less vulnerable to climate change than communities found in homogenous habitats, probably due to the fact that they are comprised of species with wider thermal niches and are less susceptible to shifts in climatic variability.
We found that community thermal breadth depends on, independently, both mean thermal breadth (i.e., the average of the species-specific thermal responses found in a community) and community thermal complementarity (i.e., the complementarity of those species-specific thermal responses). Indeed, both variables explained a large proportion of the variance in community thermal resilience, and the product of the two variables had even greater explanatory power. The implications of these results are 2-fold. First, community niche complementarity values clearly reflect response diversity, which is the variation in species-specific (thermal) responses to environmental change in a particular community (Mori et al., 2013). Response diversity is a key component of ecosystem resilience to anthropogenic pressures and environmental variability (e.g., Elmqvist et al., 2003; Cariveau et al., 2013; Mori et al., 2013). Second, broader thermal niches are associated with a higher probability of species persistence under new climatic conditions (Buckley and Kingsolver, 2012; Huey et al., 2012). Taken together, these findings indicate that communities with greater thermal complementarity and thermal breadth will be better able to respond to climatic variability. In accordance with our first hypothesis, we found that ant communities in colder, more seasonal areas had more variable species-specific temperature optima (i.e., higher response diversity or community thermal complementarity) and broader species-specific thermal niches, and that both contributed to greater community thermal breadth. Our results also indicate that this pattern is not mediated by any indirect effects related to changes in species richness along these gradients. Thermal niches are significant, well-described response traits: they are defined by responses to a specific environmental variable, namely thermal variation. This fact is important because climate change is predicted to not only increase average temperatures, but also result in more variable summer and winter temperatures (Schär et al., 2004) and cause a higher frequency of extreme weather events (Jentsch et al., 2009).
Furthermore, we found strong evidence that the thermal resilience of European ant communities stems from specific patterns in species thermal niches that are described by two macroecological hypotheses: the thermal adaptation hypothesis and the climatic variability hypothesis. Such hypotheses have been widely and soundly supported for different taxonomic groups at global (e.g., Deutsch et al., 2008; Huey et al., 2009; Diamond et al., 2012; Sunday et al., 2012; Khaliq et al., 2014), regional (Calosi et al., 2008), and local (Kaspari et al., 2015) scales. These hypotheses were formulated to describe how species' thermal physiological limits are adapted to temperature variation. On the one hand, the observed decrease in mean thermal breadth and thermal complementarity in warmer areas is consistent with the thermal adaptation hypothesis (Kaspari et al., 2015); it suggests that species occurring in warmer areas live closer to their thermal limits and have narrower thermal niches (Deutsch et al., 2008; Sunday et al., 2012; Araújo et al., 2013). On the other hand, the observed increase in mean thermal breadth in more seasonal regions is consistent with the climatic variability hypothesis (Addo-Bediako et al., 2000), which predicts that species living in areas with minimum seasonal temperature variation will have narrower thermal breadth than species living in areas with more extreme seasonal temperature variation (Janzen, 1967; Stevens, 1989). Community thermal breadth is also bolstered by the increased thermal complementarity found in more seasonal regions, probably because temperature seasonality means that thermal niches are available for species with different thermal optima, even though species have broader thermal niches.
Interestingly, the climatic variability hypothesis is the subject of debate (Sunday et al., 2011). Indeed, it has usually been tested using a subset of species for which information is available for a given latitudinal band. Consequently, the macroecological patterns observed may be an artifact of the taxonomically non-random subset of species for which data are available (Sunday et al., 2011). Since our analyses used all the ant species that co-occur at a given site, our results are unlikely to be biased and we have more confidence in our conclusion that temperature variability and species thermal breadth are related. Another criticism of this hypothesis is that any patterns observed might be due to two, somewhat-masked climatic gradients that covary with latitude, namely mean annual temperature (MAT) and temperature seasonality (TS). Most authors ascribe this latitudinal pattern to climatic variability (e.g., Sunday et al., 2011; Khaliq et al., 2014), but the pattern may reflect a simple gradient of mean annual temperature (Deutsch et al., 2008). By disentangling the relationship between mean thermal breadth and the two temperature gradients, we have demonstrated that the MAT gradient has a stronger effect (in terms of R2 and the estimated slope of the regression) on thermal niche breadth than does the TS gradient, which lends support to the idea that mean temperature gradients explain more of the variability in thermal breadth than do gradients of temperature seasonality.
As far as our second hypothesis, any conclusions about community thermal resilience patterns along climatic gradients should account for community robustness (i.e., the maintenance of initial community resilience after any disturbance that removes species). We did so by calculating a tolerance index, a measure of the robustness of community resilience to random species extinctions, which could arise from climate change or other related disturbances. We found that the communities most resilient to climatic variability are, in turn, the communities whose resilience is the least robust (i.e., less tolerant of random species extinctions). This reduced tolerance to species extinction is strongly driven by the reduction in species richness, a finding that is supported by the analyses of the simulated communities. Although the variation in species richness along the mean temperature and seasonality gradients was relatively gradual, it was strong enough to frame community robustness to species extinctions, which provides support for the insurance hypothesis (Hooper et al., 2005). Overall, these results imply that communities in warm, less seasonal areas, which are the most vulnerable to climatic variability, are also the most robust communities—demonstrating resilience to random species extinctions. Such predictions may become important in formulating future conservation and management strategies that effectively preserve biodiversity. Our results suggest that it will be particularly crucial to protect species in colder, more seasonal regions, while mitigation strategies for dealing with climatic variability will be more important in warmer, less seasonal regions. Obviously, our results are subject to non-deterministic species removal, and including species sensitivity to different disturbances might greatly improve our model predictions as regards resilience robustness to particular disturbances.
Finally, we acknowledge that our approach is not without its flaws. For instance, the way in which we estimated the thermal niche indices could be improved in at least three ways. First, we used species occurrence data, but perhaps abundance data would have been better, especially if the values of the community thermal indices are heavily influenced by the presence of rare species. The latter may go extinct in response to climate change simply because they are already in sink habitats (Fordham et al., 2013). However, there was no indication that this was a problem in our study; the patterns we found in the community thermal indices along the thermal gradients were strong and significant. Indeed, Devictor et al. (2008) measured changes in bird community composition in response to climate warming and found similar patterns regardless of whether abundance or occurrence data were used. Second, we measured realized rather than fundamental thermal niches. Obviously, it would have been preferable to characterize thermal niches via controlled, physiological experiments, but that would have been challenging given the large number of species examined here. Furthermore, the fundamental thermal niches of species are shaped by species-specific physiological constraints; fundamental thermal niches only become realized thermal niches as a consequence of biotic interactions (e.g., competition) and demographic/dispersal constraints (see Meier et al., 2010 for an example). Interestingly, a previous study utilizing the subset of ant species examined here demonstrated that species physiological thermal tolerance and biogeographic climatic niches (i.e., realized climatic niches) were strongly correlated (Arnan and Blüthgen, 2015). Third, estimations of species thermal niche indices based on species records are obviously scale dependent; our species-specific thermal niche indices may therefore be biased. For instance, if a species' distribution runs from North Africa to northern Europe, thermal niche indices calculated exclusively based on data from western Europe might display lower values than if the full range of data was used.
Another way in which our approach could be ameliorated is by expanding our range of latitudinal gradients. In particular, it would be interesting to include tropical regions because they are the warmest and least seasonal regions in the world. By expanding our scope, we could reach broader conclusions. However, at present, the high level of species richness typical of these communities, combined with the poorly resolved taxonomy of tropical ant species, makes it difficult to envisage applying our community-level approach to data from these regions. Ultimately, even though our approach has its limitations, we nonetheless believe that it can yield meaningful comparative conclusions. Furthermore, the aforementioned caveats can be used to guide future research.
In this study, we analyzed the thermal responses of ant communities along climatic gradients using species climate envelopes. We have shown that communities living in warm, aseasonal regions are the most vulnerable to climatic variability, although they include the greatest number of species and their climate-related resilience is thus more robust to species extinctions. Processes such as acclimation, adaptation, dispersal, and behavioral plasticity might help communities weather the impacts of climate change (e.g., Deutsch et al., 2008; Williams et al., 2008; Dawson et al., 2011; Sunday et al., 2014). However, we are far from having a solid understanding of these responses and their relevance for ants or other taxa. More research is needed to improve the quality of the models that can be used to predict community vulnerability to climatic variability in the future.
Author Contributions
XA, NB, and JR designed the study; XA and JR collected the data; RM and NB performed the modeling work; RM and XA performed the statistical analyses; XA wrote the first draft of the manuscript; and all the authors contributed substantially to revisions.
Conflict of Interest Statement
The authors declare that the research was conducted in the absence of any commercial or financial relationships that could be construed as a potential conflict of interest.
Acknowledgments
We thank Xim Cerdá for his valuable help in providing the community data and Jessica Pearce-Duvet for editing the manuscript's English. XA was supported by the Conselho Nacional de Desenvolvimento Científico e Tecnológico of Brazil (CNPq PDS-167533/2013-4).
Supplementary Material
The Supplementary Material for this article can be found online at: https://www.frontiersin.org/article/10.3389/fevo.2015.00138
References
Addo-Bediako, A., Chown, S. L., and Gaston, K. J. (2000). Thermal tolerance, climatic variability and latitude. Proc. R. Soc. Lond. B 267, 739–745. doi: 10.1098/rspb.2000.1065
Angilletta, M. J. (2009). Thermal Adaptation: A Theoretical and Empirical Synthesis. Oxford: Oxford University Press. 304.
Araújo, M. B., Ferri-Yañez, F., Bozinovic, F., Marquet, P. A., Valladares, F., and Chown, S. L. (2013). Heat freezes niche evolution. Ecol. Lett. 16, 1206–1219. doi: 10.1111/ele.12155
Arnan, X., and Blüthgen, N. (2015). Using eco-physiological traits to predict climatic and activity niches: lethal temperature and water loss in Mediterranean ants. Global Ecol. Biogeogr. 12, 1454–1464. doi: 10.1111/geb.12363
Arnan, X., Cerdá, X., and Retana, J. (2014). Ant functional responses along environmental gradients. J. Anim. Ecol. 83, 1398–1408. doi: 10.1111/1365-2656.12227
Balvanera, P., Pfisterer, A. B., Buchmann, N., He, J. S., Nakashizuka, T., Raffaelli, D., et al. (2006). Quantifying the evidence for biodiversity effects on ecosystem functioning and services. Ecol. Lett. 9, 1146–1156. doi: 10.1111/j.1461-0248.2006.00963.x
Bellard, C., Bertelsmeier, C., Leadley, P., Thuiller, W., and Courchamp, F. (2012). Impacts of climate change on the future of biodiversity. Ecol. Lett. 15, 365–377. doi: 10.1111/j.1461-0248.2011.01736.x
Buckley, L. B., and Kingsolver, J. G. (2012). Functional and phylogenetic approaches to forecasting species' responses to climate change. Annu. Rev. Ecol. Evol. Syst. 43, 205–226. doi: 10.1146/annurev-ecolsys-110411-160516
Calosi, P., Bilton, D. T., and Spicer, J. I. (2008). Thermal tolerance, acclimatory capacity and vulnerability to global climate change. Biol. Lett. 4, 99–102. doi: 10.1098/rsbl.2007.0408
Cardinale, B. J., Duffy, E., Gonzalez, A., Hooper, D. U., Perrings, C., Venail, P., et al. (2012). Biodiversity loss and its impact on humanity. Nature 486, 59–67. doi: 10.1038/nature11148
Cariveau, D. P., Williams, N. M., Benjamin, F. E., and Winfree, R. (2013). Response diversity to land use occurs but does not consistently stabilize ecosystem services provided by native pollinators. Ecol. Lett. 16, 903–911. doi: 10.1111/ele.12126
Dawson, T. P., Jackson, S. T., House, J. I., Prentice, I. C., and Mace, G. M. (2011). Beyond predictions: biodiversity conservation in a changing climate. Science 332, 53–58. doi: 10.1126/science.1200303
Deutsch, C. A., Tewksbury, J. J., Huey, R. B., Sheldon, K. S., Ghalambor, C. K., Haak, D. C., et al. (2008). Impacts of climate warming on terrestrial ectotherms across latitude. Proc. Natl. Acad. Sci. U.S.A. 105, 6668–6672. doi: 10.1073/pnas.0709472105
Devictor, V., Julliard, R., Couvet, D., and Jiguet, F. (2008). Birds are tracking climate warming, but not fast enough. Proc. R. Soc. B 275, 2743–2748. doi: 10.1098/rspb.2008.0878
Diamond, S. E., Sorger, D. M., Hulcr, J., Pelini, S. L., Del Toro, I., Hirsch, C., et al. (2012). Who likes it hot? A global analysis of the climatic, ecological, and evolutionary determinants of warming tolerance in ants. Glob. Change Biol. 18, 448–456. doi: 10.1111/j.1365-2486.2011.02542.x
Díaz, S., Tilman, D., Fargione, J., Chapin, F. I., Dirzo, R., Gemmill, B., et al. (2005). “Biodiversity regulation of ecosystem services,” in Ecosystems and Human Well-being: Current State and Trends: Findings of the Condition and Trends Working Group, eds R. Hassan, R. Scholes, and N. Ash (Washington, DC: Island Press), 297–329.
Doak, D. F., Bigger, D., Harding, E. K., Marvier, M. A., O'Malley, R. E., and Thompson, and, D. (1998). The statistical inevitability of stability diversity relationships in community ecology. Am. Nat. 151, 264–276.
Dunn, R. R., Agosti, D., Andersen, A. N., Arnan, X., Bruhl, C. A., Cerdá, X., et al. (2009). Climatic drivers of hemispheric asymmetry in global patterns of ant species richness. Ecol. Lett. 12, 324–333. doi: 10.1111/j.1461-0248.2009.01291.x
Elmqvist, T., Folke, C., Nyström, M., Peterson, G., Bengtsson, J., Walker, B., et al. (2003). Response diversity, ecosystem change, and resilience. Front. Ecol Environ. 1, 488–494. doi: 10.1890/1540-9295(2003)001[0488:RDECAR]2.0.CO;2
Fordham, D. A., Mellin, C., Russell, B. D., Açkakaya, R. H., Bradshaw, C. J. A., Aiello-Lammens, M. E., et al. (2013). Population dynamics can be more important than physiological limits for determining range shifts under climate change. Glob. Change Biol. 19, 3224–3237. doi: 10.1111/gcb.12289
Gouveia, S. F., Hortal, J., Tejedo, M., Duarte, H., Cassemiro, F. A. S., Navas, C. A., et al. (2014). Climatic niche at physiological and macroecological scales: the thermal tolerance-geographical range interface and niche dimensionality. Global Ecol. Biogeogr. 23, 446–456. doi: 10.1111/geb.12114
Hazel, J. R. (1995). Thermal adaptation in biological membranes: is homeoviscous adaptation the explanation? Annu. Rev. Physiol. 57, 19–42. doi: 10.1146/annurev.ph.57.030195.000315
Hochachka, P. W., and Somero, G. N. (2002). Biochemical Adaptation: Mechanism and Process in Physiological Evolution. Oxford: Oxford University Press.
Hooper, D. U., Chapin, F. S. III, Ewel, J. J., Hector, A., Inchausti, P., Lavorel, S., et al. (2005). Effects of biodiversity on ecosystem functioning: a consensus of current knowledge. Ecol. Monograph. 75, 3–35. doi: 10.1890/04-0922
Huey, R. B., Deutsch, C. A., Tewksbury, J. J., Vitt, L. J., Hertz, P. E., Alvárez Pérez, H. J., et al. (2009). Why tropical forest lizards are vulnerable to climate warming. P. Roy. Soc. Lond. B Biol. 276, 1939–1948. doi: 10.1098/rspb.2008.1957
Huey, R. B., Kearney, M. R., Krockenberger, A., Holtum, J. A., Jess, M., and Williams, S. E. (2012). Predicting organismal vulnerability to climate warming: roles of behaviour, physiology and adaptation. Philos. T. Roy. Soc. B. 367, 1665–1679. doi: 10.1098/rstb.2012.0005
Huey, R. B., and Kingsolver, J. G. (1993). Evolutionary responses to extreme temperatures in ecototherms. Am. Nat. 143, S21–S46. doi: 10.1086/285521
IPCC (2013). “Climate change 2013: the physical science basis,” in Contribution of Working Group I to the Fifth Assessment Report of the Intergovernmental Panel on Climate Change, eds T. F. Stocker, D. Qin, G.-K. Plattner, M. Tignor, S. K. Allen, J. Boschung, A. Nauels, Y. Xia, V. Bex, and P. M. Midgley (Cambridge; New York, NY: Cambridge University Press), 1535.
Janzen, D. H. (1967). Why mountain passes are higher in the tropics. Am. Nat. 101, 233–249. doi: 10.1086/282487
Jarzyna, M. A., Porter, W. F., Maurer, B. A., Zuckerberg, B., and Finley, A. O. (2015). Landscape fragmentation affects responses of avian communities to climate change. Glob. Change Biol. 21, 2942–2953. doi: 10.1111/gcb.12885
Jentsch, A., Kreyling, J., Boettcher-Treschkow, J., and Beierkuhnlein, C. (2009). Beyond gradual warming: extreme weather events alter flower phenology of European grassland and heath species. Glob. Change Biol. 15, 837–849. doi: 10.1111/j.1365-2486.2008.01690.x
Jiguet, F., Julliard, R., Thomas, C. D., Dehorter, O., Newson, S. E., and Couvet, D. (2006). Thermal range predicts bird population resilience to extreme high temperatures. Ecol. Lett. 9, 1321–1330. doi: 10.1111/j.1461-0248.2006.00986.x
Kampichler, C., van Turnhout, C. A. M., Devictor, V., and van der Jeugd, H. P. (2012). Large-scale schanges in community composition: determining land use and climate change signals. PLoS ONE 7:e35272. doi: 10.1371/journal.pone.0035272
Kaspari, M., Clay, N. A., Lucas, J., Yanoviak, S. P., and Kay, A. (2015). Thermal adaptation generates a diversity of thermal limits in a rainforest ant community. Glob. Change Biol. 21, 1092–1102. doi: 10.1111/gcb.12750
Khaliq, I., Hof, C., Prinzinger, R., Böhning-Gaese, K., and Pfenninger, M. (2014). Global variation in thermal tolerances and vulnerability of endotherms to climate change. P. Roy. Soc. Lond. B Biol. 281:20141097. doi: 10.1098/rspb.2014.1097
Kühsel, S., and Blüthgen, N. (2015). High diversity stabilizes the thermal resilience of pollinator communities in intensively managed grasslands. Nat. Commun. 6:7989. doi: 10.1038/ncomms8989
Laliberté, E., Wells, J. A., Declerck, F., Metcalfe, D. J., Catterall, C. P., Queiroz, C., et al. (2010). Land-use intensification reduces functional redundancy and response diversity in plant communities. Ecol. Lett. 13, 76–86. doi: 10.1111/j.1461-0248.2009.01403.x
Lindström, A., Green, M., Paulson, G., Smith, H. G., and Devictor, V. (2013). Rapid changes in bird community composition at multiple temporal and spatial scales in response to recent climate change. Ecography 36, 313–322. doi: 10.1111/j.1600-0587.2012.07799.x
Markovic, D., Carrizo, S., Preyhof, J., Cid, N., Lengyel, S., Scholz, M., et al. (2014). Europe's freshwater biodiversity under climate change: distribution shifts and conservation needs. Divers. Distrib. 20, 1097–1107. doi: 10.1111/ddi.12232
Meier, E. S., Kienast, F., Pearman, P. B., Svenning, J. C., Thuiller, W., Araujo, M. B., et al. (2010). Biotic and abiotic variables show little redundancy in explaining tree species distributions. Ecography 33, 1038–1048. doi: 10.1111/j.1600-0587.2010.06229.x
Mokany, K., and Ferrier, S. (2011). Predicting impacts of climate change on biodiversity: a role for semi-mechanistic community-level modelling. Divers. Distrib. 17, 374–380. doi: 10.1111/j.1472-4642.2010.00735.x
Mori, A. S., Furukawa, T., and Sasaki, T. (2013). Response diversity determines the resilience of ecosystems to environmental change. Biol. Rev. 88, 349–364. doi: 10.1111/brv.12004
Naeem, S., Bunker, D. E., Hector, A., Loreau, M., and Perrings, C. (2009). Biodiversity, Ecosystem-Functioning, and Human Wellbeing. New York, NY: Oxford University Press.
Nieto-Sánchez, S., Gutiérrez, D., and Wilson, R. J. (2015). Long-term change and spatial variability in butterfly communities over an elevational gradient: driven by climate, buffered by habitat. Diver. Distrib. 21, 950–961. doi: 10.1111/ddi.12316
Parmesan, C., Ryrholm, N., Stefanescu, C., Hill, J. K., Thomas, C. D., Descimon, H., et al. (1999). Poleward shifts in geographical ranges of butterfly species associated with regional warming. Nature 399, 579–583. doi: 10.1038/21181
Peñuelas, J., Sardans, J., Estiarte, M., Ogaya, R., Carnicer, J., Coll, M., et al. (2013). Evidence of current impact of climatechange on life: a walk from genes to the biosphere. Glob. Change Biol. 19, 2303–2338. doi: 10.1111/gcb.12143
Peterson, G. D., Allen, C. R., and Holling, C. S. (1998). Ecological resilience, biodiversity and scale. Ecosystems 1, 6–18. doi: 10.1007/s100219900002
Pörtner, H. O. (2001). Climate change and temperature-dependent biogeography: oxygen limitation of thermal tolerance in animals. Naturwissenschaften 88, 137–146. doi: 10.1007/s001140100216
Princé, K., and Zuckerberg, B. (2015). Climate change in our backyards: the reshuffling of North America's winter bird communities. Glob. Change Biol. 21, 572–585. doi: 10.1111/gcb.12740
Quintero, I., and Wiens, J. J. (2013). What determines the climatic niche width of species? The role of spatial and temporal climatic variation in three vertebrate clades. Global Ecol. Biogeogr. 22, 422–432. doi: 10.1111/geb.12001
R Development Core Team. (2014). R: A Language and Environment for Statistical Computing. Vienna: R Foundation for Statistical Computing. Available online at: http://www.R-project.org
Schär, C., Vidale, P. L., Lüthi, D., Frei, C., Häberli, C., Liniger, M. A., et al. (2004). The role of increasing temperature variability in European summer heatwaves. Nature 427, 332–336. doi: 10.1038/nature02300
Staudinger, M. D., Carter, S. L., Cross, M. S., Dubois, N. S., Duffy, J. E., Enquist, C., et al. (2013). Biodiversity in a changing climate: a synthesis of current and projected trends in the US. Front. Ecol. Environ. 11, 465–473. doi: 10.1890/120272
Stevens, G. C. (1989). The latitudinal gradient in geographical range: how so many species coexistinthe tropics. Am. Nat. 133, 240–256. doi: 10.1086/284913
Sunday, J. M., Bates, A. E., and Dulvy, N. K. (2011). Global analysis of thermal tolerance and latitude in ectotherms. P. Roy. Soc. Lond. B Biol. 278, 1823–1830. doi: 10.1098/rspb.2010.1295
Sunday, J. M., Bates, A. E., and Dulvy, N. K. (2012). Thermal tolerance and the global redistribution of animals. Nat. Clim. Change 2, 686–690. doi: 10.1038/nclimate1539
Sunday, J. M., Bates, A. E., Kearney, M. R., Colwell, R. K., Dulvy, N. K., Longino, J. T., et al. (2014). Thermal-safety margins and the necessity of thermoregulatory behavior across latitude and elevation. Proc. Natl. Acad. Sci. U.S.A. 111, 5610–5615. doi: 10.1073/pnas.1316145111
Tilman, D. (1996). Biodiversity: population versus ecosystem stability. Ecology 77, 350–363. doi: 10.2307/2265614
Tilman, D., Reich, P. B., and Knops, J. M. H. (2006). Biodiversity and ecosystem stability in a decade-long grassland experiment. Nature 441, 629–632. doi: 10.1038/nature04742
Keywords: ants, climate change, climate envelope, community vulnerability, niche complementarity, resilience, response diversity, temperature
Citation: Arnan X, Blüthgen N, Molowny-Horas R and Retana J (2015) Thermal Characterization of European Ant Communities Along Thermal Gradients and Its Implications for Community Resilience to Temperature Variability. Front. Ecol. Evol. 3:138. doi: 10.3389/fevo.2015.00138
Received: 07 September 2015; Accepted: 20 November 2015;
Published: 14 December 2015.
Edited by:
Angela McGaughran, CSIRO, AustraliaReviewed by:
Marta A. Jarzyna, Yale University, USAJuliano Sarmento Cabral, Synthesis Centre for Biodiversity Sciences (sDiv), Germany
Copyright © 2015 Arnan, Blüthgen, Molowny-Horas and Retana. This is an open-access article distributed under the terms of the Creative Commons Attribution License (CC BY). The use, distribution or reproduction in other forums is permitted, provided the original author(s) or licensor are credited and that the original publication in this journal is cited, in accordance with accepted academic practice. No use, distribution or reproduction is permitted which does not comply with these terms.
*Correspondence: Xavier Arnan, xavi.arnan@gmail.com