The Role of Urbanization in the Global Carbon Cycle
 Galina Churkina1,2*
- 1Institute for Advanced Sustainability Studies, Potsdam, Germany
- 2Department of Geography, Humboldt University, Berlin, Germany
Urban areas account for more than 70% of CO2 emissions from burning fossil fuels. Urban expansion in tropics is responsible for 5% of the annual emissions from land use change. Here, I show that the effect of urbanization on the global carbon cycle extends beyond these emissions. I quantify the contribution of urbanization to the major carbon fluxes and pools globally and identify gaps crucial for predicting the evolution of the carbon cycle in the future. Urban residents currently control ~22 (12–40)% of the land carbon uptake (112 PgC/yr) and ~24 (15–39)% of the carbon emissions (117 PgC/year) from land globally. Urbanization resulted in the creation of new carbon pools on land such as buildings (~6.7 PgC) and landfills (~30 PgC). Together these pools store 1.6 (±0.3)% of the total vegetation and soil carbon pools globally. The creation and maintenance of these new pools has been associated with high emissions of CO2, which are currently better understood than the processes associated with the dynamics of these pools and accompanying uptake of carbon. Predictions of the future trajectories of the global carbon cycle will require a much better understanding of how urban development affects the carbon cycle over the long term.
Introduction
Cycling of carbon (C) is essential to processes that provide food, fiber, and fuel for all of the Earth's inhabitants. On one hand, carbon dioxide is the second most abundant greenhouse gas after water vapor in the Earth's atmosphere. Together with other greenhouse gases it keeps our planet warm, with a danger to overheat if the concentrations of the greenhouse gases become too high. On the other hand, photosynthetic organisms such as plants and algae take up atmospheric CO2 in the presence of light to produce organic matter that eventually becomes the basic food source for all microbes, animals, and humans. Carbon-based molecules are the main component of biological compounds as well as of many minerals. Carbon containing compounds also exist in various forms in the atmosphere. Availability of all these different forms of carbon makes our planet suitable for humans to survive.
Over centuries human settlements evolved from self-sufficient in producing food and fuel to fully dependent on hinterlands for production of goods necessary to keep the urbanites alive. Because of the high population densities, modern cities do not have enough space to produce the food, fiber, and energy they consume. They draw large volumes of food, fiber, and fuel—all rich in carbon content—from their hinterland. Some of these materials stay and accumulate in cities. The rest is returned as gaseous, liquid, and solid residuals into the air, water, and soil affecting not only cities and their surroundings, but also remote areas. Many of these residuals such as CO2, CO, sludge, solid waste, etc. contain carbon and directly affect cycling of carbon. Some other of these residuals affect the carbon cycle indirectly. For instance, nitrogen containing compounds deposited on land or water bodies may increase uptake of carbon by photosynthesizing organisms (Churkina et al., 2007, 2010b; Finzi et al., 2007; Duce et al., 2008), while the other pollutants of urban origins such as ozone and acids may reduce this uptake (Likens et al., 1996; Van Dingenen et al., 2009; Ainsworth et al., 2012).
Although our planet offers a vast amount of space, humans prefer to live in cities, which occupy a small area of the total land surface (~0.5% Schneider et al., 2009). Given the tendency to consider it a local phenomenon, urbanization has been excluded from global studies of the carbon cycle. Yet urbanization trends and emerging evidence of urban pressure on the environment present persuasive arguments for reconsidering this view. The share of the urban population has already increased by 40% over one century (1913–2013) and will increase by another 15% in the next 50 years (FAO, 2015). Land area occupied by cites increases disproportionally faster to the population increase (Seto et al., 2011). Population pressure on the environment is especially high in the tropics. Urban expansion in the tropics contributes ~5% of global emissions from deforestation and land use change (Seto et al., 2012). In addition to that it is widely known that approximately 75% of global CO2 emissions originate in urban areas (Seto et al., 2014). Carbon storage in human settlements of the conterminous US was ~10% of the total carbon stored in the US ecosystems (Churkina et al., 2010a). In China, this fraction was substantially smaller—only 0.74% and this did not include C stored in landfills (Zhao et al., 2013). Although carbon budget assessments are in progress for several cities (e.g., Mohareb and Kennedy, 2012; Hutyra et al., 2014), the overall effect of urbanization on the global carbon cycle has not been estimated.
Here, I quantify the contribution of urbanization to the global carbon cycle. I identify major carbon fluxes and pools connecting cities to the global cycle of carbon and estimate their magnitudes. Based on these estimates I highlight issues important for further understanding of the urbanization effect on the global carbon cycle.
Materials and Methods
Assumptions
This analysis is based on several major assumptions, which are described below. This study is focused on fluxes and storage of organic carbon only. Carbon cycle of urban areas is characterized by vertical and horizontal fluxes of carbon (Figure 1). The vertical carbon fluxes connect land and atmosphere. These are fluxes of CO2 uptake and release. Horizontal fluxes link urban area with hinterland. Because the area of modern cities is too small to support the demand of urban dwellers for resources such as food, fiber, and fuels, urban dwellers extract these resources from the hinterland. The area needed to supply these resources is referred to as an urban footprint. Here I assumed that carbon from urban footprint is equivalent to a fraction of net primary productivity (NPP), which is the net amount of carbon sequestered by vegetation in a given period of time. It determines the amount of energy available for transfer from vegetation to other levels in the trophic webs in ecosystem. At a global scale NPP encompass the total food resource of the Earth (Vitousek et al., 1986).
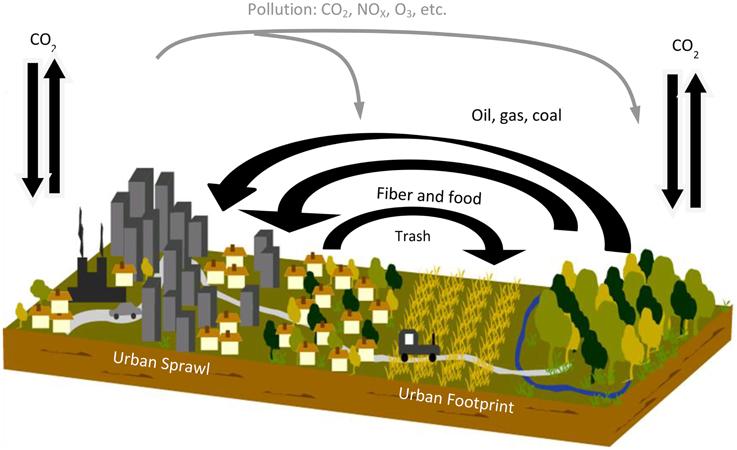
Figure 1. Urban carbon cycle (modified after Churkina, 2008). Black arrows depict vertical and horizontal carbon fluxes. Gray errors show indirect effects of urban pollution on carbon uptake and release of ecosystems inside of urban sprawl and in the urban footprint.
The global urban extent (Areaurb) is assumed to be 658,760 km2 as estimated for 2001–2002 using remotely sensed data from the Moderate Resolution Imaging Spectroradiometer (MODIS) at 500 m spatial resolution (Schneider et al., 2009). A fraction of the global urban extent is considered to be covered with vegetation, which is assumed to be temperate deciduous forest. The global urban population (Numpeople) is assumed to be 3,957,705,000 people as reported by the Food and Agriculture Organization of the United Nations for 2015 (FAO, 2015). The abovementioned global urban extent and urban population were used for the best guess estimates. To reflect uncertainty in numbers underlying the urban carbon cycle globally, high, and low estimates of carbon fluxes and pools are provided where possible. Petagram of carbon (PgC) equivalent to 1015 g or 109 metric tons is used as the basic unit of measure. Where sources express results in terms of CO2 and CH4, 0.27, and 0.75 respectively are used to convert them to the units of carbon.
Global Estimates of Major Urban Carbon Fluxes and Pools
Carbon Uptake
In urban areas both green areas as well as concrete buildings can uptake carbon. The processes behind this uptake are radically different. In green areas, CO2 diffuses into the stomata of plant's leaves, where it reacts with water and other chemical compounds in the process of photosynthesis resulting in organic matter production. In buildings, CO2 diffuses into the concrete walls through the pores of concrete, where the process of carbonation takes places. Carbonation is a chemical process where atmospheric CO2 is fixed as stable carbonate minerals such as calcite, dolomite, magnesite, and siderite. Atmospheric CO2 reacts with CaO in concrete to form calcite (CaCO3). This is the reverse reaction of the calcination process used in cement making.
The common controls over both photosynthesis and carbonation are atmospheric CO2 concentrations, air temperature, and air humidity. In addition to that, light, soil water availability, nitrogen supply, and tropospheric ozone concentrations control photosynthesis (Larcher, 1995). Temperature governs photosynthesis reaction rates. Nitrogen is required to produce photosynthetic enzymes. Water is essential for general metabolism of plants. At certain levels ground-level ozone can damage plant leave's cells and reduce photosynthesis rate. The supplementary controls behind CO2 uptake in concrete are water content, chemical composition, and porosity of materials (Gajda and Miller, 2000).
Here, I estimate only net carbon uptake by urban vegetation, because sequestration of carbon in buildings is negligibly small by comparison. The carbonation process is relatively slow as atmospheric CO2 has to diffuse into the solid material and to dissolve in its pore fluid. A range of studies in the USA (Gajda and Miller, 2000) and Europe (Kjellsen et al., 2005) have explored the possibility to take up carbon in standing concrete buildings and after their demolishment. In 1 year the US concrete infrastructures can capture only 2% (0.0004 PgC/year, after Gajda, 2001) of carbon sequestered by the US urban forests (0.02 PgC/year, Nowak and Crane, 2002).
In this study the gross carbon uptake (Cuptake) by urban vegetation globally was calculated using the equation below:
where, Uptakegross is the gross CO2 uptake rate of urban vegetation that is used for photosynthesis [gC/m2/year];
Fracgreen is the fraction of urban area covered with vegetation globally [%].
Gross CO2 uptake of urban vegetation depends on climate, level of pollution, and vegetation management. For trees, the tree's age would play a role as well. Distribution of vegetation in urban areas and the fraction of urban area covered by vegetation globally are not known. In this study we assumed that green spaces of urban areas were covered by deciduous trees. The gross CO2 uptake of urban vegetation (Uptakegross) was assumed to be equal to the uptake of a temperate humid forest (Luyssaert et al., 2007).
The overall amount of green space in urban areas varies from city to city. In Europe this number varies from 4% in Athens, Greece, to 53% in Budapest. Based on the data from 25 cities, the green space cover averages around 7% in Europe (Lavalle et al., 2002). Urban tree cover is as low as 5% in New Mexico and as high as 55% in Georgia, the USA (Nowak and Crane, 2002). The cities of the US are greener on average than European ones. The urban tree cover averages at 27% in the USA (Nowak and Crane, 2002). Although methods based on remotely sensed data exist and have been applied to classify urban land cover in different parts of the world (Powell et al., 2007; Tigges et al., 2013), there is no global estimate of the urban vegetation extent and classification. Therefore assumptions about the extent of vegetation within cities have been made based on available data.
The upper bound of gross CO2 uptake was calculated using the equation above and the average tree cover from the USA rounded up to 30% of urban area as Fracgreen. The low bound was calculated using the European average fraction of urban green space rounded up to 10%. In the best guess estimate, the green space was assumed to be 20% of the urban extent globally (Table 1).
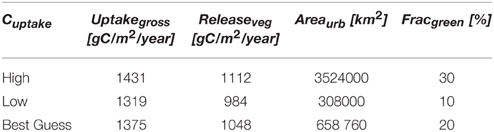
Table 1. Values used to estimate high, low, and best guess of gross carbon uptake and release from urban vegetation and soil respiration globally.
Carbon Release
In a city carbon can be released from various sources and processes such as plant and soil respiration, human respiration, waste decomposition, burning of fossil fuels, and urban expansion. Carbon release is a result of metabolic processes happening in living organisms and decomposition of organic matter. Plant and human respiration is a part of metabolism of living organisms. In soils and landfills, CO2 and CH4 are released as a result of organic and inorganic matter decomposition, which is the physical and chemical breakdown of dead plant, animal, human, and microbial material. During decomposition along with carbon release into the atmosphere, many other chemical elements are discharged into the soil and ground water. Fossil fuel is a general term for buried combustible geologic deposits of organic materials, formed from decayed plants and animals that have been converted to crude oil, coal, natural gas, or heavy oils by exposure to heat and pressure in the earth's crust over hundreds of millions of years. Burning fossil fuels releases energy and CO2 captured in these organic deposits. Emissions of carbon from land use conversion takes place if the city is expanding into natural or agricultural areas, so that vegetation cover is lost or fragmented.
Temperature is a common control that regulates all these different types of carbon release. In humans elevated temperatures increase ventilation (Zila and Calkovska, 2011) and therefore respiration. Plants respire more CO2 at higher temperatures, because their internal processes intensify. Organic matter decomposes faster under rising temperatures as a result of faster chemical reactions as long as the matter humidity allows. Burning of fossil fuels intensifies with air temperatures below 15.5°C prompting demand for building's heating and with air temperatures higher than 23°C stimulating demand for cooling of buildings (Creutzig et al., 2015).
Here carbon release from urban areas is estimated for plant and soil respiration, waste decomposition, human respiration, burning fossil fuels, and urban expansion. Total release is estimated as a sum of the abovementioned components.
Plant and Soil Respiration
In addition to temperature, the plant respiration rate depends also on the chemical composition of plant's tissue (Reich et al., 1998). Three types of factors control decomposition of organic matter in soil: physical environment (soil temperature and moisture), the quantity and quality of substrate available to decomposers, and the characteristics of the microbial community (Chapin et al., 2002).
Because we assumed that urban green spaces were occupied by deciduous trees, we also assumed respective plant (951 gC/m2/year) and soil (420 gC/m2/year) respiration estimated for temperate humid deciduous trees (Luyssaert et al., 2007). The total plant and soil respiration was assumed to be 1046 gC/m2/year (Table 1). The high, low, and best guess estimates for carbon release from urban plant and soil globally were calculated assuming 30, 10, and 20% as respective fractions of green space within urban areas globally.
Waste Decomposition
Urban dwellers produce large amounts of solid and liquid waste. Solid waste can be recycled, incinerated, composted, or deposited in the landfills. Liquid waste such as sludge either enters natural aquifers or wastewater treatment plants. During decomposition of waste at landfills, gases such as CO2, CH4, and volatile organic compounds are emitted. CH4 constitutes 40–70% and CO2 30–60% of the total emissions from waste decomposition (El-Fadel et al., 1997). Emissions of volatile organic compounds are assumed to be negligible in relation to the other two. Climate, waste composition, and the type of waste management control these emissions (Lou and Nair, 2009).
Global emissions of CH4 from landfills and waste are estimated at 0.075 PgCH4 (0.056 PgC) per year (Ciais et al., 2013). Best guess estimate was calculated assuming methane emissions constitute 60% and C02 constitute 40% of total emissions from waste decomposition, we can approximate CO2 emissions at 0.05 PgCO2 (0.0135 PgC) per year. Here the low bound of carbon release from waste decomposition was estimated assuming methane emissions at 70% and CO2 emissions at 30%. The high bound was computed assuming methane emissions at 40% and CO2 emissions at 60% of the global waste emissions. The best guess estimate was calculated with methane emissions of 60% and CO2 emissions of 40%.
Human Respiration
People exhale CO2 as part of the metabolism. A healthy person respires on average 246 gC per day or 89656 gC per year. This amount changes with the person's age and health conditions. In this study we calculated the total amount of carbon respired by urban population (Cresp) using amount of carbon respired by an average person (Cperson) and the total urban population in 2015 (NUMpeople) as
where, Cperson = 89656 gC/m2 per year.
Burning Fossil Fuels
The recent Intergovernmental Panel on Climate Change (IPCC) report indicated that urban areas generate about three quarters of global carbon emissions (Seto et al., 2014). The emissions of CO2 from burning fossil fuels and cement production was 8.9 ± 0.4 PgC per year in 2004–2013 (Le Quéré et al., 2015). It means that global carbon emissions from burning fossil fuels of urban origins amounted to ~ 6.7 ± 0.4 PgC per year in the last decade. Here, this estimate was adopted as a proxy for carbon release from burning fossil fuels in urban areas globally.
Urban Expansion
Urban land expansion on certain continents like North America and Europe is disproportionally large in comparison to urban population growth. It does not necessarily leads to carbon losses, because urban areas rarely expand into the forest areas with high biomass and soil carbon content, but more often into agricultural areas where carbon content in soils is low. The situation is different in pan-tropical countries. Seto et al. (2012) estimated that carbon losses associated with highly likely urban expansion resulting from forest clearing in the tropics is 0.05 PgC per year for 2000–2030. They argue that it is a lower-bound estimate of urban growth-related carbon losses because 63% of the projected new urban land is outside the tropics and will contribute to additional carbon and biomass losses. Here, 0.5 PgC per year was assumed as the carbon release from urban expansion globally, because other estimates of this kind were not available.
Carbon Uptake and Release of Urban Footprint
The area of modern cities is too small to support the demand of urban dwellers for resources such as food, fiber, and fuels. Urban dwellers extract these resources from the hinterland. The area needed to supply these resources is referred to as an urban footprint. The footprint increases as the population growth and/or consumption per capita increases. Here, the global estimate of carbon uptake and release from the urban footprint is based on NPP appropriated by humans (Vitousek et al., 1986), which is abbreviated as HNPP. NPP is the net amount of carbon sequestered by vegetation in a given period of time. It determines the amount of energy available for transfer from vegetation to other levels in the trophic webs in ecosystem or the total food resource of the Earth (Vitousek et al., 1986). In this study it was assumed that urban dwellers are responsible for 50–70% of HNPP, which was most recently estimated at 15.6 PgC per year for the year 2000 (Haberl et al., 2007). The latter estimate of HNPP is a sum of NPP harvested and destroyed during harvest (8.18 PgC per year) as well as NPP influenced by human-induced land conversion (6.29 PgC per year) such as land cover change, land use change, and soil degradation. Urbanization effect on the land use change is not explicitly included in this estimate. Estimates of gross carbon uptake (Cfuptake) and release (Cfrelease) of the urban footprint were calculated using the equations below:
where, furb is fraction of HNPP appropriated by urban residents [%]; fGPP∕NPP is a conversion factor from NPP to gross carbon uptake or gross primary production (GPP) derived from values reported by Luyssaert et al. (2007); fGPP∕NPP is a conversion factor from NPP to plan and soil C release or ecosystem respiration (Reco) derived from values reported by Luyssaert et al. (2007); Table 2.
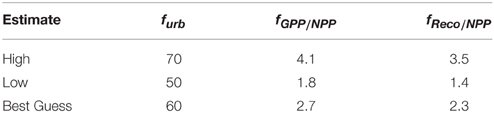
Table 2. Values used to estimate high, low, and best guess of gross carbon uptake and release from vegetation and soil respiration in the urban footprint.
Urban Carbon Storage
Not all carbon taken up by vegetation or brought in by people in the form of oil, gas, food, and fiber will be immediately released. Some of it will accumulate in a city in pools with various residence times. In urban areas carbon is stored not only in natural pools such as soils and vegetation, but also in artifacts created by humans such as buildings and landfills. In addition to that human body also contains carbon. In this study carbon storage in urban areas (Curb) globally was estimated using the following equation:
where NUMpeople is the urban population of the world in 2015.
The amount of carbon accumulated in a unit of urban area depends on the urban form (sprawled or compact), climate zone, and materials used in construction. Average carbon density of vegetation (Cveg), soil (Csoil), buildings (Cbuild), landfills (Clfill), and people (Cpeop) (Table 3) have been based on the estimates obtained from the respective data for the conterminous United States (Churkina et al., 2010a) and mainland China (Zhao et al., 2013). It was assumed that carbon densities of these two countries represent two extremes. The USA cities have low population density with high fraction of vegetation with an urban population of 204,181,000 and an urban area of 95018 km2 in 2000. The Chinese cities are densely built-up and populated with 611,936,748 urban residents over an urban area of 33697 km2 in 2006 (Zhao et al., 2013). The high-bound estimate was obtained with the carbon density of urban pools per capita for the USA. The low-bound estimate was derived using the carbon pool density per capita of the Chinese cities. The best guess estimate was estimated as the mean of the high- and low-bound values.
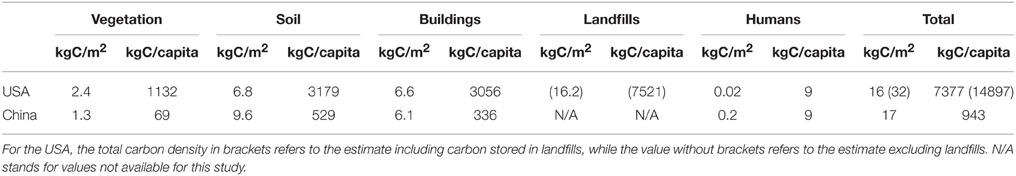
Table 3. Average carbon density of urban pools based on studies from the USA and China used in calculations in this study.
Results and Discussion
Carbon Cycle of Global Urban Areas
In this study the gross carbon uptake by urban vegetation is estimated between 0.04 and 1.51 PgC per year (Table 4) depending on the global urban extent and the fraction of green areas in cities (Table 1). The gross carbon uptake within the urban footprint estimated here is a few orders of magnitude larger than the one of urban vegetation. It amounts to 14–43 PgC per year. The release of carbon associated with cities is estimated between 17 and 46 PgC per year (Table 4). This release includes respiration of plant and soil in the urban footprint (10–37 PgC per year), burning fossil fuels (6.3–7.1 PgC per year) associated with transportation and energy production inside and outside of city, respiration of urban plant and soil (0.03–1.18 PgC per year), respiration of urban dwellers (0.35 PgC per year), waste decomposition (0.06-0.09 Pg per year), and urban expansion (0.05 PgC per year). Among these emissions, respiration of plant and soil of the urban footprint (74 %) and carbon emissions from burning fossil fuels (~24%) dominate emissions from human (~1%) or soil and plant respiration (~1%), waste decomposition (<1%), and urban expansion (<1%).
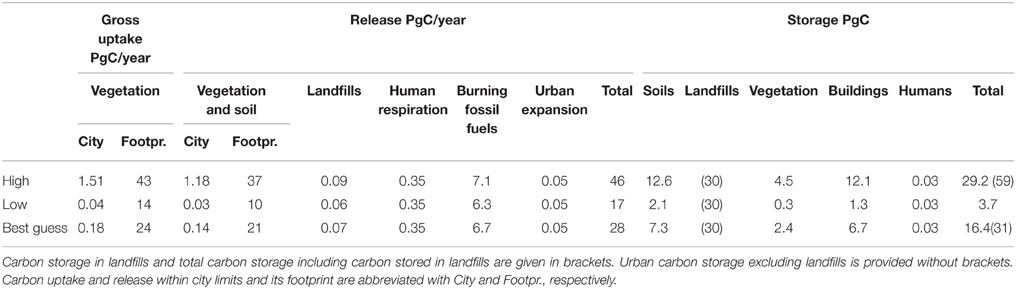
Table 4. High-, low -bound, and best guess estimates of urban area contribution to annual carbon uptake, release, and storage globally.
These estimates of carbon uptake and release associated with urban areas do not account for the fertilization effects of atmospheric CO2, deposited NOx, and warmer temperatures (heat island effect) on carbon uptake or elevated concentrations of ground-level ozone, which could reduce plant uptake of carbon. The synergetic effect of these changes on C uptake of urban vegetation is still poorly understood. One study of changes in plant productivity from city core to a farm located 50 km outside of city's center, which is characterized by changes in air temperatures (daytime average increase of 3.3°C) and atmospheric CO2 concentration (21%), shows increase of almost 115% of the productivity measured as above-ground biomass of lambsquarter plants in Baltimore, USA (Ziska et al., 2004). Another study (Gregg et al., 2003) showed a similar trend in cottonwood clones, which biomass at urban sites in New York city, USA, was double that of rural sites. The latter study however related the decrease in rural cottonwood productivity to increased cumulative concentrations of ground-level ozone outside of a city. In a modeling study (Trusilova and Churkina, 2008) showed that fertilizing effect of CO2 and nitrogen containing compounds emitted by cities offset negative effects of urbanization such as expansion of impervious areas and warmer temperatures on carbon sequestration resulting in the net carbon sink of 0.06 PgC/year on land in Europe circa 2000.
This study suggests that urban areas store between 4 and 29 PgC below- and above-ground globally (Table 4) if we exclude carbon stored in landfills from our calculations. This estimate increases up to 59 PgC if we account for carbon stored in landfills (~30 Pg). Best global estimate for carbon stored in urban areas here is 16 PgC, which is comparable to 11 PgC obtained by multiplying global urban extent (Areaurb) by the specific urban storage capacity of 16 kgC/m2 derived in previous studies of cities in China (Zhao et al., 2013) as well as of the US (Churkina et al., 2010a). This estimate (29 PgC) is within the limits for global C storage in urban areas reported earlier such as 4.4–56.4 PgC (Zhao et al., 2013), which includes uncertainty in global urban extent, but excludes C storage in landfills. The results of this study suggest that excluding landfills, the largest carbon pools in the cities are buildings (1.4–12.6 PgC) and soils (2.2–12.1 PgC), which store comparable amounts of carbon (~41–45% of the total urban carbon storage). They are followed by urban vegetation with 0.3–4.5 PgC (~14–15% of the total urban carbon storage). Carbon accumulated in various pools in urban areas is a difference between carbon uptake and release happening inside as well as outside of urban area.
This study shows that carbon release and uptake of the city footprint are the largest carbon fluxes associated with urban areas followed by carbon flux from burning fossil fuels. Annual release of carbon (6.7 PgC/year) from urban areas is equal to its total carbon storage in buildings (6.7 PgC) accumulated over decades. Carbon fluxes of the urban footprint have not been really associated with urban carbon cycle in the earlier studies (Pataki et al., 2006; Hutyra et al., 2014). Only carbon fluxes of urban vegetation have been taken into account and considered as an offset of emissions from burning fossil fuels. Studies of individual cities showed that urban fossil fuel emissions typically dwarf biogenic carbon uptake and storage within cities (Pataki et al., 2011; Hutyra et al., 2014). Although urban vegetation is essential to the well-being of urban dwellers as it provides cooling in summer, filter air, water, and soil pollution, reduce risk of flooding, the vegetation dynamics in the city footprint, and the fate of extracted materials in the city are more important to the carbon cycle. The vegetation in the city's footprint is also critical for the provision of food and fiber to urban residents.
Global Carbon Cycle and Future Urbanization Trends
Here, I show that the influence of urban areas on the global carbon cycle extends beyond emissions of CO2 from burning fossil fuels, which are 75% (71–80%) of the total emissions from burning fossil fuels (Seto et al., 2014), and urban expansion, which is ~5% of the annual emissions from deforestation and land use change globally (0.9 Pg C/year; Seto et al., 2012). This study compliments existing urban emission estimates with contribution of urban areas to global plant and soil respiration and quantifies urban carbon pools. It indicates that plant and soils respiration of urban areas together with carbon emissions from waste decomposition at the landfills are estimated to be as low as 0.19% (0.09–1.18%) of the ecosystem respiration globally (107.2 PgC/year, Figure 2). Respiration of plants and soil accompanying production of food, fiber, etc. for urban dwellers outside of city limits makes around 19% (10–35%) of the global land ecosystem respiration (107.2 PgC/year). These emissions are associated with a high demand for energy needed to maintain transport, heating or cooling of buildings, as well as provision of electricity. Energy use in cities increases with increasing wealth or gross domestic product (GDP) per capita, especially for cities with GDP per capita <10,000 USD, followed by gasoline price, population density, and climatic factors (Creutzig et al., 2015).
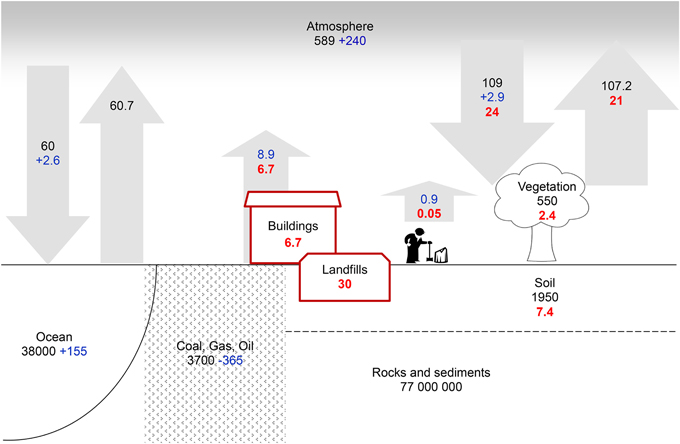
Figure 2. Carbon pools (PgC) and fluxes (PgC/year) of urban areas as compared to the major global carbon fluxes. Urban contributions to the global carbon fluxes as well as to the carbon storage pools in vegetation and soils are highlighted in red. Two new carbon pools created as a result of urbanization are buildings and landfills. They are depicted in red. The global C pools such as atmosphere, vegetation, soil, ocean, fossil fuels, rocks, and sediments are indicated with respective names and amounts of C stored. The global C fluxes such as carbon uptake and release are ocean/land, burning fossil fuels, and land use changes are shown in gray. Estimates for pre-industrial carbon pools and fluxes for preindustrial times are depicted with black font. Changes in these pools and fluxes from preindustrial times as well as the fluxes from burning fossil fuels and changes in land use are shown in blue font (after Ciais et al., 2013; Le Quéré et al., 2015).
This study indicates that the gross carbon uptake of urban vegetation is currently below one percent (0.16%, 0.04–1.35%) of the global gross land C uptake (112 PgC, Figure 2). Even if cities would increase their green space up to 50% (329,380 km2) of their global extent circa 2000, their carbon uptake would remain small (~0.42% of the global carbon uptake). Gross carbon uptake within the urban footprint is however substantial and amounts to 22% (12.5–17.5%) of the global gross C uptake. Organic matter produced outside the cities was moved to inside the city in various forms of construction materials, food, clothes, and fuel.
Transfer and use of these materials resulted in the creation of new carbon pools, which are buildings and landfills (Figure 2). This study points out that carbon storage in buildings is currently around 1% (0.2–2%) of the carbon stored aboveground in vegetation (600 PgC). Landfills store at least 30 PgC that is approximately 1% of the soils carbon storage globally (~3300 PgC). The size of new pools is substantial, given that these pools are relatively young (circa one–two century old) in comparison to the natural carbon pools of vegetation and soils (hundreds to thousands of years). In addition to that, a smaller share of the urban carbon pool is stored in urban vegetation and soils. Urban vegetation is responsible for 0.4% (0.05–0.75%) of carbon stored in vegetation globally. Urban soils store 0.22% (0.07–0.38%) of the global soil carbon. The share of carbon stored in the urban system in the future will depend on the settlement patterns and locations, fraction of urban green spaces in the future cites, their management, as well as on the type of construction materials of the buildings and waste management strategies. In countries with high urban build-up density, the share of carbon stored in cities relative to natural ones is substantially lower. For instance human settlements (urban and exurban areas) of the conterminous US store ~10% of the total carbon stored in the US ecosystems (Churkina et al., 2010a). In China, this fraction was substantially smaller—only 0.74% (Zhao et al., 2013) and did not account for carbon stored in landfills. Although there is little historical information on global waste generation, it is certain that waste generation is increasing over time (Hoornweg and Bhada-Tata, 2012) and a large share of it ends up in the soil (Hoornweg and Bhada-Tata, 2012) or coastal ocean (Kroeze et al., 2013).
Conclusions
This study demonstrates that urbanization is becoming an important player in the global carbon cycle. The influence of cities on the carbon cycle extends beyond cities' limits and their contributions to the emissions from burning fossil fuels and land use change. Urban residents currently control ~22% of the total land carbon uptake and ~24% of release globally. Urbanization created two new pools of carbon such as buildings and landfills, which constitute ~1.6% of the total vegetation and soil pools globally. The creation of these new carbon pools are a result of carbon uptake in remote ecosystems and its transport to urban areas. Creation and maintenance of these pools has been associated with high emissions of CO2 from burning fossil fuels, which are currently better understood than the dynamics of carbon in the urban footprint and its fate after transfer to the cities.
This analysis was based on assumptions, which were needed to compensate for scarcity of data relevant at the global scale. The future global estimates of this kind would especially benefit from better data sets covering urban footprint and urban vegetation. The extent of urban footprint on land and ocean should include not only the demand for resources by urban dwellers, but also the extent of urban pollutants, which deposition can substantially modify carbon uptake and release of land or ocean ecosystems. In addition to that, the life cycle analysis of carbon containing products including extraction, transfer to the cities, carbon residence time within city, and subsequent recycling or deposition to landfills, has to be investigated. While net carbon uptake and storage in urban vegetation globally is currently small, their importance can increase if the urban form develops in the direction of low build-up density cities rather than compact ones. At this point we have very limited knowledge about distribution and types of vegetation in cities globally. Compilation of such data from remotely sensed data in combination with city's statistics would benefit not only C cycle science, but also studies of interactions between vegetation and airborne, water, and soil pollutants as well as their health implications for urban residents. The future data collections should encompass climatically and culturally different regions of the world. The effort on data collection would be critical, but will not sufficient for forecasting the impact of urbanization on the global carbon cycle. In parallel to data collections, one would need to develop a model based on major principles underlying this phenomenon.
The urban shares in the global carbon cycle are likely to increase in the future as urban population is on the rise and projected to reach 75% of the world population by 2030. Predictions of future trajectories of the global carbon budget will require a much better understanding how urban development affects carbon cycle.
Conflict of Interest Statement
The author declares that the research was conducted in the absence of any commercial or financial relationships that could be construed as a potential conflict of interest.
Acknowledgments
I am grateful to Rebecca Kutzner, Ludmila Churkina, Detlef Sprinz, and Anne Boden for helpful editorial comments to the earlier versions of the manuscript. I thank Victor Brovkin, Julia Ponratz, Cristof Heinze, Christian Reick, Thomas Raddaz, Martin Claussen, Katleen de Flander, and Franz Mauelshagen for fruitful discussion of the approach and preliminary results. While working on this study GC was funded by the IASS fellowship.
References
Ainsworth, E. A., Yendrek, C. R., Sitch, S., Collins, W. J., and Emberson, L. D. (2012). The effects of tropospheric ozone on net primary productivity and implications for climate change. Annu. Rev. Plant Biol. 63, 637–661. doi: 10.1146/annurev-arplant-042110-103829
Chapin, S. F. III., Mooney, H. A., Chapin, M. C., and Matson, P. A. (2002). Principles of Terrestrial Ecosystem Ecology. NewYork, NY: Springer.
Churkina, G. (2008). Modeling the carbon cycle of urban systems. Ecol. Model. 216, 107–113. doi: 10.1016/j.ecolmodel.2008.03.006
Churkina, G., Brown, D., and Keoleian, G. A. (2010a). Carbon stored in human settlements: the conterminous US. Global Change Biol. 16, 135–143. doi: 10.1111/j.1365-2486.2009.02002.x
Churkina, G., Trusilova, K., Vetter, M., and Dentener, F. J. (2007). Contributions of nitrogen deposition and forest re-growth to land carbon uptake. Carbon Balance Manage. 2:5. doi: 10.1186/1750-0680-2-5
Churkina, G., Zaehle, S., Hughes, J., Viovy, N., Chen, Y., Jung, M., et al. (2010b). Interactions between nitrogen deposition, land cover conversion, and climate change determine the contemporary carbon balance of Europe. Biogeosciences 7, 2749–2764. doi: 10.5194/bg-7-2749-2010
Ciais, P., Sabine, C., Bala, G., Bopp, L., Brovkin, V., Canadell, J., et al. (2013). “Carbon and other biogeochemical cycles,” in Climate Change 2013: The Physical Science Basis. Contribution of Working Group I to the Fifth Assessment Report of the Intergovernmental Panel on Climate Change, eds T. F. Stocker, D. Qin, G.-K. Plattner, M. Tignor, S. K. Allen, J. Boschung, et al. (Cambridge, UK, NewYork, NY: Cambridge University Press), 465–570.
Creutzig, F., Baiocchi, G., Bierkandt, R., Pichler, P.-P., and Seto, K. C. (2015). Global typology of urban energy use and potentials for an urbanization mitigation wedge. Proc. Natl. Acad. Sci. U.S.A. 112, 6283–6288. doi: 10.1073/pnas.1315545112
Duce, R. A., LaRoche, J., Altieri, K., Arrigo, K. R., Baker, A. R., Capone, D. G., et al. (2008). Impacts of atmospheric anthropogenic nitrogen on the open ocean. Science 320, 893–897. doi: 10.1126/science.1150369
El-Fadel, M., Findikakis, A. N., and Leckie, J. O. (1997). Environmental impacts of solid waste landfilling. J. Environ. Manage. 50, 1–25.
FAO, (2015). FA0STAT: Population. Available online at: http://faostat3.fao.org/download/O/OA/E (Accessed August 4, 2014).
Finzi, A. C., Norby, R. J., Calfapietra, C., Gallet-Budynek, A., Gielen, B., Holmes, W. E., et al. (2007). Increases in nitrogen uptake rather than nitrogen-use efficiency support higher rates of temperate forest productivity under elevated CO2. Proc. Nat. Acad. Sci. U.S.A. 104, 14014–14019. doi: 10.1073/pnas.0706518104
Gajda, J. (2001). Absorption of Atmospheric Carbon dioxide by Portland Cement Concrete. Skokie, IL: Portland Cement Association.
Gajda, J., and Miller, F. M. (2000). Concrete as a Sink for Atmospheric Carbon dioxide: A Literature Review and Estimation of CO2 Absorption by Portland Cement Concrete. Skokie, IL: Portland Cement Association.
Gregg, J. W., Jones, C. G., and Dawson, T. E. (2003). Urbanization effects on tree growth in the vicinity of New York City. Nature 424, 183–187. doi: 10.1038/nature01728
Haberl, H., Erb, K. H., Krausmann, F., Gaube, V., Bondeau, A., Plutzar, C., et al. (2007). Quantifying and mapping the human appropriation of net primary production in earth's terrestrial ecosystems. Proc. Natl. Acad. Sci. U.S.A. 104, 12942–12947. doi: 10.1073/pnas.0704243104
Hoornweg, D., and Bhada-Tata, P. (2012). What a Waste: A Global Review of Solid Waste Management. Urban Development Series - Knowledge Papers. Washington, DC: World Bank.
Hutyra, L. R., Duren, R., Gurney, K. R., Grimm, N., Kort, E. A., Larson, E., et al. (2014). Urbanization and the carbon cycle: current capabilities and research outlook from the natural sciences perspective. Earth Future 2:2014EF000255. doi: 10.1002/2014ef000255
Kjellsen, K. O., Guimaraes, M., and Nilsson, A. (2005). The CO2 Balance of Concrete in a Life Cycle Perspective. Oslo: Nordic Innovation Centre.
Kroeze, C., Hofstra, N., Ivens, W., Löhr, A., Strokal, M., and van Wijnen, J. (2013). The links between global carbon, water and nutrient cycles in an urbanizing world—the case of coastal eutrophication. Curr. Opin. Environ. Sustainability 5, 566–572. doi: 10.1016/j.cosust.2013.11.004
Lavalle, C., Demicheli, L., Kasanko, M., McCormick, N., Barredo, J., Turchini, M., et al. (2002). Towards an Urban Atlas. Assessment of Spatial Data on 25 European Cities and Urban Areas. Copenhagen: European Environmental Agency.
Le Quéré, C., Moriarty, R., Andrew, R. M., Peters, G. P., Ciais, P., Friedlingstein, P., et al. (2015). Global carbon budget 2014. Earth Syst. Sci. Data 7, 47–85. doi: 10.5194/essd-7-47-2015
Likens, G. E., Driscoll, C. T., and Buso, D. C. (1996). Long-term effects of acid rain: response and recovery of a forest ecosystem. Science 272, 244–246. doi: 10.1126/science.272.5259.244
Lou, X. F., and Nair, J. (2009). The impact of landfilling and composting on greenhouse gas emissions - A review. Bioresour. Technol. 100, 3792–3798. doi: 10.1016/j.biortech.2008.12.006
Luyssaert, S., Inglima, I., Jung, M., Richardson, A. D., Reichstein, M., Papale, D., et al. (2007). CO2 balance of boreal, temperate, and tropical forests derived from a global database. Global Change Biol. 13, 2509–2537. doi: 10.1111/j.1365-2486.2007.01439.x
Mohareb, E., and Kennedy, C. (2012). Gross direct and embodied carbon sinks for urban inventories. J. Indust. Ecol. 16, 302–316. doi: 10.1111/j.1530-9290.2011.00445.x
Nowak, D. J., and Crane, D. E. (2002). Carbon storage and sequestration by urban trees in the USA. Environ. Pollut. 116, 381–389. doi: 10.1016/S0269-7491(01)00214-7
Pataki, D., Alig, R. J., Fung, A. S., Golubiewski, N. E., Kennedy, C. A., McPherson, E. G., et al. (2006). Urban ecosystems and the North American carbon cycle. Global Change Biol. 12, 2092–2102. doi: 10.1111/j.1365-2486.2006.01242.x
Pataki, D. E., Carreiro, M. M., Cherrier, J., Grulke, N. E., Jennings, V., Pincetl, S., et al. (2011). Coupling biogeochemical cycles in urban environments: ecosystem services, green solutions, and misconceptions. Front. Ecol. Environ. 9, 27–36. doi: 10.1890/090220
Powell, R. L., Roberts, D. A., Dennison, P. E., and Hess, L. L. (2007). Sub-pixel mapping of urban land cover using multiple endmember spectral mixture analysis: Manaus, Brazil. Remote Sens. Environ. 106, 253–267. doi: 10.1016/j.rse.2006.09.005
Reich, P. B., Walters, M. B., Ellsworth, D. S., Vose, J. M., Volin, J. C., Gresham, C., et al. (1998). Relationships of leaf dark respiration to leaf nitrogen, specific leaf area and leaf life-span: a test across biomes and functional groups. Oecologia 114, 471–482. doi: 10.1007/s004420050471
Schneider, A., Friedl, M. A., and Potere, D. (2009). A new map of global urban extent from MODIS satellite data. Environ. Res. Lett. 4:044003. doi: 10.1088/1748-9326/4/4/044003
Seto, K. C., Dhakal, S., Bigiol, A., Blanco, H., Delgado, G. C., Dewar, D., et al. (2014). “Human settlements, infrastructure and spatial planning,” in Climate Change 2014: Mitigation of Climate Change. Contribution of Working Group III to the Fifth Assessment Report of the Intergovernmental Panel on Climate Change. eds O. Edenhofer, R. Pichs-Madruga, Y. Sokona, E. Farahani, S. Kadner, K. Seyboth (Cambridge, UK; New York, NY: Cambridge University Press), 923–1000.
Seto, K. C., Fragkias, M., Güneralp, B., and Reilly, M. K. (2011). A Meta-Analysis of global urban land expansion. PLoS ONE 6:e23777. doi: 10.1371/journal.pone.0023777
Seto, K. C., Güneralp, B., and Hutyra, L. R. (2012). Global forecasts of urban expansion to 2030 and direct impacts on biodiversity and carbon pools. Proc Natl Acad Sci U.S.A. 109, 16083–16088. doi: 10.1073/pnas.1211658109
Tigges, J., Lakes, T., and Hostert, P. (2013). Urban vegetation classification: benefits of multitemporal RapidEye satellite data. Remote Sens. Environ. 136, 66–75. doi: 10.1016/j.rse.2013.05.001
Trusilova, K., and Churkina, G. (2008). The response of the terrestrial biosphere to urbanization: land cover conversion, climate, and urban pollution. Biogeosciences 5, 1505–1515. doi: 10.5194/bg-5-1505-2008
Van Dingenen, R., Dentener, F. J., Raes, F., Krol, M. C., Emberson, L., and Cofala, J. (2009). The global impact of ozone on agricultural crop yields under current and future air quality legislation. Atmos. Environ. 43, 604–618. doi: 10.1016/j.atmosenv.2008.10.033
Vitousek, P. M., Ehrlich, P. R., Ehrlich, A. H., and Matson, P. A. (1986). Human appropriation of the products of photosynthesis. Bioscience 36, 368–373. doi: 10.2307/1310258
Zhao, S., Zhu, C., Zhou, D., Huang, D., and Werner, J. (2013). Organic Carbon storage in China's urban areas. PLoS ONE 8:e71975. doi: 10.1371/journal.pone.0071975
Zila, I., and Calkovska, A. (2011). Effects of Elevated body temperature on control of breathing. Acta Med. Martiniana 11, 24–30. doi: 10.2478/v10201-011-0008-6
Keywords: city, carbon cycle, carbon sequestration, carbon emissions, urban vegetation, fossil fuels, building, landfill
Citation: Churkina G (2016) The Role of Urbanization in the Global Carbon Cycle. Front. Ecol. Evol. 3:144. doi: 10.3389/fevo.2015.00144
Received: 09 September 2015; Accepted: 07 December 2015;
Published: 11 January 2016.
Edited by:
Joseph P. McFadden, University of California, Santa Barbara, USACopyright © 2016 Churkina. This is an open-access article distributed under the terms of the Creative Commons Attribution License (CC BY). The use, distribution or reproduction in other forums is permitted, provided the original author(s) or licensor are credited and that the original publication in this journal is cited, in accordance with accepted academic practice. No use, distribution or reproduction is permitted which does not comply with these terms.
*Correspondence: Galina Churkina, galina@churkina.org