The Distribution of Soil Insects across Three Spatial Scales in Agricultural Grassland
 Carly M. Benefer
 Karzan S. D'Ahmed
 Rod P. Blackshaw3
  Hadewij M. Sint
 Phil J. Murray
- 1School of Biological Sciences, Plymouth University, Plymouth, UK
- 2Department of Plant Protection, Salahaddin University–Erbil, Erbil, Iraq
- 3Blackshaw Research and Consultancy, Chudleigh, UK
- 4Rothamsted Research, Okehampton, UK
The effects of specific environmental factors on abundance and distribution of some individual soil insect taxa is known, but how scale influences spatial distribution is less well evaluated, particularly at the community level. However, given that many soil insects are pests or beneficial natural enemies, and that collectively they play a role in soil processes, this information is of potential value for predictive modeling and in furthering our understanding of soil ecology and management. The objectives of this study were to characterize the spatial distribution, relative population sizes, effect of sampling scale and taxa co-occurrence on a range of soil insects at the family level over 2 years. Soil cores were taken from agricultural grassland soils across three different sampling scales (farm, field, and core) using a systematic sampling approach. Spatial distribution was assessed using the variance-to-mean (VMR) ratio and taxa distribution plots and the contribution of scale, spatial (geographical location), and biotic (presence-absence of other species) factors determined using deviance partitioning. Tipulid larvae (leatherjackets) were the most abundant taxa in both years, but the composition of other Dipteran and Coleopteran taxa varied between years. The VMRs revealed differences in spatial distribution between taxa across scales and years, showing a range of underlying distributional patterns. Scale was the most important factor influencing species distributions, but a large proportion of deviance remained unexplained and there was much variation between taxa, suggesting biological and scale-specific factors are driving distributions, in agreement with a previous study.
Introduction
Whilst there is increasing research interest and focus on the roles of soil organisms in above and belowground processes and their interactions (e.g., Johnson et al., 2013), there remains a considerable lack of knowledge on the abundance and distribution of soil insects at an individual and a community level. Grassland soils support a diverse range of insects, many of which are direct pests of grass (e.g., Tipulidae) or nearby arable crops (e.g., wireworms) when present in sufficient numbers. Conversely, the stable habitat that grassland provides is also of value to beneficial natural enemies such as Carabids, adults, and larvae of which can help to suppress pest populations to non-damaging levels (Kromp, 1999). This is likely to be important in mixed farming systems that form a mosaic of both cropped and grass fields, since grasslands can provide a reservoir of generalist natural enemies (Gravesen and Toft, 1987). Therefore, an understanding of the basic biology and ecology of these organisms is important for implementing sustainable management strategies. In order to do this, knowledge of the spatial structuring of populations, and the underlying mechanisms leading to this, is needed. It is known that there is natural stochasticity in insect abundance over short timescales, linked to their high reproductive rate and environmental factors (Schowalter, 2011), such as temperature, moisture, food availability and soil texture (King, 1939) and that abundance and distributions can vary even between even closely related species (Benefer et al., 2012). While factors affecting the biology of some notable pest taxa (e.g., wireworms) have been particularly well-studied in the laboratory and in the field at small scales (e.g., Campbell, 1937; Lees, 1943; Furlan, 1996), this has rarely been replicated at larger scales. Benefer et al. (2010) investigated the effects of spatial, biotic and scale variables on observed soil insect distributions and associations in a grassland soil, focusing on the soil core, site (within field), and field scale. It was found that the observed distributions and associations of most taxa changed according to scale, with this being the most important variable influencing distributions.
In this study, we used the North Wyke Farm Platform, which is a highly instrumented and monitored grassland farm to:
1. Characterize the spatial distribution of subterranean grassland insects over three spatial and time scales: soil core, field and farm, and 2 years.
2. To assess the relative population sizes and associations of soil insects at the family level over these spatial scales.
3. To determine the relative importance of scale, spatial, and biotic factors on the observed distribution and abundance of soil insects.
With limitations on the chemical controls that can now be implemented to manage grassland pests, understanding pest (and natural enemy) distribution and using this information in predictive modeling has increasing importance for sustainable management. Assessing these distributions and associations in the same location over time aids in strengthening our understanding of the variation in ecological processes occurring in the soil; this is again important for making predictions based on observational data. Use of the same data analysis approach as Benefer et al. (2010) has allowed a direct comparison of the use of these techniques for assessing soil insect distributions across sites, and tests whether the conclusions of the earlier study are robust or site-specific.
Methods
Study Site and Soil Sampling
The sampling was conducted on the North Wyke Farm Platform (NWFP), in south west England, UK (Geographic Location: Lat: 50.73237; Long: −3.99635) (Griffith et al., 2013). During the study, the NWFP was managed as a conventional Beef and Sheep enterprise based on perennial ryegrass (Lolium perenne) dominant permanent pastures receiving 200 kg N ha−1 per annum. The soil types common on the NWFP are typical of soils under grassland management in England. The soil is predominantly of 2 similar soil types, Harrod and Hogan (2008), which are of a slightly stony clay loam topsoil (~36% clay) overlying mottled stoney clay (~60% clay), derived from the carboniferous Culm measures. Below 30 cm the soil is highly impermeable to water and is seasonally waterlogged. The mean annual rainfall (1982–2011) at the North Wyke site was 1042 mm with a mean temperature ranging from 6.6-13.4°C. North Wyke has relatively high and consistent summer rainfall which is characteristic of the major agricultural grassland areas in the UK. It has been calculated (Wilkins, 1982) that the environmental conditions are sufficient to support 280 days of grass growth, but the grazing season is restricted to ~180 days due to soil wetness.
Soil samples were taken from 19 permanent grassland fields (>5 years old) split over 3 farms, ranging from 1.3 to 7.9 ha, with a total study area of 67 ha. Sampling points were plotted on a 25 m sampling grid using ESRI ArcMap (V.10) GIS software and determined in the field using a GPS system (a Trimble R8 base station with an R6 rover and TSC3 controller). Samples were taken between April and May 2012 and repeated between April 2013 and May 2013. Soil cores were taken using a standard soil corer with a 6.5 cm plastic pipe which was inserted to a depth of 10 cm. A total of 2260 soil samples were collected (1130 in each year, representing a total sampled area of ~9 m2). The individual samples were placed in labeled plastic bags and held at 4°C until processed, within 14 days of sampling.
Extraction and Identification of Soil Insects
A modified heat extraction method based on that of Blasdale (1974) was used to recover soil insects from the cores over a 24 h period. The modified apparatus consists of two layers, each layer holding 25 soil samples of 6.5 cm diameter. The insects collected were stored in 70% ethanol before being individually identified to family level using morphological keys (Freeman, 1983; Stubbs and Drake, 2001; Luff, 2007). Some specimens which could not be identified to Family with confidence were sent to the Natural History Museum, London, including those in the families Scatopsidae, Anthomyiidae and two types of Dolichopodidae larvae: Dolichopodidae “type A” was subsequently further identified as belonging to the Genus Campsicnemus, while Dolichopodidae “type B” was classified as an undescribed larva. In addition, there were larval individuals of an unknown beetle family which were labeled as “unknown Coleoptera.”
Data Analysis
To visualize the distribution of each taxa across the sampling area in each year, the British National Grid coordinates (Easting and Northing) of each soil core sample were used to create a spatial distribution map for each taxa using ArcGIS 10.2. The distribution pattern (aggregated, random, or uniform) of each taxon was determined using variance-to-mean ratios (VMR) as an index of dispersion and indication of underlying patterns in abundance data (Benefer et al., 2010), using the mean and variance of the abundance data calculated separately for each scale (farm: 3 data points, field: 19 data points, and core: 1130 data points). In both sampling years there were a large number of cores that did not have any insects so we used a Generalized Linear Model (GLM) with a binomial distribution and logistic link function to determine the relative importance (measured by deviance explained) of space (geographical coordinates), biotic influences (presence/absence data for all other taxa), and scale (a nominal variable, divided into “farm” and “field” for each taxon in each year). Core scale data were not included due to the high number of zero counts (Legendre and Legendre, 1998; Lobo et al., 2002; Benefer et al., 2010).
Results
Taxa Abundance and Distribution across the Sampling Site
A total of 512 adult and larval insects were recovered (233 in 2012 and 279 in 2013), representing a total of 13 families of Coleoptera, Diptera, and Lepidoptera (Tables 1, 2). The larvae of Tipulidae (leatherjackets) were the most abundant taxa recovered in both years (45.5 and 41.9% in 2012 and 2013 respectively). While the abundance and proportion of the samples collected remained similar across years for some taxa (e.g., Muscidae), for others there was a substantial difference. For example, Sciaridae were the second most abundant insect recovered in 2012 (11.6% of all samples), but no individuals of this family were found in 2013, and several new families were recovered in 2013 that were not present in samples in 2012 and vice versa; only 6 taxa were found in both years (Tables 1, 2). Leatherjackets were found across the NWFP, showing a similar distribution in 2012 and 2013 (Figures 1, 2). Several taxa showed a tendency to be distributed on or close to the field margins, some across both years, including adult and larval Carabidae, Muscidae, Bibionidae, and Dolichopodidae. For some taxa found in both years there was also a change in distribution from the northern-most to central/southern fields, e.g., Stratiomyidae and Carabid adults and larvae (Figure 1).
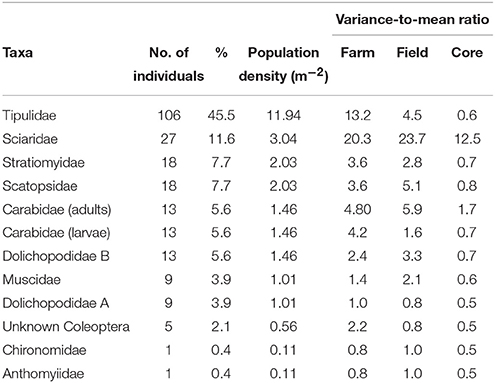
Table 1. The number of individuals of each taxa, their percentage of the total 233 insects obtained from 1130 cores collected in 2012 over 19 fields in 3 farms, the population density based on an area of approximately 9 m2 (the total area of soil cores taken from the study) and the variance-to-mean ratio for the taxa collected at the farm, field, and core scale in 2012.
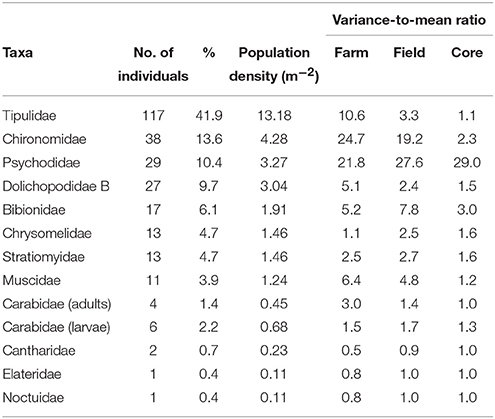
Table 2. The number of individuals of each taxa, their percentage of the total 279 insects obtained from 1130 cores collected in 2013 over 19 fields in 3 farms, the population density based on an area of approximately 9 m2 (the total area of soil cores taken from the study) and the variance-to-mean ratio for the taxa collected at the farm, field, and core scale in 2013.
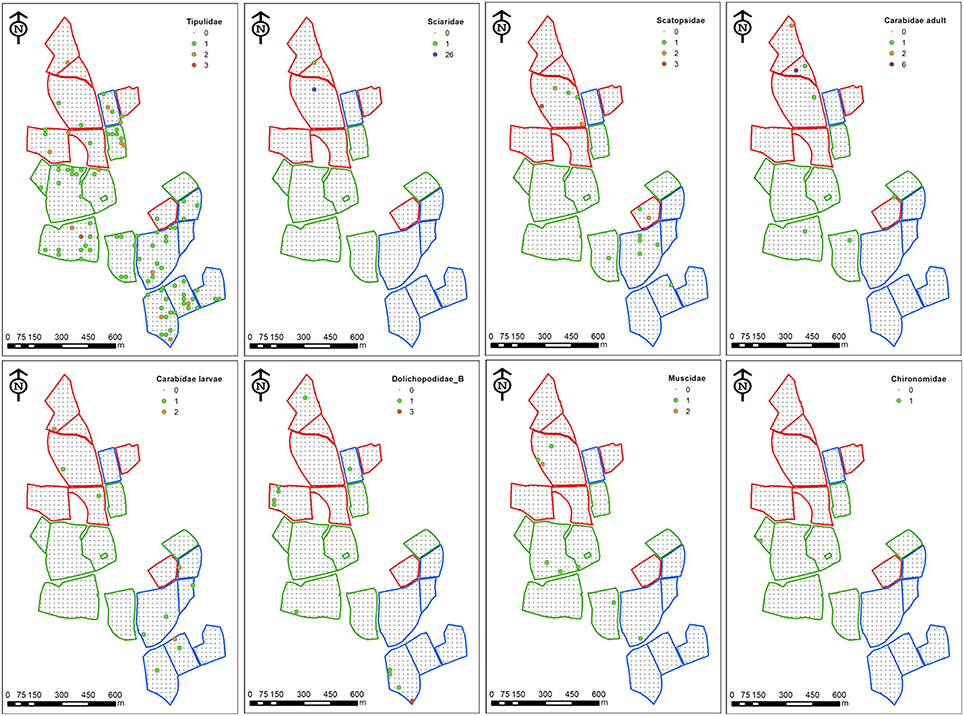
Figure 1. Distribution maps for selected key taxa on the North Wyke Farm Platform in 2012. Individual soil cores were taken (1130 in total) across 19 fields in three farms (red boundaries = Farm 1, green = Farm 2 and blue = Farm 3). Large circles represent sampling points containing individuals, colored by abundance (see individual keys).
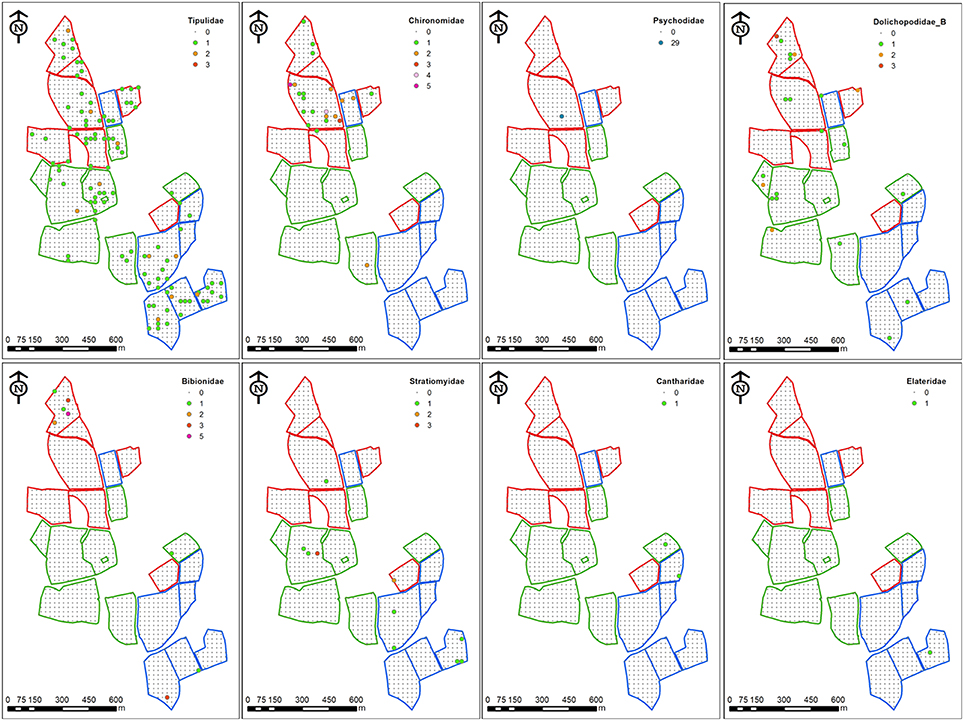
Figure 2. Distribution maps of selected taxa on the North Wyke Farm Platform in 2013. Individual soil cores were taken (1130 in total) across 19 fields in three farms (red boundaries = Farm 1, green = Farm 2 and blue = Farm 3). Large circles represent sampling points containing individuals, colored by abundance (see individual keys).
Spatial Distribution
The underlying spatial distribution, as indicated by the variance/mean ratio (VMR) as an index of dispersion, varied between taxa, and generally between years for those taxa found in both 2012 and 2013 (Tables 3, 4). Tipulidae were aggregated at the farm and field scale in both years (VMR >1), but had a more random distribution in 2013 at the core scale (VMR = 1), compared to a more uniform one (VMR < 1) in 2012. Generally, taxa were more aggregated or randomly distributed at the field and farm scale and uniformly (in 2012) or randomly (in 2013) distributed at the core scale. Notable exceptions were Sciaridae, which was highly aggregated at all scales in 2012, and Psychodidae, highly aggregated at all scales in 2013.
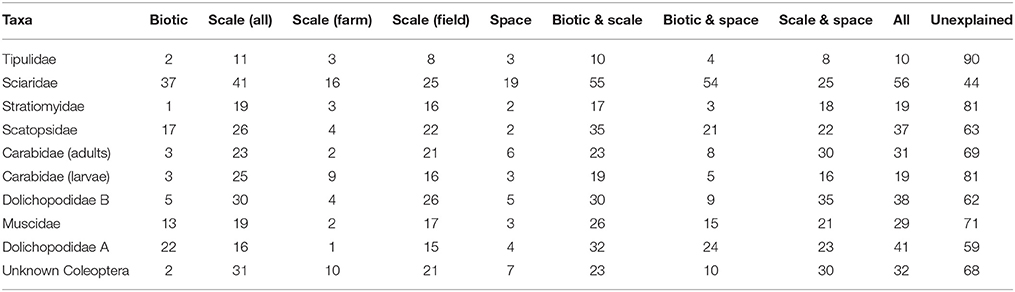
Table 3. The percentage of deviance explained by a GLM with binomial distribution through partitioning the dependent variable (species presence/absence, for taxa with ≥5 individuals) between three groups of explanatory variables (biotic, scale, and space), alone and in combination, and the deviance unexplained by the variables in this study for each taxa in 2012.
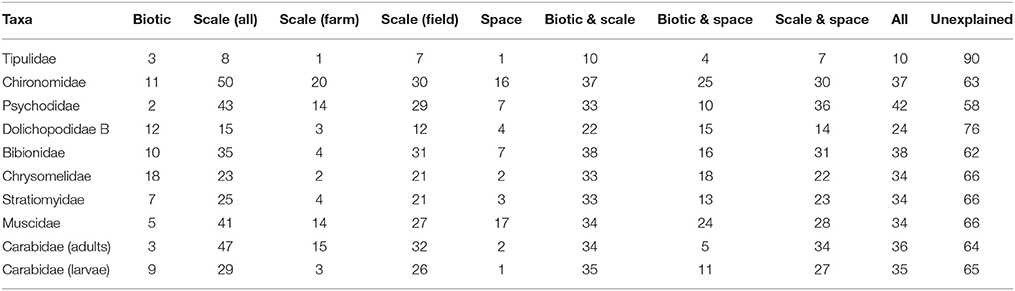
Table 4. The percentage of deviance explained by a GLM with binomial distribution through partitioning the dependent variable (species presence/absence, for taxa with ≥5 individuals) between three groups of explanatory variables (biotic, scale and space), alone and in combination, and the deviance unexplained by the variables in this study for each taxa in 2013.
Deviance Partitioning
The percentage of total deviance in taxa presence/absence explained by scale, space and biotic variables was generally low for both years, ranging from 10% for Tipulidae (2012 and 2013) to 56% for Sciaridae (in 2013; Tables 3, 4). Individually, scale explained the most variation in this data, accounting for between 8 and 50% of deviance (for Tipulidae and Chironomidae in 2013, respectively) whereas spatial and biotic factors had less of an influence on most taxa. At the core scale (excluded from deviance partitioning due to high zero counts), 6 out of 172 cores containing taxa in 2012, and 12 out of 201 cores containing taxa in 2013, contained at least two different taxa. The observed and predicted co-occurrence was not significantly different in a chi-squared test (χ2 = 3.39, df = 39, p > 0.05, 2012; χ2 = 4, df = 51, p > 0.05, 2013), suggesting there was a random distribution at this scale.
Discussion
Abundance and Community Composition
Generally, the abundance of each taxon recovered was relatively low, but the overall community abundance was similar between sampling years. Tipulidae were the most abundant family found in both years, and were spread throughout the NWFP, but presence and abundance of other taxa was variable between the two sampling years (Tables 1, 2). The high relative abundance of leatherjackets is in accordance with the findings of Benefer et al. (2010), who carried out a similar study in an agricultural grassland in south Devon. However, in that study Sciaridae and Bibionidae also shared this dominance, accounting for between 20–28% of the insects recovered. Here, leatherjackets comprised 45.5% (2012) and 41.9% (2013) of the population, but Sciaridae were the second most abundant taxa in 2012 (11.6%) and Bibionidae the fifth most abundant in 2013 (6.1%).
Tipulidae is the biggest Dipteran family in the UK, with more than 300 species, and previous UK studies indicate that they can occur in large populations, but are greatest in parts of northern and south eastern England (Smith, 1989). In grassland soils, leatherjackets have been recorded in relatively high abundances in comparison with other taxa (Buckle, 1923; Staley et al., 2007), as we found in this study; as an extension to the current study we used DNA barcoding to identify the leatherjackets collected (Benefer et al., unpublished), finding that most were T. paludosa, in concurrence with earlier surveys by Humphreys et al. (1993). Blackshaw and Hicks (2013) reported finding no adult T. oleracea in the agricultural grassland that they surveyed, but in the current study adults of this species were present in aboveground. While adult T. oleracea may be found in agricultural grassland, they have different oviposition preferences to T. paludosa and do not lay eggs here. T. oleracea are strong fliers and therefore may be passing through these fields to more suitable oviposition sites (Blackshaw et al., 1996). Recent studies have shown that populations of T. paludosa are regulated by density-dependent feedback at regional and field scales (Blackshaw and Petrovskii, 2007; Bearup et al., 2013), but that populations are relatively stable within and between generations (Blackshaw and Moore, 2012). However, while the population dynamics of leatherjackets have been relatively well-studied, this is not the case for most other soil taxa, with some incongruity in population abundance recorded in grassland soils e.g., Bibionidae and Sciaridae (Frouz, 1999; D'Arcy-Burt and Blackshaw, 1991; Benefer et al., 2010). Taken together, this limited information suggests that while for individual taxa (leatherjackets) populations vary relatively little, soil insect communities as a whole are not necessarily stable over time or space, and that many interacting factors are likely to be driving this.
Only one individual from each of the families Noctuidae and Elateridae were found. While the populations of Lepidopteran larvae are known to be generally low in grassland ecosystems (Curry, 1994), this is a surprising result for Elateridae. Elaterid larvae (wireworms) are traditionally associated with grassland soil in the UK and Europe (Traugott et al., 2015), and adult male pheromone trapping in previous and subsequent years on nearby areas at the North Wyke site suggests that adults at least are present in grass fields (C. Benefer, unpublished data). However, as for the closely related Tipulid species described above, species-specific differences in dispersal ability/oviposition preferences may also be the case for Agriotes click beetles and wireworms (the most common agricultural species in the UK and Europe). For example, A. lineatus which are trapped in abundance aboveground are not always found belowground in the same fields, in contrast to two other closely related species (Benefer et al., 2012). More information on oviposition preferences of aboveground adult stages in general is required in order to understand how this affects the distribution and abundance of larval stages belowground (Traugott et al., 2015). As with Bibionidae (Blackshaw and D'Arcy-Burt, 1993), the capture of wireworms can be affected by sampling method (Benefer et al., 2012), and as with many other soil taxa, timing of sampling can also impact upon the number of individuals recovered since a number of abiotic factors, temperature, and moisture in particular, alter activity and movement in the soil, both horizontally (Lafrance, 1968; Fisher et al., 1975) and vertically (Jung et al., 2014). In comparison to the findings of Benefer et al. (2010) at least, this may account for some of the differences in abundance and composition, since sampling was carried out earlier (from January to March) in that study.
Species Distribution across Spatial Scales and Years
How, and which, organisms interact is key to understanding community ecology in different systems, and one that has received more attention in recent years due to the realization that activity of belowground insects (particularly root herbivores), may play a considerable functional role in processes both below and aboveground, mediated through the host plant (e.g., Johnson et al., 2013). The interspecific competition for habitat is one of the primary biotic factors influencing the abundance, distribution, and diversity of ecological communities (Begon et al., 2009) but these interactions vary between sampling scales. Many of the families collected in this study contain species that are known root herbivores (Tipulidae, Sciaridae, Bibionidae, Chrysomelidae, Stratiomyiidae, Muscidae, Anthomyiidae), and a large proportion of these can be pests, but those in families associated with predatory behavior (Carabidae, Cantharidae, Dolichopodidae) were also collected. The associations of some of these beneficial natural enemies with root herbivores at the farm and field scale (Figures 1, 2) suggests they have the potential to have a regulatory effect on pest populations.
While the presence/absence of the specific taxa found in this study to not appear to have an influence on distribution, other biotic factors, such as the age structure of the population, may be involved. For example, when they reach the fourth larval instar, leatherjackets move to sites with favorable soil moisture and in the process change their spatial pattern (Blackshaw, 1999; Petersen et al., 2013); in the present study Tipulidae had a more uniform distribution at the core scale in 2012 (VMR < 1; Table 3), and a more random distribution at this scale in 2013 (VMR = 1; Table 4). In comparison, the opposite was true for Dolichopodidae type B, which was more abundant in 2013. Many insects are able to quickly colonize new habitats because of their high reproductive capacity, which is aided at high populations, but at low populations they may be limited by their limited size, life span and dependence on chemical communication for locating mates (Schowalter, 2011). Therefore, differences in the abundance of taxa could partly explain some of the differences in distribution observed here between years, and particularly for low abundance taxa suggests caution needs to be applied when interpreting such data.
Apparent co-occurrence of some taxa may indicate similar habitat and environmental preferences, which likely affect distribution at larger scales (Wiens, 1989). For example some taxa, including Muscidae (in both years), Dolichopodidae type A, Chironomidae, and Bibionidae, tended to be found closer to the field margins (Figures 1, 2). Larval stages of Chironomidae and Dolichopodidae are semi-aquatic and prefer high moisture environments (Eisenbeis and Wichard, 1987), and Muscidae and Bibionidae are often found in areas with high organic matter content (Hill, 1987) so common preferences for these and/or other unmeasured factors may have influenced the distributions seen here.
However, it is possible that the taxonomic resolution also affects observed co-occurrences. Here, due to time, expertise and resource limitations (as in many soil ecological studies), the family rather than species level was used as the taxonomic grouping, which may mean that any species-specific differences have been lost. Benefer et al. (2010) identified wireworms and Bibionidae to species level, finding some consistent associations/dissociations between species, but also between Tipulidae and Sciaridae at the family level. In Bibionidae, for example, Bibio spp. are found in close proximity to hedgerows whereas Dilophus spp. are found across fields (D'Arcy-Burt and Blackshaw, 1991). In Collembola, it has been shown that occurrence-habitat preference relationships were better explained at the family level, where species in the same family with similar habitat preferences congregated, but this was less clear at the genus and species levels, possibly due to competitive exclusion at low taxonomic levels, and convergent evolution/co-adaptation at high taxonomic levels (Ponge and Salmon, 2013). To some extent larval dispersal ability and adult oviposition preferences may be involved in this, but for many soil insect taxa this is largely unknown (Benefer and Blackshaw, 2013). This suggests that there may not be a straightforward relationship between co-occurrence and taxonomic level. Further investigation of the impact of this taxonomic component on soil insect distribution (previous studies have mainly been carried out at the mesofaunal level; e.g., Ponge and Salmon, 2013) would aid our understanding of how biological components, such as phylogenetic relationship and species traits, interact with scale and spatial effects. DNA based techniques, such as metabarcoding, yet to be applied to soil insect ecological studies, may be of use here (Benefer and Blackshaw, 2013), particularly across multiple sites and over time where the large sample size precludes ecological studies using traditional morphological identification and soil processing techniques.
Effects of Scale, Spatial, and Biotic Variables on the Distribution of Taxa
There are several key similarities in the results of this study as compared to that of Benefer et al. (2010) in terms of the extent to which scale, spatial and biotic variables explain the distribution of taxa. In the current study, unexplained deviance was high for most taxa (44–90%; Tables 3, 4) in both years, comparable to the 57–88% of deviance unexplained by the same variables in Benefer et al. (2010) study. Similar levels of deviance were explained by the scale, spatial and biotic variables for leatherjackets (11 and 8% in 2012 and 2013 respectively in this study, 12% in Benefer et al., 2010) and scale was the single most important variable in explaining deviance, accounting for up to 50% of the total deviance in this study, and 36% of total deviance by Benefer et al. (2010). Thus, in broad terms, the present study has confirmed the results and conclusions reached by Benefer et al. (2010). This replication of results (rarely attempted in many ecological studies), across sites and years confirms that these variables (alone and in combination) are ineffective in explaining the distribution of a range of grassland soil insects, and that other unmeasured factors (as discussed) may have a more important role for many.
Some of the differences in the amount of deviance explained by individual variables could give some indication of differences in the biology of taxa that is linked to their observed distributions and abundances. For example, in 2012 the biotic variable for Dolichopodidae type A explained 22% of deviance, but only 5% of deviance for Dolichopodidae type B (Table 3), and only Dolichopodidae type B was found in 2013, demonstrating possible differences in, for example, growth, predation, competition and social aggregation (Borcard et al., 1992). On the other hand, that space and biotic variables explained so little of the deviance for Carabidae adults and larvae in 2012 and 2013 suggests that biotic mechanisms have less of an impact than scale and that environmental factors may be more important for these taxa. For example, adult Carabid spatial distribution aboveground is known to be affected by interstitial habitats, which in turn are affected by management (Thomas et al., 2002). It should also be noted that abundances of some taxa, for example unknown Coleoptera in 2012 and Carabidae adults and larvae in 2013, were particularly low, and so the patterns observed here should be interpreted with caution; it is possible that these may change at greater densities, and as Benefer et al. (2010) point out, this could itself be another scaling factor.
In conclusion, the findings of this study in terms of taxa abundance and factors affecting the distribution of soil insect taxa across spatial scales have replicated those of Benefer et al. (2010) in particular, but also others. This lends support to the robustness and reality of the data. Taken together, this suggests that responses by different taxa are variable, and that more complex studies and datasets are needed to fully explain distributions of soil insect communities over time and space. For pest management, in particular, having information on all important influencing factors and their spatio-temporal interactions would help in predictive modeling of abundance and distributions (and ultimately crop damage and reduction of pesticide usage). More sophisticated models are now being produced for some taxa (e.g., wireworms; Jung et al., 2014) that are taking some of these factors into account, but there are still gaps in our knowledge concerning effects across time and space for different species.
Author Contributions
RB and PM conceptualized and designed the study. KD collected, processed and identified samples with help from CB with some of the collection. KD and CB analyzed data. HS produced the distribution maps. KD primarily interpreted data with contributions from RB, PM, and CB, and CB wrote the manuscript. All authors were involved in reviewing, revision and final approval of the manuscript.
Funding
This study was part of a ResM awarded to KD and funded by the Kurdistan Region Government and the Ministry of Higher Education through the Human Capacity Development Program–Round 1. The North Wyke Farm Platform is a BBSRC supported National Capability (BB/J004308).
Conflict of Interest Statement
The authors declare that the research was conducted in the absence of any commercial or financial relationships that could be construed as a potential conflict of interest.
Acknowledgments
The authors would like to thank Jane Akerman and Peter Smithers (Plymouth University) for their help in collecting, processing and identifying samples; Bruce Griffiths (Rothamsted Research – North Wyke) for providing GPS and maps; and Erica McAllister and colleagues of the Natural History Museum, London, for larval identifications. The North Wyke Farm Platform is a BBSRC supported National Capability (BB/J004308).
References
Bearup, D., Petrovskii, S., Blackshaw, R., and Hastings, A. (2013). Synchronized dynamics of Tipula paludosa metapopulation in a Southwestern Scotland agroecosystem: linking pattern to process. Am. Nat. 182, 393–409. doi: 10.1086/671162
Begon, M., Townsend, C. R., and Harper, J. L. (2009). Ecology: From Individuals to Ecosystems, 4th Edn. Oxford: Blackwell Science
Benefer, C. M., Andrew, P., Blackshaw, R. P., Ellis, J. S., and Knight, M. E. (2010). The spatial distribution of phytophagous insect larvae in grassland soils. Appl. Soil Ecol. 45, 269–274. doi: 10.1016/j.apsoil.2010.05.002
Benefer, C. M., and Blackshaw, R. P. (2013). Molecular approaches for studying root herbivores. Adv. Insect Physiol. 4, 219–255. doi: 10.1016/B978-0-12-417165-7.00005-2
Benefer, C. M., Knight, M. E., Ellis, J. S., Hicks, H., and Blackshaw, R. P. (2012). Understanding the relationship between adult and larval Agriotes distributions: the effect of sampling method, species identification and abiotic variables. Appl. Soil Ecol. 53, 39–48. doi: 10.1016/j.apsoil.2011.11.004
Blackshaw, R. (1999). “Economically important leatherjackets of grassland and cereals: biology, impact and control,” in ‘Sampling Leatherjackets in Grassland’ Sampling to Make Decisions: An Association of Applied Biologists Conference (Cambridge, UK), 95–102.
Blackshaw, R. P., Coll, C., Humphreys, I. C., and Stewart, R. M. (1996). The Epidemiology of a New Leatherjacket Pest (Tipula oleracea) of Winter Cereals in Northern Britain. [Online]. HGCA Project Report 120 Available online at: http://cereals.ahdb.org.uk/media/369259/project_report_120.pdf (Accessed January 23, 2016).
Blackshaw, R. P., and D'Arcy-Burt, S. (1993). A comparison of sampling methods for bibionid larvae (Diptera: Bibionidae) in grassland. Ann. Appl. Biol. 123, 527–530. doi: 10.1111/j.1744-7348.1993.tb04924.x
Blackshaw, R. P. Hicks, H. (2013). Distribution of adult stages of soil insect pests across an agricultural landscape. J. Pest Sci. 86, 53–62. doi: 10.1007/s10340-012-0413-6
Blackshaw, R. P., and Moore, J. (2012). Within-generation dynamics of leatherjackets (Tipula paludosa Meig.). J. Appl. Entomol. 136, 605–613. doi: 10.1111/j.1439-0418.2011.01696.x
Blackshaw, R. P., and Petrovskii, S. V. (2007). Limitation and regulation of ecological populations: a meta-analysis of Tipula paludosa field data. Math. Model. Nat. Phenom. 2, 46–62. doi: 10.1051/mmnp:2008025
Blasdale, P. (1974). A method of turf sampling and extraction of leatherjackets. Plant Pathol. 23, 14–16. doi: 10.1111/j.1365-3059.1974.tb01811.x
Borcard, D., Legendre, P., and Drapeau, P. (1992). Partialling out the spatial component of ecological variation. Ecology 73, 1045–1055. doi: 10.2307/1940179
Buckle, P. (1923). On the ecology of soil insects on agricultural land. J. Ecol. 11, 93–102. doi: 10.2307/2255605
Campbell, R. E. (1937). Temperature and moisture preferences of wireworms. Ecology 18, 479–489. doi: 10.2307/1930574
Curry, J. P. (1994). Grassland Invertebrates: Ecology, Influence on Soil Fertility and Effects on Plant Growth. New York, NY: Chapman & Hall.
D' Arcy-Burt, S. Blackshaw, R. P. (1991). Bibionids (Diptera: Bibionidae) in agricultural land: a review of damage, benefits, natural enemies and control. Ann. Appl. Biol. 118, 695–708.
Eisenbeis, G., and Wichard, W. (1987). Atlas of the Biology of Soil Arthropods. Berlin: Springer-Verlag.
Fisher, J., Keaster, A., and Fairchild, M. (1975). Seasonal vertical movement of wireworm larvae in Missouri: influence of soil temperature on the genera Melanotus Escholtz and Conoderus Escholtz. Ann. Entomol. Soc. Am. 68, 1071–1073. doi: 10.1093/aesa/68.6.1071
Freeman, P. (1983). Sciarid Flies Diptera, Sciaridae. Handbooks for the Identification of British Insects. London: Royal Entomological Society of London.
Frouz, J. (1999). Use of soil dwelling Diptera (Insecta, Diptera) as bioindicators: a review of ecological requirements and response to disturbance. Agric. Ecosyst. Environ.74, 167–186. doi: 10.1016/S0167-8809(99)00036-5
Furlan, L. (1996). The biology of Agriotes ustulatus Schaller (Col., Elateridae) I. Adults and oviposition. J. Appl. Entomol. 120, 269–274. doi: 10.1111/j.1439-0418.1996.tb01605.x
Gravesen, E., and Toft, S. (1987). Grass fields as reservoirs for polyphagous predators (Arthropoda) of aphids (Homopt., Aphididae). J. Appl. Entomol. 104, 461–473. doi: 10.1111/j.1439-0418.1987.tb00547.x
Griffith, B., Hawkins, J. M. B., Orr, R. J., Blackwell, M. S. A., and Murray, P. J. (2013). “The North Wyke Farm platform: Methodologies used in remote sensing of the water quantity and quality of drainage water,” in Proceedings of the 22nd International Grassland Congress, Sydney, Australia. 15–19 Sept. 2013. New South Wales Department of Primary Industry, Orange New South Wales, Australia. 1453–1455.
Harrod, T., and Hogan, D. (2008). The Soils of North Wyke and Rowden (revised edition of original report by T.R. Harrod, Soil Survey of England and Wales) [Online]. Available online at: http://www.rothamsted.ac.uk/sites/default/files/SoilsNWRowden.pdf (Accessed January 11, 2016).
Hill, D. S. (1987). Agricultural Insect Pests of Temperate Regions and their Control. Cambridge: Cambridge University Press.
Humphreys, I., Blackshaw, R., and Stewart, R. Coll, C. (1993). Differentiation between larvae of Tipula paludosa and Tipula oleracea (Diptera: Tipulidae) using isoelectric focusing, and their occurrence in grassland in northern Britain. Ann. Appl. Biol. 122, 1–8.
Johnson, S. N., Hiltpold, I., and Turlings, T. C. J. (2013). Behaviour and Physiology of Root Herbivores. Oxford: Academic Press.
Jung, J., Racca, P., Schmitt, J., and Kleinhenz, B. (2014). SIMAGRIO-W: development of a prediction model for wireworms in relation to soil moisture, temperature and type. J. Appl. Entomol. 138, 183–194. doi: 10.1111/jen.12021
King, K. M. (1939). Population studies of soil insects. Ecol. Monogr. 9, 270–286. doi: 10.2307/1943229
Kromp, B. (1999). Carabid beetles in sustainable agriculture: a review on pest control. Agric. Ecosyst. Environ. 74, 187–228. doi: 10.1016/S0167-8809(99)00037-7
Lafrance, J. (1968). The seasonal movements of wireworms (Coleoptera: Elateridae) in relation to soil moisture and temperature in the organic soils of southwestern Quebec. Can. Entomol. 100, 801–807. doi: 10.4039/Ent100801-8
Lees, A. D. (1943). On the behaviour of wireworms of the genus Agriotes Esch. (Coleoptera, Elateridae): II. Reactions to moisture. J. Exp. Biol. 20, 54–60.
Legendre, P., and Legendre, L. (1998). Numerical Ecology, 2nd Edn. Amsterdam: Elsevier Science & Technology B.V.
Luff, M. L. (2007). The Carabidae (ground beetles) of Britain and Ireland. 2nd Edn. Handbooks for the Identification of British Insects. London: Royal Entomological Society of London.
Lobo, J. M., Lumaret, J. P., and Jay-Robert, P. (2002). Modelling the species richness distribution of French dung beetles (Coleoptera, Scarabaeidae) and delimiting the predictive capacity of different groups of explanatory variables. Glob. Ecol. Biogeogr. 11, 265–277. doi: 10.1046/j.1466-822X.2002.00291.x
Petersen, M. J., Seto, M., and Peck, D. C. (2013). Linking the temporospatial distribution of an edaphic crane fly to its heterogeneous soil environment. Ecol. Entomol. 38, 585–595. doi: 10.1111/een.12058
Ponge, J.-F., and Salmon, S. (2013). Spatial and taxonomic correlates of species and species trait assemblages in soil invertebrate communities. Pedobiologia 56, 129–136. doi: 10.1016/j.pedobi.2013.02.001
Smith, K. G. V. (1989). An Introduction to the Immature Stages of British Flies: Diptera Larvae, with Notes on Eggs, Puparia and Pupae. Handbooks for the Identification of British Insects. London: Royal Entomological Society of London.
Staley, J. T., Hodgson, C. J., Mortimer, S. R., Morecroft, M. D., Masters, G. J., Brown, V. K., et al. (2007). Effects of summer rainfall manipulations on the abundance and vertical distribution of herbivorous soil macro-invertebrates. Eur. J. Soil Biol. 43, 189–198. doi: 10.1016/j.ejsobi.2007.02.010
Stubbs, A., and Drake, C. (2001). British Soldierflies and their Allies. Reading: British Entomological and Natural History Society
Thomas, C. G., Holland, J. M., and Brown, N. J. (2002). “The spatial distribution of carabid beetles in agricultural landscapes,” in The Agroecology of Carabid Beetle, ed J. M. Holland (Andover, MA: Intercept), 305–344.
Traugott, M., Benefer, C. M., Blackshaw, R. P., van Herk, W. G., and Vernon, R. S. (2015). Biology, ecology, and control of Elaterid beetles in agricultural land. Annu. Rev. Entomol. 60, 313–334. doi: 10.1146/annurev-ento-010814-021035
Keywords: deviance partitioning, variance-to-mean ratio, Tipulidae, pest, belowground, soil communities
Citation: Benefer CM, D'Ahmed KS, Blackshaw RP, Sint HM and Murray PJ (2016) The Distribution of Soil Insects across Three Spatial Scales in Agricultural Grassland. Front. Ecol. Evol. 4:41. doi: 10.3389/fevo.2016.00041
Received: 04 February 2016; Accepted: 04 April 2016;
Published: 21 April 2016.
Edited by:
Ivan Hiltpold, Western Sydney University, AustraliaReviewed by:
Aidan M. Keith, Centre for Ecology and Hydrology, UKAlan Kergunteuil, University of Neuchâtel, Switzerland
Copyright © 2016 Benefer, D'Ahmed, Blackshaw, Sint and Murray. This is an open-access article distributed under the terms of the Creative Commons Attribution License (CC BY). The use, distribution or reproduction in other forums is permitted, provided the original author(s) or licensor are credited and that the original publication in this journal is cited, in accordance with accepted academic practice. No use, distribution or reproduction is permitted which does not comply with these terms.
*Correspondence: Carly Benefer, carly.benefer@plymouth.ac.uk