Diversity and Ecological Correlates of Red Fluorescence in Marine Fishes
 Nils Anthes
 Jennifer Theobald1†
  Melissa G. Meadows
 Nico K. Michiels
- 1Animal Evolutionary Ecology Group, Faculty of Sciences, University of Tübingen, Tübingen, Germany
- 2Biology Department, Saint Francis University, Loretto, PA, USA
Marine environments at depths below −10 to −25 m are almost devoid of ambient red sunlight because water quickly attenuates long wavelengths. This stenospectral light environment presents unique opportunities for organisms that can transform ambient blue-green light into red light by fluorescence. Numerous marine fish species display intricate patterns of fluorescence. Because color vision is a key component of fish sensory ecology, several putative visual functions of red fluorescence have been proposed but are difficult to test experimentally. Here, we follow a comparative approach to assess the consistency between the phylogenetic distribution of red fluorescence with its presumed functions. We collected and analyzed the largest data set of red fluorescence in fishes to date, consisting of confirmed cases in 272 primarily diurnal fish species from 49 out of 90 surveyed fish families and 12 out of 21 surveyed fish orders, contrasted to 393 fish species with confirmed absence of red fluorescence. Based on a priori hypotheses on adaptive function, we compare the prevalence of red fluorescence among pre-defined sets of species based on ecological or biological characteristics while controlling for shared ancestry. When comparing between species, we find no evidence that red fluorescence is more prevalent in deep-water species, contrasting with our recent finding that fluorescence brightness increases with depth within species. There is also no evidence for a role in group-driven communication. Phylogenetic patterns are consistent, however, with three other predictions. First, fluorescence with a rather patchy distribution across the body occurred significantly more often among sit-and-wait predators or otherwise sedentary fish than in more mobile species, consistent with background matching for camouflage. Second, small, predatory fishes tended to show red fluorescent irides disproportionally often consistent with a proposed function in prey localization. Finally, sexually dimorphic species showed fluorescent fins more often, as predicted if relevant in sexual communication. From these findings, we derive predictions for experimental investigations of the presumed functions of red fluorescence.
Introduction
The sea appears blue because water primarily absorbs orange and red light (wavelengths >580 nm) whereas it largely scatters blue light (Jerlov, 1968; Lythgoe, 1979). This generates the strongest, most predictable, and most widespread spectral transition zone in nature. In all reasonably clear aquatic environments the ambient spectrum narrows from broad-spectrum sunlight at the surface to a 400–580 nm range at −20 m and 470–490 m below −100 m (Figure 1). Hence, in terms of color vision, the sunlit euphotic zone of marine environments can be subdivided into two zones. The euryspectral zone in the top few meters has an ambient spectrum wider than the core spectral sensitivity of most fish, which often have tuned their peak color sensitivity to the abundantly available blue-green light (450–550 nm) and thus have difficulties perceiving very short (UV) or very long (red) wavelengths (Munz and McFarland, 1973; Partridge, 1990; Losey et al., 2003; Brandley et al., 2013). In the stenospectral zone starting at around −10 m, the ambient spectrum is narrower than the portion of the light spectrum that most fish can perceive (Meadows et al., 2014 and references therein, Figure 1).
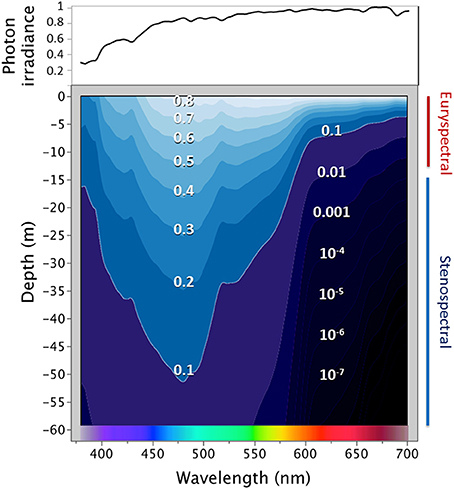
Figure 1. The spectral light environment in tropical marine waters. The top graph shows the ambient spectrum above the water surface (expressed as a proportion relative to the highest irradiance value, Red Sea, March 2013). The lower graph shows how that proportion changes with increasing depth. Each line represents the “iso-brightness” for a given wavelength. Red wavelengths dominate near the surface, but 90% of their irradiance is absorbed within −10 m. For blue light, the same degree of absorbance is only reached at −50 m. Irradiance was measured using a calibrated PhotoResearch PR 670 photospectrometer fitted with a CR-670 cosine receptor between 0 and −25 m depth and is expressed in photons.s−1.m−2.nm−1. These data were used to calculate spectral attenuation coefficients to estimate values down to −60 m (Meadows et al., 2014). Note that the measurements ignore Raman scattering, which is very weak but explains the presence of long wavelengths even in very deep water (Johnsen, 2012, p. 168).
This phenomenon forms the basis for the prevalent view that long wavelengths (“red” to humans) are irrelevant to most marine fishes. The implicit assumption is that animal coloration is exclusively generated by pigments or optical nanostructures that differentially absorb and reflect parts of the incoming light (Endler, 1990). Such subtractive mechanisms cannot reflect wavelengths that are absent in the ambient spectrum, and pigmentation that appears red at the surface will turn gray at depth.
The recent discovery of red fluorescence among marine fishes (Michiels et al., 2008; Sparks et al., 2014), however, indicates that long wavelengths may be far more relevant to fish visual ecology than commonly accepted. Red fluorescence is well-known from algae and corals, where it may enhance photosynthesis (Schlichter and Fricke, 1990), stimulate symbiotic zooxanthellae (Field et al., 2006), provide photoprotection (Salih et al., 2000; Ben-Zvi et al., 2014), or generate visual contrast (Gruber et al., 2008). Its occurrence in fishes suggests additional visual functions (Gerlach et al., 2014; Meadows et al., 2014; Harant et al., 2016; Michiels et al., in submitted, see also Haddock et al., 2005 for an example in deep see siphonophores). Unlike subtractive color mechanisms, fluorescence is an additive mechanisms enabling emission of wavelengths irrespective of their presence in the environment, allowing red coloration even in stenospectral environments.
Fluorescence is obviously not limited to the red range (>580 nm) of the light spectrum (reviewed in Lagorio et al., 2015), and many marine fishes also exhibit green and yellow fluorescence in the 510–580 nm range (Sparks et al., 2014). We focus, however, on long-wavelength fluorescence from 580 nm (orange) to 750 nm (far red) for two reasons. First, in light environments below −10 m red fluorescent emission is more likely to generate strong color contrasts against the blue-green background (Johnsen, 2012, p. 189, see also Haddock and Dunn, 2015, Figure 1). Making use of this free bandwidth would resemble adaptations in vocal communication that focus on frequencies that are rare in the ambient environmental noise (Slabbekoorn and Peet, 2003; Hart et al., 2015). Second, previous research on reef fish vision has focused on the 350–600 nm range of the color spectrum (Marshall et al., 2006, 2015; Brandley et al., 2013). While fluorescent emission in the near red around 600 nm can be assumed to be detectable by many fishes (Kalb et al., 2015), color patterns in the far red range are only scarcely investigated, prompting novel questions about color perception and private signaling (Gerlach et al., 2014, 2016).
To date, red fluorescent spectral emission has only been characterized for a small number of fish species (Michiels et al., 2008; Wucherer and Michiels, 2012, 2014; Meadows et al., 2014; Sparks et al., 2014; Gerlach et al., 2016). Here, we present the most comprehensive dataset of the phylogenetic distribution of red fluorescence among marine fishes to date. For the first time, we also compare species expressing red fluorescence with confirmed cases of its absence. Furthermore, we provide a quantitative overview of emission spectra and their characteristics within and between fish families. Finally, we use comparative analyses to evaluate whether the phylogenetic distribution of red fluorescence is concordant with five non-mutually-exclusive hypotheses on ecological function, as described below.
Hypothesis 1: Short-Distance Visual Functions
Just as long wavelengths from the sun disappear rapidly with depth, red fluorescent emission also attenuates rapidly with distance (Lythgoe, 1979). Hence, in a communication context, it is likely to be functional over very short distances only. While communication distances are poorly known for most fish species, spatial resolution as well as visual ranges and reaction distances toward prey items generally increase with body size in marine fish (e.g., Tamura, 1957; O'Brien, 1979; Schmidt and O'Brien, 1982; Li et al., 1985; Aksnes and Giske, 1993). Therefore, we use body length as a proxy for the distance over which communication or predation typically take place, with small species interacting over shorter distances.
Hypothesis 1 predicts that the prevalence of red fluorescence among marine fish species increases with decreasing body length.
Hypothesis 2: Contrast Enhancement at Depth
Near the surface, red fluorescence is too weak to significantly contribute to color contrast compared to reflective mechanisms (Meadows et al., 2014). In the stenospectral zone, however, red fluorescence is the only non-luminescent mechanism by which red hues can be produced. Hence, if used for visual functions, red fluorescent coloration should predominate in the stenospectral zone compared to the euryspectral zone (cf. Figure 1). Evidence for this comes from within-species comparisons; red fluorescence was brighter at −20 m than at −5 m in 6 out of 8 tested reef fishes (Meadows et al., 2014). Moreover, individual fish boost their fluorescence when exposed to light environments mimicking the low brightness conditions of deeper water (Harant et al., 2016). Here, we assess whether this hypothesis is also supported when examining patterns between species.
Hypothesis 2 predicts that the prevalence of fluorescence among marine fish species increases with the maximum depth at which those species occur.
Hypothesis 3: Camouflage through Background Matching
Red fluorescence seems particularly common in cryptobenthic fishes (Michiels et al., 2008). Indeed, Sparks et al. (2014) describe a phylogenetic concentration of green, orange, and red fluorescence in benthic taxa such as eels, lizardfish, blennies, scorpionfish, gobies, and flatfish. In these, red fluorescence could optimize color matching—and thus camouflage—against a substrate on which sessile organisms such as corals, sponges, and/or algae generate a background of irregular, patchy fluorescence (e.g., Alieva et al., 2008; Michiels et al., 2008, Figures 2, 3). Camouflage constitutes a complex interplay between the benefits of being cryptic, the behavioral and perceptive abilities of the observers, the ambient spectrum, and the background against which the cryptic species is observed (Endler, 1981). For a comparative analysis, the difficulty is to define unbiased criteria to score which species may benefit from camouflage and what characterizes a fluorescent pattern as being cryptic.
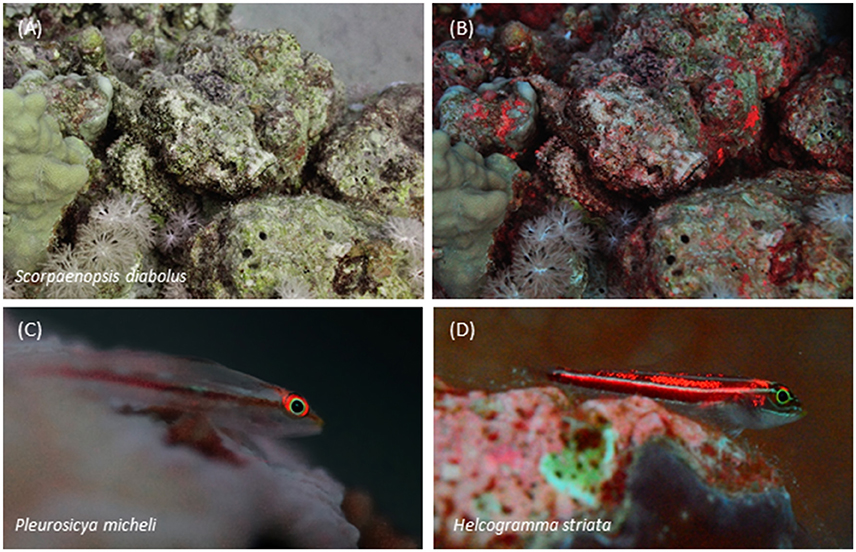
Figure 2. One positive and two negative cases of “patchy fluorescence.” The devil scorpionfish (A,B) is a typical motionless sit-and-wait predator with patchy fluorescence that appears similar to that of its background. (C) and (D) exemplify red fluorescent benthic species scored as “negative” for patchy fluorescence. Picture (A) taken without filter, the others with a LEE 164 Flame red filter to enhance long wavelengths, all at ~−20 m with manual white balance (Photos: Nico K. Michiels).
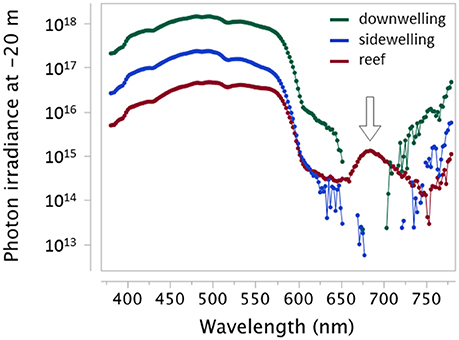
Figure 3. Downwelling light, sidewelling scatter from the open water, and light emitted from a reef in −20 m showing the distinct red fluorescent emission of the reef at this depth (arrow). Measured as photon irradiance (photons.s−1.m−2.nm−1) using a calibrated PhotoResearch PR 670 with CR-670 cosine corrector in El Quseir, Egypt (sunny, midday, March 2013). Raw data shown as connected points. Missing points are wavelengths at which the signal fell below the detection threshold. Note log10 y-axis.
With respect to camouflage benefits, we assume that camouflage by background matching is of relevance to all benthic fishes, and particularly so to rarely moving species as represented by sit-and-wait predators such as scorpionfish. In contrast, we consider free-swimming benthopelagic and pelagic fishes as being generally more conspicuous because of their constant movement in the water column. Free-swimming species are more likely to possess alternative camouflage mechanisms based on different optical principles (e.g., Brady et al., 2013). Hence, we categorized species as (1) free-swimming, (2) benthic and frequently moving, and (3) benthic and mostly motionless as in sit-and-wait predators.
With respect to crypsis, we define those fluorescent color patterns as “cryptic” that resemble the patchiness of fluorescence present on hard substrates such as rocks and reefs (see examples in Michiels et al., 2008; Sparks et al., 2014). We therefore separated a category of study species showing “patchy” overall body fluorescence from any other body distribution with e.g., large areas of uniform fluorescence or small, well-defined areas such as the iris (Figure 2).
Hypothesis 3 predicts that, among fluorescent fishes, “patchy fluorescence” predominates among benthic fish in general and in motionless foragers in particular.
Hypothesis 4: Prey Detection
Many benthic species including members of the pipefish, goby and triplefin families display striking red fluorescence around their eyes, usually in the irides (Michiels et al., 2008; Sparks et al., 2014). This has raised the idea that red fluorescent irides may induce retro-reflective eyeshine in the eyes of other organisms (prey or predator) facilitating their detection (Bruce, 2009; Meadows et al., 2014; Wucherer and Michiels, 2014). This would be analogous to what has been described for nocturnal flashlight fishes, which produce light through chemiluminescence from a light organ directly below the pupil (Howland et al., 1992). Light emission next to the viewing axis is a crucial feature as this maximizes the retroreflective eyeshine that can be seen in the eyes of other organisms (Jack, 2014). As in Hypothesis 1, this is likely to function over short distances only because of attenuation of the fluorescent emission with distance. Hence, such “active photolocation” using fluorescence makes the most sense for small fish that pick individual small prey items that possess eyes (Michiels et al., in submitted). This function of red fluorescence is not expected in species that forage on larger prey with eyes over larger distances and should be absent in species that feed indiscriminately (e.g., filter-feeding, substrate sifting) or visually select organisms that lack eyes (detritivores, corallivores, herbivores).
Hypothesis 4 predicts that red fluorescence is more often near the eye in those fluorescent species that forage on small prey items that have eyes.
Hypothesis 5: Intra-Specific Communication
Fluorescence can be quickly modulated by intra-cellular pigment transport (Wucherer and Michiels, 2012, 2014) and is often associated with signaling structures such as fins (Michiels et al., 2008; Gerlach et al., 2016). This hints at a communication function for fluorescence for courtship, territoriality, or social hierarchies (Sparks et al., 2014). Recent evidence suggests that fluorescent fish perceive (Michiels et al., 2008), and respond to, their own fluorescence. Among wrasses, male-male interactions are mediated by orange-red colors in Coris julis (Braun et al., 2014) and by red fluorescence in Cirrhilabrus solorensis (Gerlach et al., 2014). Training experiments in the triplefin Tripterygion delaisi show that these fish are capable of discriminating between objects in response to weak red fluorescent levels similar to their own (Kalb et al., 2015). Fins are used for signaling by many fishes (overview in Rowland, 1999, see also Ciccotto and Mendelson, 2016a). In contrast to the body, their display angles can be controlled (e.g., pectoral and tail fin), they can be moved even when sitting still (e.g., dorsal fin) and they can be opened or closed to adjust signal size or conceal the signal (e.g., dorsal, caudal, and anal fins).
Hypothesis 5 predicts that red fluorescent fins are more prevalent in fluorescent species that show specific types of intra-specific communication.
To test this hypothesis, we differentiate between two types of intra-specific communication. First, many marine fish live in aggregations of dozens to hundreds of individuals (e.g., Norris and Schilt, 1988). Compared to species that primarily adopt a solitary lifestyle or form stable pairs, grouping generates more continuous signaling among group members. If red fluorescence played a specific role for such interactions, it should be more prevalent in group-living species.
Second, color signals subject to mate choice are often expressed differently in males and females (reviewed in Wyman et al., 2013, see Kraaijeveld et al., 2007 and Baldauf et al., 2011 for exceptions). Hence, if red fluorescent fin displays are favored by sexual selection, we expect them to be more prevalent among species that exhibit sexual dichromatism.
Materials and Methods
Data Sources
We assembled information from multiple sources. Our own sampling campaigns combined direct observation and photographic documentation with qualitative and quantitative measurements of fluorescence spectra from live fish, as detailed below. We complemented these with cases documented in the online supplement of Sparks et al. (2014). The latter do not provide a list of negative cases, but we scored all species labeled as showing green but no red fluorescence as negative for red fluorescence. We further included earlier data from our own projects (Michiels et al., 2008; Wucherer and Michiels, 2012; Meadows et al., 2014) and subjected them to categorizations where possible as detailed below. Our survey did not attempt a balanced coverage across the cartilaginous and bony fish phylogeny and explicitly does not aim at reconstructing the evolutionary history of red fluorescence across fish. Instead, while being taxonomically as broad as possible, sampling focused on benthic, mostly shallow water species, automatically generating limited or no coverage in fish clades with largely pelagic representatives such as the Otocephala (including herrings) or the Protacanthopterygii (including salmon and trout).
Spectrometry and Standardized Documentation of Live Specimens
We measured and documented fluorescence from live fish at five localities:
a. University of Tübingen, Germany. We ordered species through the sustainable aquarium trade for spectral measurements in our laboratories in accordance with German animal care legislation (permit ZO 1/12 from the local authority at the Regierungspräsidium Tübingen). These fish served to complement our coverage of fish families and to scrutinize doubtful cases of fluorescence after field observations.
b. Gulf of Aqaba (northern Red Sea). We collected fish at the Interuniversity Institute for Marine Sciences (IUI) in Eilat, Israel, in March 2012, under the general IUI collection permit (No.: 2012/38470, Israel Nature and National Parks Protection Authority to Roi Holzman).
c. North-western Red Sea. We collected fish from coral reefs in the bays of Sharm Fugani (Mangrove Bay) and Sharm Lassal (Utopia Beach), 15–20 km south of El Quseir, Egypt, in March 2013. Both locations offer protected reefs sloping down to −25 to −30 m. Collection conformed to a 3-year Memorandum of Understanding between the University of Tübingen and the Suez Canal University running 1 Jan 2013–31 Dec 2015.
d. Mediterranean Sea. Collections in June 2013 focused on rocky and sandy environments to −30 m at the Station de Recherches Sous-marines et Océanographiques (Stareso) at Calvi, Corsica, France. We collected and registered fish under the station's general sampling permit.
e. Indopacific Ocean, Indonesia. We collected fish at a broad range of coral reef habitats up to −30 m depth at Hoga Island in the Wakatobi archipelago off the SE Sulawesi coast, Indonesia in September 2011. Collection was authorized and registered under a general permit of Operation Wallacea.
Most field-sampling focused on diurnal species for which field observations using a red filter mask (Michiels et al., 2008) had already indicated the presence or absence of long-wavelength fluorescence. In the Gulf of Aqaba, collection and measurement occurred blind to the presence of fluorescence.
Fish were collected on SCUBA diving with hand nets after partially anesthetizing individuals using clove oil where required (5% clove oil in 5% ethanol and 90% seawater shaken to emulsify). After transportation to the local laboratory in 100 ml Falcon tubes or 4-L zip-lock bags, fish were maintained in aerated seawater for 1 to 8 h before live measurements, followed by their release on site. Species were identified using the general identification literature (e.g., Debelius, 1998; Allen et al., 2002, 2003, 2014) supplemented by monographs (Clark, 1979; Fricke, 1997; Holleman, 2005), Fishbase (Froese and Pauly, 2014) and expert advice for specific fish groups where necessary. Unidentified species were classified at the family or genus level.
Fluorescence Spectrometry and Spectral Analysis
The fish handling routine, the basic spectrometry setup used in the northwestern Red Sea (Figure 4), and small deviations for the measurements in the Indopacific and the Mediterranean are detailed in Meadows et al. (2014). The same setup was used in the two other locations, with the following modifications: In the Gulf of Aqaba (IUI), we used an Ocean Optics white LED light source (Ocean Optics LLS–Cool White) trimmed to the blue-green range for excitation with a BrightLine HC 533/SP (AHF) short pass filter. The light emitted and/or reflected by the fish was filtered using a stack of four LEE 105 Orange filters in an in-line-filter holder. Measurements at the University of Tübingen used a different bifurcated fiber optics cable (Ocean Optics QR400-7-VIS-BX). Differences between the measuring setups are due to continuous efforts to improve our setup over the years. This precludes direct comparisons of emission intensities and we thus expressed emission intensities on a relative scale as explained below.
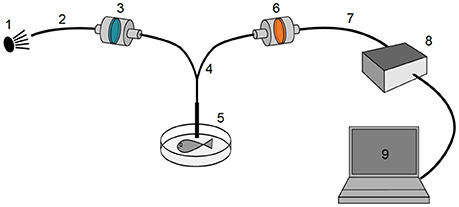
Figure 4. General spectrometry setup. A near-monochromatic green excitation light source (1) was connected (2) via a short-pass or clean-up filter (3) to a bifurcated fiber optics cable (4) that terminated in a hand-held probe (5) close to the measured fish. The emitted light was redirected through a long-pass filter (6–7), analyzed by a high-sensitivity Ocean Optics QE65000 spectrometer (8) and visualized using Ocean Optics SpectraSuite software (9).
Within the excitation range used by Sparks et al. (2014), we used a monochromatic 532 nm light source to excite fluorescent emission that was measured after removing reflected light using a long-pass filter. This single excitation wavelength was chosen, first, to unambiguously differentiate reflection of the excitation light source or short-wavelength fluorescence from red fluorescence with emission peaking at ≥580 nm, and second, to allow comparisons among species without confounding by variation in excitation wavelength. Our unpublished fluorescence measurements across complete spectral gradients indicate that peak emission wavelengths (λmax) are nearly insensitive to variation in excitation wavelength, consistent with a general property of most fluorescent pigments due to molecular structure (Johnsen, 2012).
Fluorescence emission spectra were collected from several body parts: Eye, head, operculum, upper and lower flank, and each fin. To obtain summarizing information on the fluorescence characteristics of each study species, we followed a four-step procedure to condense our original spectral readings. First, we identified distinct fluorescence peaks for each measured individual and body part and characterized their peak emission wavelength (λmax) and emission intensity at λmax. Second, we averaged λmax and intensity per body part and emission peak across all specimens of a given species. Third, across all body parts per species, we grouped measurements with the same single emission peak (near-identical λmax), calculated minimum, mean, and maximum λmax, and selected the highest of the averaged intensity values across all body parts. For each investigated species, we thus obtained a single summarizing measurement (λmax and intensity) for one to four distinct fluorescent emission peaks. Fourth, given that intensity readings are sensitive to deviations in measurement procedure, we grouped intensity values into four quantiles within each measurement campaign. Given that the distribution of absolute intensity across measurements showed a close match between measurement campaigns (a) through (d), these datasets were combined prior to assigning intensity categories. Assignment to intensity categories was done separately for campaign (e). Only those four resultant intensity categories are reported in this study.
Fluorescence Photography and Image Analysis
All sampled fish were subjected to standardized fluorescence photography (Meadows et al., 2014). While spectrometric measurements are restricted to point information on fluorescence intensities, we performed an independent scoring of the spatial extension of fish fluorescence based on images recorded in the laboratory as well as in the field. First, we allocated fish to one of four categories to describe the spatial extension of long-wavelength fluorescence:
1. No red fluorescence, or fluorescence restricted to minute spots, often originating from contamination by, e.g., ectoparasites or gut content.
2. Fluorescence covers <10% of the body.
3. Fluorescence covers 10 to 50% of the body.
4. Fluorescence covers >50% of the body.
Second, we scored its presence or absence on specific body parts:
1. Eye fluorescence: Iris or exposed parts of eyeball or eye socket.
2. Patchy fluorescence: Many dots and patches of variable size and shape across the body.
3. Fin fluorescence: Fluorescence on any fin or set of fins, and irrespective of sex (note that our current sampling did not differentiate sex-specific fluorescence patterns).
In-situ Observations in the Field
Beyond the study sites mentioned above we also conducted field documentation at sites in the Mediterranean Sea [Corsica (~200 dives 2009–2015), Elba (5 dives 2012), Croatia (4 dives 2008)], the Red Sea [Gulf of Aqaba (~30 dives 2011–2012), Marsa Alam (~200 dives 2007–2015)] and the Indo-Pacific Ocean [Lembeh Strait in Indonesia (~30 dives 2013), Raja Ampat in West Papua (~40 dives 2013), Perth in Western Australia (3 dives 2011)]. Fish were scored for the presence of obvious long-wavelength fluorescence perceived as “orange” to “red” by the observer or camera. We only included cases with reliable assessment, requiring conditions that preclude confounding effects by reflective red coloration. Daytime observations were therefore restricted to ≤ −15 m. To facilitate visual or photographic detection, we suppressed the abundant blue-green ambient light with one of several long-pass filters (LEE 105 Orange, LEE 287 Double C.T. Orange, LEE 164 Flame red, LEE 106 Primary red, Nightsea BB62 yellow barrier filter) and documented most species on site using Nikon D300, D700, or D4 digital cameras. To further minimize the likelihood of false positives, observations were cross-checked in situ by comparing the putative fluorescent structure with a certified 1.25″ non-fluorescent Spectralon red diffuse reflectance standard (Labsphere) whenever possible, usually in benthic species only. Although we concentrated on species that showed fluorescence under natural illumination, we regularly checked putative cases by highlighting the fluorescence with a blue LED dive light or a blue flashgun. Both were fitted with a short-pass filter to cut out any remaining long-wavelength light (Thorlabs FD2C subtractive dichroic color bandpass filter on Hartenberger Mini Compact blue LED torch; EX-INON Nightsea Excitation filter on Inon Z-240 flashgun). An increase in perceived red emission brightness with increased blue excitation (comparing with and without the blue torch) confirms fluorescence as the origin of the boost in the red signal. Under darker ambient conditions (e.g., shaded substrates, cloud cover), the blue excitation sources could also highlight fluorescence in shallower water (−5 to −10 m). The patterns of fluorescence were categorized for each species as explained above.
Screening Species in the Aquarium Trade
We visually screened all marine species (n = 209) available at one of the largest German wholesale aquarium traders (von Wussow, Pinneberg, Germany) in June 2009. To detect red fluorescence we used blue dive lights (Hartenberger Mini Compact LCD with 7 × 3.5 W 480 nm LEDs) for excitation and three types of LEE filters as barrier filters (LEE 777 Rust, LEE 106 Primary red, LEE 027 Medium Red) with all other light sources in the room switched off. Based on these observations, species were listed as either red fluorescent or non-fluorescent with no further photographic or spectrometric documentation.
Assignment Quality
As an internal control, we compared our observational assessment with spectral measurements of red fluorescence for 91 species for which both types of information were available. Out of 18 species that lacked any fluorescent signal in spectral measurements, two were rated as fluorescent based on observations: In Coris gaimard, the spectra were taken on non-fluorescent juveniles, while the adults observed in the field clearly fluoresced in red. In Nemateleotris decora, weak fluorescence was visible in the field, but spectral emission peaked in the green-yellow range and thus fell outside the 580 nm cut-off chosen for the current study. Out of the 73 species showing fluorescence in spectral measurements, only the blenny Atrosalarias fuscus was categorized as non-fluorescing during field observations. In this species, the fluorescent emission (575 nm) peaked also just outside our cut-off point, and so we rated it as non-red-fluorescent for the current study. Hence, spectral and observational data yielded highly consistent ratings with an error rate of about 3%.
Biological and Ecological Characterization
For all investigated fish, a person blind to the fluorescence rating screened the available literature (primarily Froese and Pauly, 2014, aided by records in comprehensive fish guides, fish ecology books, and individual species papers, see overview in Supplementary Materials A,B) to score the following traits (as explained in the Introduction):
(1) Maximum total body length
(2) Maximum recorded depth of occurrence
(3) Substrate association
a. Benthic: Sit-and-wait predators (mostly motionless)
b. Benthic: Active foragers
c. Free-swimming: Benthopelagic or pelagic
(4) Gregariousness
a. Primarily solitary or pair-living
b. Primarily in larger social groups
(5) Sexual dichromatism: Sexually dimorphic coloration present or absent
(6) Primary food items
a. Individually picked microscopic prey with eyes (e.g., microcrustaceans)
b. Individually picked macroscopic prey with eyes (e.g., crustaceans, fish)
c. Eyeless prey or indiscriminate feeding (e.g., filter feeding, sediment sifting, digging, herbivory, corallivory, detritivory, etc).
Analyses
Phylogenetic Reconstruction
We used the extensive recent Maximum Likelihood fish phylogeny of Betancur et al. (2013) to generate a family-level tree topology. We pruned this phylogeny to the 71 families also represented in our dataset by removing all non-covered families and maintaining a single terminal node per family. We then manually added the missing 19 families as to reflect established phylogenetic relationships, generating a tree topology that captures the current family-level phylogeny to our best possible knowledge (details in Supplementary Material D). Ancestral character estimation for the presence of fluorescence at the family level used maximum likelihood estimation for discrete characters following Pagel (1994). Given the absence of comparable branch length estimates for the manually added taxa, this analysis rests on branch lengths set to unity (Díaz-Uriarte and Garland, 1998; Garland and Ives, 2000). All tree manipulations and analyses were conducted using the packages APE (Paradis et al., 2004) and phytools (Revell, 2012) for R (R Core Team, 2013).
Statistical Analyses
Our statistical analyses evaluate whether the phylogenetic distribution of fluorescence types can be explained by any of five hypotheses on putative function as outlined in the Introduction. For each hypothesis, we fitted generalized linear mixed effect models (GLMM) using the glmer function in the lme4 package (Bates et al., 2013) for R. The dependent variable was the presence or absence of the defined fluorescence type as specified in the hypotheses as a binary response, modeled using a logit link function. The predictor(s) as given in each hypothesis were included as fixed effect(s). To account for putative confounding effects of body size, we added the covariate maximum body length (log10-transformed to normalize data distribution, z-transformed to improve model convergence) for hypotheses 2 through 5. Initial full models also contained all possible interaction terms among factors in the fixed model component. Taxonomic ranks (genus, family, and order) were included as nested random factors to take into account trait correlations due to shared ancestry (cf. Luiz et al., 2013; Bridge et al., 2016). This is a compromise given that a fully resolved species-level phylogeny is currently not available for the majority of our study species. We then performed stepwise backward model selection based on the Bayesian information criterion (BIC) and hierarchical likelihood ratio tests (as recommended by Zuur et al., 2009). Only fixed factor effects maintained in the final reduced models are reported, with their statistical significance evaluated using Type III Wald chi2 tests. We further provide an estimate for the total variation explained by the fixed model component expressed as the marginal R2 (, Nakagawa and Schielzeth, 2013) as implemented in the piecewiseSEM package (Lefcheck, 2016) for R.
Results
Red Fluorescence Is Phylogenetically Widespread
We could unambiguously assign the presence or absence of red fluorescence in 665 fish species from 90 families and 21 orders (Table 1, Supplementary Material A). Of those, spectral measurements are available for 185 species, documenting red fluorescence in 114 (Supplementary Material C). Observational data for the other 480 species revealed red fluorescence in another 153 species. Hence, we document red fluorescence for 272 species (49 families and 12 orders) in total, representing 41.8% of all species in our database. In all other cases fluorescence was absent or hardly detectable.
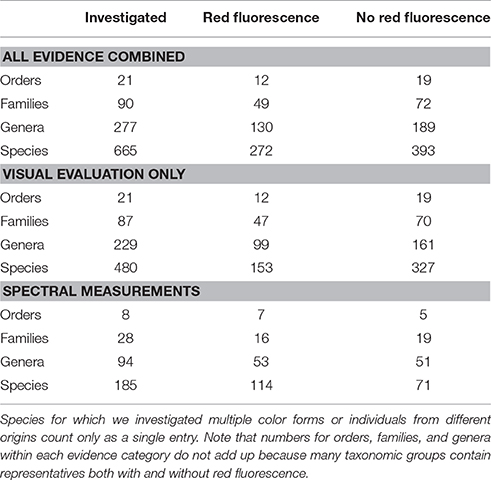
Table 1. Sample sizes (number of taxa) and evidence type at different taxonomic levels.
Mapping the data onto a family-level phylogenetic tree (Figure 5) shows that red fluorescence is phylogenetically widespread (at least within the teleost fish), lacks a simple association with phylogenetic history, and has likely been repeatedly acquired or lost.
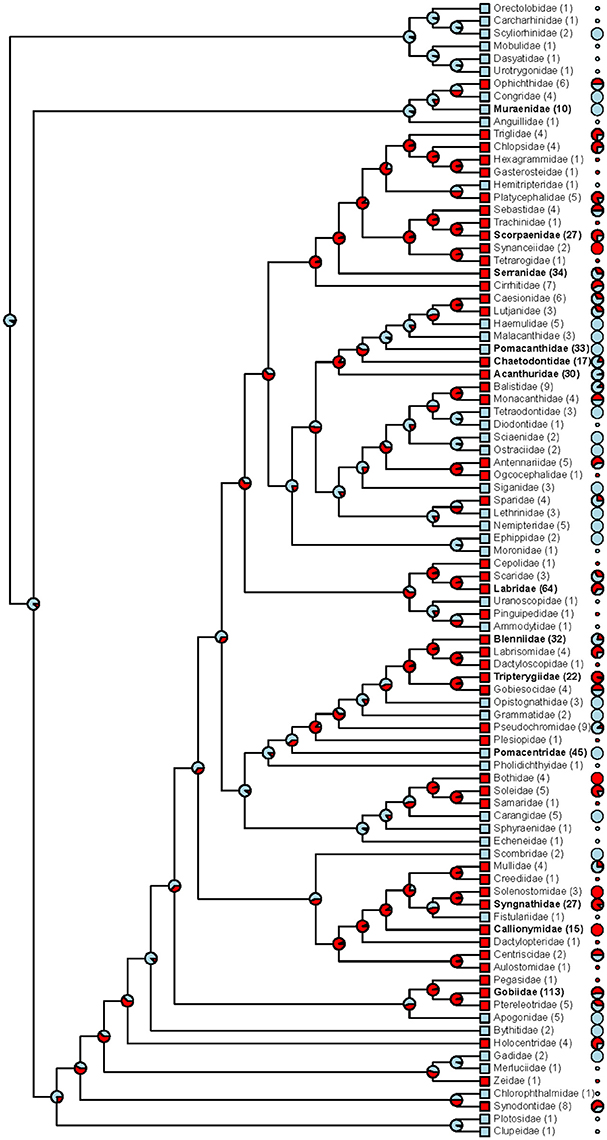
Figure 5. Phylogenetic distribution of red fluorescence among marine fish families. For each family, tip labels show (i) whether fluorescence has been confirmed in at least a single species (red squares vs. blue squares), (ii) the total number of investigated species (in brackets; families with ≥10 species in bold face), and (iii) the proportion of species that exhibit red fluorescence (pie charts; shown for families with ≥ 2 species). At each node, the maximum likelihood for red fluorescence being the ancestral state is indicated by the red pie portion.
We found substantial family-level variation in the expression of red fluorescence (Figure 5). Even though absolute proportions of fluorescent species are difficult to interpret given that some of our sampling specifically focused on promising candidates for fluorescence, this upward bias applies equally to all target fish families. Out of 13 families with more than 10 sampled species, six showed a predominance of fluorescing species: Gobies (Gobiidae), wrasses (Labridae), triplefins (Tripterygiidae), scorpionfish (Scorpaenidae), pipefish & seahorses (Syngnathidae), and dragonets (Callionymidae). With the exception of the wrasses, all these families exhibit rather cryptic coloration and a mostly secretive lifestyle. In groupers (Serranidae), blennies (Blenniidae), and butterflyfish (Chaetodontidae), red fluorescent species occurred at intermediate frequencies (Figure 5). In contrast, and despite explicit search for fluorescent cases, red fluorescence was virtually absent from several particularly colorful reef fishes: Damselfish (Pomacentridae), angelfish (Pomacanthidae), surgeonfish (Acanthuridae), and moray eels (Muraenidae) (but conspicuous yellow fluorescence is present in, e.g., moray eels).
Red Fluorescence Occurs in Distinct Types
Distribution of λmax Values
Out of 665 investigated species, 185 could be subjected to spectrometric measurements. Out of these, emission spectra revealed red fluorescence in 114 species (Table 1). Within the investigated 580 to 750 nm range, peak emission wavelengths (λmax) clustered in three distinct groups (Figure 6) that we categorize into “near red” (580–650 nm), “deep red” (650–710 nm), and “far red” (>710 nm). In the near red group, most λmax aggregated between 590 and 630 nm, coinciding well with the abrupt start of light attenuation with increasing depth (Figure 1). The deep red group clusters around the characteristic emission range of ambient fluorescent light produced by chlorophyll a at about 680 nm (Figure 3). The far red group contains only few species with λmax at 740 nm, but these come from a diverse array of families with mostly cryptic sit-and-wait predators (see below, Figure 9).
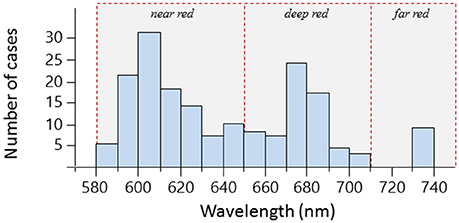
Figure 6. Frequency distributions of peak emission wavelengths (λmax) for 114 fish species. Single species have between one and four emission peaks and can thus be represented multiple times. Hatched red lines delineate our categorization according to peak emission wavelength into near red, deep red, and far red fluorescence.
Single vs. Multiple Peak Emission
Red fluorescence showed a single λmax in 70 out of 114 species (61%) for which fluorescence spectra are available. Twenty-eight species (25%) showed two, 14 species (12%) three, and the remaining two species (1.7%) four emission peaks (the pipefish, Corythoichthys nigripectus, and the triplefin, Enneapterygius mirabilis). In species with multiple λmax, these peaks were separated by 48.4 nm on average (range: 10.1–105.5 nm, Figure 7). Multiple emission peaks were often associated with different body parts, for example with a near red emission in the iris and a deep red emission on the flank in gobies (Figure 7A). Examples of two emission peaks in a single body part are the iris of the blenny Ecsenius dentex (Figure 7B), fins of the triplefin, Enneapterygius pusillus (Figure 7C), or the flanks of the wrasse, Cheilinus abudjubbe (Figure 7D), and the lizardfish, Synodus variegatus (Figure 7F). Triple emission peaks as on the flank of the scorpionfish, Scorpaenopsis barbata (Figure 7E) or the caudal fin of the pipefish, Corythoichthys flavofasciatus (Figure 7F) were rare.
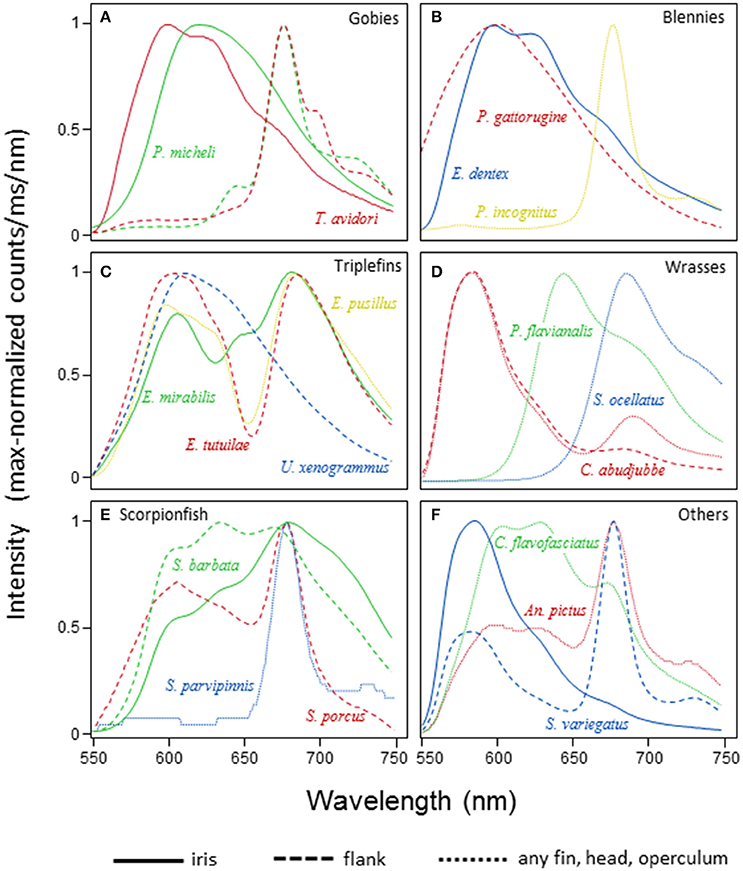
Figure 7. Spectral patterns of red fluorescence. For a selection of families and species, the graphs depict the maximum-normalized shape of fluorescent emission under monochromatic green excitation (see Methods). Within each panel, species are coded by color, body parts by line styles. (A) Gobiidae, (B) Blenniidae, (C) Tripterygiidae, (D) Labridae, (E) Scorpaenidae, (F) Syngnathidae, Antennariidae, and Synodontidae.
Fluorescent Body Parts and Body Area
The distribution of long-wavelength fluorescence over the fish body shows distinct types (Figures 7, 8). Some species show conspicuous red fluorescence in well-defined, often quite small, uninterrupted areas (e.g., eyes or fin rays), indicative of signaling or prey detection functions (Hypotheses 4 and 5) (Figures 8A–E). Others show a scattered, irregular, patchy distribution of red fluorescence across the body that we specifically addressed in Hypothesis 3 (camouflage function). In these cases, it covers 10 to ≥50% of the body area (Figures 8F,G).
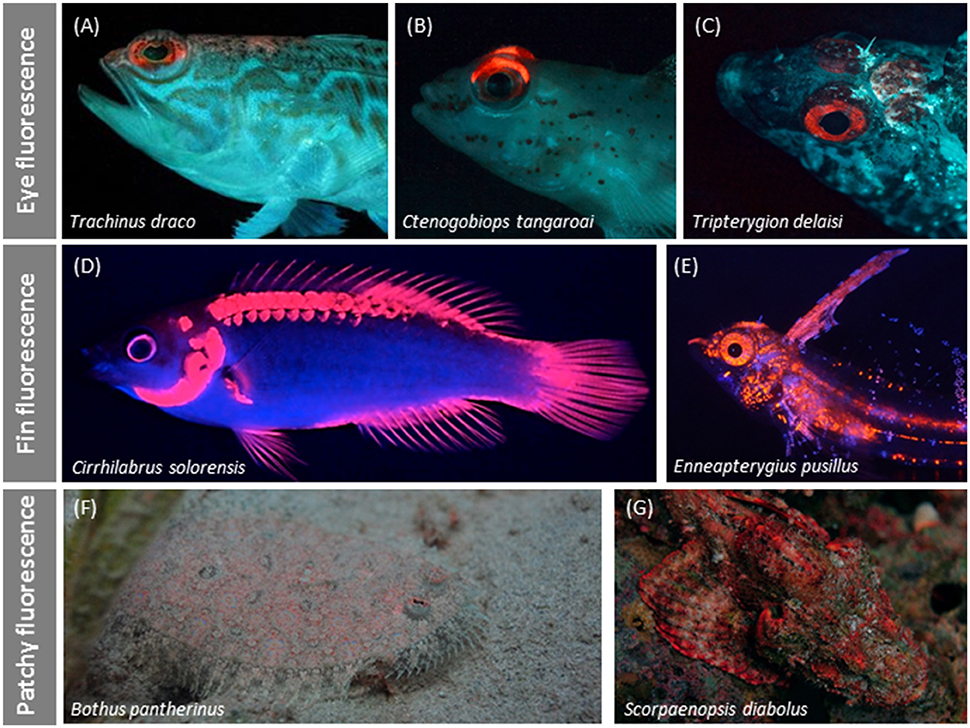
Figure 8. Variation in red fluorescent body patterns. Irides are often the only or clearly most prominent fluorescent structures as in some weevers (A), gobies (B), and triplefins (C). Fin fluorescence may suggest a signaling function as in a fairy wrasse (Gerlach et al., 2014) (D) or triplefin (E). Patchy fluorescence characterizes the irregular distribution of red fluorescence over the body as shown by this flatfish (F) and scorpionfish (G).
Fluorescence Peaks and Intensities Associate with Fish Families
The distribution of red fluorescent patterns revealed affinities with fish families (Figure 9). For example, gobies (Gobiidae) and wrasses (Labridae) show mostly single-peak emissions. These cluster in the near red range in gobies, but are spread across the deep red range in wrasses. In contrast, triplefins (Tripterygiidae) mostly show two to three peaks in the near and deep red range. Finally, several families, including pipefish (Syngnathidae) and scorpionfish (Scorpaenidae), share triple emission peaks, often including a unique emission peak in the far red. Referring to the family-level phylogeny (Figure 5) it is clear that these patterns are often shared among unrelated families and, hence, probably have evolved independently.
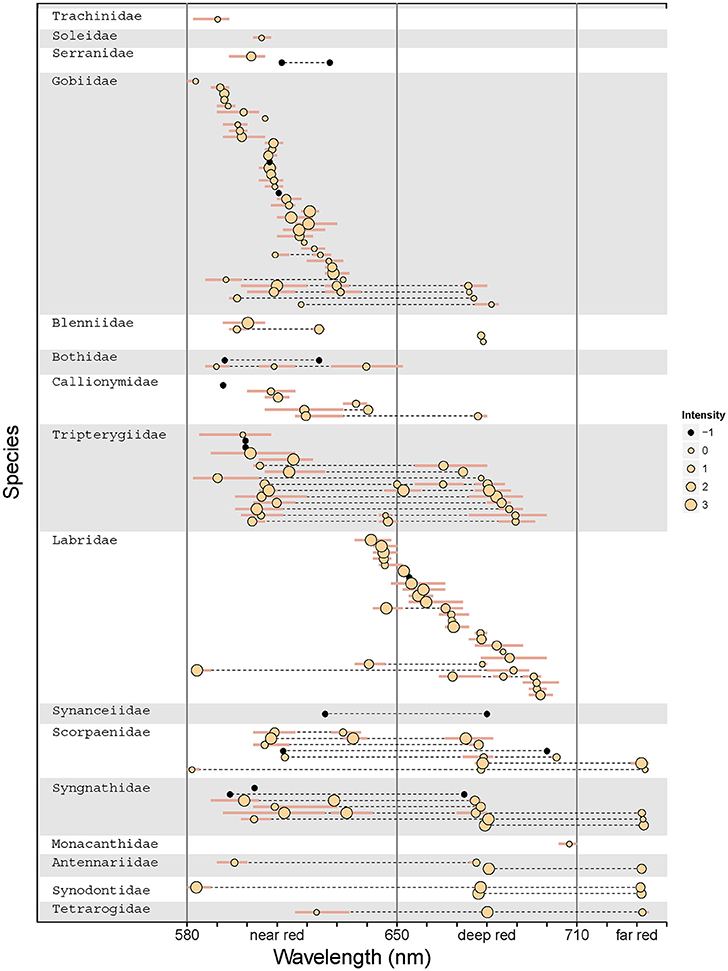
Figure 9. Species- and family-level patterns of fluorescence peak emissions and intensity. The graph indicates the λmax for each emission peak for all 114 measured species, with inter-individual range shown as bars. Multiple λmax values per species are connected by a dotted line. Dot size indicates fluorescence intensity in four intensity quartiles per measurement campaign. Black dots show emission peaks from data sets for which comparable brightness measures were unavailable. Vertical lines separate the data into near red, deep red, and far red fluorescence (cf. Figure 6). Families and species are ordered by average peak emission.
Functional Correlates of Red Fluorescence
Hypothesis 1: Short-Distance Visual Function
We predicted a higher prevalence of red fluorescence in smaller fish species, using body size as a proxy for interaction distance. Smaller species were indeed significantly more likely to express fluorescence than large species (GLMM length effect χ2 = 14.09, P = 0.0002, = 0.064, n = 615 species, Figure 10A). Given this relationship, we included body length as a covariate into all further models reported below to correct for its potentially confounding effect.
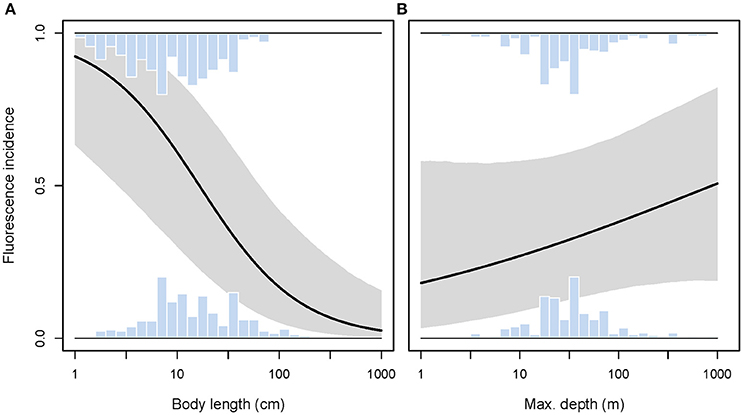
Figure 10. Incidence of red fluorescence in response to maximum body length (A) and maximum depth (B) per species. Marginal histograms display the relative frequency distributions of raw species values. Predicted incidence (black line) and its 95% credibility interval (shaded area) are extracted from binomial models corrected for shared species ancestry. Note log10-scale on x-axes.
Hypothesis 2: Contrast Enhancement at Depth
We found no support for the hypothesis that red fluorescence should be more prevalent among species whose habitat extends into greater depths. While controlling for body size, we found the incidence of fluorescence to be independent of maximum depth per species (GLMM depth effect χ2 = 1.42, P = 0.23, full model = 0.067, n = 615 species, Figure 10B).
Hypothesis 3: Camouflage through Background Matching
While taking the effect of body size into account, we found that patchy fluorescence was rarely expressed in free-swimming species, occurred at intermediate frequencies in rather mobile benthic species, and reached a high average incidence of about 70% in motionless sit-and-wait species (GLMM substrate effect χ2 = 10.97, df = 2, P = 0.0042, Figure 11A). This pattern is consistent with Hypothesis 3 proposing that this type of whole-body red fluorescence may contribute to camouflage.
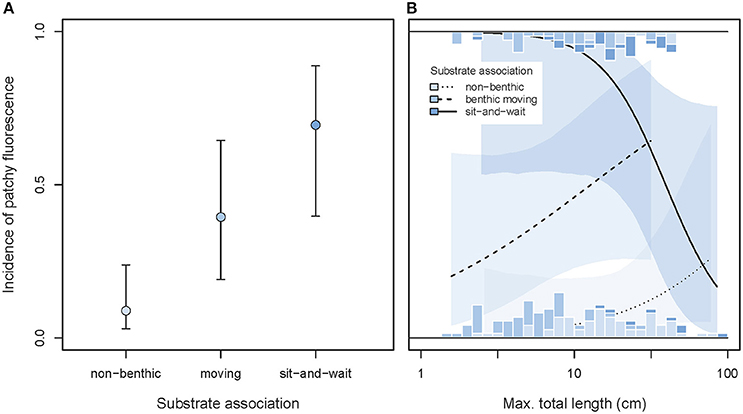
Figure 11. Incidence of patchy whole body fluorescence as predicted by substrate association, maximum body length, and their interaction. (A) Shows the overall predicted incidences of patchy fluorescence (±95% credibility intervals), pooling across body size. (B) Illustrates the interaction between substrate association and body size (note log10 x-scale). Marginal stacked histograms display relative frequency distributions of raw species values. Predicted incidences (lines) and their 95% credibility intervals (shaded areas) are extracted from binomial models taking shared species ancestry into account.
This association showed a significant interaction with body length (GLMM interaction χ2 = 7.37, df = 2, P = 0.025, full model = 0.264, n = 187 species). Among immobile sit-and-wait species, the smaller species were more likely to exhibit patchy fluorescence, while the reverse was true in moving benthic species (Figure 11B).
Hypothesis 4: Prey Detection
Taking variation due to body size into account, we found that the incidence of eye fluorescence tended to increase from species feeding on eyeless food items toward species foraging on microscopic, eyed prey (GLMM prey type effect χ2 = 5.44, df = 2, P = 0.066, Figure 12A). This is consistent with the idea that iris fluorescence may contribute to prey detection when the target exhibits eyes that can directly reflect the incoming light (Hypothesis 4).
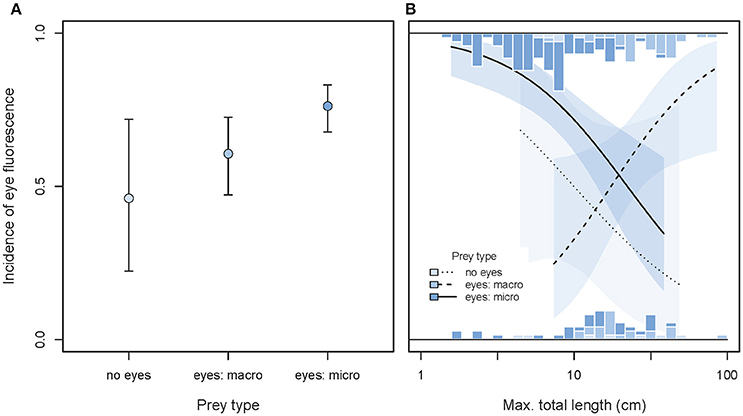
Figure 12. Incidence of eye fluorescence as predicted by prey types, maximum total body length, and their interaction. (A) Shows the overall predicted incidences of eye fluorescence (±95% credibility intervals), pooling across body size. (B) Illustrates the interaction between prey types and body length (note log10 x-scale). Marginal stacked histograms display the relative frequency distributions of raw species values. Predicted incidences (lines) and their 95% credibility intervals (shaded areas) are extracted from binomial models taking shared species ancestry into account.
Body length significantly affected the main prey type effect (GLMM interaction χ2 = 10.76, df = 2, P = 0.0046, full model = 0.122, n = 187 species). Among fish foraging on small, eyed prey or indiscriminately, eye fluorescence was particularly prominent in the smallest species. The reverse was true for fish species foraging on large, eyed prey (Figure 12B).
Hypothesis 5: Intra-Specific Communication
The incidence of red fin fluorescence was significantly higher in sexually dimorphic than in sexually monomorphic species (GLMM dimorphism effect χ2 = 6.21, df = 1, P = 0.013, full model = 0.12, n = 187 species, Figures 13A,B), consistent with the idea that fluorescence may play a role in sexual communication. In contrast, no difference in the prevalence of fin fluorescence occurred between solitary/pair vs. group-living species (GLMM sociality effect χ2 = 0.57, df = 1, P = 0.45, Figures 13C,D), lending no support for a prime function in group-specific social interactions. Both main effects were statistically independent of variation in body size (no significant interaction, Figures 13 B,D).
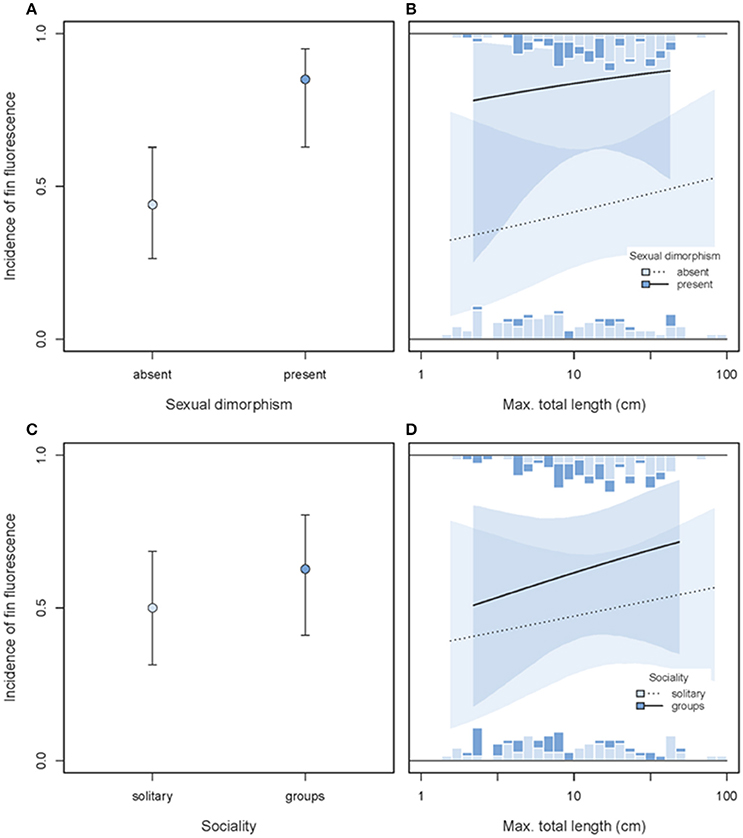
Figure 13. Incidence of fin fluorescence as predicted by sexual dimorphism (A,B) or sociality (C,D) and maximum body length (x-axis). In each row, the left panel illustrates the overall predicted incidences of fin fluorescence (±95% credibility intervals), pooled across body size. The right panel illustrates the interaction between sexual dimorphism or social system and body length (note log10-scale). Stacked marginal histograms display the relative frequency distribution of raw species values. Predicted incidences (lines) and their 95% credibility intervals (shaded areas) are extracted from binomial models taking shared species ancestry into account.
Discussion
Our analyses document substantial variation in the spectral characteristics and body topography of red fluorescence within and between 49 families of marine fishes. We analyzed this variation in the context of five different a priori hypotheses and found that (1) small fish were more likely to be red fluorescent, (2) maximum depth of occurrence did not predict the presence of red fluorescence, (3) benthic species in general and motionless sit-and-wait predators in particular were more likely to show fluorescent patterns consistent with camouflage, (4) species predating on small, eyed prey were more likely to possess red fluorescent eyes, albeit with marginal significance, and (5) sexually dimorphic species were more likely to show fin fluorescence. The latter could not be demonstrated for group-living species.
Phylogenetic Dynamics
Red fluorescence is a phylogenetically dynamic trait that has been repeatedly acquired and lost, or at least dramatically changed in expression, across the fish phylogeny, extending and confirming previous analyses on a smaller data set (Sparks et al., 2014). The resolution and phylogenetic coverage of our analysis is insufficient to determine whether red fluorescent pigmentation is ancient within the fish phylogeny, but it clearly appeared early in bony fish evolution. It appears plausible at least that these evolutionary changes are driven by convergent natural selection in independent lineages rather than representing a random, non-functional corollary of other traits. Comparable phylogenetic patterns in color trait evolution have recently been linked to adaptive function also in other fish. For example, the phylogenetically dynamic red and blue body and fin patterns in male darters associate with habitat structure, possibly in the context of predator exposure (Ciccotto and Mendelson, 2016a). In butterflyfish, the evolution of stripe and eyespot patterns was inconsistent with previously assumed predator-avoidance function, but rather co-varied with species ecology (Kelley et al., 2013). Similarly, the evolution of stripe patterns in cichlids (Seehausen and van Alphen, 1999) was phylogenetically highly dynamic and suggested to being driven by ecological specialization beyond phylogenetic affinities.
Interestingly, red fluorescence dominates in cryptic fish groups and seems less prominent in families with conspicuous reflective coloration (see also Sparks et al., 2014)—with the exception of wrasses (Labridae). This suggests that red fluorescence is not primarily used to enhance an already existing reflectance pattern, but rather associates with environmental conditions where red reflectance is not possible, as present in the stenospectral zone.
Variation in Fluorescence Emission Wavelengths
It is striking that the emission peaks (λmax) of fluorescent structures cluster in three distinct ranges in the near, deep, and far red. While this study did not investigate the cellular expression of fluorescence, the pattern suggests the presence of at least three groups of red fluorescent pigments in marine fishes. The actual fluorophores have not yet been characterized, but previous work identified three different fluorescent mechanisms: (i) fluorescent iridophores with fluorescent guanine crystals (Michiels et al., 2008; Wucherer and Michiels, 2014), (ii) fluorescent chromatophores (Wucherer and Michiels, 2012), and (iii) fluorescent scales and fin rays (Michiels et al., 2008). Biochemical analyses are now required to characterize the molecular mechanisms and are likely to reveal cryptic within- and between-family diversity that may be hidden behind similar peak emissions in our study.
Hypothesis 1: Prevalence in Small Fish Confirmed
Our data show that red fluorescence is more common in small species. Assuming that these forage and communicate over short distances, the pattern is consistent with the idea that red fluorescence is associated with short-range vision measured in centimeters rather than meters. Hence, red fluorescence may well be specific for “small world” functions. Such an effect is less likely for yellow or green fluorescence (e.g., Sparks et al., 2014; Gruber et al., 2016) because the emitted wavelength will travel through water over longer distances. Assuming a function in vision as well, we would predict their prevalence to be independent of body size. For example, the bright yellow tails of some tropical fusiliers (e.g., Caesio cuning) and goatfishes (e.g., Mulloidichthys vanicolensis) exhibit yellow fluorescence that may enhance the existing reflective signal and serve as a signal for group coherence or as a visual distractor for predators.
Hypothesis 2: Association with Depth Rejected
We could not confirm that species inhabiting greater depths are more likely to express red fluorescence and can think of four non-exclusive explanations. First, light environments poor in long wavelength light are also abundant in shallow water, for example in shaded areas, in turbid water, or at dusk and dawn. Hence, with depth representing just one of several factors favoring red fluorescence, our analysis of gross depth may easily fail to detect this association. Consistent with this idea, the triplefin T. delaisi adjusts fluorescence intensity primarily to ambient brightness rather than ambient spectrum (Harant et al., 2016), and may therefore directly respond to diurnal or seasonal changes in overall brightness, irrespective of depth. Second, maximum depths reported in the literature may be rather inaccurate (cf. Bridge et al., 2016) because they are neither systematically assessed nor representative for a species' average depth distribution. Third, our sampling efforts were restricted to depths within reach of regular SCUBA diving, above −30 m. Given substantial within-species, depth-associated variation in fluorescence (Meadows et al., 2014) a general depth effect between species may be obscured. Finally, the benefits of expressing fluorescence may be limited to intermediate depths (e.g., −10 to −100 m) with enough ambient blue-green light to induce fluorescence (unless coupled with a local chemiluminescent source, Douglas et al., 2000). This may be further complicated by the fact that fish may inhabit very different habitats or depths depending on age or season. As for now, however, there is too little information to take such non-linear depth effects into account.
Hypothesis 3: Consistency with Camouflage through Background Color Matching
We statistically confirm an association between a bottom-dwelling, nearly motionless, predatory lifestyle and full-body, patchy fluorescence (Sparks et al., 2014). This supports the suggestion that red fluorescence contributes to camouflage by background matching, where it may complement other camouflaging mechanisms such short-wavelength fluorescence or adjustments in body texture or pigmentation in response to substrate variation. This is particularly likely on complex backgrounds, where sit-and-wait predators are also anatomically very well adapted to blend in with algae, corals, and sponges. The latter generate a background of patchy fluorescence with most emission peaks in the near and deep red. Deep red fluorescence is of particular interest, because chlorophyll produces a distinctive red fluorescent signal around 680 nm. This signal is masked by sunlight in shallow water, but becomes clearly visible at depth (Figure 3). Our measurements show that the deep red fluorescence emission of many cryptic species matches this background emission (Figure 9). Deep red fluorescence for camouflage, however, only makes sense if relevant predators or prey from which a fluorescent target species aims to hide can perceive these rather long wavelengths. Future research therefore needs to assess the spectral sensitivity of candidate species and empirically test whether fluorescence improves camouflage toward potential prey or predators.
Hypothesis 4: Red Fluorescent Eyes More Common in Micro-Predators
Red eye fluorescence tended to be most prevalent in species that forage on small, eyed prey. This pattern is consistent with the idea that fish use reflective and fluorescent structures near their pupils similar to dragonfish (Douglas et al., 1998, 2000) and flashlight fish (Howland et al., 1992). “Active photolocation” using local emission of wavelengths (such as red) that are otherwise rare or absent from the environment may allow small fish to induce a highly contrasting eyeshine in cryptic prey (or predators) over short distances (Michiels et al., in submitted). The association described here confirms and generalizes earlier field observations (Meadows et al., 2014) and experimental laboratory work on the triplefin, Tripterygion delaisi, showing active brightness adjustment in its fluorescent irides (Wucherer and Michiels, 2012; Harant et al., 2016).
Hypothesis 5: Red Fluorescence Associated with Sexual Dimorphism, Not Group Living
Gregariousness did not associate with red fin fluorescence. In contrast, and as the strongest pattern among all hypotheses tested, we found red fin fluorescence strongly linked to sexual color dimorphism. This is consistent with the idea that red fluorescent fins could act as an enhancer of sexual signals in mate choice and male-male competition (e.g., in haremic systems), and generalizes earlier findings that orange and red fin displays are important in within-species intra-sexual communication in wrasses (Braun et al., 2014; Gerlach et al., 2014). The degree to which male fluorescent color displays are indeed preferred by females should be tested in experiments similar to those that revealed phylogenetic associations between male coloration and female preference in darters (Ciccotto and Mendelson, 2016b), and then be matched with measurements of spectral sensitivity to assess co-evolution between color pattern and sensory capacities (Pauers et al., 2016).
Can Marine Fish Perceive Red?
Most of the proposed adaptive functions of red fluorescence require that either the emitting species or relevant bystanders can perceive wavelengths beyond 600 nm. Extreme forms of red sensitivity are restricted to deep sea fishes that emit deep red bioluminescence around 700 nm and possess LWS receptors up to λmax = 590 nm in Aristostomias (Partridge and Douglas, 1995) and even λmax = 671 nm in Malacosteus niger (Douglas et al., 1998). Most marine fish inhabiting the photic zone have a single short wavelength cone and a medium wavelength twin or double cone with λmax in the 500–540 nm range (Losey et al., 2003; Marshall et al., 2006). This arrangement, however, is already sufficient to perceive at least near red fluorescence (600–650 nm). This has for instance been inferred from the degree of overlap between the twin cone sensitivity (λmax = 540 nm) and fluorescence peaking at 606 nm in the benthic goby Eviota pellucida (now E. atriventris, Greenfield and Suzuki, 2012) (Michiels et al., 2008). Behavioral evidence confirms this assumption in at least three fish species with “regular” LWS receptors (λmax <540 nm). In the triggerfish Rhinecanthus aculeatus (LWS λmax = 528 nm), foraging preferences show a bias to red stimuli > 600 nm (Cheney et al., 2013). The triplefin T. delaisi (LWS λmax = 530 nm, P.-P. Bitton, unpublished data) recognizes its own red fluorescence (λmax = 600–610 nm) (Kalb et al., 2015), and so does the fairy wrasse C. solorensis (LWS λmax = 532 nm, deep red fluorescence at λmax = 650 nm (Gerlach et al., 2014, 2016). Only few shallow-water marine fish possess photoreceptors that are more explicitly tuned to perceive red. For example, the wrasse Thalassoma duperrey (LWS λmax = 570 nm) can perceive a red band in its own color pattern under natural light (Barry and Hawryshyn, 1999). Similar long-wavelength photoreceptors have been described for several seahorses and pipefish (LWS λmax = 560 and 580 nm, Mosk et al., 2007) and the goby Gobiusculus flavescens (LWS λmax = 553 nm) (Utne-Palm and Bowmaker, 2006). As shown by our current study, all these species belong to families that feature a high incidence of red fluorescence.
A Word of Caution
Our current analyses face two limitations. First, solid quantitative information on ecological and biological traits is only available for a handful of marine fish species. For most of our study species, information on, for example, primary food types, foraging style, sexual dichromatism, or maximum depth range could primarily draw from rather rudimentary statements. This adds substantial noise as typical to large comparative analyses. We carefully avoided confounding biases, but noise in the life history data in particular has potential to substantially lower the statistical power to detect associations between red fluorescence and ecological traits. Second, a fully resolved species-level phylogenetic hypothesis for at least a large proportion of the species under investigation does not exist. Hence, we resorted to simplified analyses, first by investigating trait evolution at the family level, and second by controlling for shared ancestry with a rather superficial correlation matrix, taking the taxonomic levels “order,” “family,” and “genus” into account. We expect that ongoing advances in overall fish phylogeny will soon enable more fine-tuned phylogenetic analyses on red fluorescence and its association with ecology focused on within-family variation as e.g., in gobies, triplefins, or wrasses.
Author Contributions
NM, JT, and NA conceived the study. JT and TG acquired most spectrometric measurements and conducted preliminary data analysis. NM contributed most field assessments of fluorescence, supported by JT, TG, and MM. NA was responsible for all data analysis, and drafted the manuscript. MM and NM substantially supported manuscript drafting and data analysis. All authors read and approved the final manuscript.
Conflict of Interest Statement
The authors declare that the research was conducted in the absence of any commercial or financial relationships that could be construed as a potential conflict of interest.
Acknowledgments
We would like to thank Jens Pfann (data acquisition), Gregor Schulte (technical assistance), Christoph Hösler and Christopher Schwarzer (raw-data processing routines), Sandra Dangelmayer, Dennis Sprenger, and Klara Wolf (field support), Sabrina Hug (image analysis), Nadine Kalb (trait scoring), Martina Hohloch and Andreas Oelkrug (fish maintenance), as well as Ronald Fricke, Jürgen Herler, Helen Larson, and Rick Winterbottom (fish identification). This project was funded by the German Research Foundation (DFG) Reinhart Koselleck Grant Mi482/13-1 “Red fluorescence in reef fishes: Functions and mechanisms” to NM. We acknowledge support by the Deutsche Forschungsgemeinschaft (DFG) and the Open Access Publishing Fund of the University of Tübingen.
Supplementary Material
The Supplementary Material for this article can be found online at: https://www.frontiersin.org/article/10.3389/fevo.2016.00126/full#supplementary-material
Supplementary Material A
Systematic list of fish taxa represented in the current comparative dataset. The Table shows our ratings of red fluorescence (0 = absent, 1 = present), substrate association (1 = benthic moving, 2 = benthic sit-and-wait, 3 = non-benthic), prey type (1 = microscopic prey with eyes, 2 = macroscopic prey with eyes, 3 = prey without eyes), sexual color dimorphism (0 = absent, 1 = present), and sociality (1 = solitary, 2 = group-living). Within fluorescent species, we scored (where possible) the presence of patchy fluorescence, of iris fluorescence, and of fin fluorescence (0 = absent, 1 = present). Where spectrometric measurements were available, we add the intensity quartile (ranging from 1 for the lowest intensity quartile to 4 for the highest intensity quartile) and the number of distinct fluorescent emission peaks. Finally, we list the maximum depth of occurrence (in m) and the maximum total body length (in cm) for each species. Empty cells are due to missing data. For details and sources see the Material and Methods section in the main text.
Supplementary Material B
Major literature sources to complement ecological and biological data to the information available at fishbase.org.
Supplementary Material C
Systematic list summarizing all taxa with spectral data for a detailed characterization of red fluorescence. Each row refers to a single distinct fluorescent emission peak and provides information on peak number, the emission category (1 = near red, 2 = deep red, 3 = far red), the wavelength at peak emission (lambda max), absolute emission intensity (in counts per nm per ms), and the intensity quartile at peak emission.
Supplementary Material D
Overview about the origin for the phylogenetic position of fish families as represented in Figure 5.
References
Aksnes, D. L., and Giske, J. (1993). A theoretical model of aquatic visual feeding. Ecol. Model. 67, 233–250. doi: 10.1016/0304-3800(93)90007-F
Alieva, N. O., Konzen, K. A., Field, S. F., Meleshkevitch, E. A., Hunt, M. E., Beltran-Ramirez, V., et al. (2008). Diversity and evolution of coral fluorescent proteins. PLoS ONE 3:e2680. doi: 10.1371/journal.pone.0002680
Allen, G. R., Erdmann, M. V., Robertson, D., Anderson, R. C., Baker, N., Lim, K., et al. (2014). Reef Fishes of the East Indies. Honolulu, HI: University of Hawaii Press.
Allen, G. R., Midgley, S. H., and Allen, M. (2002). Field Guide to the Freshwater Fishes of Australia. Perth: Western Australian Museum.
Allen, G. R., Steene, R., Humann, P., and DeLoach, N. (2003). Reef Fish Identification: Tropical Pacific. Jacksonville, FL: New World Pubns Inc.
Baldauf, S. A., Bakker, T. C., Kullmann, H., and Thünken, T. (2011). Female nuptial coloration and its adaptive significance in a mutual mate choice system. Behav. Ecol. 22, 478–485. doi: 10.1093/beheco/arq226
Barry, K. L., and Hawryshyn, C. W. (1999). Spectral sensitivity of the Hawaiian saddle wrasse, Thalassoma duperrey, and implications for visually mediated behaviour on coral reefs. Environ. Biol. Fish. 56, 429–442. doi: 10.1023/A:1007556112449
Bates, D., Maechler, M., and Bolker, B. (2013). lme4: Linear Mixed-Effects Models Using S4 Classes. R package version 0.999999-2. Available online at: http://cran.r-project.org/web/packages/lme4/index.html.
Ben-Zvi, O., Eyal, G., and Loya, Y. (2014). Light-dependent fluorescence in the coral Galaxea fascicularis. Hydrobiologia 759, 15–26. doi: 10.1007/s10750-014-2063-6
Betancur, -R. R., Broughton, R. E., Wiley, E. O., Carpenter, K., López, J. A., Li, C., et al. (2013). The tree of life and a new classification of bony fishes. PLoS Curr. 5:53ba26640df0ccaee75bb165c8c26288. doi: 10.1371/currents.tol.53ba26640df0ccaee75bb165c8c26288
Brady, P. C., Travis, K. A., Maginnis, T., and Cummings, M. E. (2013). Polaro–cryptic mirror of the lookdown as a biological model for open ocean camouflage. Proc. Natl. Acad. Sci.U.S.A. 110, 9764–9769. doi: 10.1073/pnas.1222125110
Brandley, N. C., Speiser, D. I., and Johnsen, S. (2013). Eavesdropping on visual secrets. Evol. Ecol. 27, 1045–1068. doi: 10.1007/s10682-013-9656-9
Braun, C., Michiels, N., Siebeck, U., and Sprenger, D. (2014). Signalling function of long wavelength colours during agonistic male-male interactions in the wrasse Coris julis. Mar. Ecol. Prog. Ser. 504, 277–286. doi: 10.3354/meps10760
Bridge, T. C. L., Luiz, O. J., Coleman, R. R., Kane, C. N., and Kosaki, R. K. (2016). Ecological and morphological traits predict depth-generalist fishes on coral reefs. Proc. R. Soc. Lond. B Biol. Sci. 283:20152332. doi: 10.1098/rspb.2015.2332
Cheney, K. L., Newport, C., McClure, E. C., and Marshall, N. J. (2013). Colour vision and response bias in a coral reef fish. J. Exp. Biol. 216, 2967–2973. doi: 10.1242/jeb.087932
Ciccotto, P. J., and Mendelson, T. C. (2016a). The ecological drivers of nuptial color evolution in darters (Percidae: Etheostomatinae). Evolution 70, 745–756. doi: 10.1111/evo.12901
Ciccotto, P. J., and Mendelson, T. C. (2016b). Phylogenetic correlation between male nuptial color and behavioral responses to color across a diverse and colorful genus of freshwater fish (Etheostoma spp., Teleostei: Percidae). Ethology 122, 245–256. doi: 10.1111/eth.12465
Clark, E. (1979). Red Sea fishes of the family Tripterygiidae with descriptions of eight new species. Isr. J. Zool. 28, 65–113.
Díaz-Uriarte, R., and Garland, T. Jr. (1998). Effects of branch length errors on the performance of phylogenetically independent contrasts. Syst. Biol. 47, 654–672. doi: 10.1080/106351598260653
Douglas, R. H., Mullineaux, C. W., and Partridge, J. C. (2000). Long–wave sensitivity in deep–sea stomiid dragonfish with far–red bioluminescence: evidence for a dietary origin of the chlorophyll–derived retinal photosensitizer of Malacosteus niger. Philos. Trans. R. Soc. Lond. B Biol. Sci. 355, 1269–1272. doi: 10.1098/rstb.2000.0681
Douglas, R., Partridge, J., Dulai, K., Hunt, D., Mullineaux, C., Tauber, A., et al. (1998). Dragon fish see using chlorophyll. Nature 393, 423–424. doi: 10.1038/30871
Endler, J. A. (1981). An overview of the relationships between mimicry and crypsis. Biol. J. Linnean Soc. 16, 25–31. doi: 10.1111/j.1095-8312.1981.tb01840.x
Endler, J. A. (1990). On the measurement and classification of colour in studies of animal colour patterns. Biol. J. Linnean Soc. 41, 315–352. doi: 10.1111/j.1095-8312.1990.tb00839.x
Field, S. F., Bulina, M. Y., Kelmanson, I. V., Bielawski, J. P., and Matz, M. V. (2006). Adaptive evolution of multicolored fluorescent proteins in reef-building corals. J. Mol. Evol. 62, 332–339. doi: 10.1007/s00239-005-0129-9
Fricke, R. (1997). Tripterygiid Fisches of the Western and Central Pacific. Koenigstein: Koeltz Scientific Books.
Froese, R., and Pauly, D. (eds.) (2014). FishBase. World Wide Web Electronic Publication. version (06/2014). Available online at: www.fishbase.org
Garland, T. Jr., and Ives, A. R. (2000). Using the past to predict the present: confidence intervals for regression equations in phylogenetic comparative methods. Am. Nat. 155, 346–364. doi: 10.1086/303327
Gerlach, T., Sprenger, D., and Michiels, N. K. (2014). Fairy wrasses perceive and respond to their deep red fluorescent coloration. Proc. R. Soc. B Biol. Sci. 281:20140787. doi: 10.1098/rspb.2014.0787
Gerlach, T., Theobald, J., Hart, N. S., Collin, S. P., and Michiels, N. K. (2016). Fluorescence characterisation and visual ecology of pseudocheilinid wrasses. Front. Zool. 13:13. doi: 10.1186/s12983-016-0145-1
Greenfield, D. W., and Suzuki, T. (2012). Eviota atriventris, a new goby previously misidentified as Eviota pellucida Larson (Teleostei: Gobiidae). Zootaxa 3197, 55–62.
Gruber, D. F., Kao, H.-T., Janoschka, S., Tsai, J., and Pieribone, V. A. (2008). Patterns of fluorescent protein expression in scleractinian corals. Biol. Bull. 215, 143–154. doi: 10.2307/25470695
Gruber, D. F., Loew, E. R., Deheyn, D. D., Akkaynak, D., Gaffney, J. P., Smith, W. L., et al. (2016). Biofluorescence in catsharks (Scyliorhinidae): fundamental description and relevance for Elasmobranch visual ecology. Sci. Rep. 6:24751. doi: 10.1038/srep24751
Haddock, S. H. D., and Dunn, C. W. (2015). Fluorescent proteins function as a prey attractant: experimental evidence from the hydromedusa Olindias formosus and other marine organisms. Biol. Open 4, 1094–1104. doi: 10.1242/bio.012138
Haddock, S. H., Dunn, C. W., Pugh, P. R., and Schnitzler, C. E. (2005). Bioluminescent and red-fluorescent lures in a deep-sea siphonophore. Science 309, 263–263. doi: 10.1126/science.1110441
Harant, U. K., Michiels, N. K., Anthes, N., and Meadows, M. G. (2016). The consistent difference in red fluorescence in fishes across a 15 m depth gradient is triggered by ambient brightness, not by ambient spectrum. BMC Res. Notes 9:107. doi: 10.1186/s13104-016-1911-z
Hart, P. J., Hall, R., Ray, W., Beck, A., and Zook, J. (2015). Cicadas impact bird communication in a noisy tropical rainforest. Behav. Ecol. 26, 839–842. doi: 10.1093/beheco/arv018
Holleman, W. (2005). A review of the triplefin fish genus Enneapterygius (Blennioidei: Tripterygiidae) in the western Indian Ocean, with descriptions of four new species. Smithiana Bull. 5, 1–28.
Howland, H. C., Murphy, C. J., and Mccosker, J. E. (1992). Detection of eyeshine by flashlight fishes of the family Anomalopidae. Vision Res. 32, 765–769. doi: 10.1016/0042-6989(92)90191-K
Johnsen, S. (2012). The Optics of Life: A Biologist's Guide to Light in Nature. Princeton, NJ: Princeton University Press.
Kalb, N., Schneider, R., Sprenger, D., and Michiels, N. (2015). The red-fluorescing marine fish Tripterygion delaisi can perceive its own red fluorescent color. Ethology 121, 1–11. doi: 10.1111/eth.12367
Kelley, J. L., Fitzpatrick, J. L., and Merilaita, S. (2013). Spots and stripes: ecology and colour pattern evolution in butterflyfishes. Proc. R. Soc. B Biol. Sci. 280:20122730. doi: 10.1098/rspb.2012.2730
Kraaijeveld, K., Kraaijeveld-Smit, F. J., and Komdeur, J. (2007). The evolution of mutual ornamentation. Anim. Behav. 74, 657–677. doi: 10.1016/j.anbehav.2006.12.027
Lagorio, M. G., Cordon, G. B., and Iriel, A. (2015). Reviewing the relevance of fluorescence in biological systems. Photochem. Photobiol. Sci. 14, 1538–1559. doi: 10.1039/C5PP00122F
Lefcheck, J. S. (2016). piecewiseSEM: piecewise structural equation modelling in R for ecology, evolution, and systematics. Methods Ecol. Evol. 7, 573–579. doi: 10.1111/2041-210X.12512
Li, K. T., Wetterer, J. K., Nelson, G., and Hairston, Jr. (1985). Fish size, visula resolution, and prey selectivity. Ecology 66, 1729–1735. doi: 10.2307/2937368
Losey, G., McFarland, W., Loew, E., Zamzow, J., Nelson, P., and Marshall, N. (2003). Visual biology of Hawaiian coral reef fishes. I. Ocular transmission and visual pigments. Copeia 2003, 433–454. doi: 10.1643/01-053
Luiz, O. J., Allen, A. P., Robertson, D. R., Floeter, S. R., Kulbicki, M., Vigliola, L., et al. (2013). Adult and larval traits as determinants of geographic range size among tropical reef fishes. Proc. Natl. Acad. Sci.U.S.A. 110, 16498–16502. doi: 10.1073/pnas.1304074110
Marshall, J., Carleton, K. L., and Cronin, T. (2015). Colour vision in marine organisms. Curr. Opin. Neurobiol. 34, 86–94. doi: 10.1016/j.conb.2015.02.002
Marshall, J., Vorobiev, M., and Siebeck, U. (2006). “What does a reef fish see when it sees a reef fish?,” in Communication in Fishes, Vol. 2. Visual Communication eds F. Ladich, S. P. Collin, P. Moller, and B. G. Kapoor (Enfield, CT: Science Publisher Inc), 393–422.
Meadows, M. G., Anthes, N., Dangelmayer, S., Alwany, M. A., Gerlach, T., Schulte, G., et al. (2014). Red fluorescence increases with depth in reef fishes, supporting a visual function, not UV protection. Proc. R. Soc. B Biol. Sci. 281:20141211. doi: 10.1098/rspb.2014.1211
Michiels, N. K., Anthes, N., Hart, N. S., Herler, J., Meixner, A. J., Schleifenbaum, F., et al. (2008). Red fluorescence in reef fish: a novel signalling mechanism? BMC Ecol. 8:16. doi: 10.1186/1472-6785-8-16
Mosk, V., Thomas, N., Hart, N. S., Partridge, J. C., Beazley, L. D., and Shand, J. (2007). Spectral sensitivities of the seahorses Hippocampus subelongatus and Hippocampus barbouri and the pipefish Stigmatopora argus. Vis. Neurosci. 24, 345–354. doi: 10.1017/S0952523807070320
Munz, F. W., and McFarland, W. N. (1973). The significance of spectral position in the rhodopsins of tropical marine fishes. Vision Res. 13, 1829–1874. doi: 10.1016/0042-6989(73)90060-6
Nakagawa, S., and Schielzeth, H. (2013). A general and simple method for obtaining R2 from generalized linear mixed-effects models. Methods Ecol. Evol. 4, 133–142. doi: 10.1111/j.2041-210x.2012.00261.x
Norris, K. S., and Schilt, C. R. (1988). Cooperative societies in three- dimensional space: on the origins of aggregations, flocks, and schools, with special reference to dolphins and fish. Ethol. Sociobiol. 9, 149–179. doi: 10.1016/0162-3095(88)90019-2
O'Brien, W. J. (1979). The predator-prey interaction of planktivorous fish and zooplankton: recent research with planktivorous fish and their zooplankton prey shows the evolutionary thrust and parry of the predator-prey relationship. Am. Sci. 67, 572–581.
Pagel, M. (1994). Detecting correlated evolution on phylogenies: a general method for the comparative analysis of discrete characters. Proc. R. Soc. Lond. B Biol. Sci. 255, 37–45. doi: 10.1098/rspb.1994.0006
Paradis, E., Claude, J., and Strimmer, K. (2004). APE: analyses of phylogenetics and evolution in R language. Bioinformatics 20, 289–290. doi: 10.1093/bioinformatics/btg412
Partridge, J. (1990). “The colour sensitivity and vision of fishes,” in Light and Life in the Sea, eds P. J. Herring, A. K. Campbell, M. Whitfield, and L. Maddock. (Cambridge: Cambridge University Press), 167–184.
Partridge, J. C., and Douglas, R. H. (1995). Far-red sensitivity of dragon fish. Nature 375, 21–22. doi: 10.1038/375021a0
Pauers, M. J., Kuchenbecker, J. A., Joneson, S. L., and Neitz, J. (2016). Correlated evolution of short wavelength sensitive photoreceptor sensitivity and color pattern in Lake Malawi cichlids. Front. Ecol. Evol. 4:12. doi: 10.3389/fevo.2016.00012
R Core Team (2013). R: A Language and Environment for Statistical Computing. Vienna: R Foundation for Statistical Computing [Online]. Available online at: http://www.R-project.org/.
Revell, L. J. (2012). phytools: an R package for phylogenetic comparative biology (and other things). Methods Ecol. Evol. 3, 217–223. doi: 10.1111/j.2041-210X.2011.00169.x
Rowland, W. (1999). Studying visual cues in fish behavior: a review of ethological techniques. Environ. Biol. Fish. 56, 285–305. doi: 10.1023/A:1007517720723
Salih, A., Larkum, A., Cox, G., Kühl, M., and Hoegh-Guldberg, O. (2000). Fluorescent pigments in corals are photoprotective. Nature 408, 850–853. doi: 10.1038/35048564
Schlichter, D., and Fricke, H. (1990). Coral host improves photosynthesis of endosymbiotic algae. Naturwissenschaften 77, 447–450. doi: 10.1007/BF01135950
Schmidt, D., and O'Brien, W. J. (1982). Planktivorous feeding ecology of Arctic grayling (Thymallus arcticus). Can. J. Fish. Aquat. Sci. 39, 475–482. doi: 10.1139/f82-065
Seehausen, O., and van Alphen, J. (1999). Evolution of colour patterns in East African cichlid fish. J. Evol. Biol. 12, 514–534. doi: 10.1046/j.1420-9101.1999.00055.x
Slabbekoorn, H., and Peet, M. (2003). Ecology: birds sing at a higher pitch in urban noise. Nature 424, 267–267. doi: 10.1038/424267a
Sparks, J. S., Schelly, R. C., Smith, W. L., Davis, M. P., Tchernov, D., Pieribone, V. A., et al. (2014). The covert world of fish biofluorescence: a phylogenetically widespread and phenotypically variable phenomenon. PLoS ONE 9:e83259. doi: 10.1371/journal.pone.0083259
Tamura, T. (1957). A study of visual perception in fish, especially on resolving power and accommodation. Bull. Jap. Soc. Sci. Fish 22, 536–557. doi: 10.2331/suisan.22.536
Utne-Palm, A. C., and Bowmaker, J. K. (2006). Spectral sensitivity of the two-spotted goby Gobiusculus flavescens (Fabricius): a physiological and behavioural study. J. Exp. Biol. 209, 2034–2041. doi: 10.1242/jeb.02171
Wucherer, M. F., and Michiels, N. K. (2012). A fluorescent chromatophore changes the level of fluorescence in a reef fish. PLoS ONE 7:e37913. doi: 10.1371/journal.pone.0037913
Wucherer, M. F., and Michiels, N. K. (2014). Regulation of red fluorescent light emission in a cryptic marine fish. Front. Zool. 11:1. doi: 10.1186/1742-9994-11-1
Keywords: fluorescence, animal coloration, color vision, camouflage, prey detection, sexual signaling, visual contrast
Citation: Anthes N, Theobald J, Gerlach T, Meadows MG and Michiels NK (2016) Diversity and Ecological Correlates of Red Fluorescence in Marine Fishes. Front. Ecol. Evol. 4:126. doi: 10.3389/fevo.2016.00126
Received: 13 July 2016; Accepted: 18 October 2016;
Published: 07 November 2016.
Edited by:
Wayne Iwan Lee Davies, University of Western Australia, AustraliaReviewed by:
Michael J. Pauers, Milwaukee Public Museum, USAJohn S. Taylor, University of Victoria, Canada
Copyright © 2016 Anthes, Theobald, Gerlach, Meadows and Michiels. This is an open-access article distributed under the terms of the Creative Commons Attribution License (CC BY). The use, distribution or reproduction in other forums is permitted, provided the original author(s) or licensor are credited and that the original publication in this journal is cited, in accordance with accepted academic practice. No use, distribution or reproduction is permitted which does not comply with these terms.
*Correspondence: Nils Anthes, nils.anthes@uni-tuebingen.de
†These authors have contributed equally to this work.