Autotrophic Stoichiometry Emerging from Optimality and Variable Co-limitation
 Kai W. Wirtz
 Onur Kerimoglu
- Ecosystem Modeling, Institute of Coastal Research, Helmholtz-Zentrum Geesthacht, Geesthacht, Germany
Autotrophic organisms reveal an astounding flexibility in their elemental stoichiometry, with potentially major implications on biogeochemical cycles and ecological functioning. Notwithstanding, stoichiometric regulation, and co-limitation by multiple resources in autotrophs were in the past often described by heuristic formulations. In this study, we present a mechanistic model of autotroph growth, which features two major improvements over the existing schemes. First, we introduce the concept of metabolic network independence that defines the degree of phase-locking between accessory machines. Network independence is in particular suggested to be proportional to protein synthesis capability as quantified by variable intracellular N:C. Consequently, the degree of co-limitation becomes variable, contrasting with the dichotomous debate on the use of Liebig's law or the product rule, standing for constantly low and high co-limitation, respectively. Second, we resolve dynamic protein partitioning to light harvesting, carboxylation processes, and to an arbitrary number of nutrient acquisition machineries, as well as instantaneous activity regulation of nutrient uptake. For all regulatory processes we assume growth rate optimality, here extended by an explicit consideration of indirect feed-back effects. The combination of network independence and optimal regulation displays unprecedented skill in reproducing rich stoichiometric patterns collected from a large number of published chemostat experiments. This high skill indicates (1) that the current paradigm of fixed co-limitation is a critical short-coming of conventional models, and (2) that stoichiometric flexibility in autotrophs possibly reflects an optimality strategy. Numerical experiments furthermore show that regulatory mechanisms homogenize the effect of multiple stressors. Extended optimality alleviates the effect of the most limiting resource(s) while down-regulating machineries for the less limiting ones, which induces an ubiquitous response surface of growth rate over ambient resource levels. Our approach constitutes a basis for improved mechanistic understanding and modeling of acclimative processes in autotrophic organisms. It hence may serve future experimental and theoretical investigations on the role of those processes in aquatic and terrestrial ecosystems.
1. Introduction
Autotrophs display an astounding flexibility of their elemental composition. This stoichiometric flexibility is recognized to have implications on biogeochemical cycles across a vast range of a spatial and temporal scales (Lenton and Watson, 2007; Weber and Deutsch, 2010). Stoichiometric variations also govern trophic interactions and the flow of material and energy from autotrophs toward the food-web (Hessen, 1992; Sterner and Elser, 2002). Stoichiometric regulation has often been reported to be significant in autotrophs (e.g., Rhee, 1974; Healey, 1985; Ågren, 2004), and, as a consequence, is increasingly subject to both empirical analysis (e.g., Harpole et al., 2011; Hillebrand et al., 2013; Martiny et al., 2013) and theoretical approaches (e.g., Ågren et al., 2012; Pahlow et al., 2013; Daines et al., 2014).
After Redfield (1958) argued that the ratios of carbon (C), nitrogen (P), and phosphorus (P) of both plankton and sea water are rather fixed, and following Fleming (1940), at a respective atomic 106:16:1 ratio, a substantial body of research sought explanations for the governance of, and deviations from the Redfield ratio. In the light of evidence that particular cellular structures (ribosomes and chloroplast) with specific functional responsibilities (protein synthesis and light harvesting) have substantially different chemical compositions (Rhee, 1978; Geider and La Roche, 2002), stoichiometric variations are conceptualized as internal optimization of cellular allocations in response to changing environmental conditions. This “optimality view” reflects highly efficient resource processing in the evolutionary mostly old lineages of autotrophs. Optimality, indeed, was shown to resolve variations in stoichiometry both for plants (e.g., Hilbert, 1990; Friend, 1991; Hollinger, 1996; Wirtz, 2000; Ågren et al., 2012) and for phytoplankton (e.g., Shuter, 1979; Bloom et al., 1985; Klausmeier et al., 2004a; Wirtz and Pahlow, 2010; Smith et al., 2011; Pahlow et al., 2013; Talmy et al., 2013). However, the application of optimality theory to co-limitation by multiple resources discloses a fundamental problem in the approach as the identification of a goal function appears ambiguous in two important aspects. First, no commonly accepted function for co-limitation effects by multiple nutrients exists. Secondly, as for any multi-objective optimization, the target elementary “currency” needs to be specified: Either can C-uptake be maximized, or P- and N-uptake, but each choice would induce a different regulatory dynamics.
The first problem of functionally formulating effects of multiple nutrient limitation is encountered in many models of autrophic growth, also outside optimality theory. Approaches adopted so far can be categorized into two groups. The first group comprises popular heuristic formulations such as the von Liebig (1855) and product rules. Although their simplicity offers obvious advantages, and conceptual implication are clear, i.e., strictly essential resources for Liebig and interactive resources for the product rule (Tilman, 1980), evidence for both views exist, for example, for the case of nitrogen and phosphorus in autotrophs (Elser et al., 2007; Harpole et al., 2011), preventing a conclusive resolution of the dichotomy. The second group of co-limitation models descent from the idea of mutual dependencies in the biochemical function of each element (Saito et al., 2008). Interdependencies in the processing of macro-nutrients (N and P) have been addressed by Ågren et al. (2012); Bonachela et al. (2013); Pahlow et al. (2013). However, these works are built on specific physiological assumptions such as a critical P-dependency of N-uptake and are accordingly difficult to generalize.
Here, we propose a new theory of co-limitation, in which the growth rate dependency on multiple quotas is linked to the queuing theory established in operational research. This will allow to define and use as novel control variable the co-limitation strength. The co-limitation formulation derived from queuing theory then provides the basis for extending classical optimality approaches and to tackle the second conceptual problem of optimality in autotrophic regulation that is the target currency. As already suggested in previous works (Wirtz and Pahlow, 2010; Smith et al., 2011; Wirtz, 2013), variational principles known from physics can express feed-back effects of dynamically coupled metabolic cycles and this way merge an arbitrary number of target currencies into a single objective function. This idea is here for the first time formulated in the context of multiple nutrient limitation. The resulting optimality scheme is combined with a resource allocation model for autotrophs and validated using a large set of published chemostat experiments revealing extreme variations in the stoichiometry of prokaryotes, unicellular eukaryotes, and plants. Degree and origin of co-limitation strength is then assessed through numerical experiments.
2. Model Description
2.1. Quota Dependent Co-limitation and Intermittency
In seeking a high generality, we resolve an arbitrary number of resources that are relevant to autotrophic growth. These resources are here distinguished by the index i (e.g., i = N, P, energy). Their availability within the cell or body tissue is described by normalized quotas qi (relative to maximum and minimum carbon based quota, see Equation S1). At qi = 0, no allocatable internal pool exists, whereas around qi = 1 this pool can sufficiently fuel all internal metabolic demands related to resource/element cycle i. The normalized quota can furthermore be considered to determine the biosynthesis or processing rate of element i since this rate ceases to zero at qi ≃ 0 while it reaches the maximum usage rate at saturated intracellular availability qi = 1. The simple relationship between and qi here only serves for disclosing the implicitly made assumptions of classical co-limitation models and, hence, is not critical for the results later shown in this work. These classical schemes offer various baseline descriptions of how the overall biosynthesis rate depends on individual quotas qi or processing rates , respectively. These models can be separated into three idealized categories, two extremes and a compromising case. In the first scenario, individual resource cycles run in parallel, thus fully independently, which corresponds to the classical Liebig law where only the most rate limiting elemental processing with maximal Ti, or minimal , resp., controls the overall biosynthesis rate of cellular material (Figure 1, Equation 1a). In the second case, resource cycles advance in series but still independently. Processing times are then summed up to Ttot = ∑Ti, equivalent to Figure 1, Equation 1b, a formulation close to the “biochemically dependent co-limitation” proposed by Buitenhuis et al. (2003); Saito et al. (2008). A variant of Equation (1b), , has been derived in reference to enzyme kinetics by the Dynamic Energy Budget (DEB) theory (Kooijman, 2010). Thirdly, one can assume an intimate bound between sub-cycles such that a delay in one cycle (i) fully constrains other biosynthesis processes (j ≠ i). These amplified delays translate to a multiplication of all turnover times of individual limiting resources, Ttot = T1 · T2 …, as formulated in the product rule or Equation (1c).
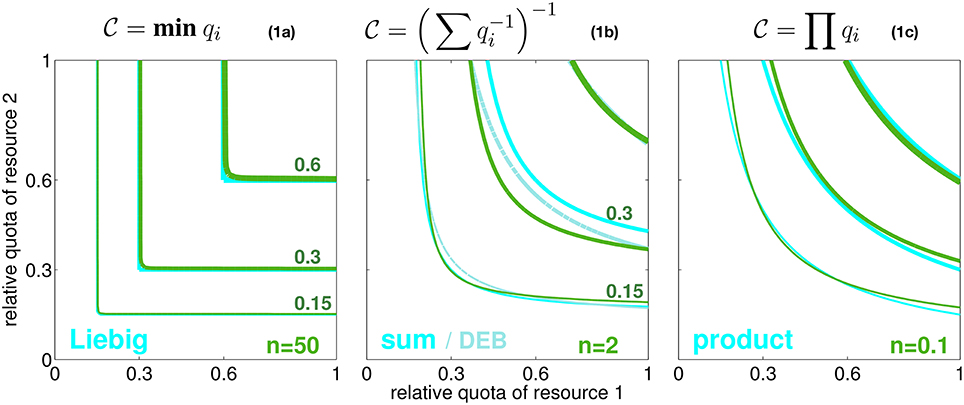
Figure 1. Three idealized modes of co-limitation by two resources. From left to right: the Liebig, sum, and product formulation, both as growth-contour plots and respective formulae Equations 1a–c. Contour lines for , 0.3, and 0.6 are plotted with increasing line thickness as a function of the normalized quotas of elements 1 and 2 (q1 and q2). Also a model similar to the sum rule, , is given, which is proposed by the DEB theory (light cyan lines). The green contour lines show the co-limitation intensity according to Equation (2) with different values of the independence n as given in the subplots.
However, none of the co-limitation formulations visualized in Figure 1 offers an explanation for the conditions under which it may apply. The modes represent fixed metabolic network topologies that are arbitrarily set and in particular do not allow for an interchange (e.g., from parallel to serial processing) occurring, e.g., at different context settings or in different species or groups of autotrophs. We hence introduce the variable coefficient n that quantifies the degree of independence in networked (biosynthetic) activities. Independence n resembles the processing synchrony, or inverse intermittency, introduced by Wirtz (2012), which describes the probability of phase-locking between sub-steps in a process chain. Increasing values of n correspond to improved synchronization within the scheduling of sequential sub-processes. Along the classification made above, growing independence n describes the transition from serial processing of sub-stages to their parallel processing. This change in scheduling has already been studied in operational research (Saaty, 1961; Cox and Smith, 1991). Following the assumption of a Poisson statistics of phase-locking between sub-stages (Kendall, 1953), a continuous intermittency or network interdependency can be represented by the queuing function gn (Wirtz, 2012). To obtain the integral processing rate, or internal co-limitation degree, , the queueing function gn is applied to the ratio between two turnover times qj/qi = Ti/Tj:
where the correction factor cf, only required for very low n where it deviates from one, will be outlined in Section S1.1. Implicit to the application of gn to the (processing time) ratio qj/qi is that during the processing of resource i (e.g., N assimilation) a slowing in cycle j (e.g., P assimilation) can lead to “intermittent stops,” thus an overall reduction in , which occurs at probability gn(qj/qi). Contrary to former approaches, the interference is ubiquitous for all considered metabolic cycles, thus works the same way between, e.g., silicate and carbon or phosphorus and silicate metabolisms. The description remains agnostic about details in the stoichiometric demands of individual metabolisms such as P-demand for building ribosomes or locked cell cycle and assimilation of other elements due to slowed down wall growth under Si-deficiency, but it maintains a generic account of all those interdependencies. The queueing function gn(qj/qi) then quantifies the degree of phase-locking between the sub-cycles i and j. Due to the monotonic form of gn(r) visualized in Figure S1, a small ratio qj/qi translates to a small gn with quasi-linear dependency on qj/qi in Equation (2) such that the pairwise combined limitation factor approaches the second resource factor qj, while at saturating gn it returns the first factor qi. At large independence n → ∞, the queuing function Equation (2) reconstructs the Liebig rule (Figure 1, Equation 1a), as g∞(qj/qi) converges to qj/qi for qi > qj (meaning ) and to 1 for qi < qj (). At intermediate independence or intermittency, e.g., n = 1, it can be shown that , which is the sum rule (Figure 1, Equation 1b). Therefore, as also laid down in more detail in Section S1.1, Equation (2) accurately reproduces all major classical co-limitation modes (Figure 1) and relates them to variations in a single network property n, which is the network “synchrony” or the capacity of distinct biochemical cycles for parallel operation.
The ability to generate a continuum of internal co-limitation modes depending on interdependency makes it possible to relax the assumption of constant interdependence. In this study, we hypothesize the degree of independence, n, to correlate with the availability of synthesizing proteins, which in turn should be proportional to the availability of (1) energy and (organic) carbon and (2) nitrogen as the C and N are primary constituent of proteins. Assuming equal importance of intracellular N and C pools as structural and energetic constituents, the most simple dependency of n on relative C- and N-quotas qC and qN reads:
The intimate link between organismal energy and C budgets, e.g., within the catabolism of glucose or fatty acids, motivates to attribute to carbon the role of a basic currency, thus to define intracellular stoichiometry as C-based ratios throughout this work. The choice implies that the internal relative C quota qC equals one.
2.2. Multi-resource Uptake and Growth in Autotrophs
Internal co-limitation in Equation (2), entailing the queueing function, so far considers two nutrients. In the special case of resolving intracellular N and C, we have qi = q1 = qC = 1 and qj = q2 = qN, and Equation (2) describes a pure queueing-type dependency on the relative N-quota, , which means that due to N-C co-limitation the integral processing rate should not be written as unbounded linear function of qN as proposed by various models in the past (Geider et al., 1998; Bougaran et al., 2010; Wirtz and Pahlow, 2010; Pahlow et al., 2013). The concept can be generalized to an arbitrary number of nutrients, by assuming that the network interdependence is analog for all elements. To scale to the generic situation of any arbitrary number of limiting resources (in our study either three, for C-N-P, or four in case of an application to Si-limitation in diatoms), we propose a recursive scheme. Let denote the normalized availability of resource i also integrating the limiting effect of other resources. quantifies the effective limitation effect of sub-cycles i and j on i such that = qi if those limitations are absent, and = otherwise. Starting from C as base resource, the co-limiting effect of N is = = . in turn incorporates co-limitation by the next resource, say phosphorus, and therefore the scheme extends to = and so forth. Total resource co-limitation intensity, which reflects the state of all internal nutrient stores, then downsizes gross production based on photosynthesis rate P, detailed in Equation (S31).
Net C uptake VC links gross production with respiratory expenses proportional to nutrient assimilation Vi and element specific assimilation costs ζi (Geider et al., 1998; Pahlow, 2005).
2.3. Multi-level Ecophysiological Regulation
The internal co-limitation function conveys a coherent and generic description for how organismic growth rate depends on stoichiometric variations as quantified by the relative quotas qi. This dependency is a prerequisite for formulating, vice versa, the control of quota changes by ecophysiological regulation. Uptake rates Vi of all elements i (i = C, N, P, …) are not only determined by external nutrient concentrations, but also by the state of accessory machineries. We here propose to resolve ecophysiological regulation along a multi-level partitioning and regulation scheme, where the levels are distinguished according to typical time scales and relation to common trade-offs.
The variable partitioning of energy or proteins into uptake functions has often been suggested as key ecophysiological strategy, especially in phytoplankton (Richardson et al., 1983; Klausmeier et al., 2004b; Pahlow, 2005). The first regulation level of our model therefore describes the allocation of proteins to different uptake machineries, namely for nutrient uptake and assimilation (fV), photon harvesting (fLH), and carboxylase activity fC (cf. Figure 2). This partitioning scheme acknowledges the basic role of photosynthesis and C assimilation in autotrophic organisms and was similarly devised by Wirtz and Pahlow (2010) for unicellular autotrophs or for plants at the leaf level (Wirtz, 2000) and organism level (root-shoot allocation by Wirtz, 2003); here, protein allocation also reflects the largely structural nature of those functional compartments located, e.g., in light harvesting complexes, thylakoid complexes, or nutrient uptake sites. From the three coefficients fV, fLH, and fC, two are independent (here fLH and fC) so that fV = 1 − fLH − fC (Figure 2I).
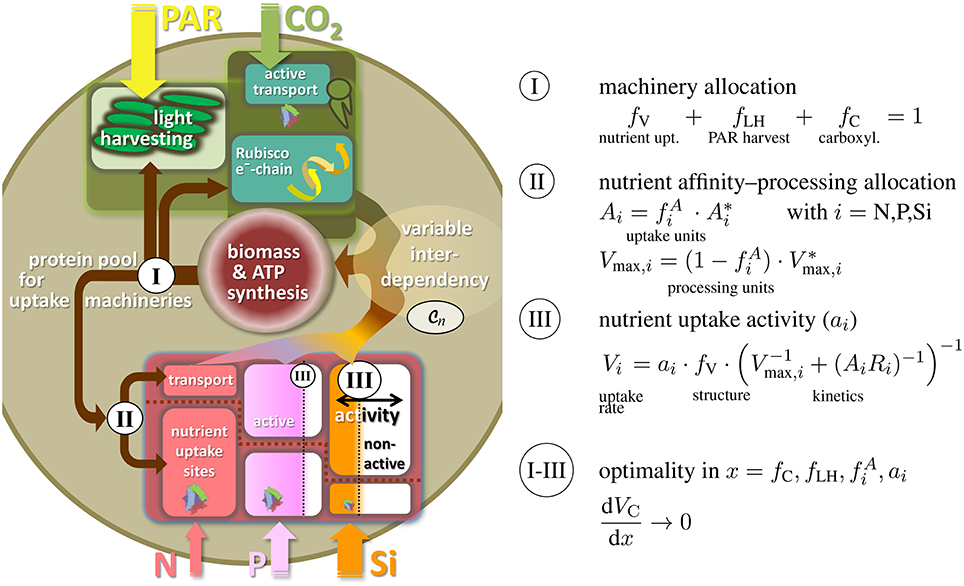
Figure 2. Three-level regulation of uptake systems in unicellular autotrophs: (I) Protein allocation to photosynthetic vs. nutrient uptake machinery, with the photosynthetic apparatus being further divided into light harvesting and Rubisco/electron-chain; (II) allocation of transport proteins vs. uptake sites or, analogously, between transport/processing and affinity; (III) regulation in nutrient uptake activity. Both, ambient resource concentration Ci and adaptive responses in ecophysiological traits determine the internal resource availabilities qi, which through the flexible co-limitation function determine biomass synthesis rate, here expressed as the carbon and energy/ATP turnover VC.
The second level regulation then entails a classical ecological trade-off between uptake affinity and maximal processing. Investments of proteins for gathering inorganic nutrient molecules at the cell boundary () are assumed to diminish the amount of proteins used as carriers or for assimilation into cellular structure () (Pahlow, 2005). This allocation principle regulates the potential nutrient affinity and maximal assimilation rate and is applied to each nutrient under consideration separately (i = N, P, Si, …, Figure 2II). Thus, this second regulation scheme can be regarded as an adaptation at a sub-ordinate level, which renders the individual complex more efficient, but has no implications and trade-off relationship to other functions.
Potential nutrient uptake rate is, in total, given by the relative pool size of all nutrient uptake machineries fV, the uptake characteristics Vmax, i and Ai, as well as ambient nutrient concentration Ri (Dissolved Inorganic Nitrogen, Phosphorus, DIN and DIP, resp., and silicate). At the third regulation level and in each uptake complex, enzymatically controlled variations in specific activity (ai) are then supposed to control actual uptake Vi (cf. Figure 2III). The realized uptake rates Vi thus not only depend on potential uptake but also on the promptness and demand of the cell/organism to further effectuate active nutrient transport across the membranes. This third regulation scheme in ai decides whether uptake is perpetuated at all, depending on costs and benefits of assimilating a given resource.
2.4. Indirect Effects through Dynamic Variations
Temporal changes in intracellular quota, Equations (S1) and (S4), follow from dis-pair uptake rates Vi with i = C, N, P, … that in turn are mediated by the three-level regulation in the ecophysiological variables and ai. However, this dynamically coupled system does not infer a possibility to formulate functional dependencies qi(x) as would be required to directly link the ecophysiological state x to net growth rate VC(qi). Indeed, we are not aware of any sound mechanics for deriving explicit expressions VC(x) that contain all relevant growth dependencies. The functional division between controls of nutrient and carbon uptake, Vi(x) and VC(x) in Figure 2III, Equation (4), and the resulting incompleteness in VC(x), makes a fundamental problem of any regulation scheme in uptake variables x. If optimizations in, e.g., specific activities ai maximize the respective resource assimilation Vi, this would at the same time increase respiratory losses as formulated in Equation (4), but would not necessarily lead to higher (co-limited) assimilation of other resources, especially carbon and energy. Direct effects of maximizing Vi on VC(x) would hence remain negative. We here estimate the indirect effect of variations in x on internal quotas and further on to growth differences from variational principles as already suggested by Wirtz and Pahlow (2010); Smith et al. (2011); Wirtz (2013). The basic idea is that the integration of indirect effects into an optimality approach for regulation in x does not require the full knowledge of VC(x), but of growth differentials dVC/dx. These differentials, or marginal dependencies, can be estimated from the dynamic balance equation (see Equation S4), the chain rule and a variational principle. The calculation first accounts for the specific productivities (direct effects on C uptake) in case of x = fC, fLH, or cost-related terms for the nutrient uptake traits , and fV = 1 − fLH − fC, both explicitly known as ∂VC/∂x (Section S1.3). Secondly, marginal dependencies have to incorporate the effect of ecophysiological trait changes on the internal stores as described by the differentials dqx/dx. These differentials follow from a variational technique that uses the balance equation to estimate the (marginal) quota variation dqx when slightly changing an uptake trait by dx (Section S1.3). The differentials dqx/dx times the derivatives ∂VC/∂qx, which follow from the new co-limitation function, build the indirect marginal growth effect. Together, direct and indirect effects constitute the total marginal growth effect of variations in x, which makes the center-piece of an optimality approach for all traits such as x = fC or x = ai:
We here assume the second and third level regulation to be relatively fast in comparison to the ecological time scales considered here, such that the optimal behavior is reached instantaneously. For such cases dx/dt should be zero, satisfied by setting the growth derivative in the bracket term of Equation (5) to 0 and solving the resulting expression for x, which is done here for as in Pahlow (2005), but for the special treatment of x = ai, see Section S1.6. As the first level regulation for fC, fLH is mostly realized through structural changes, Equation (5) prescribes a transient optimization with a finite flexibility δx, which for fractional variables (e.g., fx = fC) reads δx = fx · (1 − fx) (Wirtz and Eckhardt, 1996; Wirtz, 2000). The trade-off relation with the dependent variable fV leads to additional terms in the total marginal growth effect, i.e., dVC/dfx → dVC/dfx − dVC/dfV, such that protein investments into photosynthetic machinery consider the feed-backs of a down-sized nutrient uptake machinery. Regulation in fLH is complicated by the relation between chloroplast density and qN in Equation (S3). Optimal trait adaptation therefore applies to chlorophyll concentration of chloroplasts. From that regulation and the changing N-quota, variations in fLH are calculated using Equation (S3).
2.5. Data Integration and Model Set-ups
Six continuous culture experiments were selected from literature according to the presence of two autotrophic growth regimes, which are N-limitation and P-limitation, and the stoichiometric data digitized. The experiments were in two cases conducted with cyanobacteria (S. linearis, M. aeruginosa, see Table 1), in two cases with chlorophytes (S. minutum; Scenedesmus sp.), one with a diatom (T. pseudonana), and one with young tree plants (B. pendula). The birch plants were grown in chambers where roots are placed in an aqueous solution with controlled inflow of mineral nutrients, in analogy to chemostats containing microbial populations (Ingestad and Lund, 1979; Ingestad et al., 1995; Ågren, 2004). Dilution rates D had been varied from 0.04 (B. pendula) or 0.1 (S. linearis) to 1.1 (Scenedesmus sp.) or 1.4d−1 (S. linearis), but were fixed in the M. aeruginosa experiment (D = 0.15d−1) where instead pCO2 was varied from 0.5 to 4000 ppm. Not always was the same light level preserved between the pair experiments (see B. pendula), but in one case (S. linearis) the N- or P-limited cultured were maintained at a set of distinct PAR. All settings of Table 1 were adopted in the simulation runs. Available photosynthetically active radiation (PAR) accounts for self-shading calculated for 12 cm water column height and extinction coefficient of 0.01 m−1 μ M-C−1. The dynamic model equations Equation (5) and Table S1 were integrated for 30 days starting from BC|t = 0 = 1 μ M-C, BN = 0.1 μ M-N, BP = 0.01 μ M-P (in the T. pseudonana run also BSi = 0.1 μ M-Si), fC = 0.5, and fLH = 0.25.
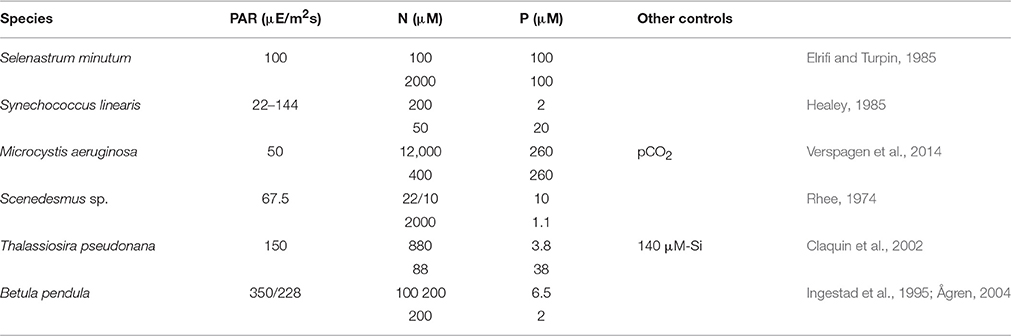
Table 1. Settings of chemostat experiments at different photosynthetically active radiation (PAR) levels with two pairs of input/reservoir N and P concentrations that induced either N- or P-limited growth.
2.6. Numerical Experiments
In the calibration runs, continuous cultures were simulated at a range of dilution rates D slightly extending the reported ones. Model parameters were varied first automatically in a coarse hypercube using the root-mean-square deviation between calculated and reported stoichiometric values as goal function. Thereafter, the most critical parameters were fine-tuned manually resulting in the values listed in Table S2.
Based on the S. minutum set-up, ambient N and P concentrations were varied systematically within the wide ranges found in both oligotrophic and eutrophic environments, which means 0.03–50 μ M-N and 0.0005–2 μ M-P. In addition to the reference variation with optimality Equation (5) and variable independence n, six scenarios were created: first, flexibilities δx = 0 were set to zero. This non-regulatory setting implies that the carboxylation partitioning fC remains constant alike the chlorophyll concentration of chloroplasts (see Section S1.2), but fLH becomes strictly proportional to relative N-quota due to Equation (S3); also, the affinity/transport time partitioning were fixed to = 0.5, and activities linearly bound to quotas via ai = 1 − qN. The regulatory/non-regulatory settings were combined with three co-limitation realizations, (i) fixed and high value of network independence (n = 50, “Liebig”), (ii) fixed and low value (n = 0.5, “product”), and (iii) the reference case of variable n, which results in overall six physiological scenarios.
3. Results
3.1. Stoichiometric Patterns
Our data collection captures a rich diversity of stoichiometric responses, with respect to species, type of nutrient limitation, and light conditions (Figure 3). As expected, quotas of the non-limiting nutrient is higher than that of the limiting nutrient, with the exception of B. pendula, where the differences become negligible. Also as expected, quotas of the limiting nutrients increase with increasing dilution rates. A key feature captured by the data set is the asymmetric behavior of N and P quotas when they are not the limiting nutrient: whilst N:C ratios increase with dilution rate under P-limitation—with the exception of Scenedesmus sp.—, P:C shows a remarkable insensitivity to dilution rates under N-limitation—again, with the exception of B. pendula. Yet, P:C in general largely deviates from the Redfield ratio at low dilution rates. All these stoichiometric patterns are accurately reproduced by the model.
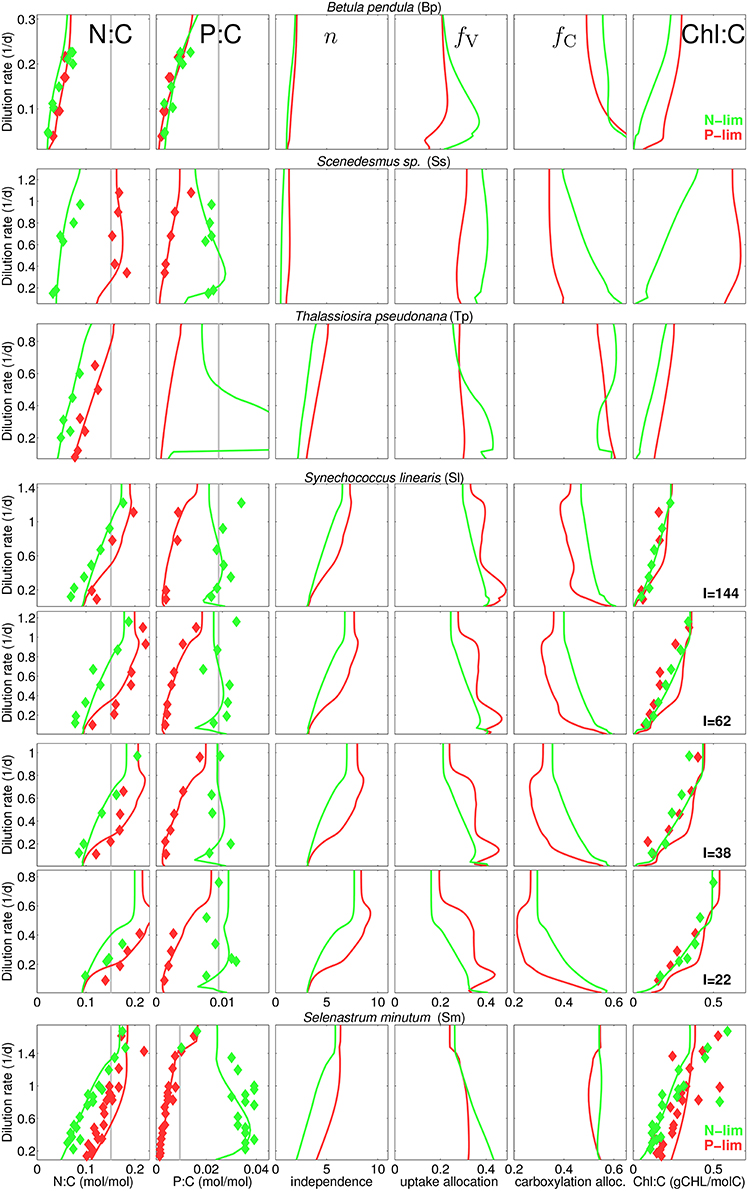
Figure 3. Steady-state N:C, P:C, network independence n, and protein fraction for nutrient uptake (fV) and for carboxylation (fC), and chlorophyll-to-carbon ratio at different dilution rates for different experiments and culture species (see Table 1). Diamonds, reported data; Gray lines, Redfield stoichimetry; Lines, model for P-limited (red) and N-limited cultures (green).
The model is also successful at quantifying different N:C ratios obtained at various degrees of inorganic carbon limitation. The cyanobacteria M. aeruginosa sustains high N:C in P-limited chemostats at the full range of pCO2 concentration, whereas under N-limitation the quota declines at pCO2 around 50 ppm as reported by Verspagen et al. (2014) (Figure S3). Finally, the model proofs high skill in reproducing the N:Si ratios as well, as inferred from the experiments with T. pseudonana (Figure S2), which also displays extreme divergence from Redfield ratios: N:Si shifts from about 0.5–6 mol-N/mol-Si with increasing dilution rate. Given the relative low N:C observed and calculated for this diatom species, large values in N:Si correspond to very low Si quotas.
Large diversity in stoichiometric responses reflects both ambient conditions and species specific features. While the ambient conditions were relatively similar among the chemostat experiments, ecophysiological features of the used culture species are distinguished by their model parameters in Table S2. Among these, most distinct are the specific carbon costs of nutrient uptake (ζN, ζP) and the specific metabolic independence (n*, defined in Equation 3). Uptake costs can intuitively be understood as pivotal for optimization, while metabolic independence discriminates changing constraints for uptake and assimilation processes.
3.2. Metabolic Independence
Differences in species specific independences n* provide a first indication for the ecophysiological significance of the independence between metabolic sub-cycles. For instance, n* is low for B. pendula and Scenedesmus sp. (see Table S2) so that the resulting independence n takes values of one to two, corresponding to the sum rule, while reaching Liebig-type values of around nine in P-limited S. linearis (Figure 1). Actual independence not only depends on the setting of n* but also on qN (Equation 3). Therefore, in analogy to the behavior of qN, n in all runs first increases with D and reaches to saturation at high D and is greater under P-limitation compared to N-limitation.
The overall model accuracy can be taken as a first and indirect support of our assumption that co-limitation strength increases under N-shortage. The approval is further substantiated by two experimental model runs where n is kept constant for both S. minutum and Scenedesmus sp. under N-limitation (Figure 3, dashed lines). For S. minutum, n = 4 corresponds to an average value of variable independence under N-limitation. Major differences to the reference run appear in P-stoichiometries: the extreme P-stores measured by Elrifi and Turpin (1985) become greatly underestimated at low D. These experiments suggest a strong link between the asymmetric response of N:C and P:C under N- and P-limitation and the co-limitation strength being inversely proportional to available N-stores. For the Scenedesmus sp. run, a fixed n = 4 leaves predicted N-limited N:C rather unaffected, whereas P:C displays a dramatic shift, behaving like under P-limitation, thus much differs in magnitude and functional response from the reference run and the trend observed by Rhee (1974).
This sensitivity experiment helps to better interpret the results of the reference run where stoichiometric asymmetry correlates with relative differences in metabolic independence (Figure 3). For example, relative changes are small in B. pendula with linearly increasing N:C and P:C independently of the nutrient regimes. To the contrary, relative differences in n are highest in Scenedesmus sp. and S. minutum, which indeed exhibit a very distinct stoichiometric response depending on the limiting nutrient. The central role of metabolic independence for the making of C:N:P:Si:Chl stoichiometry together with the large variations in n from 1.5 to 5 in T. pseudonana or from 3.5 to 9 in S. linearis emphasize that the current paradigm of a fixed limitation function (of arbitrary type) constitutes a critical bottleneck in the model description of autotrophic growth.
3.3. Protein Partitioning
Allocation to nutrient uptake, fV decreases with dilution rate (Figure 3), which is an expected consequence of alleviating nutrient limitation, hence lower requirements for nutrient uptake. Interestingly, allocation to carboxylation, fC also decreases with dilution rate, contrasting with the increase estimated by Wirtz and Pahlow (2010) for Isochrysis galbana, which mainly follows from the different coupling of pigment partitioning to the N-store for this species (Equation S3 turns to θfC = θCfLH, see Section S1.2). On the other hand, the increase in carboxylation machinery fC with increasing irradiance observed for S. linearis (Figure 3) results from the decreasing needs for light harvesting apparatus, which is in turn reflected by the decline in Chl:C (that serves as a 1:1 proxy for fLH) with higher irradiance levels (Figure 3). At a given light intensity, Chl:C ratio rises with dilution rate, as more resources become available for light harvesting with decreasing fV. Chl:C observed by Healey (1985) for S. linearis and by Elrifi and Turpin (1985) for S. minutum are well reproduced in the numerical experiments. However, CHL:C projected by the model overestimates the data for S. linearis under P-limitation (right column in Figure 3). In the light of accurate reproduction of the corresponding N:C it seems that for S. linearis, photoacclimation and changes in pigment stoichiometry are differently linked to the N-status depending on the limitation type.
Apart from a repeated weak decline in fV with increasing dilution rate a diverse array of uptake partitioning schemes arises across species and limitation type: variations in fV are neither clearly ordered with respect to the limitation type, nor to independence n. Lacking correlation between fV and n may add to the understanding of the observed richness in stoichiometry, as both ecophysiological variables differently control elementary stores: fV directly constrains potential uptake rates, while n shapes marginal growth gains ∂VC/∂Qi of nutrient stores and consequently influences the optimization of uptake activities (Equation S20).
3.4. Activity Regulation
Uptake activity, ai, the realized fraction of potential uptake (Figure 2 and Equation S19), is regulated based on the maximization of the growth rate. This scheme most profoundly illustrates the functioning of the extended optimality approach: aN only affects N-uptake and thus appears in the growth rate exclusively through respiratory costs so that a meaningful optimization has to include the indirect effects of enhancing N-uptake, which are mediated through increasing N-availability as outlined in detail in Section S1.6. Note that we here present and discuss only the regulation of N-uptake activity aN because aP behaves analogously. When uptake activity is plotted over the respective relative quota for all model experiments, a surprising alignment along a circular attractor becomes evident in Figure 5. This circular structure is however displaced for the plant application (B. pendula). The regulatory dynamics inherent to our model approach thus produces a rather well confined relationship between internal resource availability (qN) and uptake activity (aN), regardless of limitation strength, type, species, and other co-limiting factors such as light. This relationship, furthermore, deviates from the a priori assumption of linearly decreasing aN with increasing qN (ai = 1−qN, see Methods and “no regulation” scenario in Figure 5). The emerging regulatory dynamics offers mostly two solutions aN(qN) at each nitrogen state qN, one of which even reveals an increase in uptake activity when increasing the internal store—as a result of co-limitation. The decline under N-limitation can be deduced from decreasing marginal growth benefits of further increasing qN, while the unexpected increase for P-limited cultures can be understood in terms of the marginal C gain dVC/daN derived in Section S1.6. The coupling of N- and P-metabolism described by the queuing function amplifies the marginal importance of rising N-quota if not nitrogen but another element becomes the most limiting resource. In parallel, the uptake partitioning fV declines at higher D in all P-limited cultures apart of Scenedesmus sp. (Figure 3); therefore the rising indirect productivity gain demands for further elevated activity in N-uptake, which at lowered fV also induces moderate respiratory costs.
At very low qN, N-uptake activity covers the range from around 0.2–0.9 (Figure 5), implying a high degree of sensitivity, due to the “regulation neutrality” explained in Section S1.6.
3.5. Optimal Uptake Regulation
Since the influential works of Tilman et al. (1982), co-limitation is analyzed by means of growth isoclines as a function of two external resources. Distinct curvatures of these growth contours correspond to different types of co-limitation: rectified isoclines indicate Liebig-type growth dependency on a single factor, independent from another, circular outward isoclines represent moderate to strong co-limitation, whereas inward isoclines describe an inhibitory effect of one factor. Comparison of the growth isoclines produced by a factorial design of 6 model experiments with regulatory model dynamics switched on and off and co-limitation strength high (as in product rule), variable (as in the standard run) and low (as in the Liebig's rule), provide insight into the relative effect of each of these model assumptions (Figure 6).
In the non-regulatory scenarios inward isoclines along DIN-axis emerge as a typical feature, pointing to growth inhibition at high DIN/DIP ratios. Inhibition in this P-limited zone results from non-optimal regulation in uptake activity aN. A fixed, linear relationship between relative N-quota and aN, adopted from Morel (1987), almost always results in higher uptake activity (Figure 5), causing high respiratory costs that are not compensated by productivity gains (cf. Section S1.6) and thus lower the net growth rate.
Strength of inhibition under P-limitation depends on the imposed co-limitation strength through the prescribed independence n, increasing from low n (emulating the product rule) to large n (Liebig). Considering that organisms can easily avoid such inhibitory effects (i.e., by simply ceasing nutrient uptake) such behavior should be regarded as artificial. Notwithstanding, the artifact may easily emerge in classical schemes, especially if the Liebig rule is to describe co-limitation.
Comparison of the growth isoclines among the flexible model variants finally reveal a crucial consequence of optimality: they all represent a moderate degree of co-limitation, irrespective of the prescribed internal co-limitation strength (Figure 6), which is most obvious for the case of Liebig co-limitation: isoclines deviate from the rectified shape characteristic for the implemented Liebig function. This can be seen as a manifestation of regulatory mechanisms evoking an internal state where strength of different stressors become more similar then they externally exert, in analogy with the “multiple limitation hypothesis” (Bloom et al., 1985) according to which organisms seek to balance different stressors. Our optimality and trait-based approach therefore introduces a rationale for understanding the co-limitation balance.
4. Discussion
Limitation of growth rate as a function of the intracellular/intrabody state is handled here by means of the queuing theory. This highly generic approach can be applied to an arbitrary number of resources (this study), and to any organism and resource type. For example, it should similarly apply to herbivorous consumers where co-limitation by protein and carbohydrates or cholesterols and fatty acids has been so far described by classical schemes (Sperfeld et al., 2015). Describing the co-limitation by a single function that can generate responses across the spectrum between the product rule and Liebig law facilitates the implementation of distinct physiologies in autotrophic cells or organisms and also enabled testing the idea that co-limitation strength is not constant, but increases under N-shortage. The generality of the model structure does not constrain model versatility and skill. This is confirmed in applications to the limitation by inorganic carbon (M. aeruginosa), and silicate (T. pseudonana). A recurrent phenomena also reproduced well is rising Chl:C with dilution rate (Geider et al., 1998; Pahlow et al., 2013; Talmy et al., 2013) and increasing investments in carboxylation along an abandonment of light harvesting at higher irradiance (Talmy et al., 2013). Most prominently, diverse and at times, intriguing patterns of C:N:P stoichiometries inherent to the data sets collected in this study are captured successfully. These patterns can be categorized into 3 broad classes: (1) both N:C and P:C increasing with dilution rate under N- and P- limitation (B. pendula, Ågren, 2004); (2) only the limiting nutrient correlates with dilution rate (Scenedesmus sp., Rhee, 1974); (3) the asymmetric response, i.e., N:C increasing with dilution rate both at N- and P-limitation, but P:C increases only when P is limiting, (S. linearis and S. minutum, Elrifi and Turpin, 1985; Healey, 1985). Also using a Synechococcus strain, however in a constrained range of growth rates, Garcia et al. (2016) found similar asymmetric patterns. Those patterns were previously addressed by alternative model approaches (e.g., Ågren, 2004; Flynn, 2008; Bougaran et al., 2010; Bonachela et al., 2013; Pahlow et al., 2013). Bonachela et al. (2013) hypothesize that the protein repression for nutrient uptake sites of both N and P is a function of P only; or, Flynn (2008) makes the transport rate of the non-limiting nutrient depending on the identity of the nutrient. Most capable so far to generate stoichiometric asymmetry were the chain models of Pahlow and Oschlies (2009) and Ågren et al. (2012), proposing synthesis of N dependent on P quota and growth dependent on N-quota, Yet, a part of the observed patterns remains weakly explained by existing schemes—even if complemented with optimality arguments. For example, Klausmeier et al. (2004b) predict a convergent P-quota for all N:P input ratios at a maximal D, a phenomenon only observed for S. minutum, while data for other phytoplankton species do not support obligative P-quota convergence, neither does our model approach. Or, the model of Bougaran et al. (2010), an extension of the one proposed by Klausmeier et al. (2004b), can fit the linear N:C increase of P-limited S. minutum observed by Elrifi and Turpin (1985), but generates functionally deviating responses in N:C and P:C under N-limitation. The optimality (chain) model of Pahlow and Oschlies (2009) and Pahlow et al. (2013), which conceptually resembles elements of our approach and according to the number of validated applications could be seen as the most skilled scheme formulated so far, displays some bias. Although it focuses on the physiological role of P, the model underestimates N:C at low dilution rate (D) and displays strong up-regulation of both N:C and P:C at high D for P-limited cultures and thus has difficulties to produce the rather linear P:C increase with rising D. Our approach more completely capturing the asymmetric response does not necessarily exclude any of the above hypotheses. However, a simple relation between available C- and N-stores, determining the protein expression capacity, and the ability to run metabolic sub-cycles independently seems to constitute a very basic but also effective biochemical argument. The comparison between model runs with and without optimal regulation indicates that optimality induces a more realistic physiological behavior. Without optimality, calculated growth rates are much downscaled (Figure 6), growth isoclines become artificially inward, and simulated N:C and P:C at increasing D not even qualitatively reproduce the observed asymmetric response (Figure 4). However, it is important to note that the improving realism with optimality depends on the model structure proposed here; optimality per se will likely lead to weak predictions under different assumptions on inherent constraints and especially incomplete goal functions which overrate one resource uptake over others. Also, non-optimality approaches like the ones discussed above or the surrogate model discussed below may be able to qualitatively reproduce growth responses under co-limitation.
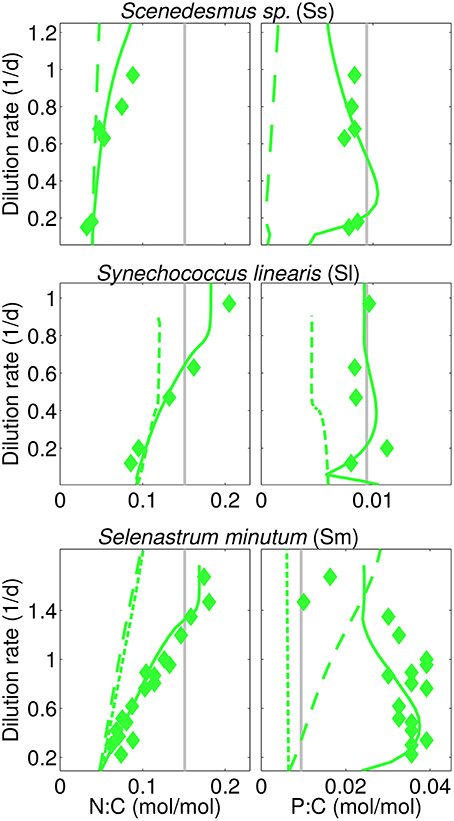
Figure 4. Calculated (steady-state) and reported N:C, P:C in three N-limited cultures analog to Figure 3 (“I=38” experiment for S. linearis). In addition, two physiological scenarios are displayed using (a) long-dashes (Sm, Ss): simulations with fixed independence n=4, and (b) short-dashes (Sm, Sl-38): without optimality regulation.
4.1. Implications of Co-limitation Flexibility and Optimality
Effects of the flexibility in co-limitation are understood best from the growth isoclines across limiting nutrients. Ågren et al. (2012), showed that the chain-model structure, with its linkage between (N-rich) enzymes and (P-rich) ribosomes, leads to interdependence (deviation from the Liebig law) which is in line with the biochemical co-limitation concept of Arrigo (2005). Moreover, co-limitation strengthens with enhanced growth rates at increasing external nutrient concentrations (Figure 4 in Ågren et al., 2012). Interestingly, this feature is already captured by the queuing theory in its pure form, i.e., without the modification of n with qN, at small or intermediate n, thus emulating the product or sum rule (see Figure 1). The phenomenon can to some extent also seen in the contouring of the regulated scenarios of Figure 6. However, by assuming that independence, n, increases with increasing N-availability, i.e., enzyme concentrations, we weaken the transition toward enhanced interdependence with increasing availability of nutrients, although not to an extent of neutralizing the transition completely, as can be observed in Figure 6.
The rather ubiquitous shape of co-limitation under optimality is here found to be unexpectedly independent of the underlying internal limitation function. The contouring is similar to the outcome of the sum rule without adaptive regulation (Figure 1B), which means that the queuing function applied to ambient resource ratios can bypass the regulatory transformation within a fully trait- and optimality-based structural model and describes its effect by rather simple means. This furthermore entails the opportunity to include effects at the community level. Ecophysiological regulation such as changed partitioning realized within one culture population to some extent emulates community structure changes between specialists. Starting from a Liebig-type internal co-limitation function, the superposition of resource dependencies of specialists leads to interdependence (outward contouring) at the community level (Danger et al., 2008).
Our application to nutrient limitation in Figure 6 and the identification of a uniform degree of co-limitation also unravels an important stoichiometric aspect for biogeochemistry: increments in a single nutrient at N:P around Redfield automatically enhance growth, no matter whether this nutrient is the most limiting one. Our theoretical corroboration of such a sum-rule behavior—backed up by various data fits—thus offers an alternative explanation for the observation that interdependence is the prevalent mode of co-limitation (Elser et al., 2007; Harpole et al., 2011). A similar view arises in the more recent research and discussion on ocean acidification and CO2 enrichment. It has been suggested that probably the most important effects of this stressor may originate from the combination with other factors such as temperature or nutrient regime (Boyd and Hutchins, 2012). However, coupling between nutrient and pCO2 limitation is not well represented in the current theory, which for example is evident from the Liebig-type biomass contour plot (Figure 4) of Verspagen et al. (2014). Despite the highest value to specific independence assigned within this study (n* = 6, Table S2), our approach generates persistent inter-dependence—especially in the range of current and projected CO2 conditions (Figure S3) and therefore confirms the conceptual arguments of Boyd and Hutchins (2012) who advocated multifactorial studies for better understanding the consequences of CO2 enrichment on autotrophic growth.
4.2. Limits and Potentials of our Approach
Chemostats are in general performed at a confined range of dilution rates, depending on culture species and environmental conditions. Outside these ranges, populations are either not viable or display outlier responses difficult to reproduce experimentally. At the edge of these dilution ranges also the performance of our regulatory model declines as the robustness of numerical experiments deteriorates. At large washout rate D approaching maximal growth rate, the model reacts sensitively to small variations of growth parameters that determine VC at replete conditions. In addition, large sensitivity in stoichiometric regulation appears at very low D, thus under extreme nutrient deficiency as can be seen, e.g., from P:C of severely N-limited cultures in Figure 3, the wide spread of optimal uptake activities in Figure 5, or the N:C fluctuations at very small pCO2 in Figure S3. Very small rates translate to small growth rate derivatives, which raises uncertainty in the optimization as especially derivatives for indirect growth effects estimated based on variational principles may drift away. As a consequence, the approach has to be used with care at the lower viability edge of populations, or to be complemented by safeguarding schemes (e.g., by freezing the physiological state).
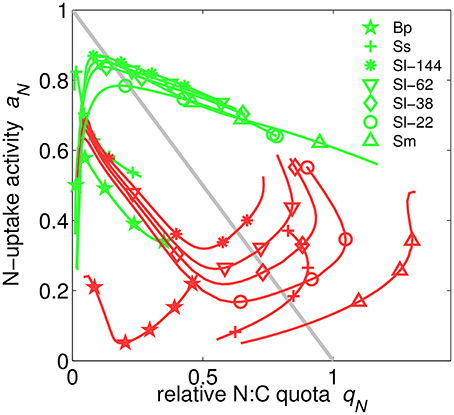
Figure 5. Nitrogen uptake activity aN over relative N-quota qN in N- (green) or P-limited (red) cultures simulated for different chemostat conditions and species (Sm, S. minutum; Sl, S. linearis; Ma, M. aeruginosa; Ss, Scenedesmus sp.; Tp, T. pseudonana; Bp, B. pendula). Results for the one experiment using three instead of two nutrients (Tp) are omitted here. For comparison, the simple linear relationship aN = 1 − qN is plotted as gray line.
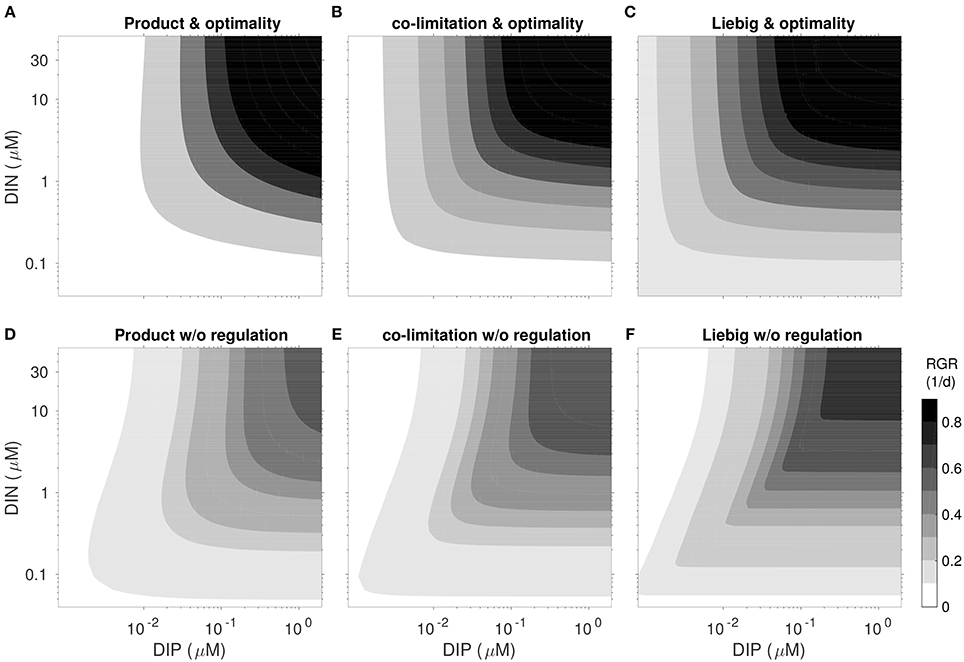
Figure 6. Realized net growth rate RGR = VC − L using the parametrization and light conditions of the S. minutum experiment after 40 days under fixed N- and P-concentration for six different regulation scenarios. (A–C, top): reference model optimality. (D–F, bottom): “no regulation” with fixed partitioning and and activities ai linearly bound to quotas as plotted in Figure 5. Network independence n increases from left to right: “Product” type co-limitation (A,D; n = 0.5), variable co-limitation (B,E; reference Equation 3), and “Liebig” type (C,F; n = 50).
Our approach on purpose ignores specific biochemical processes. For example, it does not explicitly resolve the differential roles of phosphorus and nitrogen in synthesis of pigmentory material, and C-fixation (Klausmeier et al., 2004a; Pahlow and Oschlies, 2009; Ågren et al., 2012; Daines et al., 2014). Instead, a combination of the generic queuing theory and optimality arguments (about protein partitioning and uptake regulation) was used to describe photosynthetic growth. The generality casts restrictions on testing causal hypotheses at the sub-process level, such as the interdependence of certain biochemical reactions (Arrigo, 2005; Saito et al., 2008; Ågren et al., 2012) and on validation with respect to the concentration of specific enzymes with known metabolic functionality (see, e.g., Daines et al., 2014). A conclusive evaluation of model skills of the individual approaches requires a quantitative model inter-comparison, which should be one of the next steps in enhancing theory building in physiological research.
Yet, the optimality concept can shed light into popular but empirical functions that disregard explicit links between physiological responses and the energetic and resource based economy of organisms (Parker and Smith, 1990; Smith et al., 2011). For instance, optimal uptake regulation disclosed in our work only partially aligns with the a linear down-regulation with cell quota proposed by Morel (1987), but better links to the highly non-linear function to describe the relationship between maximum N uptake rate and N:C proposed by Geider et al. (1998). This non-linear function, in our notation equivalent to aN = , has been used as an a priori and heuristic assumption in other structural models for down-regulating uptake at filled stores to prevent extreme quota values e.g., Zonneveld, 1998. Here, a similarly non-linear shape emerges in Figure 5, which suggests that the functional response reflects optimal regulation.
Our extension of the optimality theory with regard to indirect effects comes with the methodological cost of a more complex mathematical formalism compared to, e.g., empirical model approaches. Handling of derivative terms following the variational principle is especially demanding after a modification of basic growth functions since all depending derivative terms have to be updated as well. This can be seen as a major bottleneck of our approach for a more widespread usage by non-specialists. However, mathematical complexity does not automatically prevent coupled model application in three dimensions (Kerimoglu et al., personal communication). A possible short-cut of dealing with demanding differential calculus derives from our observation that the structured and adaptive model has a surrogate, which follows from simple application of the queuing function to ambient resource levels and is therefore very easy to implement. Still, a major advantage of the full model approach is the disclosure of mechanisms leading to such response. A central prerequisite for optimization to succeed under a wide range of stress regimes was the usage of a variational principle. A shortsighted approach which neglects internal feed-backs can yield net growth rates lower than those obtained without regulation (results not shown). For organisms living on an array of essential resources, optimality in one specific resource uptake can only produce reasonable predictions if one assumes links between uptake functions such as done for P- and N-uptake by Pahlow et al. (2013). These assumptions can in part generate similar results, but may fall short in specific situations where they do not hold as discussed above. Also, they can point to existing trade-offs between resource uptake functions but do not disclose their mechanistic origins.
Our theory does, of course, not rule out former attempts that are mostly based on more empirical model construction. Due to its mechanistic nature, the model improves our means of interpreting data, a point that can be best made along the application to Scenedesmus. Rhee (1974) and subsequently a series of scholars (e.g., Klausmeier et al., 2004b; Saito et al., 2008) interpreted the observed stoichiometries as strong support of Liebig's law, while our model assumes a very low degree of independence (n around one). One clearly has to distinguish between the degree of co-limitation (here n) determining the effect of quota variation on carbon growth from stoichiometric response (how N:C and P:C vary with N- and P-limitation). At low independence, it pays off to fill the non-limiting quota, which in the model yields a symmetric response with maximized non-limiting quota, while at high n (Liebig), the non-limiting quota remains poorly constrained, leading to an asymmetric response, with variable non-limiting quota. Hence, the symmetric stoichiometric pattern reported by Rhee (1974) indicates strong interrelation of N- and P-cycles, contrary to its common interpretation.
Another relevant added value of our extension lays in the consistent formulation of indirect effects and internal feed-backs, which offers new perspectives in applying the optimality concept in realistic set-ups. In most ecosystems more than one resource constrains primary production in particular on mid- to long-term time scales, while autotrophic traits are connected to diverse growth related functions such as nutrient storage or defense, not only to primary production itself. Optimal strategies thus have to make the full budget of gains and (the many) indirect costs as laid out for major ecophysiological traits in the presented study. The extension of optimality with regard to indirect effects was made possible through the development of the co-limitation formulation which is based on the synchrony of metabolic sub-cycles and then used as goal function for trait optimizations.
Moreover, the co-limitation formulation presented here offers a way out from the dichotomy between the serial (Liebig-type) and simultaneous (product-type), pervasive not only in discussions of the growth of autotrophs growth (Elser et al., 2007; Harpole et al., 2011) but also of heterotrophs (Sperfeld et al., 2015). In fact, the potential of the queuing theory for a unified representation of different co-limitation strengths have been recognized previously (O'Neill et al., 1989), but a full development of the concept is presented for the first time here and follows from the variable synchrony, or, intermittency of food processing mechanisms recently developed for herbivores (Wirtz, 2012). A single internal co-limitation function that can describe a continuous responses spectrum between the product rule and Liebig law can become a pragmatic tool in many application fields.
4.3. Scaling up to Real Ecosystems
Our theory has so far focused on variations in ecophysiological traits and their short-term phenotypic regulation as typically observed in the first weeks of chemostat experiments. Nutrient concentrations in real ecosystems including agricultural systems typically varies at both longer-term (e.g., at seasonal or inter-annual scales) and shorter term (e.g., at daily scales, after a mixing event or fertilization). The latter case underlines the relevance of tracing the transient nature of phenotypic plasticity as seeked by our simulations. Phenotypic plasticity has to become more explicit in model studies, which has recently been demonstrated by a global study on oceanic primary production (Behrenfeld et al., 2015). Large relevance of phenotypic processes also agrees with the general observation that within-species variability in autotrophic stoichiometry is of similar relevance to the one between species (Ågren, 2004; Klausmeier et al., 2004a, data in Figure 3). However, high plasticity does not exclude an important role of taxonomy as species succession affect physiology and thus also stoichiometry (Sterner and Elser, 2002). In the set of culture species compiled here major taxonomic groups are underrepresented. For example, diatoms usually have higher P:C than other groups (Quigg et al., 2003) or larger diatom species invest a much greater fraction of their N pool into Rubisco than smaller species (Wu et al., 2014). To describe these trends, also model coefficients in Table S2 may be more group specific—or should vary at time-scales larger than the few weeks considered here. An enlarged set of trait variables is needed to account for non-phenotypic adaptation. Future application of our approach will thus devise size allometries in ecophysiological coefficients such as subsistence quotas and maximal photosynthesis rates (Litchman et al., 2006). However, optimality in size (or other master traits) equally requires incorporation of differential and indirect terms. Otherwise the changed sensitivity with respect to multiple stressors accompanied with trait shifts cannot be brought in a coherent context (Wirtz, 2013; Smith et al., 2014).
Despite of the many explicitly resolved resources, number of parameters is small (Table S2). Notably, model applications to plants (Betula pendula) and unicellular populations use the same set of equations and functions, and only moderately differ in terms of parameterization. Our partitioning scheme still ignores other relevant physiological functions such as antiviral defense or assimilation of surrogate resources (e.g., DOP uptake or N2-fixing) but the multi-variable structure offers a suitable template to integrate additional stressors, pathways, and internal protein demands. The model implementation comes at the cost of employing non-standard derivative terms as documented in the Supplementary Material, but overall follows a simple numerical integration scheme. This can be seen as an advantage compared to approaches such as of Talmy et al. (2013) who set up a genetic algorithm to solve the resource allocation problem. High generality of our formalism can be advantageous when assessing implications of regulated multi-elemental stoichiometry for biogeochemical cycles across a wider range of habitats.
5. Conclusion
In this study, we present a process-based model of autotrophic growth that combines state-of-the-art descriptions of dynamically adaptive resource allocation (Wirtz, 2003; Wirtz and Pahlow, 2010), and optimization of nutrient uptake affinity (Pahlow, 2005) together with two important novelties: first is a unifying internal co-limitation scheme that eliminates the need to make an assumption about the degree of co-limitation (as would be represented typically by the Liebig law or the product rule) and that links metabolic independence to the capability of protein synthesis; secondly, a novel extended optimality approach that fosters the notion of indirect effects and marginal growth benefits. The latter derive from a variational principle and quantify how shifts in physiological traits controlling one uptake system affect the performance of other machineries. Application of this concept demands a more extensive usage of differential calculus compared to standard modeling approaches, but on the other hand relieves from assumptions on linkages between different nutrient uptake systems.
Integration of both concepts, network independence and extended optimality, accurately reproduces highly diverse patterns in C:N:P:Si:Chl stoichiometry observed in chemostats. The unprecedented model skill constitutes the basis for numerical experiments that unravel the physiological making of co-limitation strength. Against expectation, regulatory mechanisms homogenize the effect of multiple stressors. Internal re-partitioning and resource specific activity regulation creates a balance between the stressors, leading to a moderate degree of co-limitation regardless how independently uptake machineries operate (in the model). In particular, application of the queuing function to external resource concentrations emerged as a simple surrogate model for describing co-limitation in autotrophic growth, which deserves further testing in future studies. This surrogate model neglects the description of internal element quotas, traits, and optimality; in the numerical experiments shown here, it yet can emulate the growth response across ambient nutrient levels as predicted by the more complex model. Identification of the ubiquitous co-limitation pattern as expressed by such a surrogate model, and its mechanistic underpinning through network interdependence and optimality, have major implications for modeling biogeochemical cycles in aquatic and terrestrial ecosystems. For example, the old paradigm of the Liebig rule very likely oversimplifies linkages between specific ecophysiological functions. To assess consequences of variations in a single driving factor such as oligotrophication or CO2 fertilization will thus require a more complete consideration of other growth dependencies than often made during experiments or modeling. The simple surrogate model may also be built directly into models which lack an explicit account of internal stoichiometry such as many food-web models. Yet, the full approach presented here proved to be well integrable to a spatially explicit ecosystem model where it helped to obtain a more accurate and reliable picture of the nutrient budgets especially in coastal systems (Kerimoglu et al., personal communication). The mechanistic autotrophic growth model thus can serve future studies on the role of acclimative processes in biogeochemical cycles, particularly in environments characterized by extreme variations in the availability of resources.
Author Contributions
KW has conceptually designed the work and produced all model data and diagrams. KW and OK jointly interpreted the data and wrote or edited the text.
Funding
The work was supported by the Helmholtz society via the program PACES, by the German Research Foundation (DFG) within the Priority Program DYNATRAIT, by the German Federal Ministry of Research and Education in the framework projects MOSSCO and BIOACID.
Conflict of Interest Statement
The authors declare that the research was conducted in the absence of any commercial or financial relationships that could be construed as a potential conflict of interest.
Acknowledgments
We thank three reviewers for valuable suggestions to improve the manuscript.
Supplementary Material
The Supplementary Material for this article can be found online at: https://www.frontiersin.org/article/10.3389/fevo.2016.00131/full#supplementary-material
References
Ågren, G. I. (2004). The C: N: P stoichiometry of autotrophs–theory and observations. Ecol. Lett. 7, 185–191. doi: 10.1111/j.1461-0248.2004.00567.x
Ågren, G. I., Wetterstedt, J. Å., and Billberger, M. F. K. (2012). Nutrient limitation on terrestrial plant growth – modeling the interaction between nitrogen and phosphorus. New Phytol. 194, 953–960. doi: 10.1111/j.1469-8137.2012.04116.x
Arrigo, K. R. (2005). Marine microorganisms and global nutrient cycles. Nature 437, 343–348. doi: 10.1038/nature04159
Behrenfeld, M. J., O'Malley, R. T., Boss, E. S., Westberry, T. K., Graff, J. R., Halsey, K. H., et al. (2015). Revaluating ocean warming impacts on global phytoplankton. Nat. Clim. Change 6, 323–330. doi: 10.1038/nclimate2838
Bloom, A. J., Chapin, F. S., and Mooney, H. A. (1985). Resource limitation in plants–an economic analogy. Ann. Rev. Ecol. Syst. 16, 363–392. doi: 10.1146/annurev.es.16.110185.002051
Bonachela, J., Allison, S., Martiny, A., and Levin, S. (2013). A model for variable phytoplankton stoichiometry based on cell protein regulation. Biogeosciences 10, 4341–4356. doi: 10.5194/bg-10-4341-2013
Bougaran, G., Bernard, O., and Sciandra, A. (2010). Modeling continuous cultures of microalgae colimited by nitrogen and phosphorus. J. Theor. Biol. 265, 443–454. doi: 10.1016/j.jtbi.2010.04.018
Boyd, P. W., and Hutchins, D. A. (2012). Understanding the responses of ocean biota to a complex matrix of cumulative anthropogenic change. Mar. Ecol. Progr. Ser. 470, 125–135. doi: 10.3354/meps10121
Buitenhuis, E. T., Timmermans, K. R., and de Baar, H. J. (2003). Zinc-bicarbonate colimitation of Emiliania huxleyi. Limnol. Oceanogr. 48, 1575–1582. doi: 10.4319/lo.2003.48.4.1575
Claquin, P., Martin-Jézéquel, V., Kromkamp, J. C., Veldhuis, M. J. W., and Kraay, G. W. (2002). Uncoupling of silicon compared with carbon and nitrogen metabolisms and the role of the cell cycle in continuous cultures of Thalassiosira pseudonana (Bacillariophyceae) under light, nitrogen, and phosphorus control. J. Phycol. 38, 922–930. doi: 10.1046/j.1529-8817.2002.t01-1-01220.x
Daines, S. J., Clark, J. R., and Lenton, T. M. (2014). Multiple environmental controls on phytoplankton growth strategies determine adaptive responses of the N:P ratio. Ecol. Lett. 17, 414–425. doi: 10.1111/ele.12239
Danger, M., Daufresne, T., Lucas, F., Pissard, S., and Lacroix, G. (2008). Does Liebig's law of the minimum scale up from species to communities? Oikos 117, 1741–1751. doi: 10.1111/j.1600-0706.2008.16793.x
Elrifi, I. R., and Turpin, D. H. (1985). Steady-state luxury consumption and the concept of optimum nutrient ratios: a study with phosphate and nitrate limited Selenastrum minutum (chlorophyta). J. Phycol. 21, 592–602. doi: 10.1111/j.0022-3646.1985.00592.x
Elser, J. J., Bracken, M. E., Cleland, E. E., Gruner, D. S., Harpole, W. S., Hillebrand, H., et al. (2007). Global analysis of nitrogen and phosphorus limitation of primary producers in freshwater, marine and terrestrial ecosystems. Ecol. Lett. 10, 1135–1142. doi: 10.1111/j.1461-0248.2007.01113.x
Fleming, R. H. (1940). The composition of plankton and units for reporting populations and production. Proc. of the Sixth Pacific Sci. Congr. 3, 535–540.
Flynn, K. J. (2008). The importance of the form of the quota curve and control of non-limiting nutrient transport in phytoplankton models. J. Plankton Res. 30, 423–438. doi: 10.1093/plankt/fbn007
Friend, A. D. (1991). Use of a model of photosynthesis and leaf microenvironment to predict optimal stomatal conductance and leaf nitrogen partitioning. Plant Cell Environ. 14, 895–905. doi: 10.1111/j.1365-3040.1991.tb00958.x
Garcia, N. S., Bonachela, J. A., and Martiny, A. C. (2016). Interactions between growth-dependent changes in cell size, nutrient supply and cellular elemental stoichiometry of marine Synechococcus. ISME J. 10, 2715–2724. doi: 10.1038/ismej.2016.50
Geider, R. J. La Roche, J. (2002). Redfield revisited: variability of C [ratio] N [ratio] P in marine microalgae and its biochemical basis. Eur. J. Phycol. 37, 1–17. doi: 10.1017/s0967026201003456
Geider, R. J., MacIntyre, H. L., and Kana, T. M. (1998). A dynamic regulatory model of phytoplanktonic acclimation to light, nutrients, and temperature. Limnol. Oceanogr. 43, 679–694. doi: 10.4319/lo.1998.43.4.0679
Harpole, W. S., Ngai, J. T., Cleland, E. E., Seabloom, E. W., Borer, E. T., Bracken, M. E. S., et al. (2011). Nutrient co-limitation of primary producer communities. Ecol. Lett. 14, 852–62. doi: 10.1111/j.1461-0248.2011.01651.x
Healey, F. P. (1985). Interacting effects of light and nutrient limitation on the growth rate of Synechococcus linearis (Cyanophyceae). J. Phycol. 21, 134–146. doi: 10.1111/j.0022-3646.1985.00134.x
Hilbert, D. W. (1990). Optimization of plant root/shoot ratios and internal nitrogen concentration. Ann. Bot. 66, 91–99.
Hillebrand, H., Steinert, G., Boersma, M., Malzahn, A., Léo Meunier, C., Plum, C., et al. (2013). Goldman revisited: faster growing phytoplankton has lower N:P and lower stoichiometric flexibility. Limnol. Oceanogr. 58, 2076–2088. doi: 10.4319/lo.2013.58.6.2076
Hollinger, D. Y. (1996). Optimality and nitrogen allocation in a tree canopy. Tree Physiol. 16, 627–634.
Ingestad, T., Hellgren, O., and Lund-Ingestad, A. B. (1995). Data-Base for Birch at Steady–State. Report 75, Sveriges Lantbruksuniversitet, Uppsala.
Ingestad, T., and Lund, A.-B. (1979). Nitrogen stress in birch seedlings. Physiol. Plant. 45, 137–148.
Kendall, D. G. (1953). Stochastic processes occurring in the theory of queues and their analysis by the method of the imbedded markov chain. Ann. Math. Stat. 24, 338–354. doi: 10.2307/2236285
Klausmeier, C. A., Litchman, E., Daufresne, T., and Levin, S. (2004a). Optimal nitrogen-to-phosphorus stoichiometry of phytoplankton. Nature 429, 171–174. doi: 10.1038/nature02454
Klausmeier, C. A., Litchman, E., and Levin, S. A. (2004b). Phytoplankton growth and stoichiometry under multiple nutrient limitation. Limnol. Oceanogr. 49, 1463–1470. doi: 10.4319/lo.2004.49.4_part_2.1463
Kooijman, S. A. L. M. (2010). Dynamic Energy Budget for Metabolic Organisation. Cambridge: Cambridge University Press.
Lenton, T. M., and Watson, A. J. (2007). Biotic stoichiometric controls on the deep ocean N: P ratio. Biogeosciences 4, 353–367. doi: 10.5194/bg-4-353-2007
Litchman, E., Klausmeier, C. A., Miller, J. R., Schofield, O. M., and Falkowski, P. G. (2006). Multi-nutrient, multi-group model of present and future oceanic phytoplankton communities. Biogeosciences 3, 585–606. doi: 10.5194/bg-3-585-2006
Martiny, A. C., Pham, C. T. A., Primeau, F. W., Vrugt, J. A., Moore, J. K., Levin, S. A., et al. (2013). Strong latitudinal patterns in the elemental ratios of marine plankton and organic matter. Nat. Geosci. 6, 279–283. doi: 10.1038/ngeo1757
Morel, F. M. M. (1987). Kinetics of nutrient uptake and growth in phytoplankton. J. Phycol. 23, 137–150.
O'Neill, R. V., DeAngelis, D. L., Pastor, J. J., Jackson, B. J., and Post, W. M. (1989). Multiple nutrient limitations in ecological models. Ecol. Model. 46, 147–163. doi: 10.1016/0304-3800(89)90015-x
Pahlow, M. (2005). Linking chlorophyll-nutrient dynamics to the Redfield N: C ratio with a model of optimal phytoplankton growth. Mar. Ecol. Prog. Ser. 287, 33–43. doi: 10.3354/meps287033
Pahlow, M., Dietze, H., and Oschlies, A. (2013). Optimality-based model of phytoplankton growth and diazotrophy. Mar. Ecol. Prog. Ser. 489, 1–16. doi: 10.3354/meps10449
Pahlow, M., and Oschlies, A. (2009). Chain model of phytoplankton P, N and light colimitation. Mar. Ecol. Prog. Ser. 376, 69–83. doi: 10.3354/meps07748
Parker, G., and Smith, J. M. (1990). Optimality theory in evolutionary biology. Nature 348, 27–33. doi: 10.1038/348027a0
Quigg, A., Finkel, Z. V., Irwin, A. J., Rosenthal, Y., Ho, T.-Y., Reinfelder, J. R., et al. (2003). The evolutionary inheritance of elemental stoichiometry in marine phytoplankton. Nature 425, 291–294. doi: 10.1038/nature01953
Redfield, A. (1958). The biological control of chemical factors in the environment. Am. Sci. 46, 205–221.
Rhee, G.-Y. (1974). Phosphate uptake under nitrate limitation by Scenedesmus sp. and its ecological implications. J. Phycol. 10, 470–475.
Rhee, G.-Y. (1978). Effects of N:P atomic ratios nitrate limitation on algal growth, cell composition, nitrate uptake. Limnol. Oceanogr. 23, 10–25.
Richardson, K., Beardall, J., and Raven, J. A. (1983). Adaptation of unicellular algae to irradiance: an analysis of strategies. New Phytol. 93, 157–191.
Saito, M. A., Goepfert, T. J., and Ritt, J. T. (2008). Some thoughts on the concept of colimitation: three definitions and the importance of bioavailability. Limnol. Oceanogr. 53, 276–290. doi: 10.4319/lo.2008.53.1.0276
Shuter, B. (1979). A model of physiological adaption in unicellular algae. J. Theor. Biol. 78, 519–552.
Smith, S. L., Merico, A., Wirtz, K. W., and Pahlow, M. (2014). Leaving misleading legacies behind in plankton ecosystem modelling. J. Plankton Res. 36, 613–620. doi: 10.1093/plankt/fbu011
Smith, S. L., Pahlow, M., Merico, A., and Wirtz, K. W. (2011). Optimality-based modeling of planktonic organisms. Limnol. Oceanogr. 56, 2080–2094. doi: 10.4319/lo.2011.56.6.2080
Sperfeld, E., Raubenheimer, D., and Wacker, A. (2015). Bridging factorial and gradient concepts of resource co-limitation: towards a general framework applied to consumers. Ecol. Lett. 19, 201–215. doi: 10.1111/ele.12554
Sterner, R. W., and Elser, J. J. (2002). Ecological Stoichiometry: The Biology of Elements from Molecules to the Biosphere. Princeton, NJ; Oxford: Princeton University Press.
Talmy, D., Blackford, J., Hardman-Mountford, N. J., Dumbrell, A. J., and Geider, R. J. (2013). An optimality model of photoadaptation in contrasting aquatic light regimes. Limnol. Oceanogr. 58, 1802–1818. doi: 10.4319/lo.2013.58.5.1802
Tilman, D. (1980). A graphical-mechanistic approach to competition and predation. Am. Nat. 116, 362–393.
Tilman, D., Kilham, S., and Kilham, P. (1982). Phytoplankton community ecology: the role of limiting nutrients. Ann. Rev. Ecol. Syst. 13, 349–372.
Verspagen, J. M., Van de Waal, D. B., Finke, J. F., Visser, P. M., and Huisman, J. (2014). Contrasting effects of rising CO2 on primary production and ecological stoichiometry at different nutrient levels. Ecol. Lett. 17, 951–960. doi: 10.1111/ele.12298
Weber, T. S., and Deutsch, C. (2010). Ocean nutrient ratios governed by plankton biogeography. Nature 467, 550–554. doi: 10.1038/nature09403
Wirtz, K. W. (2000). Simulating the dynamics of leaf physiology and morphology with an extended optimality approach. Ann. Bot. 86, 753–764. doi: 10.1006/anbo.2000.1230
Wirtz, K. W. (2003). Adaptive significance of C partitioning and SLA regulation in Betula pendula. Tree Physiol. 23, 181–190. doi: 10.1093/treephys/23.3.181
Wirtz, K. W. (2012). Intermittency in processing explains the diversity and shape of functional grazing responses. Oecologia 169, 879–894. doi: 10.1007/s00442-012-2257-4
Wirtz, K. W. (2013). Mechanistic origins of variability in phytoplankton dynamics: Part I: niche formation revealed by a size-based model. Mar. Biol. 160, 2319–2335. doi: 10.1007/s00227-012-2163-7
Wirtz, K. W., and Eckhardt, B. (1996). Effective variables in ecosystem models with an application to phytoplankton succession. Ecol. Model. 92, 33–53.
Wirtz, K. W., and Pahlow, M. (2010). Dynamic chlorophyll and nitrogen:carbon regulation in algae optimizes instantaneous growth rate. Mar. Ecol. Prog. Ser. 402, 81–96. doi: 10.3354/meps08333
Wu, Y., Jeans, J., Suggett, D. J., Finkel, Z. V., and Campbell, D. A. (2014). Large centric diatoms allocate more cellular nitrogen to photosynthesis to counter slower RUBISCO turnover rates. Front. Mar. Sci. 1:68. doi: 10.3389/fmars.2014.00068
Keywords: intermittency, multi-nutrient uptake, queuing theory, physiology, phytoplankton, metabolic networks
Citation: Wirtz KW and Kerimoglu O (2016) Autotrophic Stoichiometry Emerging from Optimality and Variable Co-limitation. Front. Ecol. Evol. 4:131. doi: 10.3389/fevo.2016.00131
Received: 14 April 2016; Accepted: 01 November 2016;
Published: 23 November 2016.
Edited by:
Xabier Irigoien, King Abdullah University of Science and Technology, Saudi ArabiaReviewed by:
Sergio M. Vallina, Spanish National Research Council, SpainJuan Bonachela, University of Strathclyde, UK
Göran Ågren, Swedish University of Agricultural Sciences, Sweden
Copyright © 2016 Wirtz and Kerimoglu. This is an open-access article distributed under the terms of the Creative Commons Attribution License (CC BY). The use, distribution or reproduction in other forums is permitted, provided the original author(s) or licensor are credited and that the original publication in this journal is cited, in accordance with accepted academic practice. No use, distribution or reproduction is permitted which does not comply with these terms.
*Correspondence: Kai W. Wirtz, kai.wirtz@hzg.de