
- 1 Animal Breeding and Genetics Group, Department of Animal Sciences, Georg-August-University, Göttingen, Germany
- 2 Department of Animal Breeding, University of Kassel, Witzenhausen, Germany
The objective of this study was to estimate the contribution of each autosome to genetic variation of milk yield, fat, and protein percentage and somatic cell score in Holstein cattle. Data on 2294 Holstein bulls genotyped for 39,557 autosomal markers were used. Three approaches were applied to estimate the proportion of genetic variance attributed to each chromosome. In two of them, marker-derived kinship coefficients were computed, using either marker genotypes observed on the whole genome or on subsets relative to each chromosome. Variance components were then estimated using residual maximum likelihood in method 1 or a regression-based approach in method 2. In method 3, genetic variances associated to each marker were estimated in a linear multiple regression approach, and then were summed up chromosome-wise. Generally, all chromosomes contributed to genetic variation. For most of the chromosomes, the amount of variance attributed to a chromosome was found to be proportional to its physical length. Nevertheless, for traits influenced by genes with very large effects a larger proportion of the genetic variance is expected to be associated with the chromosomes where these genes are. This is illustrated with the DGAT1 gene on BTA14 which is known to have a large effect on fat percentage in milk. The proportion of genetic variance for fat percentage associated with chromosome 14 was two to sevenfold (depending on the method) larger than would be predicted from chromosome size alone. Based on method 3 an approach is suggested to estimate the effective number of genes underlying the inheritance of the studied traits, yielding numbers between N ≈ 400 (for fat percentage) to N ≈ 900 (for milk yield). It is argued that these numbers are conservative lower bound estimates, but are in line with recent findings suggesting a highly polygenic background of production traits in dairy cattle.
Introduction
The use of information on genealogy as a means to measure the degree of relatedness of individuals in a population has been used for several decades in many different branches of genetics. In the field of livestock genetics and breeding, the most relevant application of this idea has been the use of pedigree information to construct the so called numerator relationship matrix. The off-diagonal elements of this matrix are the numerators of the coefficients of relationship (Wright, 1922), which are twice the kinship between the animals represented by its rows and columns, and the diagonal elements are equal to 1 plus the inbreeding coefficient (Wright, 1922) of the corresponding animal, which is also the kinship coefficient of this animal with itself. The inverse of this matrix has been widely and successfully used for best linear unbiased prediction of breeding values (Henderson, 1963), as well as for estimation of genetic variance components for most of the economically important traits in all livestock species.
The advent of molecular techniques for genotyping individuals using panels of specific loci (for instance, single nucleotide polymorphisms, SNP) made it possible to identify resemblance between individuals based on the observed genetic variants that they carry. The number of loci in such panels has sharply increased in the recent years and the current developments in this field (e.g., Eck et al., 2009) indicates that full genome sequences should be available soon. Therefore, very accurate estimates of realized relationships (i.e., based on observed similarity between marker genotypes or sequences) are becoming feasible and will achieve maximum accuracy when full sequences are available.
As pointed out by Schork (2001), elements of the numerator relationship matrix built from pedigree contain the expected genome sharing for two individuals, whereas the marker-based estimates of whole genome–allele sharing are calculated by summing up allele sharing estimates at many (possibly all) loci in the genome. Hence, the marker approach accommodates variation in kinship among similarly related animals (e.g., full- or half-sibs) and thus more adequately characterizes the genome sharing of two animals than can be achieved through the use of pedigree-based expectations alone.
A number of methods for computing relationships from marker data have been proposed but results from analyses using one or another are likely to differ to a minor extent. Thomas (2005) compared estimates of heritability derived with relationships computed from several different methods and reported that the additional error introduced by using estimated rather than true relationships outstrips any difference in the amount of error due to the choice of method.
The use of realized relationship matrices built from whole genome marker information has been recently applied both in best linear unbiased prediction of breeding values and estimation of variance components (e.g., Hayes and Goddard, 2008; Lee et al., 2010). In both studies, results indicated that the estimation of variance components and genome-based prediction of breeding values was more accurate using marker-based rather than pedigree-based relationship matrices.
The idea of using marker genotypes to estimate whole genome genetic similarity between individuals can be extended to the estimation of the degree of similarity within specific segments of the genome (e.g., chromosomes) as well. Then the proportion of phenotypic variance attributed to genetic variation in a specific region (for instance, a chromosomal heritability) can be estimated analogously (Ponz et al., 2001; Schork, 2001). Such an approach was applied by Visscher et al. (2007) in the chromosome-wise partition of genetic variation for human height.
The objective of this study was to investigate the distribution of genetic variation observed in economically important traits of dairy cattle across the genome using high throughput genotype information. We will use three different approaches to quantify the association between chromosome length and genetic variance explained. Based on the results we propose a method to estimate the effective number of genes underlying the inheritance of the traits studied. Finally, the impact of the empirical results on the efficiency of genomic selection schemes is discussed.
Materials and Methods
Data
Genotypic, phenotypic, and pedigree data were collected on a set of 2294 Holstein–Friesian AI Bulls born between 1981 and 2003. The pedigree traced back to 1906 and contained 21,646 animals which were up to 21 generations apart from the founder population. The 2294 bulls belonged to generations number 7 to 20 in the pedigree. They were sons of 362 bull sires and 1858 bull dams. Number of offspring per bull sire ranged from 1 to 80 with an average of 6.37 and number of offspring per bull dam ranged from 1 to 8 with an average of 1.24. The average numerator relationship coefficient among the bulls was 0.09 ± 0.04 and almost all of them were inbred. The average inbreeding coefficient was 0.04 ± 0.02.
The 2294 samples were successfully (at most 3% of missing calls) genotyped for the Illumina BovineSNP50 BeadChip. The genotyping was done according to the manufacturer’s instructions using the Illumina BeadStudio® software to create genotypes from the raw data applying the settings recommended by Illumina. The chip assay comprises 54,001 SNP markers (Matukumalli et al., 2009), from which 52,255 were mapped to the BTAU4.0 assembly (ftp://ftp.hgsc.bcm.tmc.edu/pub/data/Btaurus/). Average space between mapped markers in the chip is 51.5 kb and median spacing is 37.32 kb. Besides the 1746 SNPs located in unassigned contigs (unknown chromosome and/or position in the BTAU4.0 assembly), some of the markers were also excluded from the data set due to more than 5% of missing calls or to minor allele frequency lower than 0.05. Criteria for filtering samples and markers from the data set were based on results from the study of The Wellcome Trust Case Control Consortium (2007). The final number of markers remaining after filtering and quality control was 39,557. Given the density of the panel and the low rate of missing calls after the filtering process, imputation of missing genotypes using linkage disequilibrium (LD) information is expected to be very accurate. Imputation was performed using the software fastPHASE 1.3.0c (Scheet and Stephens, 2006). The final numbers of markers and the inter-marker distances within each autosome are presented in Table 1.
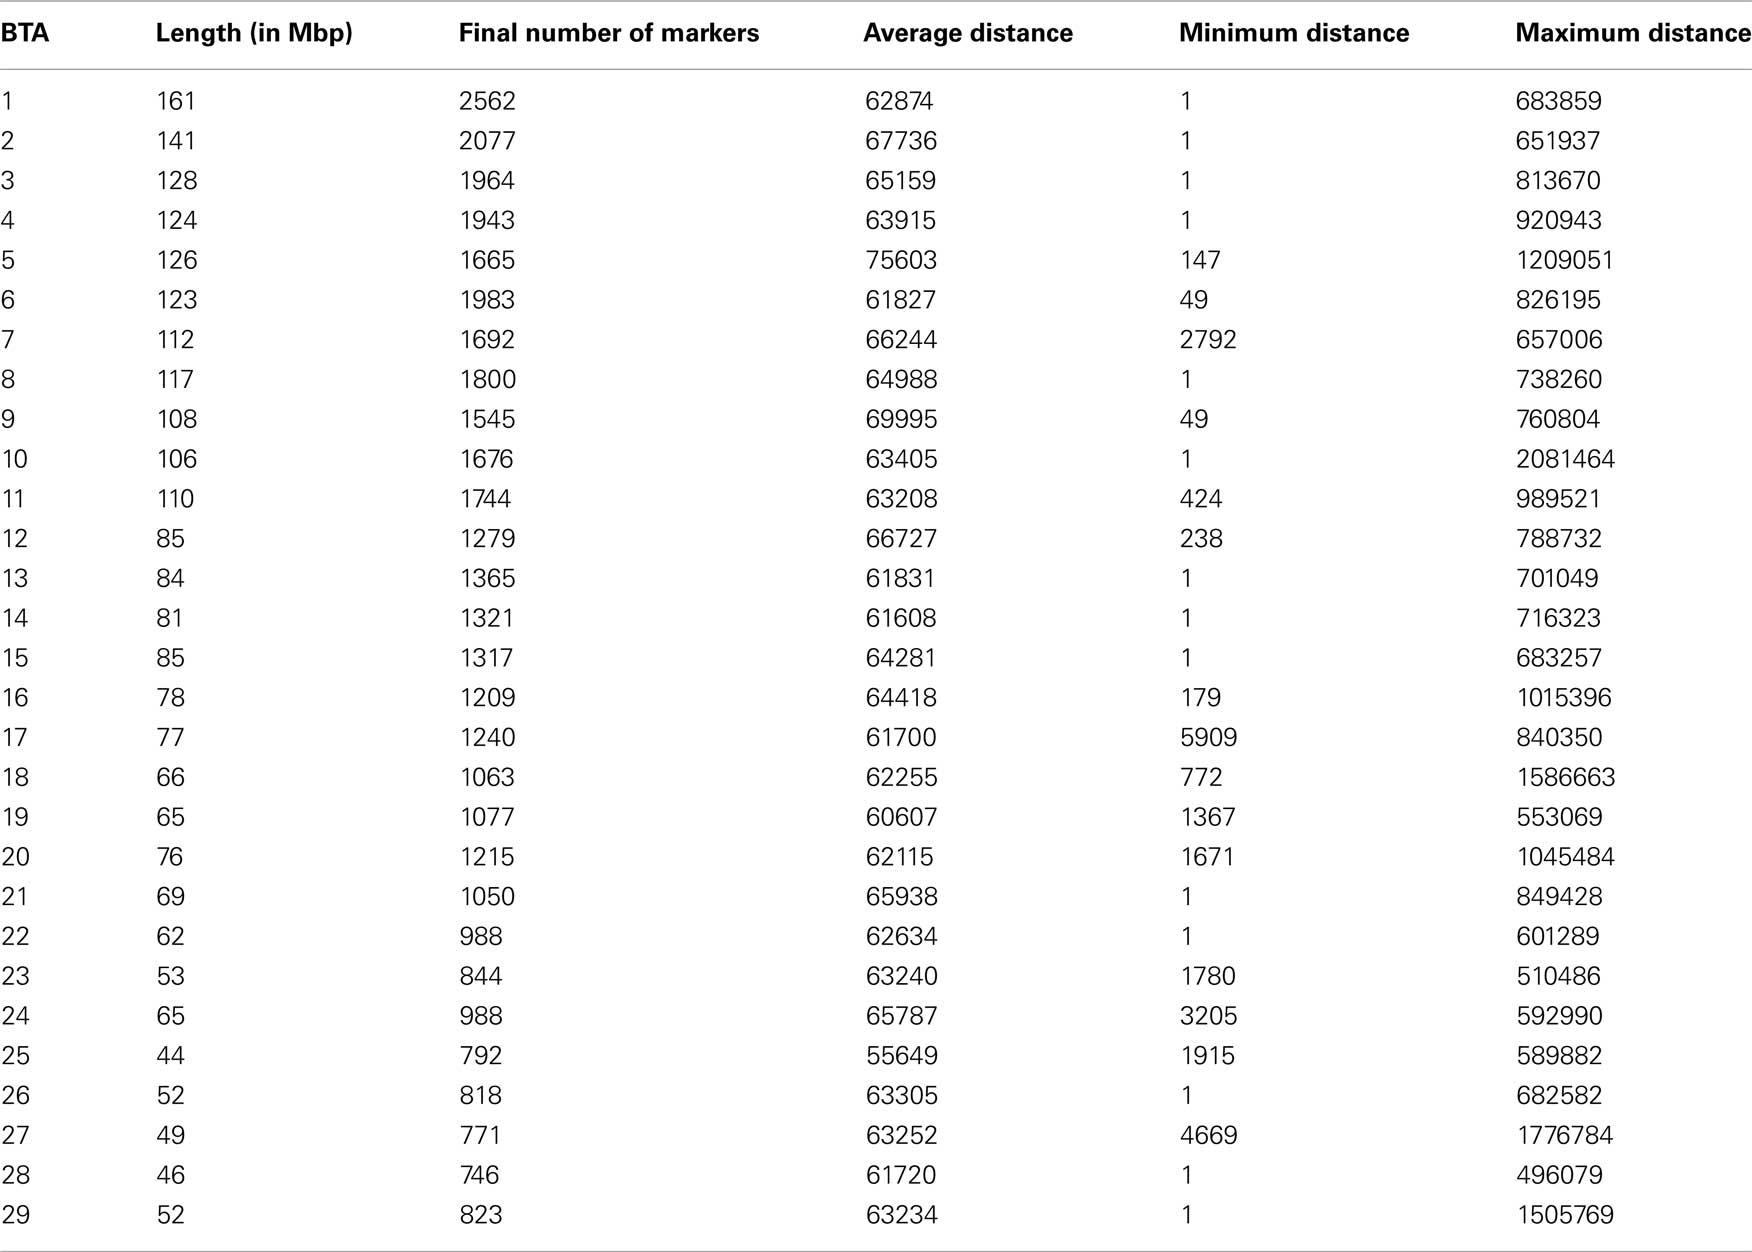
Table 1. Numbers of markers and inter-marker distances (in base-pair) across chromosomes.
Four traits related to production and typically included in national dairy cattle genetic evaluations were considered in this study: milk yield (Mkg), protein percentage (Ppr), fat percentage (Fpr), and somatic cell score (SCS). Estimated breeding values (EBV), computed using a random regression test day model, were available for all traits. Detailed information about the traits and the breeding value estimation can be found in Liu et al. (2001). Basic descriptive statistics for the traits’ EBV are presented in Table 2. The accuracies of EBV for Mkg, Fpr, and Ppr were the same and ranged from 0.88 to 0.99 with a mean of 0.94 and an SD of 0.02. The accuracies of EBV for SCS ranged from 0.76 to 0.99 with a mean of 0.88 and an SD of 0.04. Further information regarding the data can be found in Pimentel et al. (2010).
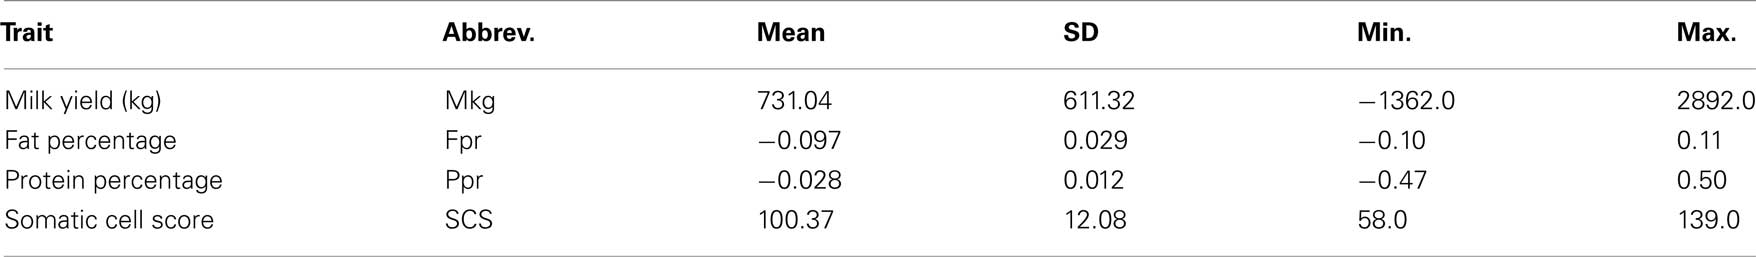
Table 2. Descriptive statistics of EBVs for traits used in the analyses.
Genomic Pair-Wise Relatedness
For every pair of genotyped animals a coefficient of kinship was computed following the similarity index approach proposed by Eding and Meuwissen (2001). Briefly, for each marker locus a genetic similarity index between a pair of animals x and y is computed as Sxy = 0.25(I11 + I12 + I21 + I22), where Iij is 1 if allele i in x is identical to allele j in y, or 0 otherwise. If founder alleles are unique, Sxy averaged over multiple loci was shown to be an unbiased estimator of the kinship coefficient, i.e., the probability of identity by descent, IBD (Eding and Meuwissen, 2001). When founder alleles are not unique, then a correction is needed to account for the probability of alleles being alike in state (AIS). For a given locus, the kinship coefficient between a pair of animals i and j (fij) is therefore estimated as:

where s is the similarity index in the founder population, i.e., the probability of two alleles being AIS in the founder population (where all animals are unrelated). An estimate of s can be obtained from data on the founder population as:

where qk is the frequency of the kth allele in the founder population.
Final estimates of kinship coefficients between every pair of animals were computed by averaging across all loci. Since estimates of s differed from one locus to another, the inverse of the variance of the estimate of fij was used as weight when taking the average, as proposed by Eding and Meuwissen (2001).
The bulls considered in this study are routinely included in national genetic evaluations. Hence, fairly complete and deep information regarding their ancestry was available. A pedigree comprising 21,646 animals tracing back to 1906 was used. This information was used for estimating allele frequencies in the founder population using the mixed model equations method proposed by Gengler et al. (2007).
Variance Component Estimation
The proportion of genetic variance contributed by each of the 29 autosomes was estimated with three different approaches, two of which using estimated genomic kinships.
In method 1 variance components were estimated by residual maximum likelihood (REML), as implemented in ASReml (Gilmour et al., 2009). Fitted models related the EBV of a given trait to an overall mean and a random genomic effect. A full model was fitted in which the assumed covariance structure of the random genomic effect was a kinship matrix built using information on the whole set of 39,557 markers distributed across all autosomic chromosomes. Estimated genomic and residual variances were then used to compute the proportion of the total variance explained by the whole genome. The contribution of each chromosome to the variance explained by the genome was then estimated by fitting reduced models in which the assumed covariance was a kinship matrix computed using all but the respective chromosome. The ratio of variance was computed for the reduced models and the contribution of each chromosome was estimated as the reduction relative to the proportion of variance explained in the full model.
Method 2 was a regression-based procedure similar to the one presented in Thomas et al. (2000) for estimating heritability using inferred relationships. For each trait a phenotypic similarity index between each pair of animals was computed as:
where Zi is the phenotypic similarity between pair i for a given trait, yi and  are the observed trait values for pair i, ȳ is the estimated mean and
  is the estimated variance of the trait. Pair-wise relatedness estimates between each pair of individuals were also calculated using the method of Eding and Meuwissen (2001), but for each chromosome separately. Estimates of the proportion of variance attributed to each chromosome were obtained with a regression model relating the phenotypic similarity to the genomic relationship relative to the given chromosome as follows:

where ki is the estimated kinship coefficient between pair i, β is the proportion of variance in EBV explained by the variance in kinship for the given chromosome and ε is a random residual term.
In method 3 allele substitution effects of all SNPs in the panel on the analyzed traits were fitted in a multiple random regression model similar to the BLUP method of Meuwissen et al. (2001). Estimated SNP effects were calculated from the following mixed model equations:
where μ is an overall mean; α is the vector of allele substitution effects; ℩ is a vector of ones, of order equal to the number of genotyped bulls; X is the matrix of SNP genotypes, coded as the number of copies of a given allele; y is the vector of EBVs; W was a diagonal matrix with the wkk element equal to the reliability on the EBV of bull k; I is an identity matrix of order equal to the number of markers and ɸ is an assumed ratio of marker to residual variances. For this estimation of marker effects the numerator was computed as the additive variance of the trait divided by the number of markers. Estimated heritabilities from Liu et al. (2001) were assumed. Estimated allele substitution effects were subsequently used for computing a variance component for each of the markers as 2p(1 − p)α2, where p is the frequency of the reference allele for the given marker. Variance components associated with each chromosome were then calculated by summing up the estimated variances of the markers within it.
In order to investigate the role of covariances, we used the estimates of marker effects from the first step of method 3 and calculated whole genome breeding values ( ) and chromosomal breeding values (
 where subscript i denotes the set of markers within the given chromosome). Next we computed the variances of wgBV, variances of cBV, and covariances between all cBV for the four traits.
Estimation of Effective Number of Genes
We assume that the inheritance of a trait is affected by N loci, which all contribute the same proportion of genetic variance  The N loci are distributed at random across the genome, i.e., the probability to be placed on a chromosome which comprises a proportion p of the entire genome is p. Then, following the concept of method 3 the genetic variance per chromosome is calculated by adding the variances of the loci assigned to the respective chromosome. Then a regression of the length of chromosome on the proportion of variance attributed to the respective chromosome is fitted and the reliability R2 of this linear regression is calculated. If N is small, the number of loci assigned to a chromosome will be variable by chance and R2 will be low. With increasing values of N the proportion of loci assigned to a chromosome will approach its relative length compared to the whole genome length and R2 will increase toward one. The effective number of genes for a trait is estimated by the N value which leads to a similar R2 as obtained with method 3.
We implemented the suggested approach in a simulation study. The whole genome was subdivided in 29 autosomes according to the length as reflected by the map information as given in Table 1. N was modified from N = 100 to N = 5000 in steps of 100. For each value, 1000 replicates were generated and analyzed.
Results
Marker allele frequencies in the founder population were estimated in a mixed model framework using observed marker genotypes and genealogy information among genotyped animals and their ancestors. Correlation between the estimated allele frequencies in the founder population and the allele frequencies observed in the sample of genotyped animals was 0.96. The absolute difference between frequencies ranged from 0 to 0.3 with a mean and an SD of 0.055 ± 0.043. Kinship coefficients estimated from marker data were plotted against the relationship coefficients estimated from pedigree data (Figure 1). As in the study by Hayes and Goddard (2008), marker and pedigree-derived relationship coefficients were highly associated (correlation of 0.73).
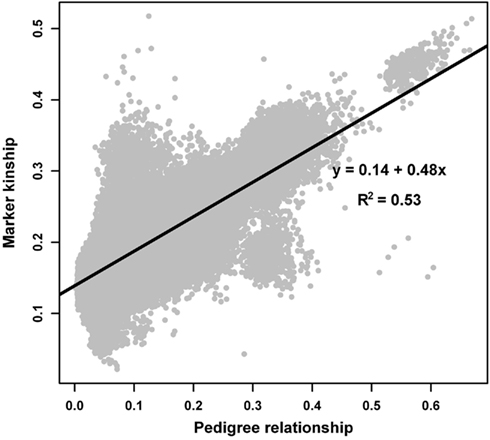
Figure 1. Kinship coefficients estimated from marker data against relationship coefficients estimated from pedigree data.
Using method 1, the proportions of variance accounted for by the genome when the full models were fitted were 0.377 (Mkg), 0.381 (Ppr), 0.369 (Fpr), and 0.438 (SCS). The contributions of each autosome to the total genomic variance ranged from 0.007 (BTA 29) to 0.030 (BTA1) for Mkg, from 0.008 (BTA29) to 0.032 (BTA1) for Ppr, from 0.008 (BTA29) to 0.041 (BTA14) for Fpr, and from 0.009 (BTA26) to 0.031 (BTA1) for SCS. The proportions of variance contributed by each autosome against its physical length for the four traits are presented in Figure 2.
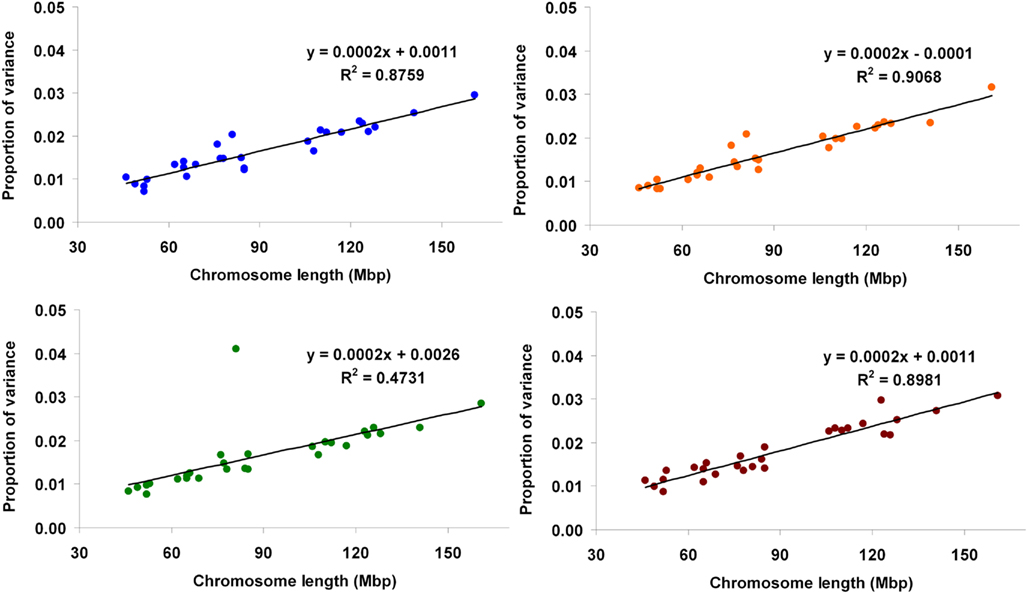
Figure 2. Proportion of genetic variance for milk yield (blue), protein percentage (orange), fat percentage (green), and somatic cell score (brown) explained by each autosome (estimated using method 1) against physical length of the chromosome.
When method 2 was applied, the proportion attributed to each autosome ranged from 0.023 (BTA25) to 0.16 (BTA1) for Mkg, from 0.019 (BTA25) to 0.158 (BTA14) for Ppr, from 0.018 (BTA25) to 0.34 (BTA14) for Fpr, and from 0.024 (BTA25) to 0.153 (BTA4) for SCS. Proportions of variance explained by the autosomes against their physical lengths are shown in Figure 3. Regression analyses were also performed using the kinship coefficients computed with all the markers in the panel (analogously to the full model in method 1). The estimated proportions of total variance accounted for by the whole genome were 0.761 (Mkg), 0.512 (Ppr), 0.624 (Fpr), and 0.753 (SCS).
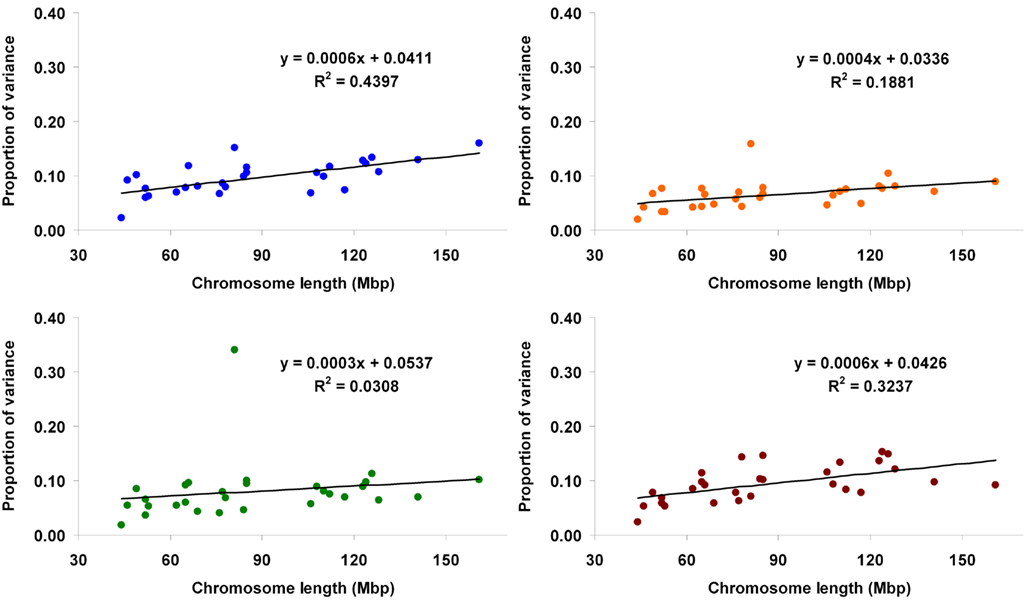
Figure 3. Proportion of genetic variance for milk yield (blue), protein percentage (orange), fat percentage (green), and somatic cell score (brown) explained by each autosome (estimated using method 2) against physical length of the chromosome.
In method 3, the proportions of variance explained by each marker (expressed as the ratio of estimated marker variance to the sum across the whole genome) are illustrated in the Manhattan plots presented in Figure 4. The contribution of each chromosome to the total genomic variance was computed as the sum of the estimated variances at each marker within the given chromosome. Proportion attributed to each chromosome ranged from 0.021 (BTA27) to 0.084 (BTA14) for Mkg, from 0.018 (BTA28) to 0.113 (BTA14) for Ppr, from 0.014 (BTA26) to 0.23 (BTA14) for Fpr, and from 0.02 (BTA27) to 0.05 (BTA5) for SCS. The proportions of variance attributed to each chromosome plotted against their physical lengths are presented in Figure 5.
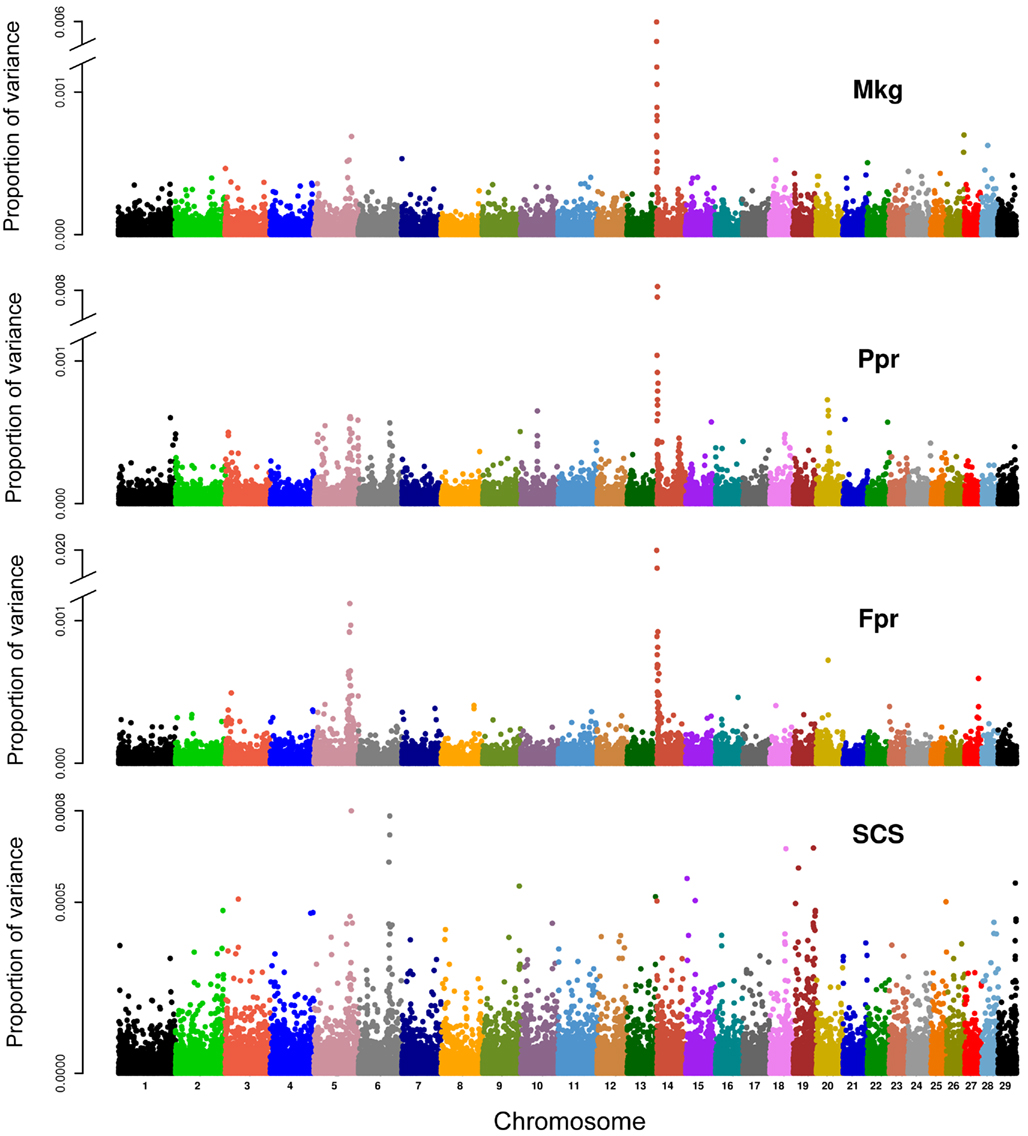
Figure 4. Proportion of genetic variance for milk yield (Mkg), protein percentage (Ppr), fat percentage (Fpr), and somatic cell score (SCS) explained by each marker in the panel (estimated using method 3).
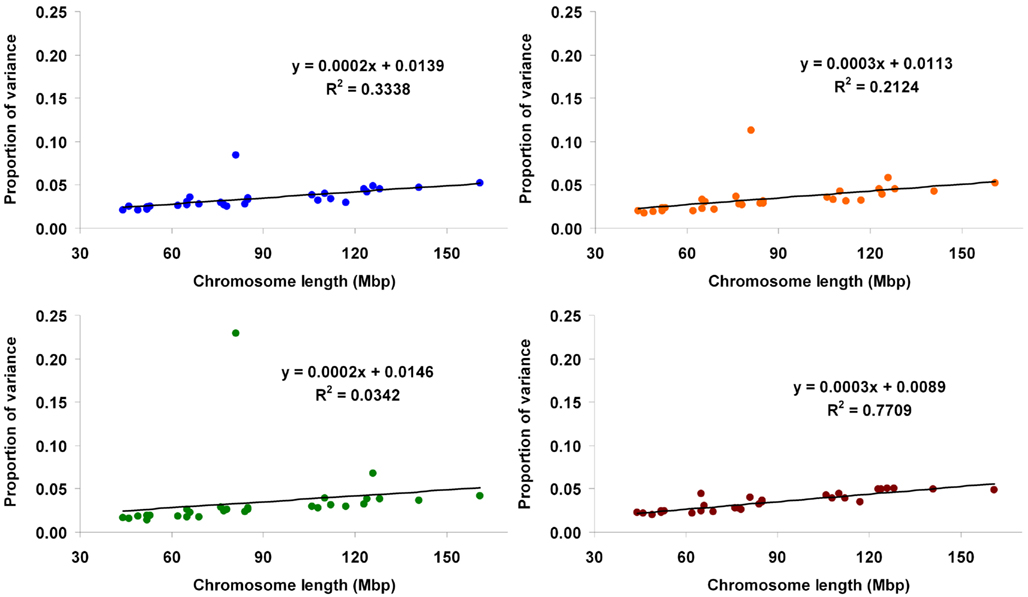
Figure 5. Proportion of genetic variance for milk yield (blue), protein percentage (orange), fat percentage (green), and somatic cell score (brown) explained by each autosome (estimated using method 3) against physical length of the chromosome.
The degree of agreement among the results obtained from each of the three estimation methods applied was also assessed. Spearman correlation coefficients between proportions of variance explained by each chromosome across methods and traits are presented in Table 3. In general, a greater degree of agreement between the results of analyses with methods 1 and 3 was observed. A comparison of results from the three methods suggests that the chromosomal variance from method 2 is overestimated. Methods 1 and 3 use information on the whole genome simultaneously, either by contrasting a full model considering the whole genome with a reduced model leaving one chromosome out, or by using all markers in the genome in a multiple regression framework. Method 2 uses only information from a given chromosome at a time, which might explain this overestimation.
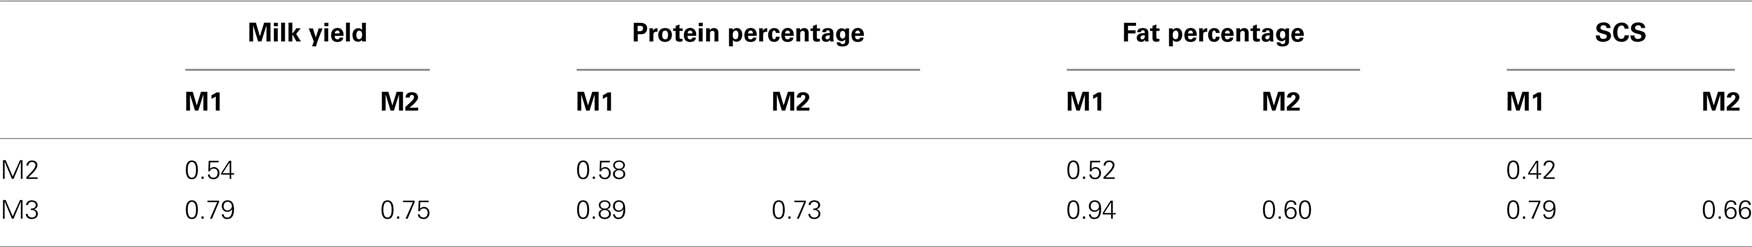
Table 3. Spearman correlation coefficients between proportions of variance explained by chromosomes across the three estimation methods for the four traits.
Discussion
The regressions of the proportion of variance accounted for by a given chromosome on its physical length fitted very well a linear relationship, as illustrated by fitted lines (Figures 2, 3, and 5) and corresponding coefficients of determination (R2). These results suggest that the larger the chromosome the more genetic variance it explains. This was observed in the three estimation methods applied here but more pronouncedly in methods 1 and 3. The overall trend observed with our data is in agreement with results from Visscher et al. (2007), who analyzed data on human height and reported statistically highly significant relationship between the proportion of additive genetic variance explained by a chromosome and its genetic length. They concluded that their results imply that genetic variation for human height can be explained by many loci distributed across all autosomes with an additive mode of gene action.
One major exception from this relationship was observed with our data, though. The amount of genetic variance explained by BTA14 deviated dramatically (especially for Fpr and Ppr) from the general trend stated above. The reason for that is already well known to dairy genetics researchers and is clearly illustrated in the Manhattan plots of Figure 4. The plots of Mkg, Ppr, and Fpr show a high peak toward the centromeric end of BTA14, in the region of the DGAT1 (diacylglycerol O-acyltransferase 1) gene. Grisart et al. (2002) reported that a polymorphism in DGAT1 explained 51% of the variance in sire’s daughter yield deviations for fat percentage, 14% of the variance in protein percentage, and 18% of the variance in milk yield. The deviation of the proportion of variance in Mkg, Ppr, and Fpr explained by BTA14 from what would be expected from its physical length was most pronounced with estimation method 3 (Figure 5), but could also be observed with the other two estimation methods, especially for Ppr and Fpr (Figures 2 and 3). The impact of DGAT1 on these traits is also illustrated by the influence of the BTA14 data point on the measure of fit of the linear regression of proportion of variance on physical length. For instance, the R2 of the regression for SCS with method 1 was 0.90 compared to 0.47 for Fpr (Figure 2). Similar contrasts can also be observed by comparing the R2 of the regressions from the other methods as well (Figures 3 and 5). We performed the same regression analyses but leaving the BTA14 out of the data set and checked the difference in proportion of variability in the data set accounted for by the regression model. Comparisons of R2 values from the regressions with and without the BTA14 data points reveal a clear increase in the goodness of fit for Mkg, Ppr, and Fpr when this chromosome was left out (Table 4). Values of R2 from these regressions are particularly large for methods 1 and 3. In comparison with method 1, the R2 from method 3 are lower due to a peak at the end of BTA5, which is especially more pronounced for Fpr (Figure 4). For SCS hardly any change could be observed, which reflects the fact that this trait is not strongly influenced by DGAT1. Results for SCS are therefore similar to the ones reported by Visscher et al. (2007) for human height, providing evidence that SCS in dairy cattle also seems to be governed by many loci with small effects distributed across the whole genome.
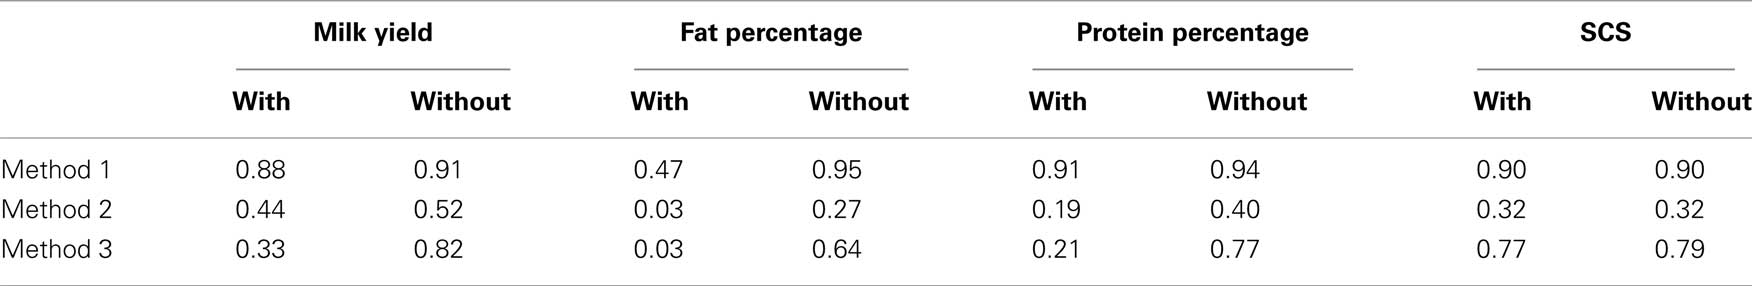
Table 4. Coefficients of determination (R2) of regressions of proportion of variance on physical length of each chromosome, including and excluding BTA14 from the analyses.
In method 1, the sums of the estimated contributions from each autosome to the total genomic variance for the four traits were 0.459 (Mkg and Ppr), 0.465 (Fpr), and 0.503 (SCS). These values are greater than the proportions of variance attributed to the whole genome, as estimated when fitting the full models. The sums of the proportions of variance attributed to each chromosome with method 2 were even farther from the ones estimated for the whole genome and actually above 1, namely 2.78 (Mkg), 1.88 (Ppr), 2.33 (Fpr), and 2.74 (SCS). Hayes et al. (2010) estimated proportions of genetic variance attributed to segments of the genome and also reported that the sums of the segment variances were much greater than the total (204, 107, and 213% for fat percentage, overall type, and proportion of black in Australian Holstein, respectively). As an explanation, they mention that segments next to the ones containing important genes (e.g., DGAT1) also explain large amounts of variance, so that the variances associated with these genes are counted more than once. Another way of interpreting this multiple counting of variances would be to attribute them to the existence of positive covariances between segments. The variances of wgBV were 335097 (Mkg), 132.67 (Ppr), 819.65 (Fpr), and 110.62 (SCS), whilst the sums of variances of cBV were 180338 (Mkg), 80.09 (Ppr), 483.1 (Fpr), and 57.14 (SCS). The contributions of the sums of (co)variances among cBV to the total variances (wgBV) of the four traits are illustrated as stacked bars in Figure 6. In the analyzed sample, the magnitudes of the covariances between pairs of chromosomes were much lower than the chromosomal variances, but the summed covariances across all chromosomes explained between 40 and 50% of the total genomic variance.
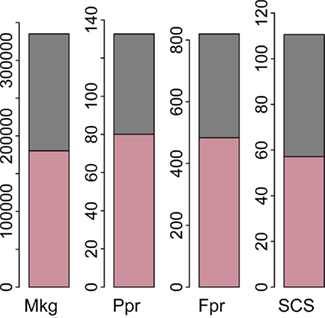
Figure 6. Sums of variances (pink) and covariances (grey) between predicted chromosomal breeding values. Traits are milk yield (Mkg), protein percentage (Ppr), fat percentage (Fpr), and somatic cell score (SCS).
The relative magnitudes of the variances of cBV also concurred with the results from the variance component estimation, in the sense that larger chromosomes contributed a larger proportion of variance (more clearly noted for SCS) and a sharply higher contribution from BTA14 was observed for the other traits, especially Ppr and Fpr.
The reported results are not suited to proof that an infinitesimal model of inheritance is underlying the traits studied (after correction for DGAT1). Nevertheless the observed results are close to what would be expected if an infinitesimal model was the true state of nature. This will be illustrated with the results from the simulation study that was performed in order to assess the effective number of genes that underlie the trait under consideration. The boxplots of R2 values from the regression of chromosome length on number of loci within it, for different number of total simulated loci are shown in Figure 7. The whiskers of the boxplot cover the 95% quantile of the obtained R2 values.
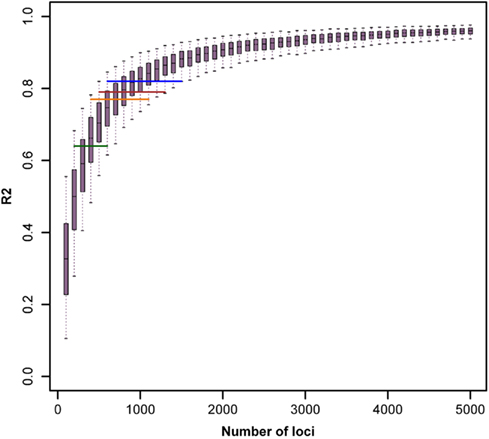
Figure 7. Boxplots of R2 values from the regression of chromosome length on number of loci within it, for different number of total simulated loci. Horizontal lines depict the 95% quantile bounds for the number of loci inferred from R2 values (method 3, without BTA14) for milk yield (blue), protein percentage (orange), fat percentage (green), and somatic cell score (brown).
To estimate the effective number of genes underlying the traits considered, we compare these values with the empirical R2 values obtained with method 3 in the actual data set. To avoid a too strong influence of the presence of the DGAT1 gene on the results, we use as a comparison the R2 values after exclusion of chromosome BTA14 as shown in Table 4. The mean R2 values range from R2 = 0.64 for Fpr to R2 = 0.82 for Mkg. These values are shown in Figure 7 as horizontal lines. The observed value for fat percentage is in close agreement with the mean simulated value obtained with N ≈ 400, but R2 = 0.64 is within the 95% quantile obtained with 200 ≤ N ≤ 600. For milk yield, the best estimate of the effective number of genes is N ≈ 900 with a 95% confidence range 600 ≤ N ≤ 1500. The corresponding values for protein percent are N ≈ 700 with a 95% confidence range 400 ≤ N ≤ 1100 and for SCS N ≈ 800 with a 95% confidence range 500 ≤ N ≤ 1300.
It should be noted that the suggested estimate of the effective number of genes is a conservative (lower bound) estimate of the true number of genes involved. Most of the assumptions made in this approach lead to a downward bias in the estimate of N. If the proportion of variance assigned to each gene is not uniform but skewed, with few major genes contributing large variation and many genes contributing little variation, the proportion of genetic variance allocated on one chromosome will be dominated by the number of major genes allocated on that chromosome. Due to their small number, the distribution of genetic variance will be more unbalanced and resulting R2 values will be reduced. A skewed (exponential or gamma-like) distribution of absolute additive allele effect sizes was demonstrated empirically, e.g., for Drosophila melanogaster (Shrimpton and Robertson, 1988; Dilda and Mackay, 2002), cattle (Hayes and Goddard, 2001), and pigs (Bennewitz and Meuwissen, 2010), which will result in a less uniform distribution of genetic variance across chromosome segments, as empirically demonstrated by Hayes et al. (2010). Similarly, a non-random distribution of genes, as reflected, e.g., by gene clusters (see, e.g., Larson et al., 2006), will lead to a chromosomal accumulation of genes and by this reduce the expected R2.
The obtained estimates of N ≈ 400 (for fat percentage) to N ≈ 900 (for milk yield) effective genes, estimated with a considerable standard error, are rather high, even more so since they have to be considered as lower bound estimates of the true numbers. Studies to estimate the total number of underlying loci for quantitative traits are mainly based on QTL studies in crosses or mapping designs (Otto and Jones, 2000). Following such an approach, Chamberlain et al. (2007) suggested that at least 30 QTL were likely to be segregating for milk production traits in the Holstein population. This type of estimation is heavily affected by the power of the underlying QTL mapping experiment, so that the authors suggest that this number will likely increase if the power of the experiment increases. Although Otto and Jones (2000) have suggested an approach to use QTL-based estimators to assess how many loci may have been missed, it must be doubted that the number of loci with minor effects will be estimated with reasonable precision.
Experimental studies have revealed that for major biological mechanism a substantial proportion of all genes plays an indispensable role. In a study based on knockout-mice, Reed et al. (2008) found that 31% of the knocked out genes had an effect on body weight, resulting in an estimate of ∼6000 genes underlying growth. Slightly smaller, but still substantial proportion of relevant genes for indispensable traits were obtained in experimental studies with flies, worms, and yeast (Ross-Macdonald et al., 1999; Giaever et al., 2002; Kamath et al., 2003). Since milk production and milk composition are traits of crucial importance in mammalian species, a similar proportion of genes underlying this trait complex in dairy cattle seems reasonable, so that the estimated 400–900 effective genes fit well into the general picture.
The number of genes underlying quantitative traits in dairy cattle also was discussed in the context of the accuracy of prediction of genomic breeding values (Daetwyler et al., 2010). The authors argue that (i) accuracy of prediction using genomic BLUP (Meuwissen et al., 2001) mainly depends on the number of independently segregating chromosome segments Me, which in turn is a function of genome length and effective population size; and (ii) accuracy of prediction using BayesB (Meuwissen et al., 2001) is mainly dependent on the number of QTL NQTL involved in the inheritance of the trait. They further argue that accuracies obtained with both methods will be similar if NQTL is large and that in real data set Me is an approximate upper limit for possible estimates of NQTL. When applying Eq. 4 of Daetwyler et al. (2010) to accuracies obtained with BayesB in Norwegian Red Cattle (Luan et al., 2009) for milk yield the resulting estimate for NQTL is 745 with a 95% confidence interval 548 < NQTL < 1013. Since the estimate for Me derived from the accuracies obtained with genomic BLUP in the same dataset is 734, the estimated number of 745 underlying QTL must be considered as a lower bound estimate. In any case it is in the same order of magnitude as the result (N ≈ 900) obtained in our study for milk yield. Despite the fact that these results cannot be considered as a proof of the validity of the infinitesimal model underlying the studied traits, the study provides another strong piece of evidence that a very large number of genes is involved in the inheritance of milk yield and composition traits.
In genomic selection programs, availability of genomic information may also be used to improve upon the conventional method and allow for even higher genetic progress through an increase in accuracy of evaluation resulting from the use of better knowledge about the genetic architecture underlying quantitative traits. Daetwyler et al. (2010) and Hayes et al. (2010) showed how different genetic architectures may influence the performance of genomic evaluations and how this information can be used in order to define methods that appropriately take that into account. Such approaches would be applicable in cases where genomic predictions are made in a two step procedure, i.e., estimation of marker effects with subsequent summation of values of all marker genotypes across the genome. In this case, whenever a quantitative trait is regarded to be influenced by a very large number of loci each with a small effect and none with large effects then an estimation method that treats SNPs homogenously (e.g., BLUP of Meuwissen et al., 2001) should be more appropriate. Daetwyler et al. (2010) showed this with simulated data and Hayes et al. (2010) with data on overall type in Holstein cattle. When the genetic architecture underlying a given quantitative trait suggests the presence of genomic regions with outstanding relevance, a procedure that allows for such variation (e.g., a Bayesian method) should appropriately account for that. If genomic evaluations are to be done in a single step, where the genomic information is used for computing realized relationship matrices and then setting up mixed model equations (e.g., Legarra et al., 2009; Misztal et al., 2009), then an option to account for the underlying genetic architecture could be the application of weighting factors when computing the marker-based relationship coefficients. This could account for the underlying genetic architecture and make the proper adjustments whichever class of trait (regarding distribution of effects or associated variances) is under consideration. A first simple and obvious choice one may think of would be the use of some estimate of marker variance (e.g., the ones resulting from method 3) as weights, but further research should be done in order to find appropriate approaches.
Conflict of Interest Statement
The authors declare that the research was conducted in the absence of any commercial or financial relationships that could be construed as a potential conflict of interest.
Acknowledgments
This research was funded by the German Federal Ministry of Education and Research (BMBF) within the AgroClustEr “Synbreed – Synergistic plant and animal breeding” (FKZ 0315526), and as part of the project FUGATO-plus GenoTrack (FKZ 0315134C).
References
Bennewitz, J., and Meuwissen, T. H. E. (2010). The distribution of QTL additive and dominance effects in porcine F2 crosses. J. Anim. Breed. Genet. 127, 171–179.
Chamberlain, A. J., McPartlan, H. C., and Goddard, M. E. (2007). The number of loci that affect milk production traits in dairy cattle. Genetics 177, 1117–1123.
Daetwyler, H. D., Pong-Wong, R., Villanueva, B., and Woolliams, J. A. (2010). The impact of genetic architecture on genome-wide evaluation methods. Genetics 185, 1021–1031.
Dilda, C. L., and Mackay, T. F. C. (2002). The genetic architecture of Drosophila sensory bristle number. Genetics 162, 1655–1674.
Eding, H., and Meuwissen, T. H. E. (2001). Marker-based estimates of between and within population kinships for the conservation of genetic diversity. J. Anim. Breed. Genet. 118, 141–159.
Eck, S. H., Benet-Pagès, A., Flisikowski, K., Meitinger, T., Fries, R., and Strom, T. M. (2009). Whole genome sequencing of a single Bos taurus animal for single nucleotide polymorphism discovery. Genome Biol. 10, R82.
Gengler, N., Mayeres, P., and Szydlowski, M. (2007). A simple method to approximate gene content in large pedigree populations: application to the myostatin gene in dual-purpose Belgian Blue cattle. Animal 1, 21–28.
Giaever, G., Chu, A. M., Ni, L., Connelly, C., Riles, L., Veronneau, S., Dow, S., Lucau-Danila, A., Anderson, K., Andre, B., Arkin, A. P., Astromoff, A., El-Bakkoury, M., Bangham, R., Benito, R., Brachat, S., Campanaro, S., Curtiss, M., Davis, K., Deutschbauer, A., Entian, K. D., Flaherty, P., Foury, F., Garfinkel, D. J., Gerstein, M., Gotte, D., Guldener, U., Hegemann, J. H., Hempel, S., Herman, Z., Jaramillo, D. F., Kelly, D. E., Kelly, S. L., Kotter, P., LaBonte, D., Lamb, D. C., Lan, N., Liang, H., Liao, H., Liu, L., Luo, C., Lussier, M., Mao, R., Menard, P., Ooi, S. L., Revuelta, J. L., Roberts, C. J., Rose, M., Ross-Macdonald, P., Scherens, B., Schimmack, G., Shafer, B., Shoemaker, D. D., Sookhai-Mahadeo, S., Storms, R. K., Strathern, J. N., Valle, G., Voet, M., Volckaert, G., Wang, C. Y., Ward, T. R., Wilhelmy, J., Winzeler, E. A., Yang, Y., Yen, G., Youngman, E., Yu, K., Bussey, H., Boeke, J. D., Snyder, M., Philippsen, P., Davis, R. W., and Johnston, M. (2002). Functional profiling of the Saccharomyces cerevisiae genome. Nature 418, 387–391.
Gilmour, A. R., Gogel, B. J., Cullis, B. R., and Thompson, R. (2009). ASReml User Guide Release 3.0. Hemel Hempstead: VSN International Ltd
Grisart, B., Coppieters, W., Farnir, F., Karim, L., Ford, C., Berzi, P., Cambisano, N., Mni, M., Reid, S., Simon, P., Spelman, R., Georges, M., and Snell, R. (2002). Positional candidate cloning of a QTL in dairy cattle: identification of a missense mutation in the bovine DGAT1 gene with major effect on milk yield and composition. Genome Res. 12, 222–231.
Hayes, B., and Goddard, M. E. (2001). The distribution of the effects of genes affecting quantitative traits in livestock. Genet. Sel. Evol. 33, 209–229.
Hayes, B. J., and Goddard, M. E. (2008). Prediction of breeding values using marker-derived relationship matrices. J. Anim. Sci. 86, 2089–2092.
Hayes, B. J., Pryce, J., Chamberlain, A. J., Bowman, P. J., and Goddard, M. E. (2010). Genetic architecture of complex traits and accuracy of genomic prediction: coat colour, milk-fat percentage, and type in Holstein cattle as contrasting model traits. PLoS Genet. 6, e1001139. doi: 10.1371/journal.pgen.1001139
Henderson, C. R. (1963). “Selection index and expected genetic advance,” in Statistical Genetics and Plant Breeding, ed. W. D. Hanson and H. F. Robinson (Washington, DC: National Academy of Sciences – National Research Council), Pub. 982, 141–163.
Kamath, R. S., Fraser, A. G., Dong, Y., Poulin, G., Durbin, R., Gotta, M., Kanapin, A., Le Bot, N., Moreno, S., Sohrmann, M., Welchman, D. P., Zipperlen, P., and Ahringer, J. (2003). Systematic functional analysis of the Caenorhabditis elegans genome using RNAi. Nature 421, 231–237.
Larson, J. H., Marron, B. M., Beever, J. E., Roe, B. A., and Lewin, H. A. (2006). Genomic organization and evolution of the ULBP genes in cattle. BMC Genomics 7, 227. doi: 10.1186/1471-2164-7-227
Lee, S. H., Goddard, M. E., Visscher, P. M., and van der Werf, J. H. J. (2010). Using the realized relationship matrix to disentangle confounding factors for the estimation of genetic variance components of complex traits. Genet. Sel. Evol. 42, 22.
Legarra, A., Aguilar, I., and Misztal, I. (2009). A relationship matrix including full pedigree and genomic information. J. Dairy Sci. 92, 4656–4663.
Liu, Z., Reinhardt, F., Bünger, A., Dopp, L., and Reents, R. (2001). Application of a random regression model to genetic evaluations of test day yields and somatic cell scores in dairy cattle. Interbull Bull. 27, 159–166.
Luan, T., Woolliams, J. A., Lien, S., Kent, M., Svendsen, M., and Meuwissen, T. H. E. (2009). The Accuracy of genomic selection in Norwegian red cattle assessed by cross-validation. Genetics 183, 1119–1126.
Matukumalli, L. K., Lawley, C. T., Schnabel, R. D., Taylor, J. F., Allan, M. F., Heaton, M. P., O’Connell, J., Moore, S. S., Smith, T. P., Sonstegard, T. S., and Van Tassell, C. P. (2009). Development and characterization of a high density SNP genotyping assay for cattle. PLoS ONE 4, e5350. doi: 10.1371/journal.pone.0005350
Meuwissen, T. H. E., Hayes, B. J., and Goddard, M. E. (2001). Prediction of total genetic value using genome-wide dense marker maps. Genetics 157, 1819–1829.
Misztal, I., Legarra, A., and Aguilar, I. (2009). Computing procedures for genetic evaluation including phenotypic, full pedigree, and genomic information. J. Dairy Sci. 92, 4648–4655.
Otto, S. P., and Jones, C. D. (2000). Detecting the undetected: estimating the total number of loci underlying a quantitative trait. Genetics 156, 2093–2107.
Pimentel, E. C. G., Bauersachs, S., Tietze, M., Simianer, H., Tetens, J., Thaller, G., Reinhardt, F., Wolf, E., and König, S. (2010). Exploration of relationships between production and fertility traits in dairy cattle via association studies of SNPs within candidate genes derived by expression profiling. Anim. Genet. doi: 10.1111/j.1365-2052.2010.02148.x
Ponz, R., Moreno, C., Allain, D., Elsen, J. M., Lantier, F., Lantier, I., Brunel, J. C., and Pérez-Enciso, M. (2001). Assessment of genetic variation explained by markers for wool traits in sheep via a segment mapping approach. Mamm. Genome 12, 569–572.
Reed, D. R., Lawler, M. P., and Tordoff, M. G. (2008). Reduced body weight is a common effect of gene knockout in mice. BMC Genet. 9, 4. doi: 10.1186/1471-2156-9-4
Ross-Macdonald, P., Coelho, P. S., Roemer, T., Agarwal, S., Kumar, A., Jansen, R., Cheung, K. H., Sheehan, A., Symoniatis, D., Umansky, L., Heidtman, M., Nelson, F. K., Iwasaki, H., Hager, K., Gerstein, M., Miller, P., Roeder, G. S., and Snyder, M. (1999). Large-scale analysis of the yeast genome by transposon tagging and gene disruption. Nature 402, 413–418.
Scheet, P., and Stephens, M. (2006). A fast and flexible statistical model for large-scale population genotype data: applications to inferring missing genotypes and haplotypic phase. Am. J. Hum. Genet. 78, 629–644.
Shrimpton, A. E., and Robertson, A. (1988). The isolation of polygenic factors controlling bristle score in Drosophila melanogaster. II. Distribution of third chromosome bristle effects within chromosome sections. Genetics 118, 445–459.
The Wellcome Trust Case Control Consortium. (2007). Genome-wide association study of 14,000 cases of seven common diseases and 3,000 shared controls. Nature 447, 661–678.
Thomas, S. C. (2005). The estimation of genetic relationships using molecular markers and their efficiency in estimating heritability in natural populations. Philos. Trans. R. Soc. Lond. B Biol. Sci. 360, 1457–1467.
Thomas, S. C., Pemberton, J. M., and Hill, W. G. (2000). Estimating variance components in natural populations using inferred relationships. Heredity 84, 427–436.
Visscher, P. M., Macgregor, S., Benyamin, B., Zhu, G., Gordon, S., Medland, S., Hill, W. G., Hottenga, J.-J., Willemsen, G., Boomsma, D. I., Liu, Y.-Z., Deng, H.-W., Montgomery, G. W., and Martin, N. G. (2007). Genome partitioning of genetic variation for height from 11,214 sibling pairs. Am. J. Hum. Genet. 81, 1104–1110.
Keywords: genetic marker, genomic relationship, variance partitioning, effective number of genes
Citation: Pimentel ECG, Erbe M, König S and Simianer H (2011) Genome partitioning of genetic variation for milk production and composition traits in Holstein cattle. Front. Gene. 2:19. doi: 10.3389/fgene.2011.00019
Received: 07 February 2011; Paper pending published: 06 April 2011;
Accepted: 18 April 2011; Published online: 02 May 2011.
Edited by:
Miguel Perez-Enciso, Universitat Autonoma de Barcelona, SpainCopyright: © 2011 Pimentel, Erbe, König and Simianer. This is an open-access article subject to a non-exclusive license between the authors and Frontiers Media SA, which permits use, distribution and reproduction in other forums, provided the original authors and source are credited and other Frontiers conditions are complied with.
*Correspondence: Eduardo da Cruz Gouveia Pimentel, Animal Breeding and Genetics Group, Department of Animal Sciences, Georg-August-University, Albrecht-Thaer-Weg 3, 37075 Göttingen, Germany. e-mail: epiment@gwdg.de