
- 1 Department of Genome Sciences, University of Washington, Seattle, WA, USA
- 2 Department of Genetics, University of Pennsylvania, Philadelphia, PA, USA
Considerable work has been devoted to identifying regions of the human genome that have been subjected to recent positive selection. Although detailed follow-up studies of putatively selected regions are critical for a deeper understanding of human evolutionary history, such studies have received comparably less attention. Recently, we have shown that ALMS1 has been the target of recent positive selection acting on standing variation in Eurasian populations. Here, we describe a careful follow-up analysis of genetic variation across the ALMS1 region, which unexpectedly revealed a cluster of substrates of positive selection. Specifically, through the analysis of SNP data from the HapMap and Human Genome Diversity Project–Centre d’Etude du Polymorphisme Humain samples as well sequence data from the region, we find compelling evidence for three independent and distinct signals of recent positive selection across this 3 Mb region surrounding ALMS1. Moreover, we analyzed the HapMap data to identify other putative clusters of independent selective events and conservatively discovered 19 additional clusters of adaptive evolution. This work has important implications for the interpretation of genome-scans for positive selection in humans and more broadly contributes to a better understanding of how recent positive selection has shaped genetic variation across the human genome.
Introduction
Interest in identifying regions of the human genome that have been subjected to recent positive selection has grown considerably since the availability of whole genome SNP and sequence data, resulting in large lists of candidate selection genes (Akey, 2009). Very little follow-up, however, has been conducted to explore the patterns of genetic variation at these loci in more detail and in geographically diverse populations. Recently, we described a detailed analysis of the evolutionary history of ALMS1 variation, which has a strong signature of selection from standing variation in European and Asian populations (Scheinfeldt et al., 2009). Here, we focus on a detailed analysis of a 3-Mb region encompassing ALMS1 that possesses patterns of variation consistent with the action of three independent selective events in human history.
In addition, we also evaluated whether the chromosome 2 cluster of positive selection was unique or if there were additional clusters of selection in the human genome. Our analysis of SNP data from the HapMap Phase II samples (International HapMap Consortium, 2005; Sabeti et al., 2007) indicates that there are indeed additional clusters of selective, and that these regions are unlikely to have arisen under a model of neutral evolution. Furthermore, several of the clusters we identified contain previously known candidate genes for selection; however, these regions have been interpreted as a single signature of selection across linked loci and possible independent selective events were not considered. Our work suggests that signatures of selection identified in genome-wide scans of selection are more complex than previously assumed, and a subset are comprised of multiple and independent selective targets. Thus, follow-up studies of genes and regions identified in genome-wide scans for positive selection are critical to foster a deeper understanding of the mechanistic basis of recent human evolutionary history.
Materials and Methods
Samples
We sequenced approximately 6 kb of ALMS1, approximately 4 kb of GCS1, and approximately 2 kb of sequence in the regions between ALMS1 and SEC15L2 and between ALMS1 and GCS1 in DNA samples from 91 individuals representing 6 human populations and 4 non-human primates that were obtained from the Coriell Institute for Medical Research Cell Repositories (Camden, NJ, USA). Coriell repository numbers for these samples are as follows: CEPH (n = 21: NA06990, NA07019, NA07348-9, NA10830-1, NA10842-5, NA10848, NA10850-4, NA10857-8, NA10860-1, NA17201), Han Chinese of L.A. (n = 21: NA17733–NA17749, NA17752–56), Middle East (n = 10: NA17041–50), Pygmy (n = 10: NA10469–73, NA10492–96), South Africa (n = 9: NA17341–49), South America (n = 10: NA17301–10), and South East Asia (n = 10: NA17081–90), gorilla (Gorilla gorilla; AG05251), bonobo (Pan paniscus; AG05253), chimpanzee (Pan troglodytes; AG06939), and orangutan (Pongo pygmaeus; AG12256). We acquired SEC15L2 sequence from Seattle SNPs1. Genotype data from 210 unrelated individuals were obtained from the HapMap project (Release 22 NCBI Build 36; International HapMap Consortium, 2005), and genotype data from 947 unrelated individuals were obtained from the Human Genome Diversity Project–Centre d’Etude du Polymorphisme Humain (HGDP–CEPH) Diversity Project (Li et al., 2008).
DNA Sequencing
We designed sequencing primers from published human sequence (NM_015120) with primer32 for coding and non-coding regions of ALMS1 and GCS1 (primer sequences are available upon request). We used standard PCR-based sequencing reactions using Applied Biosystem’s Big Dye sequencing protocol on an ABI 3130 × l. Sequence data was assembled using Phred/Phrap (Ewing and Green, 1998; Ewing et al., 1998), and the alignments were inspected for accuracy with Consed (Gordon et al., 1998, 2001). Polymorphisms were identified with PolyPhred 4.0 (Bhangale et al., 2006). All polymorphic sites were manually verified and confirmed by sequencing the opposite strand.
Neutrality Tests and Coalescent Simulations
We calculated three standard neutrality tests of the site frequency spectrum: Tajima’s D (Tajima, 1989), Fu and Li’s F test (Fu and Li, 1993), and Fay and Wu’s H test (Fay and Wu, 2000). We used the non-human primate sequence to determine the ancestral allele for Fay and Wu’s H test. Initially, we determined statistical significance for each statistic from 104 coalescent simulations conditional on the number of segregating sites and sample size, assuming a standard neutral model with no recombination using the program ms (Hudson, 2002). In addition, we also performed 104 coalescent simulations for additional demographic models: (1) with recombination and conditional on the number of segregating sites and sample size (2) with recombination and conditional on the observed θW and sample size (3) simulations using previously inferred demographic parameters (Schaffner et al., 2005) that incorporate known features of human history such as population structure, bottlenecks, and expansions, along with recombination. An example command line argument of this more complex demographic model is:./ms 122 1 -s 4 -r 0.004 4000 -c 1.6 500 -I 3 38 42 42 -en 0.0005 1 0.24 -en 0.000875 2 0.077 -en 0.001 3 0.077 -en 0.001 2 0.0125 -en 0.001125 2 0.077 -ej 0.005 3 2 -en 0.00475 3 0.00373 -en 0.004875 3 0.077 -en 0.0085 2 0.00294 -en 0.008625 2 0.077 -ej 0.00875 2 1 -en 0.0075 1 0.03125 -en 0.007625 1 0.24 -en 0.0425 1 0.12.
To evaluate the probability of observing clusters of population specific FST as high or higher than those found in the 2p13 region under a neutral model in each of the HapMap samples, we performed 2 × 10⁴ coalescent simulations with the program ms (Hudson, 2002) using previously inferred demographic parameters (Schaffner et al., 2005). To mimic the ascertainment of these regions based on a high population specific FST (see main text), we only accepted simulations in which the population specific FST for at least one of the simulated African, European, or Asian samples for one or more SNPs was equal to or exceeded a value of 0.56, and we then counted how many of these simulations contained one or more population specific FST values that were equal to or exceeded a value of 0.45 in the other two samples. Note, this is very conservative as the observed maximum population specific FST values in the chromosome 2p13 region are 0.74, 0.68, and 0.92 in the CEU, ASN, and YRI samples, respectively. The lower stringency thresholds were chosen for computational efficiency (i.e., to increase the number of accepted replicates) and to be applicable to all of the regions described in Table 2, some of which had slightly lower maximum population specific FST values compared to the chromosome 2p13 region. The ms command line argument for the model used in these simulations is:
./ms 122 1 -t 2000 -r 1000 5000000 -c 1.6 500 -I 3 38 42 42 -en 0.0005 1 0.24 -en 0.000875 2 0.077 -en 0.001 3 0.077 -en 0.001 2 0.0125 -en 0.001125 2 0.077 -ej 0.005 3 2 -en 0.00475 3 0.00373 -en 0.004875 3 0.077 -en 0.0085 2 0.00294 -en 0.008625 2 0.077 -ej 0.00875 2 1 -en 0.0075 1 0.03125 -en 0.007625 1 0.24 -en 0.0425 1 0.12.
HGDP–CEPH Analysis
We used SNP data from the HGDP–CEPH samples (Li et al., 2008) and CONTML from the Phylip package (Felsenstein, 1989, 2005) to construct phylogenies rooted with chimpanzee data (UCSC). We coded each SNP within the three genes (SEC15L2, ALMS1, GCS1) as allele frequencies within each continental group and used the default (gene frequency) mode of CONTML to construct phylogenetic trees.
Genome-Wide Scan for Additional Clusters of Selection
We used the HapMap Phase II data (International HapMap Consortium, 2005) to search for additional putative clusters of adaptive evolution. Briefly, we segmented the autosomal data into non-overlapping 100 kb bins, calculated population specific FST for each sample (Shriver et al., 2004), and then asked how many non-overlapping 5 Mb regions in the genome included bins with all three population specific FST values (CEU, ASN, YRI) greater than or equal to that of the 2p13 regions (98.7th percentile).
In addition, we also analyzed gene density and average recombination rates per 5 Mb window. To accomplish this, we used the UCSC Genome Browser database (Rosenbloom et al., 2010) to compile a list of genes in each 5 Mb regions, and we used the HapMap recombination rates averaged over all samples for each 5 Mb region. We then performed a Mann–Whitney test to compare the gene density and recombination rate in the 20 regions of clustered and independent selective events with the rest of the autosomal genome.
Results
We used SNP data from the HapMap (International HapMap Consortium, 2005) and HGDP–CEPH samples (Li et al., 2008), sequence data from the SeattleSNPs3 project, and novel sequence data generated for this project to explore patterns of genetic variation at 2p13.3–2p13.1. Specifically, we studied population structure and levels of genetic variation, performed several standard tests of neutrality, and constructed phylogenies of the three regions in a worldwide sample. Our analysis identified three distinct signals of positive selection separated by two regions that exhibit no deviations from neutral expectations. Finally, we identified additional putative selective clusters of independent selective events through genome-wide analyses of the HapMap Phase II data.
Patterns of FST and Heterozygosity Reveal Three Distinct Regions at 2P13.3–2P13.1
Our previous analysis of population structure at ALMS1 revealed extreme levels of FST between African and non-African HapMap samples (Scheinfeldt et al., 2009). Here, we expand this analysis to include a 3-Mb region encompassing ALMS1. We analyzed SNP data from HapMap Phase II data among the following HapMap samples: Yoruba (YRI) individuals from Ibadan, Nigeria (n = 60), CEPH (CEU) individuals with ancestry from northern and western Europe (n = 60), Japanese (JPT) individuals from Tokyo, Japan (n = 45), and Han Chinese (CHB) individuals from Beijing, China (n = 45). In all of the analyses, we combined the JPT and CHB individuals into a single Asian sample (ASN). As displayed in Figure 1, there are three peaks of high FST in the region. The first peak (which encompasses SEC15L2) differentiates African and non-African HapMap samples, and displays extremely low heterozygosity in the ASN samples, consistent with a classic selective sweep. The second peak (which encompasses ALMS1) also differentiates African and non-African HapMap samples; however, there is only a modest decrease in heterozygosity, consistent with a model of selection acting on standing variation. And lastly, the third peak (which contains 19 refseq genes centered around GCS1) differentiates the CEU samples. Each of the peaks is separated by recombination hotspots suggesting individual evolutionary histories for each of the three peaks. For ease of presentation, we will refer to each of these peaks as region 1, 2, and 3 for the SEC15L2, ALMS1, and GCS1 peaks respectively below.
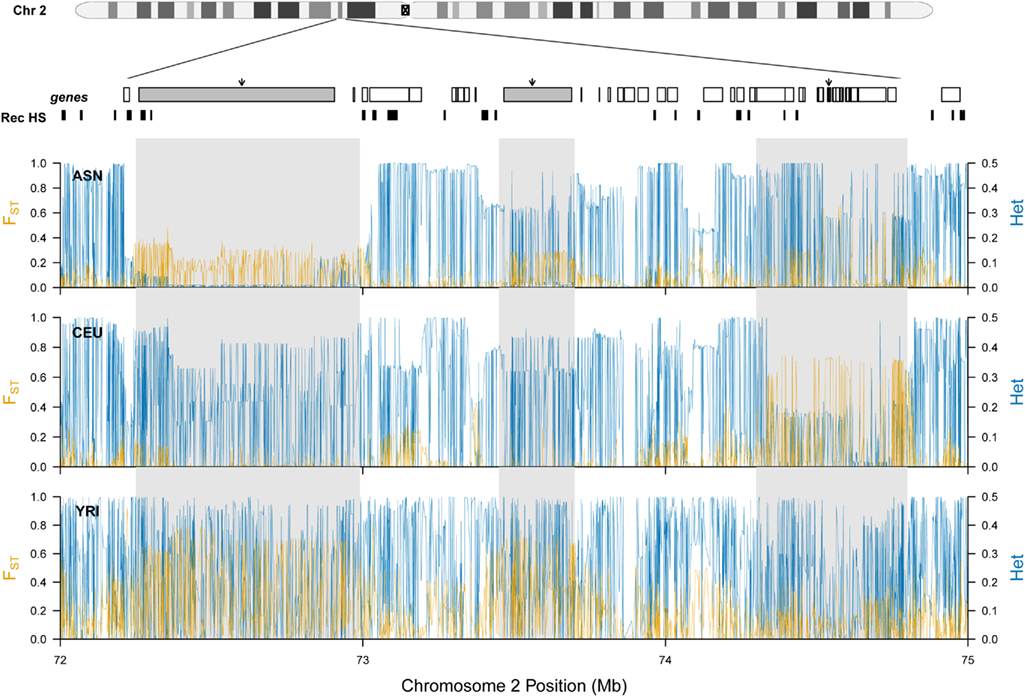
Figure 1. Patterns of population specific FST and heterozygosity at chromosome 2 (p13.3–p13.1). The location of each gene (going from left to right: SEC15L2, ALMS, GCS1) is marked by a gray rectangle and black arrow, and additional genes located in the region are shown as white rectangles. Previously inferred recombination hotspots are denoted by black rectangles. For each HapMap sample, population specific FST and heterozygosity are plotted individually in orange and blue respectively.
Neutrality Tests Support a Model of Three Independent Selective Events
Using sequence data from regions 1, 2, and 3 we performed three tests of positive selection on the genes central to each region (SEC15L2, ALMS1, GCS1): Tajima’s D (Tajima, 1989), Fu and Li’s D (Fu and Li, 1993), and Fay and Wu’s H (Fay and Wu, 2000; Table 1). Standard site frequency spectrum statistics support a model of positive selection for SEC15L2 in the Asian American Seattle SNPs samples (Tajima’s D, Fu and Li’s D, and Fay and Wu’s H tests, p < 0.008). Similarly, standard site frequency spectrum statistics support a model of positive selection at GCS1 in the CEPH (Fu and Li’s D, and Fay and Wu’s H tests, p < 0.05) and to a lesser extent in the Middle Eastern samples (Fu and Li’s D test, p < 0.05). While previous work demonstrates no deviation from neutral expectations at ALMS1, additional analyses support a model of positive selection from standing variation on ALMS1 (Scheinfeldt et al., 2009). Furthermore, analysis of the sequence located between regions 1 and 2 as well as the sequence located between regions 2 and 3 show no significant deviations from neutral expectations.
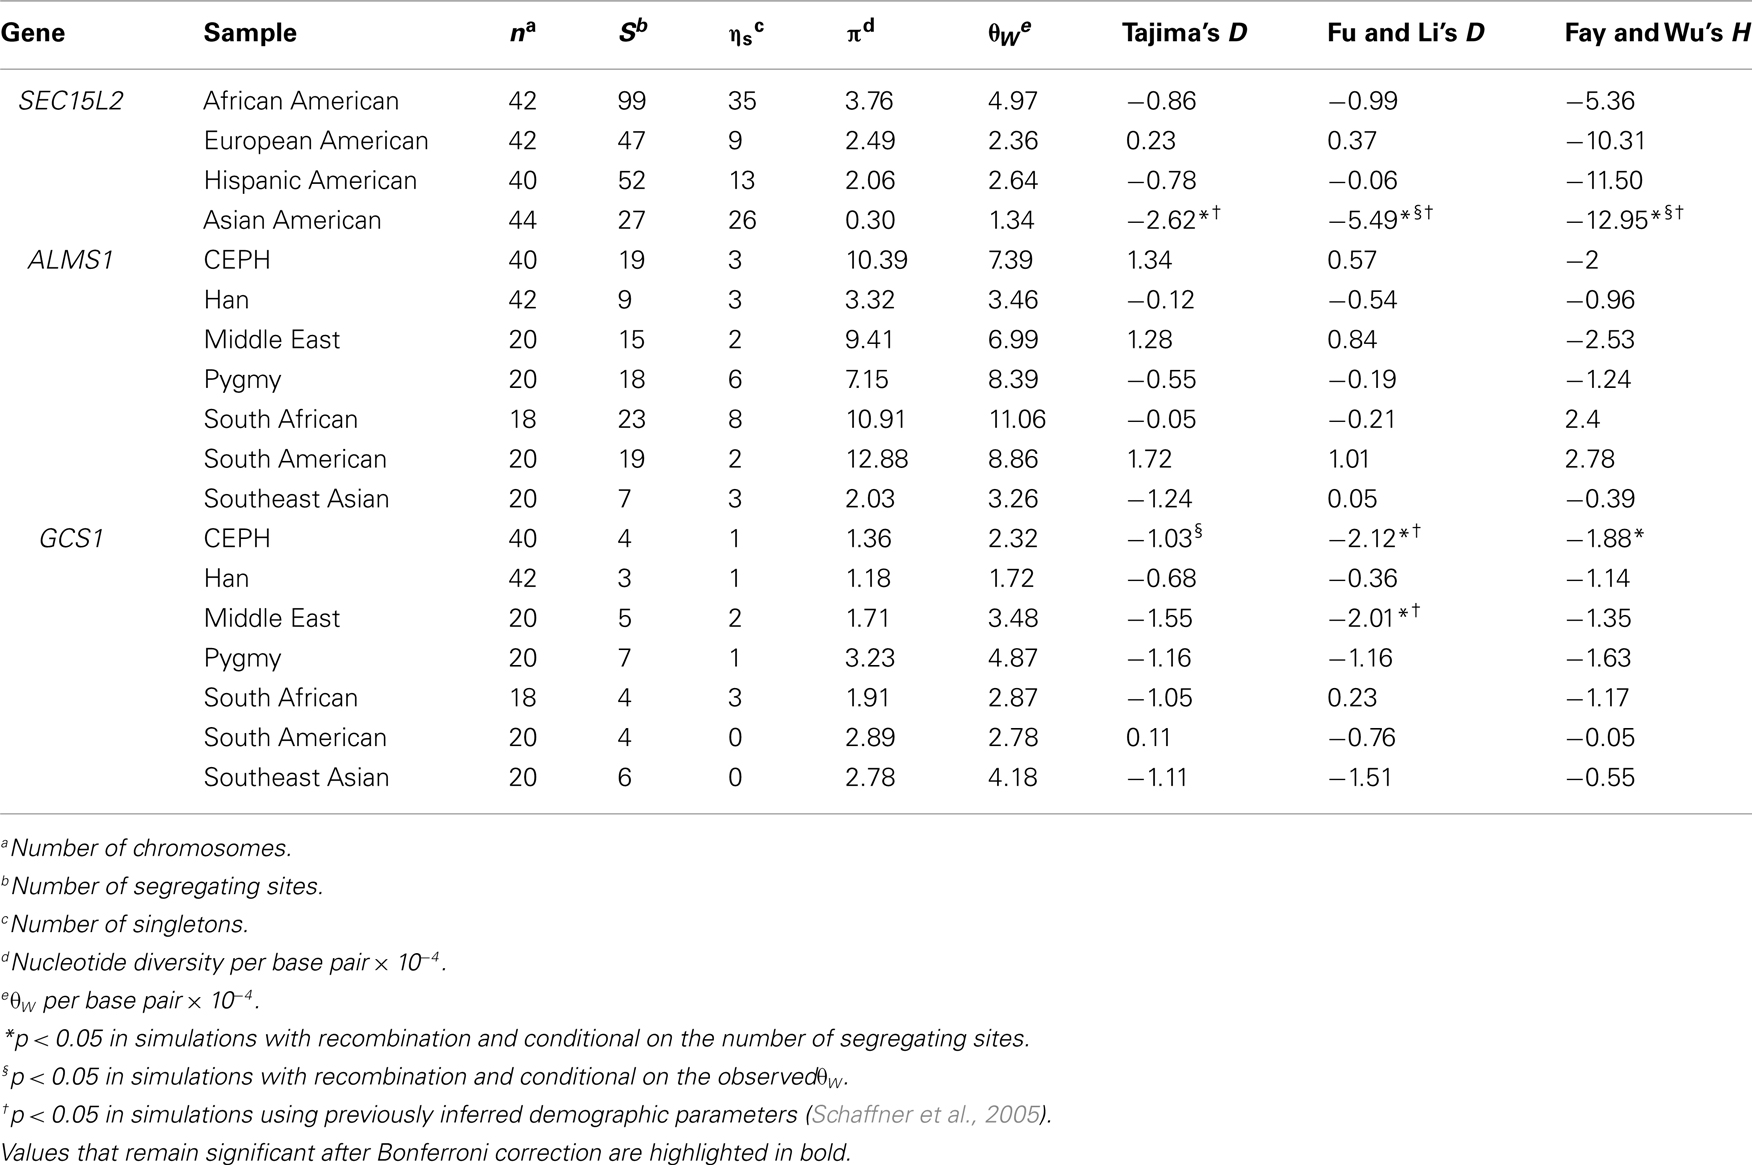
Table 1. Summary statistics of neutrality test statistics.
Distinct Patterns of Worldwide Variation at Each Peak
The geographic distribution of genetic variation across the SEC15L2, ALMS1, and GCS1 regions shows considerable heterogeneity. As shown in Figures 2–, the East Asian samples show the most dramatic changes in SEC15L2 and ALMS1 derived allele frequencies compared with other non-African samples. However, as we previously noted (Scheinfeldt et al., 2009), the geographic pattern of variation for ALMS1 in the American samples is peculiar and consistent with recent selection in East Asia roughly 15 kya, while the pattern of variation at SEC15L2 is more consistent with an older time of selection as both the American and Asian samples demonstrate high derived allele frequencies. The worldwide pattern of allele frequency variation at GCS1 is more difficult to reconcile with a simple model of selection in European samples, but is clearly distinct from the pattern at SEC15L2 and ALMS1.
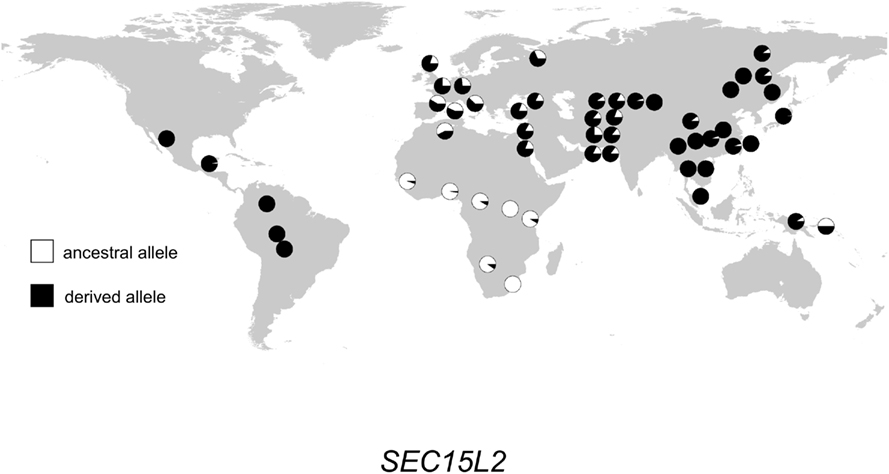
Figure 2. Distribution of SEC15L2 alleles in 52 populations. Haplogroup frequencies are indicated with pie charts. The ancestral allele is shown in white, and the derived allele is shown in black.
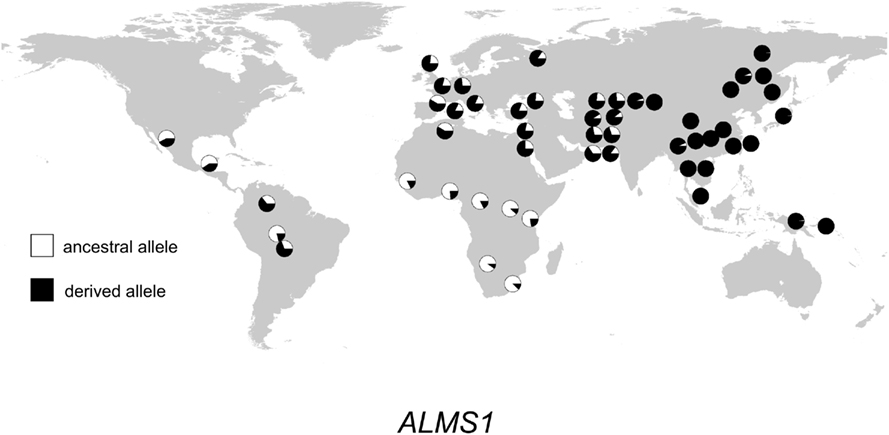
Figure 3. Distribution of ALMS1 alleles in 52 populations. Haplogroup frequencies are indicated with pie charts. The ancestral allele is shown in white, and the derived allele is shown in black.
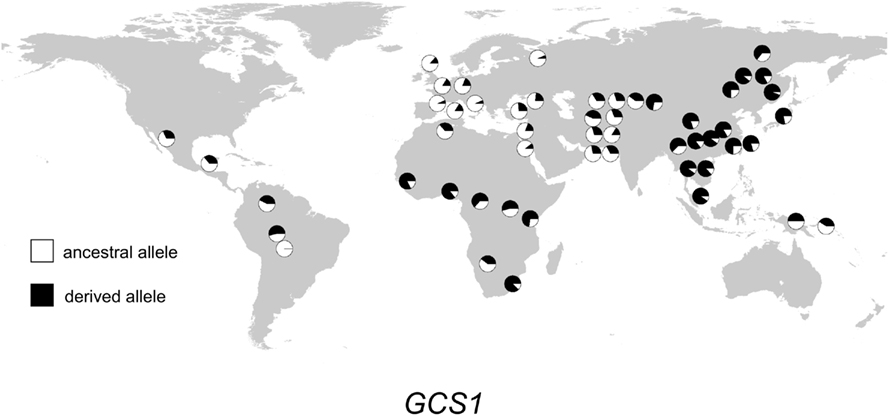
Figure 4. Distribution of GCS1 alleles in 52 populations. Haplogroup frequencies are indicated with pie charts. The ancestral allele is shown in white, and the derived allele is shown in black.
To better quantify patterns of variation shown in the allele frequency maps, we performed a phylogenetic analysis of HGDP allele frequency data. Specifically, we used CONTML (Felsenstein, 1989, 2005) to construct phylogenies for each of the three genes using SNP data from the HGDP–CEPH samples (Li et al., 2008). As shown in Figure 5, the continental groups cluster differently in each phylogeny. The SEC15L2 tree displays East Asia and America clustering together at the farthest distance from the chimpanzee outgroup. The ALMS1 tree shows East Asia and Oceania clustering together at the farthest distance from the chimpanzee outgroup. Finally, the GCS1 tree shows Europe and the Middle East clustering together at the farthest distance from the chimpanzee outgroup. The phylogenetic pattern is consistent with the neutrality test results implicating East Asia as the central location of selection for SEC15L2 and ALMS1 and Europe as the central location of selection for GCS1.
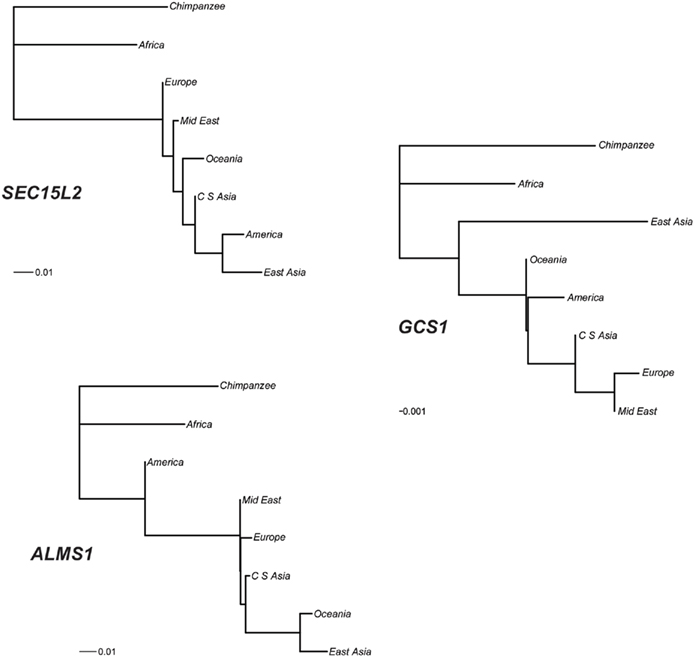
Figure 5. Phylogenetic relationships among seven continental groups. Maximum likelihood trees for each of the three genes are shown rooted with chimpanzee as the outgroup. The length of the scale bar corresponds to 1% of sites differing between haplotypes.
Genome-Wide Scan Identifies Additional Clusters of Positive Selection
We next tested whether the patterns of genetic variation at 2p13.3–2p13.1 were unique or if other regions of the genome exhibited similar evidence for clustering of independent selective events. Using the population specific FST thresholds (98.7th percentile) of the 2p13.3–2p13.1 region, we asked how many other 5 Mb regions of the HapMap Phase II data (International HapMap Consortium, 2005) possess highly differentiated population specific FST values for all three samples. Our scan (Table 2) identified 19 additional regions that met these criteria, suggesting that additional clusters of independent substrates of positive selection exist in the human genome. As expected, gene density is significantly higher (p = 0.024, Mann–Whitney test) in windows that exhibit evidence of independent signals of selection, which likely reflects the greater mutational target size of gene dense windows for selection to act on. Moreover, we tested whether the recombination rate was different between windows with and without evidence of clustered signals of selection and found no significant difference (p = 0.338; Mann–Whitney test). This result is consistent with the observation that although there is considerable heterogeneity of fine-scale recombination rates in humans, rates over Mb intervals are much more uniform (Meyers et al., 2005).
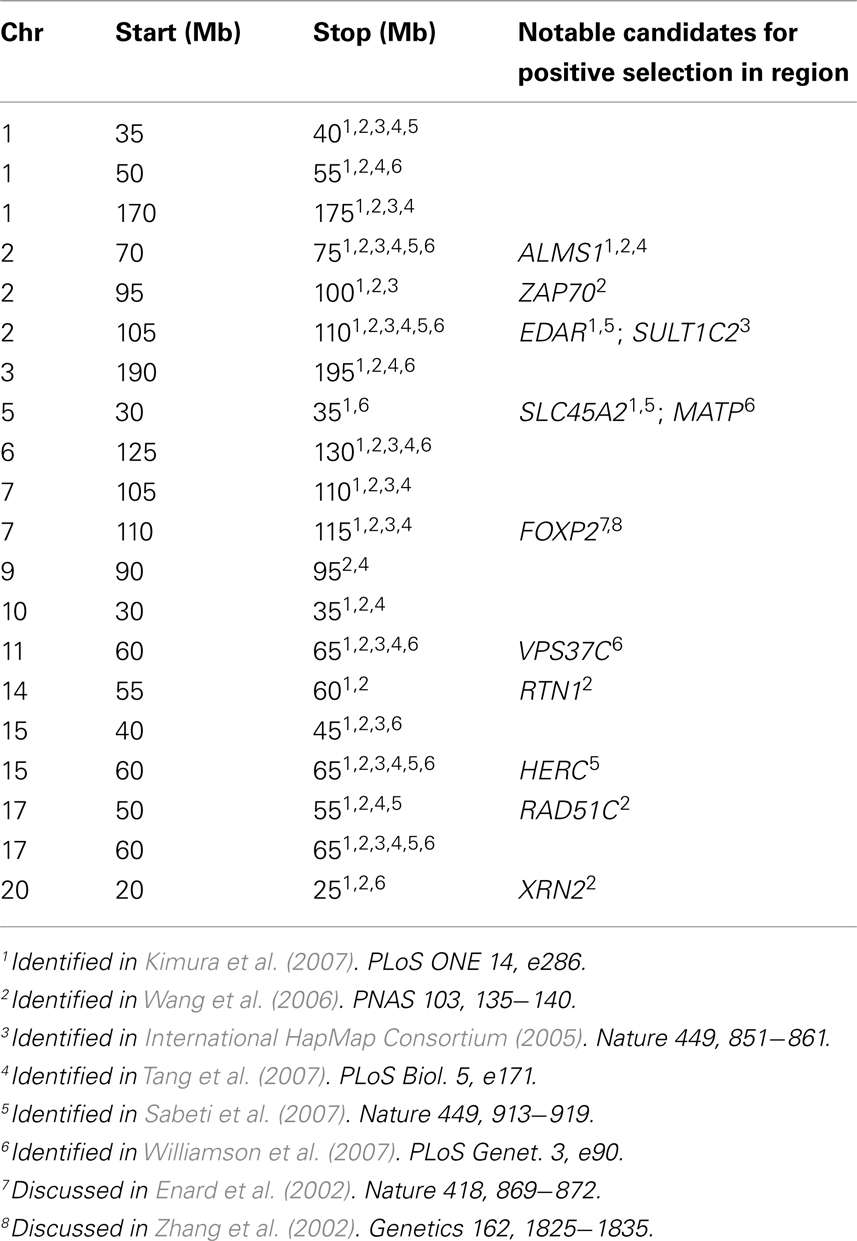
Table 2. Summary of additional candidate regions for adaptive hotspots.
To more rigorously evaluate the evidence that clustering of population specific FST in each HapMap sample is unusual under neutrality, we performed additional coalescent simulations (using the calibrated model of human demography from Schaffner et al., 2005) that takes into account the way in which these regions were ascertained. Specifically, we initially identified the chromosome 2p13.3–2p13.1 region by observing a high population specific FST value in the ASN sample and then asked if population specific FST values in the other two HapMap samples were unusually large. Thus, to recapitulate this process we used a rejection sampling algorithm to generate simulated regions that were 5 Mb in length (with recombination), and only accepted regions where one sample possessed a large population specific FST (see Materials and Methods). Next, we estimated the proportion of accepted replicates that had large population specific FST values in all samples. In practice, we used thresholds that were less stringent than that observed in the empirical data (see Materials and Methods) for computational efficiency. Out of 2 × 10⁴ simulations, 5,846 were accepted and even at this reduced level of stringency none exhibited large population specific FST values in all three samples, resulting in a conservative p-value of <0.0002. Thus, the observation of finding clusters of highly differentiated population specific FST values in each sample is very unusual under neutrality.
Discussion
What emerges from this analysis is a striking incidence of multiple, independent, and regionally restricted signals of positive selection in a 3-MB region on chromosome 2. Interestingly, we also identified 19 additional regions that possess similar patterns of genetic variation (Table 2) and thus may represent additional clusters of independent selective events. Included in this list are regions containing EDAR (see also Figure 6), SLC45A2, and FOXP2, all previously reported as strong candidates for recent positive selection (Enard et al., 2002; Zhang et al., 2002; Carlson et al., 2005; Kelley et al., 2006; Kimura et al., 2007; Sabeti et al., 2007). These previous analyses presented the candidates as single signals of positive selection; however, our analysis suggests that there were multiple events contributing to the signals identified through genome-wide scans for selection. For example, as displayed in Figure 6, all three HapMap samples display peaks in FST that are coincident with EDAR; however, the ASN and YRI samples each exhibit additional peaks upstream and downstream of EDAR, and these signals are separated by recombination hotspots. Thus, while previous discussion of the region has focused on EDAR (Kimura et al., 2007; Sabeti et al., 2007), our analysis indicates that this 5 Mb region contains additional substrates of positive selection.
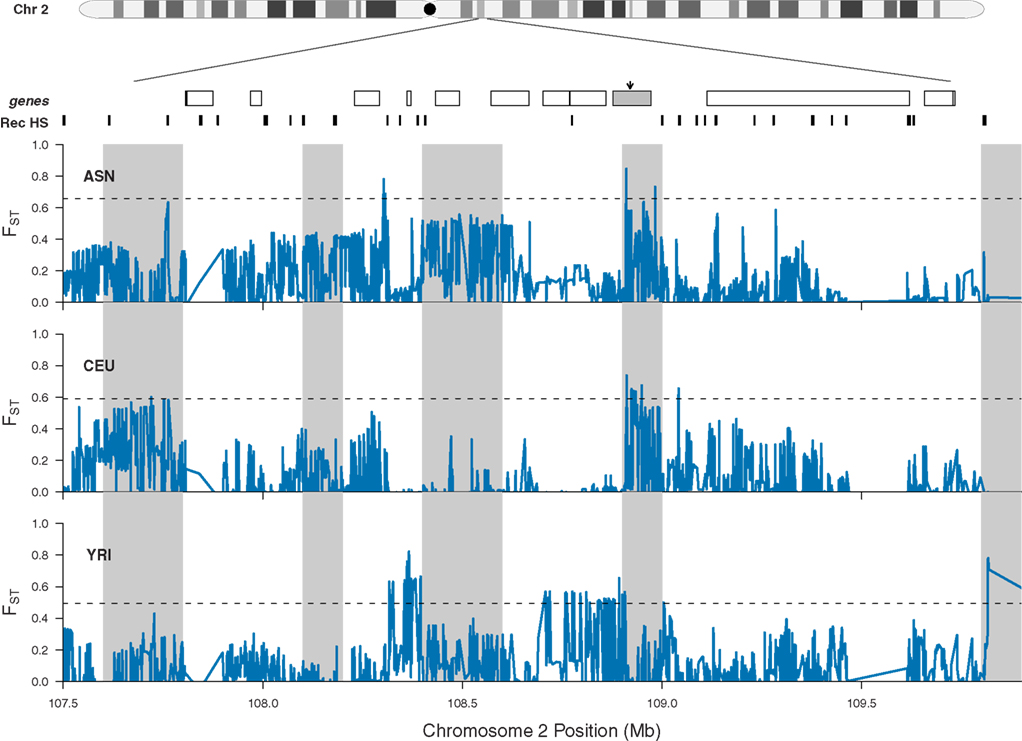
Figure 6. Patterns of population specific FST at chromosome 2 (q12.3–q13). The location of EDAR is marked by a gray rectangle and black arrow, and additional genes located in the region are shown as white rectangles. Previously inferred recombination hotspots are denoted by black rectangles. For each HapMap sample, population specific FST is plotted individually in blue, and the dashed line in each panel indicates the 99th percentile for each population specific FST. Gray shading indicates 100 kb windows with significantly elevated average values of population specific FST (note, the apparent width of some shaded regions vary because adjacent windows are significant).
It is interesting to consider why adaptive genetic variation might be clustered in some regions of the human genome. One hypothesis is that these regions simply possessed multiple adaptive mutations that selection was free to independently act on because of the local recombinational landscape. This idea is consistent with the observation that gene density is significantly higher in the 20 regions shown in Table 2, and for at least two of these regions (Figures 1 and 6) recombination hotspots occur between the three distinct patterns of population differentiation.
A second, non-mutually exclusive hypothesis is that clusters of independent adaptive alleles could be responding to the same selective pressure. To explore this idea, we investigated biological relationships among the genes in the 2p13.3–2p13.1 region. Interestingly, SNPs from both ALMS1 (rs7598660) and GCS1 (rs6758593) have previously been implicated in human association studies of insulin levels (Saxena et al., 2007; Scheinfeldt et al., 2009) and Type I diabetes (Wellcome Trust Case Control Consortium, 2007), respectively. Additionally, in mice SEC15L2 is present in a module of genes with strain-specific gene expression indicative of a role in liver metabolism (Keller et al., 2008). It is intriguing that all three loci have putative roles in metabolic phenotypes, and it is possible that a single selective pressure underlies the independent response to selection observed at these three loci; however, additional work is necessary to elucidate the exact function of these proteins and characterize the ways in which functional variation in the region affects phenotypic variation.
Moreover, it is important to note that even with a uniformly distributed advantageous mutation rate across the genome, clustering of independent selective events may occur depending on many parameters such as the time selective alleles arose, the mode of selection, and the timeframe over which a signature of selection persists. In this manuscript, we simply focused on how unusual clusters of independent selective events are under neutrality. In the future, it would also be of interest to evaluate how often clustering occurs in models incorporating selection, and what particular parameter values lead to clustering of independent selective events.
Our data clearly supports a model of non-neutral evolution at the chromosome 2p13 locus, as well as the additional 19 regions that exhibit patterns of variation similar to or more extreme than this region. However, some caution is warranted in the interpretation of multiple independent selective events because the dynamics of selection acting in the milieu of a complex demographic process could conceivably generate unexpected and difficult to predict patterns of genetic variation within and between populations. Although additional theoretical and simulation studies on the interaction of selection and demography over a range of selective models and demographic processes is important, the simplest explanation for the data presented in this paper is independent selective events in these 20 regions. Indeed, the observation of recombination hotspots coincident with changes in patterns of population differentiation (see Figures 1 and 6) and the incompatibility of highly differentiation clusters of population specific FST values in each HapMap samples under neutrality strongly suggests multiple and independent selective events.
In summary, while many recent scans of positive selection have resulted in extensive lists of candidate regions (Kelley et al., 2006; Voight et al., 2006; Wang et al., 2006; Zhang et al., 2006; Kimura et al., 2007; Sabeti et al., 2007; Tang et al., 2007), very little follow-up analysis has been reported. Here, we have focused on a region of chromosome 2p13 that contains three independent substrates of recent positive selection, and we have shown that additional clusters of independent selective events likely exist in the human genome. Our results demonstrate the importance of careful follow-up work to genome-wide scans for selection and offers a novel perspective on the organization of adaptive genetic variation in humans.
Conflict of Interest Statement
The authors declare that the research was conducted in the absence of any commercial or financial relationships that could be construed as a potential conflict of interest.
Acknowledgments
We thank members of the Joshua M. Akey lab for helpful discussions and comments on the manuscript. Funding: This work was supported by a research grant [1R01GM076036-01A1] from the National Institute of Health to Jennifer Madeoy; a Sloan Fellowship in Computational Biology to Jennifer Madeoy; and by a National Human Genome Research Institute Interdisciplinary Training in Genomic Sciences grant [HG00035] to Laura B. Scheinfeldt.
Footnotes
References
Akey, J. M. (2009). Constructing genomic maps of positive selection in humans: where do we go from here? Genome Res. 19, 711–722.
Bhangale, T. R., Stephens, M., and Nickerson, D. A. (2006). Automating resequencing-based detection of insertion-deletion polymorphisms. Nat. Genet. 38, 1457–1462.
Carlson, C. S., Thomas, D. J., Eberle, M. A., Swanson, J. E., Livingston, R. J., Rieder, M. J., and Nickerson, D. A. (2005). Genomic regions exhibiting positive selection identified from dense genotype data. Genome Res. 15, 1553–1565.
Enard, W., Przeworski, M., Fisher, S. E., Lai, C. S., Wiebe, V., Kitano, T., Monaco, A. P., and Paabo, S. (2002). Molecular evolution of FOXP2, a gene involved in speech and language. Nature 418, 869–872.
Ewing, B., and Green, P. (1998). Base-calling of automated sequencer traces using phred. II. Error probabilities. Genome Res. 8, 186–194.
Ewing, B., Hillier, L., Wendl, M. C., and Green, P. (1998). Base-calling of automated sequencer traces using phred. I. Accuracy assessment. Genome Res. 8, 175–185.
Fay, J. C., and Wu, C. I. (2000). Hitchhiking under positive Darwinian selection. Genetics 155, 1405–1413.
Felsenstein, J. (2005). PHYLIP (Phylogeny Inference Package) version 3.6. Distributed by the author.
Fu, Y. X., and Li, W. H. (1993). Statistical tests of neutrality of mutations. Genetics 133, 693–709.
Gordon, D., Abajian, C., and Green, P. (1998). Consed: a graphical tool for sequence finishing. Genome Res. 8, 195–202.
Gordon, D., Desmarais, C., and Green, P. (2001). Automated finishing with autofinish. Genome Res. 11, 614–625.
Hudson, R. R. (2002). Generating samples under a Wright-Fisher neutral model of genetic variation. Bioinformatics 18, 337–338.
International HapMap Consortium. (2005). A haplotype map of the human genome. Nature 437, 1299–1320.
Keller, M. P., Choi, Y., Wang, P., Davis, D. B., Rabaglia, M. E., Oler, A. T., Stapleton, D. S., Argmann, C., Schueler, K. L., Edwards, S., Steinberg, H. A., Chaibub Neto, E., Kleinhanz, R., Turner, S., Hellerstein, M. K., Schadt, E. E., Yandell, B. S., Kendziorski, C., and Attie, A. D. (2008). A gene expression network model of type 2 diabetes links cell cycle regulation in islets with diabetes susceptibility. Genome Res. 18, 706–716.
Kelley, J. L., Madeoy, J., Calhoun, J. C., Swanson, W., and Akey, J. M. (2006). Genomic signatures of positive selection in humans and the limits of outlier approaches. Genome Res. 16, 980–989.
Kimura, R., Fujimoto, A., Tokunaga, K., and Ohashi, J. (2007). A practical genome scan for population-specific strong selective sweeps that have reached fixation. PLoS ONE 2, e286. doi: 10.1371/journal.pone.0000286
Li, J. Z., Absher, D. M., Tang, H., Southwick, A. M., Casto, A. M., Ramachandran, S., Cann, H. M., Barsh, G. S., Feldman, M., Cavalli-Sforza, L. L., and Myers, R. M. (2008). Worldwide human relationships inferred from genome-wide patterns of variation. Science 319, 1100–1104.
Meyers, S., Bottolo, L., Freeman, C., McVean, G., and Donnelly, P. (2005). A fine-scale map of recombination rates and hotspots across the human genome. Science 310, 321–324.
Rosenbloom, K. R., Dreszer, T. R., Pheasant, M., Barber, G. P., Meyer, L. R., Pohl, A., Raney, B. J., Wang, T., Hinrichs, A. S., Zweig, A. S., Fujita, P. A., Learned, K., Rhead, B., Smith, K. E., Kuhn, R. M., Karolchik, D., Haussler, D., and Kent, W. J. (2010). ENCODE whole-genome data in the UCSC genome browser. Nucleic Acids Res. 38, D620–D625.
Sabeti, P. C., Varilly, P., Fry, B., Lohmueller, J., Hostetter, E., Cotsapas, C., Xie, X., Byrne, E. H., Mccarroll, S. A., Gaudet, R., Schaffner, S. F., Lander, E. S., International HapMap Consortium, Frazer, K. A., Ballinger, D. G., Cox, D. R., Hinds, D. A., Stuve, L. L., Gibbs, R. A., Belmont, J. W., Boudreau, A., Hardenbol, P., Leal, S. M., Pasternak, S., Wheeler, D. A., Willis, T. D., Yu, F., Yang, H., Zeng, C., Gao, Y., Hu, H., Hu, W., Li, C., Lin, W., Liu, S., Pan, H., Tang, X., Wang, J., Wang, W., Yu, J., Zhang, B., Zhang, Q., Zhao, H., Zhou, J., Gabriel, S. B., Barry, R., Blumenstiel, B., Camargo, A., Defelice, M., Faggart, M., Goyette, M., Gupta, S., Moore, J., Nguyen, H., Onofrio, R. C., Parkin, M., Roy, J., Stahl, E., Winchester, E., Ziaugra, L., Altshuler, D., Shen, Y., Yao, Z., Huang, W., Chu, X., He, Y., Jin, L., Liu, Y., Sun, W., Wang, H., Wang, Y., Xiong, X., Xu, L., Waye, M. M., Tsui, S. K., Xue, H., Wong, J. T., Galver, L. M., Fan, J. B., Gunderson, K., Murray, S. S., Oliphant, A. R., Chee, M. S., Montpetit, A., Chagnon, F., Ferretti, V., Leboeuf, M., Olivier, J. F., Phillips, M. S., Roumy, S., Sallee, C., Verner, A., Hudson, T. J., Kwok, P. Y., Cai, D., Koboldt, D. C., Miller, R. D., Pawlikowska, L., Taillon-Miller, P., Xiao, M., Tsui, L. C., Mak, W., Song, Y. Q., Tam, P. K., Nakamura, Y., Kawaguchi, T., Kitamoto, T., Morizono, T., Nagashima, A., Ohnishi, Y., Sekine, A., Tanaka, T., Tsunoda, T., Deloukas, P., Bird, C. P., Delgado, M., Dermitzakis, E. T., Gwilliam, R., Hunt, S., Morrison, J., Powell, D., Stranger, B. E., Whittaker, P., Bentley, D. R., Daly, M. J., de Bakker, P. I., Barrett, J., Chretien, Y. R., Maller, J., McCarroll, S., Patterson, N., Pe’er, I., Price, A., Purcell, S., Richter, D. J., Sabeti, P., Saxena, R., Schaffner, S. F., Sham, P. C., Varilly, P., Altshuler, D., Stein, L. D., Krishnan, L., Smith, A. V., Tello-Ruiz, M. K., Thorisson, G. A., Chakravarti, A., Chen, P. E., Cutler, D. J., Kashuk, C. S., Lin, S., Abecasis, G. R., Guan, W., Li, Y., Munro, H. M., Qin, Z. S., Thomas, D. J., McVean, G., Auton, A., Bottolo, L., Cardin, N., Eyheramendy, S., Freeman, C., Marchini, J., Myers, S., Spencer, C., Stephens, M., Donnelly, P., Cardon, L. R., Clarke, G., Evans, D. M., Morris, A. P., Weir, B. S., Tsunoda, T., Johnson, T. A., Mullikin, J. C., Sherry, S. T., Feolo, M., Skol, A., Zhang, H., Zeng, C., Zhao, H., Matsuda, I., Fukushima, Y., Macer, D. R., Suda, E., Rotimi, C. N., Adebamowo, C. A., Ajayi, I., Aniagwu, T., Marshall, P. A., Nkwodimmah, C., Royal, C. D., Leppert, M. F., Dixon, M., Peiffer, A., Qiu, R., Kent, A., Kato, K., Niikawa, N., Adewole, I. F., Knoppers, B. M., Foster, M. W., Clayton, E. W., Watkin, J., Gibbs, R. A., Belmont, J. W., Muzny, D., Nazareth, L., Sodergren, E., Weinstock, G. M., Wheeler, D. A., Yakub, I., Gabriel, S. B., Onofrio, R. C., Richter, D. J., Ziaugra, L., Birren, B. W., Daly, M. J., Altshuler, D., Wilson, R. K., Fulton, L. L., Rogers, J., Burton, J., Carter, N. P., Clee, C. M., Griffiths, M., Jones, M. C., McLay, K., Plumb, R. W., Ross, M. T., Sims, S. K., Willey, D. L., Chen, Z., Han, H., Kang, L., Godbout, M., Wallenburg, J. C., L’Archevêque, P., Bellemare, G., Saeki, K., Wang, H., An, D., Fu, H., Li, Q., Wang, Z., Wang, R., Holden, A. L., Brooks, L. D., McEwen, J. E., Guyer, M. S., Wang, V. O., Peterson, J. L., Shi, M., Spiegel, J., Sung, L. M., Zacharia, L. F., Collins, F. S., Kennedy, K., Jamieson, R., and Stewart, J. (2007). Genome-wide detection and characterization of positive selection in human populations. Nature 449, 913–918.
Saxena, R., Voight, B. F., Lyssenko, V., Burtt, N. P., De Bakker, P. I., Chen, H., Roix, J. J., Kathiresan, S., Hirschhorn, J. N., Daly, M. J., Hughes, T. E., Groop, L., Altshuler, D., Almgren, P., Florez, J. C., Meyer, J., Ardlie, K., Bengtsson Bostrom, K., Isomaa, B., Lettre, G., Lindblad, U., Lyon, H. N., Melander, O., Newton-Cheh, C., Nilsson, P., Orho-Melander, M., Rastam, L., Speliotes, E. K., Taskinen, M. R., Tuomi, T., Guiducci, C., Berglund, A., Carlson, J., Gianniny, L., Hackett, R., Hall, L., Holmkvist, J., Laurila, E., Sjogren, M., Sterner, M., Surti, A., Svensson, M., Tewhey, R., Blumenstiel, B., Parkin, M., Defelice, M., Barry, R., Brodeur, W., Camarata, J., Chia, N., Fava, M., Gibbons, J., Handsaker, B., Healy, C., Nguyen, K., Gates, C., Sougnez, C., Gage, D., Nizzari, M., Gabriel, S. B., Chirn, G. W., Ma, Q., Parikh, H., Richardson, D., Ricke, D., and Purcell, S. (2007). Genome-wide association analysis identifies loci for type 2 diabetes and triglyceride levels. Science 316, 1331–1336.
Schaffner, S. F., Foo, C., Gabriel, S., Reich, D., Daly, M. J., and Altshuler, D. (2005). Calibrating a coalescent simulation of human genome sequence variation. Genome Res. 15, 1576–1583.
Scheinfeldt, L. B., Biswas, S., Madeoy, J., Connelly, C. F., Schadt, E. E., and Akey, J. M. (2009). Population genomics analysis of ALMS1 in humans reveals a surprisingly complex evolutionary history. Mol. Biol. Evol. 26, 1357–1367.
Shriver, M. D., Kennedy, G. C., Parra, E. J., Lawson, H. A., Sonpar, V., Huang, J., Akey, J. M., and Jones, K. W. (2004). The genomic distribution of population substructure in four populations using 8,525 autosomal SNPs. Hum. Genomics 1, 274–286.
Tajima, F. (1989). Statistical method for testing the neutral mutation hypothesis by DNA polymorphism. Genetics 123, 585–595.
Tang, K., Thornton, K. R., and Stoneking, M. (2007). A New Approach for using genome scans to detect recent positive selection in the human genome. PLoS Biol. 5, e171. doi: 10.1371/journal.pbio.0050171
Voight, B. F., Kudaravalli, S., Wen, X., and Pritchard, J. K. (2006). A map of recent positive selection in the human genome. PLoS Biol. 4, e72. doi: 10.1371/journal.pbio.0040072
Wang, E. T., Kodama, G., Baldi, P., and Moyzis, R. K. (2006). Global landscape of recent inferred Darwinian selection for Homo sapiens. Proc. Natl. Acad. Sci. U.S.A. 103, 135–140.
Wellcome Trust Case Control Consortium. (2007). Genome-wide association study of 14,000 cases of seven common diseases and 3,000 shared controls. Nature 447, 661–678.
Williamson, S. H., Hubisz, M. J., Clark, A. G., Payseur, B. A., Bustamante, C. D., and Nielsen, R. (2007). Localizing recent adaptive evolution in the human genome. PLoS Genet. 3, e90. doi: 10.1371/journal.pgen.0030090
Zhang, C., Bailey, D. K., Awad, T., Liu, G., Xing, G., Cao, M., Valmeekam, V., Retief, J., Matsuzaki, H., Taub, M., Seielstad, M., and Kennedy, G. C. (2006). A whole genome long-range haplotype (WGLRH) test for detecting imprints of positive selection in human populations. Bioinformatics 22, 2122–2128.
Keywords: clustered adaptive events
Citation: Scheinfeldt LB, Biswas S, Madeoy J, Connelly CF and Akey JM (2011) Clusters of adaptive evolution in the human genome. Front. Gene. 2:50. doi: 10.3389/fgene.2011.00050
Received: 22 May 2011; Accepted: 19 July 2011;
Published online: 09 September 2011.
Edited by:
Jeffrey Jensen, École Polytechnique Fédérale de Lausanne, SwitzerlandReviewed by:
Pavlos Pavlidis, Heidelberg Institute of Theoretical Studies, GermanyRyan Gutenkunst, University of Arizona, USA
Kirk Lohmueller, University of California Berkeley, USA
Copyright: © 2011 Scheinfeldt, Biswas, Madeoy, Connelly and Akey. This is an open-access article subject to a non-exclusive license between the authors and Frontiers Media SA, which permits use, distribution and reproduction in other forums, provided the original authors and source are credited and other Frontiers conditions are complied with.
*Correspondence: Joshua M. Akey, Department of Genome Sciences, University of Washington, Foege Building, S303, Seattle, WA 98195-7730, USA. e-mail: akeyj@u.washington.edu