 Wanfei Liu1,2† Yuhui Zhao1,2† Peng Cui1,3† Qiang Lin1,2 Feng Ding1,3 Chengqi Xin1,2 Xinyu Tan1 Shuhui Song1* Jun Yu1* Songnian Hu1*
- 1 CAS Key Laboratory of Genome Sciences and Information, Beijing Institute of Genomics, Chinese Academy of Sciences, Beijing, China
- 2 Graduate University of Chinese Academy of Sciences, Beijing, China
- 3 Department of Pharmacology and Toxicology, Medical College of Wisconsin, Milwaukee, WI, USA
The high-throughput next-generation sequencing technologies provide an excellent opportunity for the detection of less-abundance transcripts that may not be identifiable by previously available techniques. Here, we report a discovery of thousands of novel transcripts (mostly non-coding RNAs) that are expressed in mouse cerebrum, testis, and embryonic stem (ES) cells, through an in-depth analysis of rmRNA-seq data. These transcripts show significant associations with transcriptional start and elongation signals. At the upstream of these transcripts we observed significant enrichment of histone marks (histone H3 lysine 4 trimethylation, H3K4me3), RNAPII binding sites, and cap analysis of gene expression tags that mark transcriptional start sites. Along the length of these transcripts, we also observed enrichment of histone H3 lysine 36 trimethylation (H3K36me3). Moreover, these transcripts show strong purifying selection in their genomic loci, exonic sequences, and promoter regions, implying functional constraints on the evolution of these transcripts. These results define a collection of novel transcripts in the mouse genome and indicate their potential functions in the mouse tissues and cells.
Introduction
The mammalian transcriptomes are much more complex than what we have been anticipated according to the related research activities over the past decade. Recently, novel transcripts have been continuously identified in mammalian genomes. Bertone et al. (2004) found 10,595 novel transcribed sequences in human liver tissue. Carninci et al. (2005) demonstrated that the majority of the mammalian genome is transcribed and reported 16,247 new mouse protein-coding transcripts. The ENCODE pilot project reported that the human genome is pervasively transcribed and discovered the relationship between transcripts and chromatin accessibility features (Birney et al., 2007). According to the chromatin-state maps, about 1,600 large multi-exonic RNAs were identified by Guttman et al. (2009) in mouse. Cabili et al. (2011) presented an integrative approach and defined >8,000 human lincRNAs. Trapnell et al. (2010) got 3,724 previously un-annotated transcripts in mouse and 62% of them were supported by independent expression data or homologous genes in other species. These novel transcripts are called the “dark matter” RNAs, which include any RNAs whose functions are still unknown (Kapranov et al., 2010). Kapranov et al. (2010) concluded that the “dark matter” RNA can be greater than protein-encoding transcripts and a large number of long non-coding RNA reside in intergenic regions.
However, controversial opinions still exist. It has been suggested that most novel transcribed regions are associated with known neighboring gene models. For example, by mapping and quantifying mouse transcriptome using poly(A) selected RNA-seq data, 92% of novel transcription regions can be assigned to their neighboring genes in a recent study (Mortazavi et al., 2008). van Bakel et al. (2010) also concluded that most non-exonic transcribed sequence fragments (seqfrags) probably are indeed partial fragments of pre-mRNA with introns, new exons of known genes in intergenic sequences, or promoter- and terminator-associated transcripts. Clark et al. (2011) and van Bakel et al. (2011) have discussed possible mechanisms of the pervasive transcription and some of the arguments are focused on universality and functionality of these novel transcripts (Jarvis and Robertson, 2011). In addition, studies have suggested that non-coding RNAs are important in transcriptional and post-transcriptional regulations, chromatin-modification, development and diseases, such as cancers (Gupta et al., 2010; Mattick et al., 2010; Glass et al., 2011; Kogo et al., 2011) and indeed fundamental to eukaryotic evolution (Mattick, 2010).
Recently, RNA-seq methods, mRNA-based, or ribo-minus (rm) based on the next-generation sequencing technologies, are considered to be more accurate and comprehensive for transcriptome profiling (Wang et al., 2009). They are supreme over other transcriptomic methods, including expressed sequence tag (EST), serial analysis of gene expression (SAGE), and microarray, in dynamic range, sampling depth, and material processing. The methods allow researchers to acquire adequate amount of data to characterize novel transcripts, and moreover, when combined with other complementary data, such as those from cap analysis of gene expression (CAGE), histone modification, and RNAPII, as well as sequence conservation analysis, they provide stronger evidence for identifying novel transcription.
In this study, we used publicly available rmRNA-seq data from the mouse cerebrum, testis, and embryonic stem (ES) cells to excavate new transcripts and verify their existence in the mouse genome, with an anticipation that rmRNA-seq data are expected to contribute more coding and non-coding transcripts, which lack polyA tails (Cui et al., 2010). We built a pipeline to identify expressed regions and candidate exons in the entire genome to define novel transcripts through comparison to known transcripts and carried out a combined analysis on relevant public data, including CAGE (Kawaji et al., 2006), histone modifications (H3K4me3, H3K27me3, and H3K36me3) and RNAPII (Mikkelsen et al., 2007), and sequence conservation values (Fujita et al., 2011). We also examined potential functions of these novel transcripts according to their sequence structures and characteristics. We expect to provide useful insights into the “dark matter” of the mouse genome.
Materials and Methods
Datasets
The transcriptome profiling of mouse cerebrum, testis, and ES cells, as well as data for histone modifications (H3K4me3 and H3K27me3) of mouse cerebrum and testis were from NCBI SRA database, SRA039962 and SRX005943, which were produced by our group previously. We also retrieved ChIP-seq data of RNAPII, H3K4me3, H3K27me3, and H3K36me3 from mouse ES cells1 (Mikkelsen et al., 2007) and 5′ CAGE tags from multiple mouse tissues published by the Fantom3 project2 (Kawaji et al., 2006). In addition, we obtained conservation scores from the UCSC database3 (Fujita et al., 2011).
Exon or Transcription Unit (TU) Identification Based on rmRNA-seq Data
We built an efficient pipeline for TU identification (Figure A1 in Appendix; File S3 in Supplementary Material). First, RNA sequencing reads were mapped to the mouse genome assembly (mm9) by using TopHat (Langmead et al., 2009; Trapnell et al., 2009) and the coverage files were created based on mapping results by using a custom-designed perl script. Second, according to the coverage files, we obtained average coverage of all Refgene introns and set a cutoff value of the coverage to exclude 95% of introns (3, 4, and 7 for cerebrum, ES cells, and testis, respectively). To define the expressed regions, we limited each region to have at least 55-bp consecutive length and all these positions must be equal or above the cutoff value. If the distance of adjacent expressed regions (exons) is equal or smaller than the length of 95 bp (95% intron lengths are larger than 95 bp), we combined the adjacent expressed regions into one. We also revised the boundaries of exons using the split read feature from TopHat. Third, we evaluated the accuracy of exon identification, calculated the average coverage for exons defined in Refgene introns and removed exons whose coverage below the cutoff value. Fourth, we annotated and removed certain exons by comparing our putative exons with several databases (UCSC, ENSEMBL, NONCODE, RNAdb, fRNAdb, Rfam, miRBase, tRNAdb, and ncRNAdb). Fifth, we constructed TUs for exons found in intergenic regions according to the distance between exons, RNAPII signals, and H3K36me3 signals. Sixth, to assess the accuracy of this method, we compared our TUs (by using all exons in intergenic regions) with the Fantom3 RNAs.
Identification of Enriched Intervals of ChIP-seq Data
We defined H3K4me3- and H3K27me3-enriched intervals by using SICER program (v1.03; Zang et al., 2009). The parameters were set as follows: (1) 200-bp window, 200-bp gap, and 0.001 for False Discovery Rate of H3K4me3; (2) 200-bp window, 600-bp gap, and 0.001 for False Discovery Rate of H3K27me3. The sequencing reads from a pan-H3 experiment was used as a background control for H3K4me3 and H3K27me3. The H3K36me3 and RNAPII enrichment intervals were downloaded from the website at the Broad Institute (see text footnote 1; Mikkelsen et al., 2007). Chromatin states of exons or TUs were determined based on overlapping regions where H3K4me3, H3K27me3, H3K36me3, and RNAPII are all enriched.
Conservation of Exons, TUs, and Their Promoters
To estimate sequence conservation of exons, TUs, and their promoters, we used conservation scores derived from an alignment of 29-vertebrate-to-mouse genomes from the UCSC database (Fujita et al., 2011). We calculated the conservation score in a 12-bp sliding window with a step length of 1 bp and selected the maximal value as the conservation score. The sequences that have higher conservation scores are more conservative than other sequences.
Correlation between Sense and Antisense Gene Expression
We extracted the information for sense–antisense gene pairs and calculated the RPKM value for the sense and antisense genes based on mapping results. We subsequently divided the sense–antisense gene pairs into two portions according to their expression ratios between two samples for the sense and antisense expression. The expression ratio is equal to the sample 2 expression divided by the sample 1 expression. We classified them as positive if the log10 value of both sense and antisense expression ratios are greater or less than zero. Otherwise, we classified them as negative. We correlated the positive and negative types of sense–antisense gene pairs using the expression ratio.
Results
Identification of Actively Transcribed Regions (Exons)
We obtained rmRNA-seq data from the mouse cerebrum, testis, and ES cells which were generated based on the SOLiD sequencing platforms using a strand-specific rmRNA-seq method (Cui et al., 2010), and mapped rmRNA-seq reads onto the mouse genome assembly (mm9) using TopHat software (Table A1 in Appendix). Based on the mapped reads, we assessed sequencing saturation according to the increase of read start-points with increasing mapped read (Figure 1). To define actively transcribed regions, we calculated the coverage per nucleotide position and used those positions whose coverage values are equal or larger than the cutoff values (3, 4, and 7 for cerebrum, ES cells, and testis, respectively; also see Materials and Methods for details; Figure 2A). Moreover, due to sequencing bias, we required that each region to have at least 55 bp consecutive sequence above the cutoff value of coverage and the distance of adjacent regions is larger than 95bp (Figures 2C,B). Consequently, we obtained 395,546, 465,149, and 194,996 putative exons in the total in the three libraries, respectively (Table 1; File S1 in Supplementary Material). For assessing the accuracy of exon identification, we compared the defined actively transcribed regions to Refgene exons (Karolchik et al., 2004), and found that most Refgene exons (∼94.12%) have been identified and that the aligned length is up to ∼88.71%. Furthermore, ∼93.81% RefSeq-defined exons are shown to be one-to-one matches (Table A2 in Appendix). These statistics proved the viability of our pipeline for this analysis. Moreover, we found that different samples have different percentages of reads assembled into exons (Table A3 in Appendix). We believe that such variability is related to read length, read coverage, and the cutoff value of the read coverage.
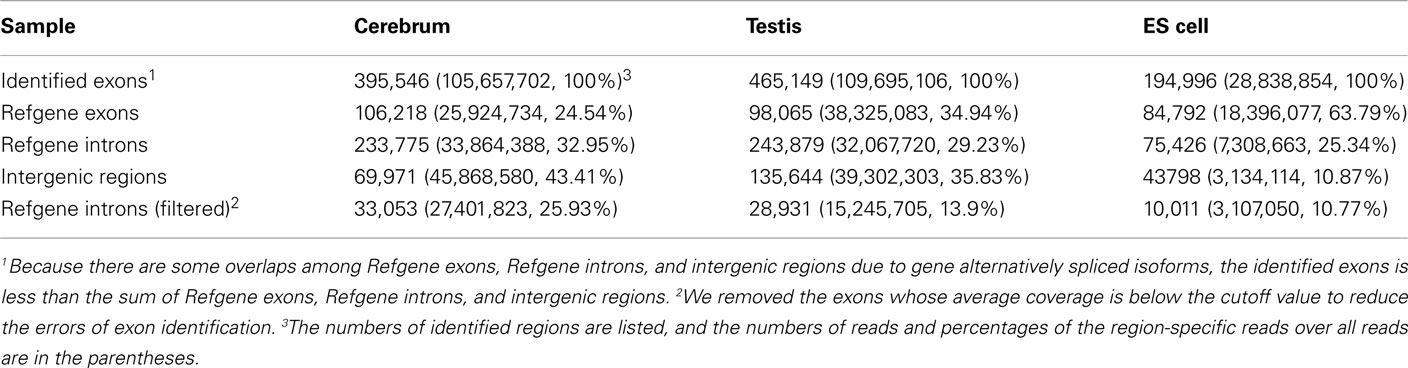
Table 1. Summary of novel exons identified in our analysis.
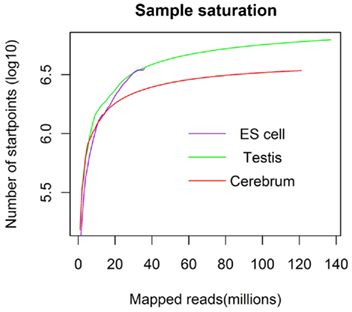
Figure 1. The saturation curve for the number of start-points of mapped reads. x-Axis shows the number of the mapped reads and y-axis displays the start-points number (million) of mapped reads.
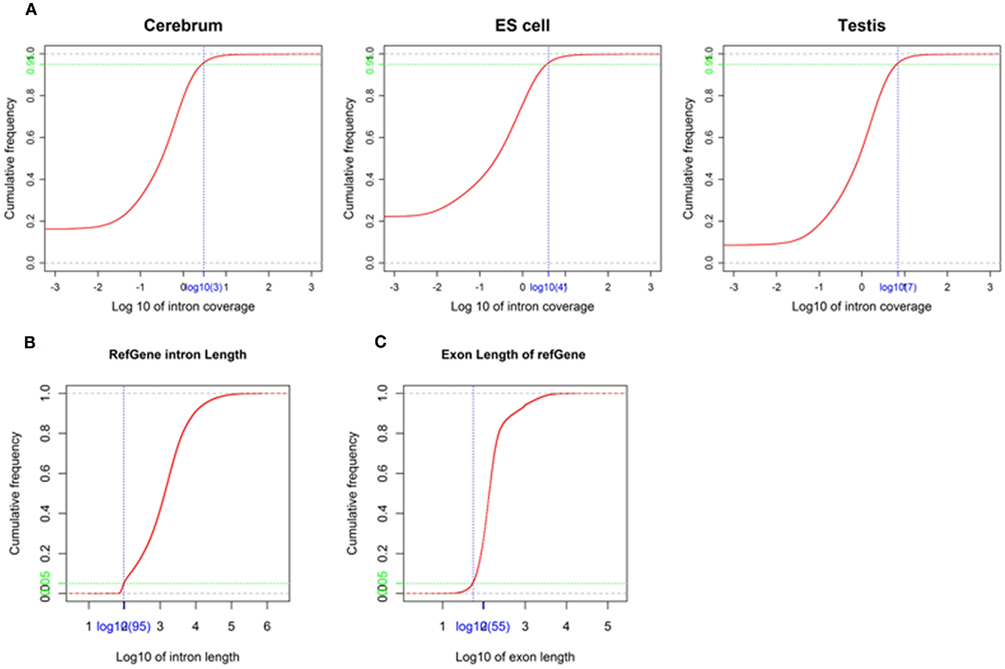
Figure 2. Parameters used in exon identification. (A) The cutoff value of coverage in the mouse cerebrum, testis, and ES cells. The cutoff value (blue) of coverage (3, 4, and 7 for cerebrum, ES cells, and testis, respectively) is labeled on the x-axis and the corresponding accumulative frequency (0.95, colored in green) is labeled on the y-axis. (B) The minimal intron length used in exon identification. The value (blue) on x-axis is identified as minimal intron length (95) and the value (green) on y-axis is the corresponding accumulative frequency (0.05). (C) The minimal exon length used in exon identification. The value (blue) on the x-axis is identified as minimal exon length (55) and the value (green) on the y-axis is the corresponding accumulative frequency (0.05).
Annotation of Novel Exons
To annotate novel transcripts, we first removed known exons according to the Refgene collection. We then removed all other known exons that have matches to other databases, such as the NCBI nr database (Johnson et al., 2008) based on sequence alignment using the BLAST software packages. The repeat regions of the mouse genome were avoided according to the repeat annotation at UCSC (Fujita et al., 2011). We also built a custom-designed ncRNA database through integrating several databases that include mouse ncRNA data in ENSEMBL (Flicek et al., 2011), UCSC (Fujita et al., 2011), NONCODE (He et al., 2008), RNAdb (Pang et al., 2007), fRNAdb (Kin et al., 2007), ncRNAdb (Szymanski et al., 2007), Rfam (Griffiths-Jones et al., 2005), miRBase (Griffiths-Jones et al., 2006), and tRNAdb (Juhling et al., 2009; Table A4 in Appendix). Moreover, we filtered the newly identified exons of known genes using the split reads from the TopHat result. We also predicted the function of novel exons (unannotated) by comparing them to the Rfam database. Most Rfam-predicted exons are snoRNAs, but some are miRNAs, tRNAs, and snRNAs. Finally, we obtained three sets of putative novel exons (Table 2).
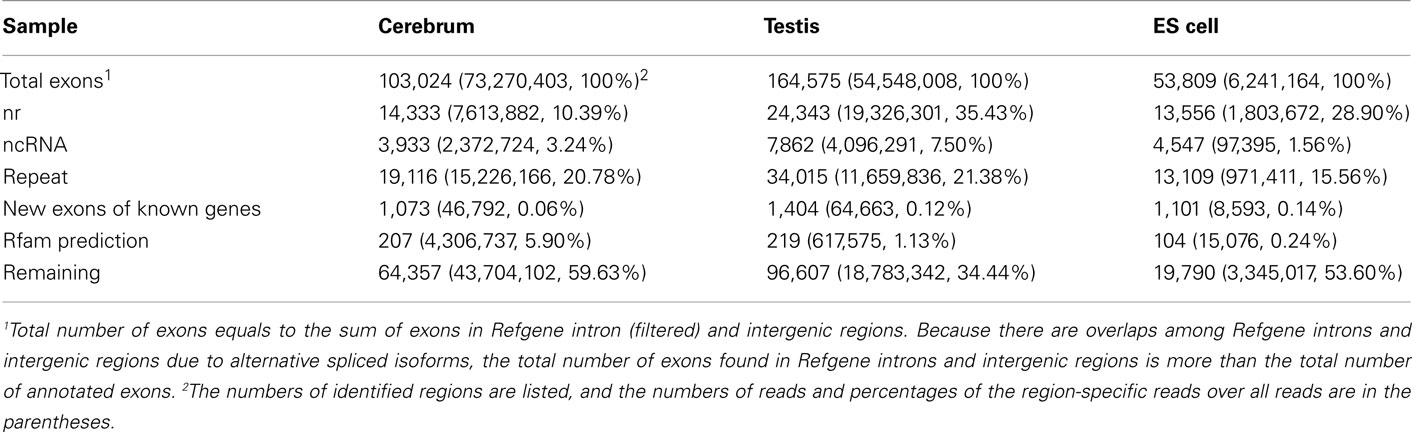
Table 2. The exon annotation based on Refgene intron (filtered) and intergenic regions.
Building Novel Transcription Units (TU) in Intergenic Region
Since well-defined actively transcribed regions exhibit obvious gene structure features, we tried to connect the neighboring active regions into the same transcription units (TUs). When we calculated the distance of adjacent actively transcribed regions, we found that there are two main peaks in the density plots and this feature can be used for building novel TUs (Figure 3). In addition, there is a small peak appeared around 100 bp in length, which is a characteristic of the minimal intron (∼100 bp in length) described in our previous publications (such as Zhu et al., 2010). The first major peak represents the distance of adjacent exons inside TUs and the second major peak is related to the distance of exons between adjacent TUs. Moreover, we downloaded the RNAPII and H3K36me3 data of ES cell, which were used to define the transcription start and the elongation of the transcripts, respectively. We finally constructed TUs for novel exons in intergenic regions according to the information from the distance between exons, RNAPII signals, and H3K36me3 signals, producing 17,931, 18,512, and 6,966 annotated TUs in cerebrum, testis, and ES cells, respectively (File S2 in Supplementary Material).
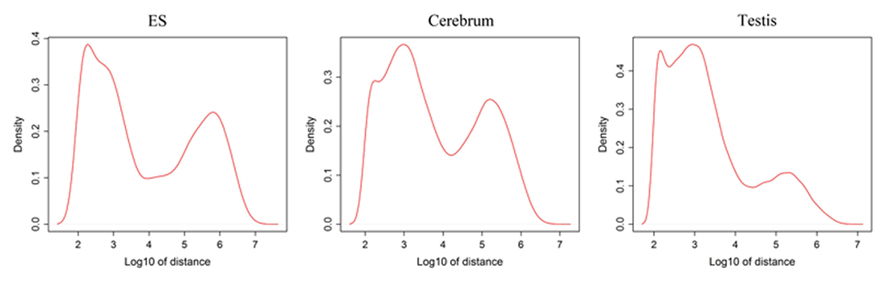
Figure 3. Density distribution for distances between adjacent exons in intergenic regions. x-Axis shows the distance between adjacent exons and y-axis displays the density. There is a small peak appeared around 100 bp length and this peak implies the minimal introns. In addition, the first main peak represents the distance of general adjacent exons inside TUs and the second main peak is related to the distance of exons between adjacent TUs.
To evaluate our processing algorithm, we compared our TUs with the intergenic RNAs annotated by the Fantom3 project. As expected, the one-to-one matching rate is about 95.62%, but the aligned length is a little bit lower, ∼70.99% (Table A5 in Appendix). The reason why the aligned length is not as high as the matching rate is that we may lose some exonic sequences due to their low coverage in the real data. It can be improved when more rmRNA-seq data are added. Nevertheless, the matching rate encouraged us to proceed.
We subsequently compared our intergenic TUs with the intergenic vlinc regions identified by Kapranov et al. (2007) in human. The coordinates of the 580 vlinc RNA domains were transformed from the hg18 to the mm9 version of the mouse genome, and we converted 486 vlinc RNAs successfully. The total matched vlinc RNAs and the total one-to-one matched vlinc RNA are 316 and 278, respectively (Table A6 in Appendix). This result implicated that many intergenic TUs are conserved among mammalian genomes. The one-to-one matching rate between intergenic TUs and vlinc RNAs is lower than what between intergenic TUs and the Fantom3 RNAs, and it may be resulted from expression regulation of intergenic TUs and the evolution of intergenic TUs among different species.
The Evidence of Novel TUs in Intergenic Region
To define the function of novel TUs, we examined the distribution of 5′ CAGE tags (Kawaji et al., 2006) and RNAPII (Mikkelsen et al., 2007), histone modifications (H3K4me3, H3K27me3, and H3K36me3; Mikkelsen et al., 2007) around the TUs, and evaluated their sequence conservation value (Fujita et al., 2011). First, we found that there is a significant enrichment of 5′ CAGE tags at the TU start in all three samples (Figure 4A), suggesting that these TUs have 5′ 7-methylguanosine caps and possess transcriptional start sites. Moreover, we investigated the binding of RNAPII within upstream of these TUs using RNAPII data from mouse ES cells and observed an obvious enrichment of RNAPII around their TSS (Figure 5A), suggesting that the TUs have their own promoters for regulating transcriptional initiation. Second, based on ChIP-seq data for the three mouse samples, we examined H3K4me3, H3K27me3, and H3K36me3 statuses around the TUs (Figures 4B–D) and observed that H3K4me3 and H3K27me3 are enrichment at the upstream of the TUs and their densities are correlated well with gene expression. Moreover, H3K36me3 are also enriched across the TUs and marked the transcriptional elongation sites. These lines of evidence suggested that these novel TUs may be indeed independently transcribed in the samples. Finally, we investigated the sequence conservation of the novel TUs (see Materials and Methods) by calculating their conservation scores of the exonic sequences in comparison with Refgene protein exons and random sequences as controls. The conservation scores of the novel TU exons are highly similar to those of the Fantom3 RNA-defined exons (Figure 5B) and similar results were observed in the promoter conservation scores (Figure 5C). Results from both analyses suggest possible functionality of the novel TUs.

Figure 4. 5′ CAGE and histone modification around novel TU–TSS or gene bodies in the mouse cerebrum, testis, and ES cell. (A–D) Profiles of 5′ CAGE, H3K4me3, H3K27me3, and H3K36me3.
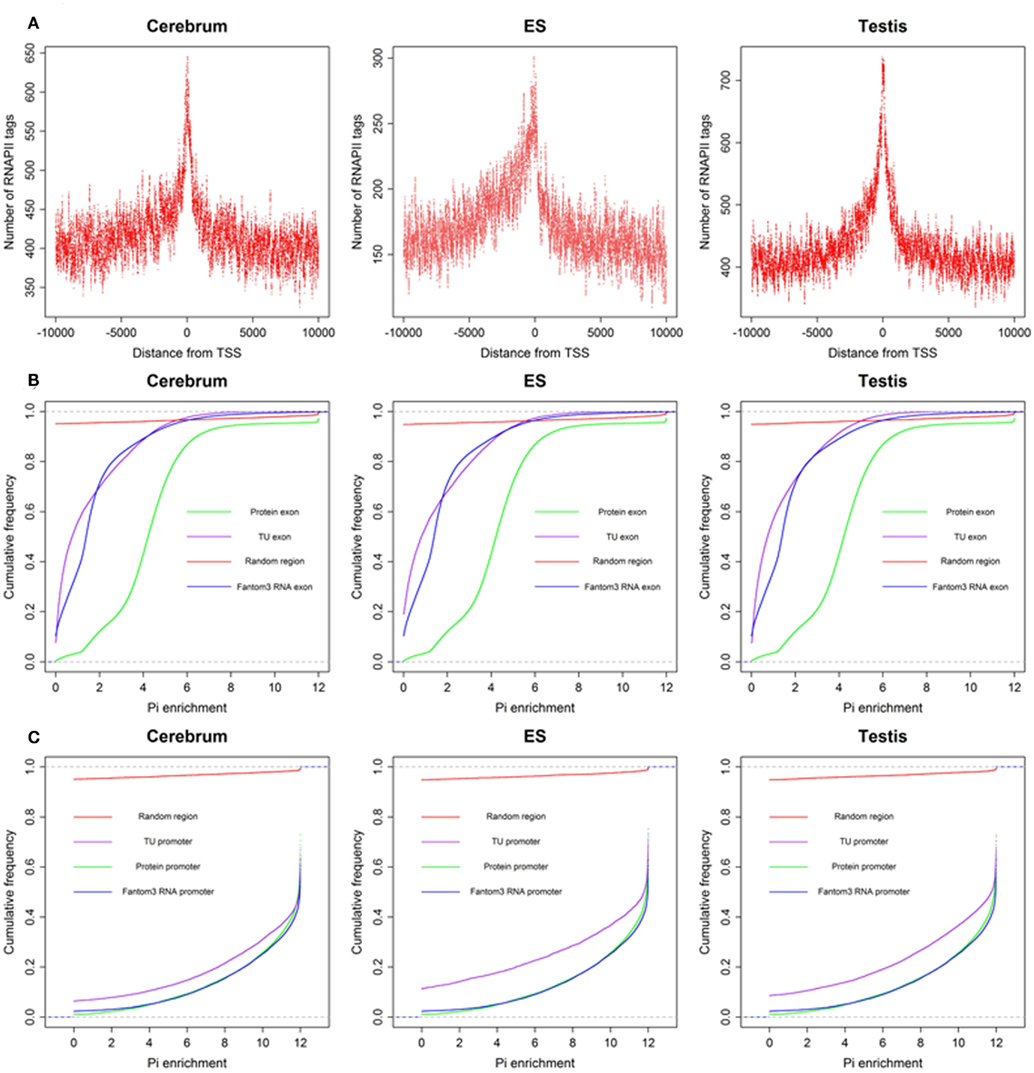
Figure 5. The RNAPII around novel TU–TSS and sequence conservation of TU exon and promoters. (A) Profile of RNAPII, (B) cumulative distribution of sequence conservation for TU exon, protein exon, Fantom3 RNA exon, and random region, and (C) cumulative distribution of sequence conservation for TU promoter, protein promoter, Fantom3 RNA promoter, and random region.
To illustrate the related characteristics of the novel TUs, we showed an intronic TU and an intergenic TU in Figure A2 in Appendix. Both TUs are significantly expressed in the tissues and cell. Moreover, the exons of both TUs have homologous sequences according to their conservation scores (0 means no conservation and 1 means highly conserved).
Classification and Function Analysis of Novel TUs and Exons
In order to explore the functionality of the novel TUs, we predicted their protein-coding capability based on PhyloCSF result (Table 3; Lin et al., 2011). We obtained their amino acid sequences (for single exon TUs) according to ORF prediction and aligned the amino acid sequences to the NCBI nr database. We found that most of these protein-coding TUs are similar to either known (such as ribosomal proteins and dehydrogenase) or hypothetical proteins (such as hypothetical and unnamed proteins). For exploring whether these protein-coding TUs are pseudogenes, we compared them to the Vega pseudogene annotations, and only about 8.85% of them are likely to be pseudogenes (Table A7 in Appendix). Moreover, we selected two protein-coding transcripts and predicted their secondary structures. One of them is similar to mouse mCG1041001 protein and is predicted to be extracellularly located. The other is similar to mouse EG382421 protein and possesses nuclear localization sequence.
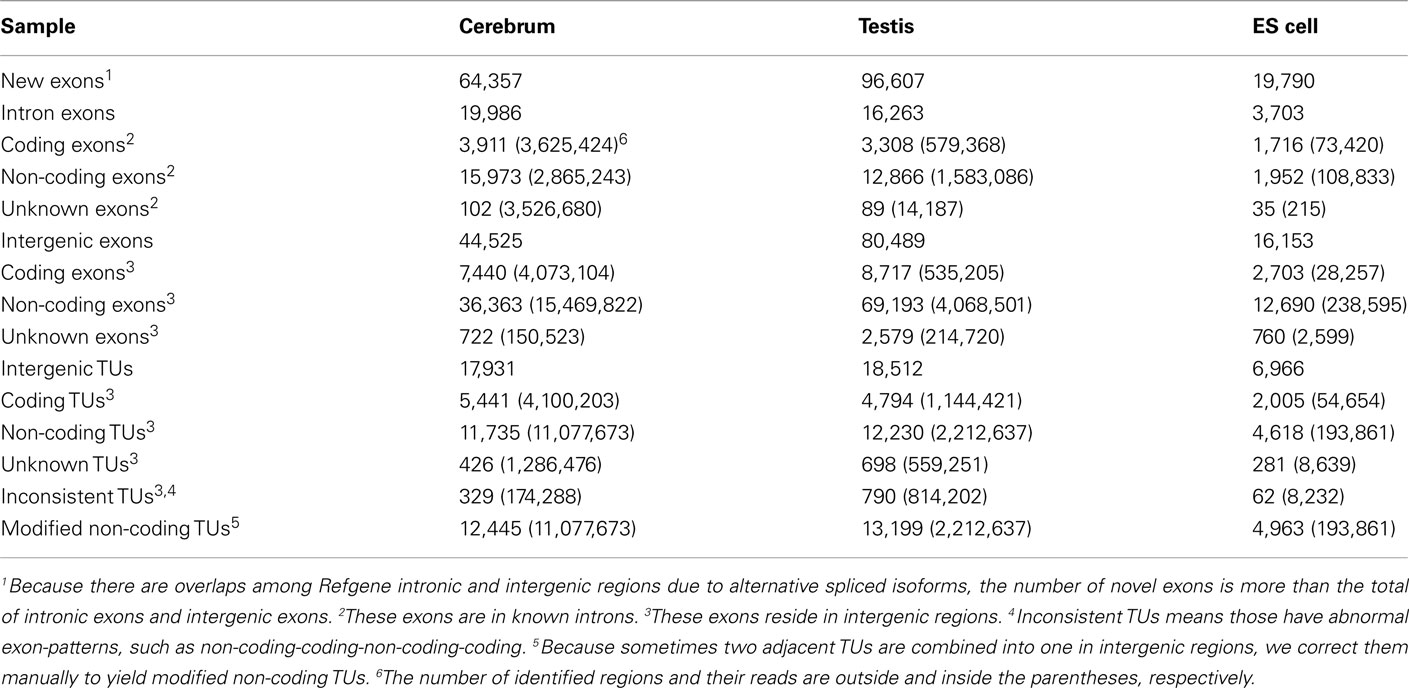
Table 3. Summary of coding and non-coding exons and TUs.
We looked into the antisense regulation of the novel TUs. According to the PhyloCSF prediction, 65.93% of the novel TUs can be defined as non-coding RNAs due to lacking protein-coding characteristics (Table 4). To further examine them, we extracted the antisense RNAs by comparing the location of the TUs to known genes as putative cis-antisense RNAs (ncerebrum = 2,614, ntestis = 2,756, and nES = 732) and their target genes (ncerebrum = 2,324, ntestis = 2,356, and nES = 689). Since previous studies have suggested that sense–antisense gene pairs may play potential regulatory roles (Okada et al., 2008), we clustered the sense–antisense regulated genes using DAVID website (Huang da et al., 2009; Huang et al., 2009) and found that most of these antisense regulated genes are associated with synapse, ion binding/transport, cell junction, cytoskeletal, membrane, and signal transduction in the three samples (S1–S3 in Supplementary Material). Moreover, we found that the genes in cerebrum and testis are related to cardiomyopathy, cancer, endocytosis, cell junction, and signal pathway (S4 and S5 in Supplementary Material). The expression levels of the sense–antisense transcripts are either positively or negatively correlated among different tissues and cell lines (Katayama et al., 2005; Okada et al., 2008). We also compared the sense–antisense expression in a pairwise fashion among the three samples (see Materials and Methods) and found that the antisense expression is either positively or negatively associated with the sense expression (Figure 6). This characteristic is in agreement with previous studies (Katayama et al., 2005; Okada et al., 2008).
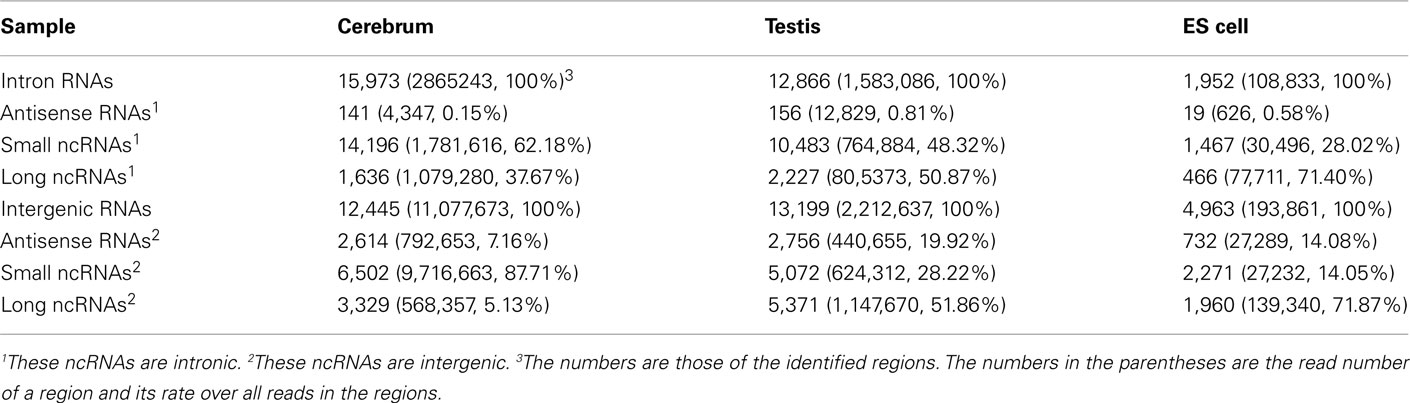
Table 4. The classification of ncRNAs in intronic and intergenic regions.
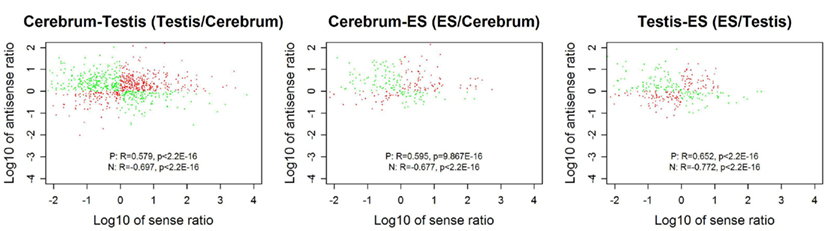
Figure 6. The correlation between sense and antisense expression ratio in sense–antisense gene pairs. Red and green points represent the sense–antisense gene pairs in positive and negative types. “P” stands for the positive type and “N” stands for the negative type.
We examined the novel TUs to see if some of them are actually non-coding RNAs. We divided the remaining (non-exonic) novel ncRNAs into long or small ncRNAs according to their sizes. About 43.87% of the remaining ncRNAs are larger than 200 bp in size, which were defined as long ncRNAs. There are 3,329, 5,371, and 1,960 novel long ncRNAs identified in the cerebrum, testis, and ES cells, respectively (Table 4). Comparing our long ncRNAs to lincRNAs identified by Guttman et al. (2009), we found 724 lincRNAs in our three samples, which are accounted for 43.48% of all lincRNAs. There are about 21% of lincRNAs found in each of our samples (ncerebrum = 359, ntestis = 391, and nES = 304).
We defined the rest of the ncRNAs as small ncRNAs, ranging from 55 to 200 bp in length; the majority of these small ncRNAs (∼24.04%) are from 55 to 65 bp in size (Figure 7A). This size range of small ncRNAs is related to the insert size of the libraries and data processing parameters. First, we selected RNA fragments in a length range of 50–150 bp for analysis. Second, we filtered the small RNAs whose lengths are less than 55 bp and have overlapping sequences so that some of the smaller RNAs were eliminated in data processing procedures. For these small ncRNAs, we predicted their motifs using MEME software (Bailey and Elkan, 1994) and some conserved motifs were identified (Figures 7B–D), which were accounted for ∼20% of all small ncRNAs. To explore the relationship between conserved motifs and RNA structures, we calculated two distances: one is what between the RNA 5′ end and the motif start and the other is what between the motif end and RNA 3′ end; we did not observe any obvious patterns in the motif distribution (Figure A3 in Appendix). We also compared the novel ncRNAs among the three samples and found that the ratios of the tissue- or cell-specific novel ncRNAs are larger than the ratio of known genes (Figure A4 in Appendix). The biased distribution of the novel ncRNAs indicates their possible functional roles in different tissues or cell types. More ncRNA expression data from a broader tissue spectrum are certainly needed to decipher the functionality of the ncRNAs.
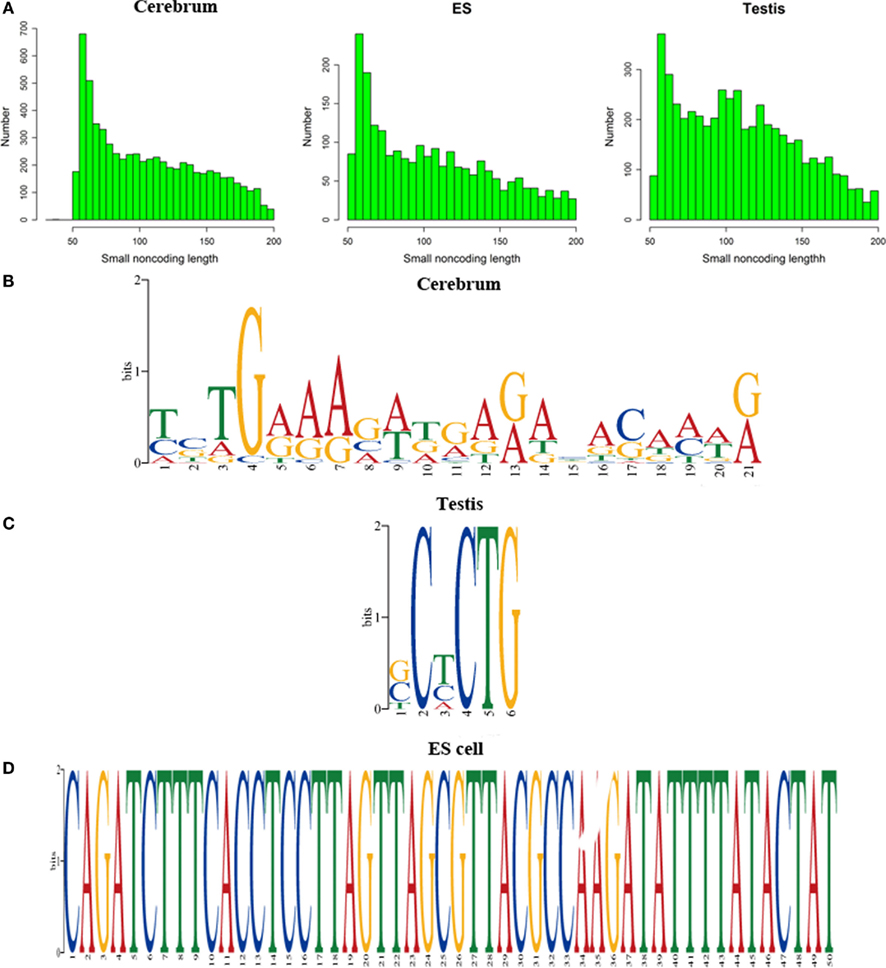
Figure 7. Histograms and motif logo of small RNAs in intergenic regions. (A) the histogram of small RNA length, (B) a motif logo of small RNAs in cerebrum (16.13% of 65 bp small RNAs involved in this motif), (C) a motif logo of small RNA in testis (41.54% of 64 bp small RNAs involved in this motif), and (D) a motif logo of small RNAs in ES cell (25.97% of 56 bp small RNAs involved in this motif).
Actively Transcribed Intronic Regions
Based on the PhyloCSF prediction (Table 3), we identified about 79.52% ncRNA exons in the intronic regions of the cerebrum and testis, whereas only 52.71% ncRNA exons in the intronic regions of ES cells. Whether most of the predicted protein-coding exons are actually parts of known genes remains to be elucidated. For the analysis of ncRNAs in the intronic regions, we also divided them into three portions: antisense RNAs, small ncRNAs, and long ncRNAs (Table 4). Unlike ncRNAs in intergenic regions, most intronic ncRNAs are small ncRNAs: 88.88, 81.48, and 75.15% in the mouse cerebrum, testis, and ES cell, respectively. Since the intronic expressions are mostly weak and interfered by background expression, more efforts are to be devoted in the future for exploring their functions.
Discussion
In this study, we attempted to identify novel transcripts using rmRNA-seq data from two mouse transcript-rich tissues, the cerebrum and testis, and ES cells. Compared to what generated from polyA-based mRNA-seq method, rmRNA-seq data are expected to harbor more novel transcripts that do not have the polyA tails typical for eukaryotic mRNA (Cui et al., 2010). In addition, we took the advantage of a strand-specific nature of the method, which is readily done using the SOLiD platform and allows us to define sense and antisense transcript pairs of the antisense regulated genes.
Using a custom-designed data processing pipeline, we carefully identified several to twenty thousands of novel TUs from different mouse tissues and cells and analyzed their distributions in both intronic and intergenic regions. We also used other supporting evidence from transcriptional initiation and epigenetic signals as well as one of the common evolutionary strategies – sequence conservation. These features helped us to argue for their functional roles in the tissues and cells. Our pipeline is able to recover ∼94.12% Refgene exons (average coverage is equal or larger than the cutoff value) from the dataset and the method is capable of driving mammalian transcriptome annotation to a completion if coupled with a protocol for characterizing even smaller RNAs, such as miRNAs.
The annotation of these novel UTs remains challenging. First, when aligning these TUs that are characteristic of amino acid sequences, such as single exons, to sequences in the NCBI nr database, we can readily annotate about 24% of the novel protein-coding TUs. Although some of them are annotated to be structural proteins, such as those similar to ribosomal proteins and house-keeping enzymes, most of them are actually matching to unknown proteins. Second, we identified a large number of ncRNAs, including antisense RNAs, small ncRNAs, and long ncRNAs. According to the analysis on the targeted genes of antisense RNAs, we found that they are associated with synapse, ion binding-transport, cell junction, cytoskeletal, membrane, and signal transduction. Surprisingly, these genes are enriched in disease related pathways, such as cardiomyopathy and cancer. We believe that such enrichment is largely an artifact due to the fields of intensive research activities. In addition, we found that antisense expression is either positively or negatively associated with sense expression of sense–antisense gene pairs. Furthermore, numerous long ncRNAs are identified in intergenic regions, providing a basis for future functional studies. Moreover, we found that the majority of small ncRNAs are in a length range of 55–65 bp in intergenic regions, which may represent a novel class of ncRNAs since conserved motifs were found among the sequences. In addition, most novel exons we found in intronic regions are small ncRNAs of the same size range.
Conclusion
In this study, we identified a large number of novel exons and TUs using three strand-specific rmRNA-seq datasets. We also evaluated the universality and functionality of these novel TUs to demonstrate their features as actively transcribed genes based on an analysis that combines data from transcription start site, histone modification, RNAPII binding site, and sequence conservation. Our efforts in annotating these novel TUs revealed their possible functional features, resembling sequences of protein-coding and sense–antisense regulated genes as well as long and small ncRNAs. This study also provides a practical approach for the identification of most, if not all, genes of mammalian genomes.
Conflict of Interest Statement
The authors declare that the research was conducted in the absence of any commercial or financial relationships that could be construed as a potential conflict of interest.
Acknowledgments
The study is supported by grants from Knowledge Innovation Program of the Chinese Academy of Sciences (KSCX2-EW-R-01-04), Natural Science Foundation of China (90919024), Natural Science Foundation of China (30900831), and the National Basic Research Program (973 Program) from the Ministry of Science and Technology of the People’s Republic of China (2011CB944100). The authors thank the anonymous reviewers for critical comments and helpful suggestions.
Supplementary Material
The Supplementary Material for this article can be found online at http://www.frontiersin.org/non-coding_rna/10.3389/fgene.2011.00093/abstract
Table S1. Functional classification of cerebrum-associated genes that have antisense RNA.
Table S2. Functional classification of testis-associated genes that have antisense RNA.
Table S3. Functional classification of ES cell-associated genes that have antisense RNA.
Table S4. KEGG pathways of the cerebrum-associated genes that have antisense RNA.
Table S5. KEGG pathways of testis-associated genes that have antisense RNA.
File S1. Putatively identified exons in the mouse cerebrum, testis, and ES cells. These files have five columns. They are chromosome, strand, type (“modified” or “no-modified” for distinguishing whether it was revised using split reads), start position and end position.
File S2. Putatively identified TUs in the mouse cerebrum, testis, and ES cells.
File S3. The main step of identification of exons and TUs.
Footnotes
References
Bailey, T. L., and Elkan, C. (1994). Fitting a mixture model by expectation maximization to discover motifs in biopolymers. Proc. Int. Conf. Intell. Syst. Mol. Biol. 2, 28–36.
Bertone, P., Stolc, V., Royce, T. E., Rozowsky, J. S., Urban, A. E., Zhu, X., Rinn, J. L., Tongprasit, W., Samanta, M., Weissman, S., Gerstein, M., and Snyder, M. (2004). Global identification of human transcribed sequences with genome tiling arrays. Science 306, 2242–2246.
Birney, E., Stamatoyannopoulos, J. A., Dutta, A., Guigo, R., Gingeras, T. R., Margulies, E. H., Weng, Z., Snyder, M., Dermitzakis, E. T., Thurman, R. E., Kuehn, M. S., Taylor, C. M., Neph, S., Koch, C. M., Asthana, S., Malhotra, A., Adzhubei, I., Greenbaum, J. A., Andrews, R. M., Flicek, P., Boyle, P. J., Cao, H., Carter, N. P., Clelland, G. K., Davis, S., Day, N., Dhami, P., Dillon, S. C., Dorschner, M. O., Fiegler, H., Giresi, P. G., Goldy, J., Hawrylycz, M., Haydock, A., Humbert, R., James, K. D., Johnson, B. E., Johnson, E. M., Frum, T. T., Rosenzweig, E. R., Karnani, N., Lee, K., Lefebvre, G. C., Navas, P. A., Neri, F., Parker, S. C., Sabo, P. J., Sandstrom, R., Shafer, A., Vetrie, D., Weaver, M., Wilcox, S., Yu, M., Collins, F. S., Dekker, J., Lieb, J. D., Tullius, T. D., Crawford, G. E., Sunyaev, S., Noble, W. S., Dunham, I., Denoeud, F., Reymond, A., Kapranov, P., Rozowsky, J., Zheng, D., Castelo, R., Frankish, A., Harrow, J., Ghosh, S., Sandelin, A., Hofacker, I. L., Baertsch, R., Keefe, D., Dike, S., Cheng, J., Hirsch, H. A., Sekinger, E. A., Lagarde, J., Abril, J. F., Shahab, A., Flamm, C., Fried, C., Hackermuller, J., Hertel, J., Lindemeyer, M., Missal, K., Tanzer, A., Washietl, S., Korbel, J., Emanuelsson, O., Pedersen, J. S., Holroyd, N., Taylor, R., Swarbreck, D., Matthews, N., Dickson, M. C., Thomas, D. J., Weirauch, M. T., Gilbert, J., Drenkow, J., Bell, I., Zhao, X., Srinivasan, K. G., Sung, W. K., Ooi, H. S., Chiu, K. P., Foissac, S., Alioto, T., Brent, M., Pachter, L., Tress, M. L., Valencia, A., Choo, S. W., Choo, C. Y., Ucla, C., Manzano, C., Wyss, C., Cheung, E., Clark, T. G., Brown, J. B., Ganesh, M., Patel, S., Tammana, H., Chrast, J., Henrichsen, C. N., Kai, C., Kawai, J., Nagalakshmi, U., Wu, J., Lian, Z., Lian, J., Newburger, P., Zhang, X., Bickel, P., Mattick, J. S., Carninci, P., Hayashizaki, Y., Weissman, S., Hubbard, T., Myers, R. M., Rogers, J., Stadler, P. F., Lowe, T. M., Wei, C. L., Ruan, Y., Struhl, K., Gerstein, M., Antonarakis, S. E., Fu, Y., Green, E. D., Karaöz, U., Siepel, A., Taylor, J., Liefer, L. A., Wetterstrand, K. A., Good, P. J., Feingold, E. A., Guyer, M. S., Cooper, G. M., Asimenos, G., Dewey, C. N., Hou, M., Nikolaev, S., Montoya-Burgos, J. I., Löytynoja, A., Whelan, S., Pardi, F., Massingham, T., Huang, H., Zhang, N. R., Holmes, I., Mullikin, J. C., Ureta-Vidal, A., Paten, B., Seringhaus, M., Church, D., Rosenbloom, K., Kent, W. J., Stone, E. A., NISC Comparative Sequencing Program, Baylor College of Medicine Human Genome Sequencing Center, Washington University Genome Sequencing Center, Broad Institute; Children’s Hospital Oakland Research Institute, Batzoglou, S., Goldman, N., Hardison, R. C., Haussler, D., Miller, W., Sidow, A., Trinklein, N. D., Zhang, Z. D., Barrera, L., Stuart, R., King, D. C., Ameur, A., Enroth, S., Bieda, M. C., Kim, J., Bhinge, A. A., Jiang, N., Liu, J., Yao, F., Vega, V. B., Lee, C. W., Ng, P., Shahab, A., Yang, A., Moqtaderi, Z., Zhu, Z., Xu, X., Squazzo, S., Oberley, M. J., Inman, D., Singer, M. A., Richmond, T. A., Munn, K. J., Rada-Iglesias, A., Wallerman, O., Komorowski, J., Fowler, J. C., Couttet, P., Bruce, A. W., Dovey, O. M., Ellis, P. D., Langford, C. F., Nix, D. A., Euskirchen, G., Hartman, S., Urban, A. E., Kraus, P., Van Calcar, S., Heintzman, N., Kim, T. H., Wang, K., Qu, C., Hon, G., Luna, R., Glass, C. K., Rosenfeld, M. G., Aldred, S. F., Cooper, S. J., Halees, A., Lin, J. M., Shulha, H. P., Zhang, X., Xu, M., Haidar, J. N., Yu, Y., Ruan, Y., Iyer, V. R., Green, R. D., Wadelius, C., Farnham, P. J., Ren, B., Harte, R. A., Hinrichs, A. S., Trumbower, H., Clawson, H., Hillman-Jackson, J., Zweig, A. S., Smith, K., Thakkapallayil, A., Barber, G., Kuhn, R. M., Karolchik, D., Armengol, L., Bird, C. P., de Bakker, P. I., Kern, A. D., Lopez-Bigas, N., Martin, J. D., Stranger, B. E., Woodroffe, A., Davydov, E., Dimas, A., Eyras, E., Hallgrímsdóttir, I. B., Huppert, J., Zody, M. C., Abecasis, G. R., Estivill, X., Bouffard, G. G., Guan, X., Hansen, N. F., Idol, J. R., Maduro, V. V., Maskeri, B., McDowell, J. C., Park, M., Thomas, P. J., Young, A. C., Blakesley, R. W., Muzny, D. M., Sodergren, E., Wheeler, D. A., Worley, K. C., Jiang, H., Weinstock, G. M., Gibbs, R. A., Graves, T., Fulton, R., Mardis, E. R., Wilson, R. K., Clamp, M., Cuff, J., Gnerre, S., Jaffe, D. B., Chang, J. L., Lindblad-Toh, K., Lander, E. S., Koriabine, M., Nefedov, M., Osoegawa, K., Yoshinaga, Y., Zhu, B., and de Jong, P. J. (2007). Identification and analysis of functional elements in 1% of the human genome by the ENCODE pilot project. Nature 447, 799–816.
Cabili, M. N., Trapnell, C., Goff, L., Koziol, M., Tazon-Vega, B., Regev, A., and Rinn, J. L. (2011). Integrative annotation of human large intergenic noncoding RNAs reveals global properties and specific subclasses. Genes Dev. 25, 1915–1927.
Carninci, P., Kasukawa, T., Katayama, S., Gough, J., Frith, M. C., Maeda, N., Oyama, R., Ravasi, T., Lenhard, B., Wells, C., Kodzius, R., Shimokawa, K., Bajic, V. B., Brenner, S. E., Batalov, S., Forrest, A. R., Zavolan, M., Davis, M. J., Wilming, L. G., Aidinis, V., Allen, J. E., Ambesi-Impiombato, A., Apweiler, R., Aturaliya, R. N., Bailey, T. L., Bansal, M., Baxter, L., Beisel, K. W., Bersano, T., Bono, H., Chalk, A. M., Chiu, K. P., Choudhary, V., Christoffels, A., Clutterbuck, D. R., Crowe, M. L., Dalla, E., Dalrymple, B. P., De Bono, B., Della Gatta, G., Di Bernardo, D., Down, T., Engstrom, P., Fagiolini, M., Faulkner, G., Fletcher, C. F., Fukushima, T., Furuno, M., Futaki, S., Gariboldi, M., Georgii-Hemming, P., Gingeras, T. R., Gojobori, T., Green, R. E., Gustincich, S., Harbers, M., Hayashi, Y., Hensch, T. K., Hirokawa, N., Hill, D., Huminiecki, L., Iacono, M., Ikeo, K., Iwama, A., Ishikawa, T., Jakt, M., Kanapin, A., Katoh, M., Kawasawa, Y., Kelso, J., Kitamura, H., Kitano, H., Kollias, G., Krishnan, S. P., Kruger, A., Kummerfeld, S. K., Kurochkin, I. V., Lareau, L. F., Lazarevic, D., Lipovich, L., Liu, J., Liuni, S., Mcwilliam, S., Madan Babu, M., Madera, M., Marchionni, L., Matsuda, H., Matsuzawa, S., Miki, H., Mignone, F., Miyake, S., Morris, K., Mottagui-Tabar, S., Mulder, N., Nakano, N., Nakauchi, H., Ng, P., Nilsson, R., Nishiguchi, S., Nishikawa, S., Piazza, S., Reed, J., Reid, J. F., Ring, B. Z., Ringwald, M., Rost, B., Ruan, Y., Salzberg, S. L., Sandelin, A., Schneider, C., Schönbach, C., Sekiguchi, K., Semple, C. A., Seno, S., Sessa, L., Sheng, Y., Shibata, Y., Shimada, H., Shimada, K., Silva, D., Sinclair, B., Sperling, S., Stupka, E., Sugiura, K., Sultana, R., Takenaka, Y., Taki, K., Tammoja, K., Tan, S. L., Tang, S., Taylor, M. S., Tegner, J., Teichmann, S. A., Ueda, H. R., van Nimwegen, E., Verardo, R., Wei, C. L., Yagi, K., Yamanishi, H., Zabarovsky, E., Zhu, S., Zimmer, A., Hide, W., Bult, C., Grimmond, S. M., Teasdale, R. D., Liu, E. T., Brusic, V., Quackenbush, J., Wahlestedt, C., Mattick, J. S., Hume, D. A., Kai, C., Sasaki, D., Tomaru, Y., Fukuda, S., Kanamori-Katayama, M., Suzuki, M., Aoki, J., Arakawa, T., Iida, J., Imamura, K., Itoh, M., Kato, T., Kawaji, H., Kawagashira, N., Kawashima, T., Kojima, M., Kondo, S., Konno, H., Nakano, K., Ninomiya, N., Nishio, T., Okada, M., Plessy, C., Shibata, K., Shiraki, T., Suzuki, S., Tagami, M., Waki, K., Watahiki, A., Okamura-Oho, Y., Suzuki, H., Kawai, J., Hayashizaki, Y., FANTOM Consortium, and RIKEN Genome Exploration Research Group and Genome Science Group (Genome Network Project Core Group). (2005). The transcriptional landscape of the mammalian genome. Science 309, 1559–1563.
Clark, M. B., Amaral, P. P., Schlesinger, F. J., Dinger, M. E., Taft, R. J., Rinn, J. L., Ponting, C. P., Stadler, P. F., Morris, K. V., Morillon, A., Rozowsky, J. S., Gerstein, M. B., Wahlestedt, C., Hayashizaki, Y., Carninci, P., Gingeras, T. R., and Mattick, J. S. (2011). The reality of pervasive transcription. PLoS Biol. 9, e1000625; discussion e1001102. doi:10.1371/journal.pbio.1000625
Cui, P., Lin, Q., Ding, F., Xin, C., Gong, W., Zhang, L., Geng, J., Zhang, B., Yu, X., Yang, J., Hu, S., and Yu, J. (2010). A comparison between ribo-minus RNA-sequencing and polyA-selected RNA-sequencing. Genomics 96, 259–265.
Flicek, P., Amode, M. R., Barrell, D., Beal, K., Brent, S., Chen, Y., Clapham, P., Coates, G., Fairley, S., Fitzgerald, S., Gordon, L., Hendrix, M., Hourlier, T., Johnson, N., Kahari, A., Keefe, D., Keenan, S., Kinsella, R., Kokocinski, F., Kulesha, E., Larsson, P., Longden, I., Mclaren, W., Overduin, B., Pritchard, B., Riat, H. S., Rios, D., Ritchie, G. R., Ruffier, M., Schuster, M., Sobral, D., Spudich, G., Tang, Y. A., Trevanion, S., Vandrovcova, J., Vilella, A. J., White, S., Wilder, S. P., Zadissa, A., Zamora, J., Aken, B. L., Birney, E., Cunningham, F., Dunham, I., Durbin, R., Fernandez-Suarez, X. M., Herrero, J., Hubbard, T. J., Parker, A., Proctor, G., Vogel, J., and Searle, S. M. (2011). Ensembl 2011. Nucleic Acids Res. 39, D800–D806.
Fujita, P. A., Rhead, B., Zweig, A. S., Hinrichs, A. S., Karolchik, D., Cline, M. S., Goldman, M., Barber, G. P., Clawson, H., Coelho, A., Diekhans, M., Dreszer, T. R., Giardine, B. M., Harte, R. A., Hillman-Jackson, J., Hsu, F., Kirkup, V., Kuhn, R. M., Learned, K., Li, C. H., Meyer, L. R., Pohl, A., Raney, B. J., Rosenbloom, K. R., Smith, K. E., Haussler, D., and Kent, W. J. (2011). The UCSC Genome Browser database: update 2011. Nucleic Acids Res. 39, D876–D882.
Glass, C. K., Kaikkonen, M. U., and Lam, M. T. Y. (2011). Non-coding RNAs as regulators of gene expression and epigenetics. Cardiovasc. Res. 90, 430–440.
Griffiths-Jones, S., Grocock, R. J., Van Dongen, S., Bateman, A., and Enright, A. J. (2006). miRBase: microRNA sequences, targets and gene nomenclature. Nucleic Acids Res. 34, D140–D144.
Griffiths-Jones, S., Moxon, S., Marshall, M., Khanna, A., Eddy, S. R., and Bateman, A. (2005). Rfam: annotating non-coding RNAs in complete genomes. Nucleic Acids Res. 33, D121–D124.
Gupta, R. A., Shah, N., Wang, K. C., Kim, J., Horlings, H. M., Wong, D. J., Tsai, M. C., Hung, T., Argani, P., Rinn, J. L., Wang, Y., Brzoska, P., Kong, B., Li, R., West, R. B., Van De Vijver, M. J., Sukumar, S., and Chang, H. Y. (2010). Long non-coding RNA HOTAIR reprograms chromatin state to promote cancer metastasis. Nature 464, 1071–1076.
Guttman, M., Amit, I., Garber, M., French, C., Lin, M. F., Feldser, D., Huarte, M., Zuk, O., Carey, B. W., Cassady, J. P., Cabili, M. N., Jaenisch, R., Mikkelsen, T. S., Jacks, T., Hacohen, N., Bernstein, B. E., Kellis, M., Regev, A., Rinn, J. L., and Lander, E. S. (2009). Chromatin signature reveals over a thousand highly conserved large non-coding RNAs in mammals. Nature 458, 223–227.
He, S., Liu, C., Skogerbo, G., Zhao, H., Wang, J., Liu, T., Bai, B., Zhao, Y., and Chen, R. (2008). NONCODE v2.0: decoding the non-coding. Nucleic Acids Res. 36, D170–D172.
Huang, D. W., Sherman, B. T., and Lempicki, R. A. (2009). Systematic and integrative analysis of large gene lists using DAVID bioinformatics resources. Nat. Protoc. 4, 44–57.
Huang da, W., Sherman, B. T., and Lempicki, R. A. (2009). Bioinformatics enrichment tools: paths toward the comprehensive functional analysis of large gene lists. Nucleic Acids Res. 37, 1–13.
Jarvis, K., and Robertson, M. (2011). The noncoding universe. BMC Biol. 9, 52. doi:10.1186/1741-7007-9-52
Johnson, M., Zaretskaya, I., Raytselis, Y., Merezhuk, Y., Mcginnis, S., and Madden, T. L. (2008). NCBI BLAST: a better web interface. Nucleic Acids Res. 36, W5–W9.
Juhling, F., Morl, M., Hartmann, R. K., Sprinzl, M., Stadler, P. F., and Putz, J. (2009). tRNAdb 2009: compilation of tRNA sequences and tRNA genes. Nucleic Acids Res. 37, D159–D162.
Kapranov, P., Cheng, J., Dike, S., Nix, D. A., Duttagupta, R., Willingham, A. T., Stadler, P. F., Hertel, J., Hackermuller, J., Hofacker, I. L., Bell, I., Cheung, E., Drenkow, J., Dumais, E., Patel, S., Helt, G., Ganesh, M., Ghosh, S., Piccolboni, A., Sementchenko, V., Tammana, H., and Gingeras, T. R. (2007). RNA maps reveal new RNA classes and a possible function for pervasive transcription. Science 316, 1484–1488.
Kapranov, P., St Laurent, G., Raz, T., Ozsolak, F., Reynolds, C. P., Sorensen, P. H., Reaman, G., Milos, P., Arceci, R. J., Thompson, J. F., and Triche, T. J. (2010). The majority of total nuclear-encoded non-ribosomal RNA in a human cell is ‘dark matter’ un-annotated RNA. BMC Biol. 8, 149. doi:10.1186/1741-7007-8-149
Karolchik, D., Hinrichs, A. S., Furey, T. S., Roskin, K. M., Sugnet, C. W., Haussler, D., and Kent, W. J. (2004). The UCSC Table Browser data retrieval tool. Nucleic Acids Res. 32, D493–D496.
Katayama, S., Tomaru, Y., Kasukawa, T., Waki, K., Nakanishi, M., Nakamura, M., Nishida, H., Yap, C. C., Suzuki, M., Kawai, J., Suzuki, H., Carninci, P., Hayashizaki, Y., Wells, C., Frith, M., Ravasi, T., Pang, K. C., Hallinan, J., Mattick, J., Hume, D. A., Lipovich, L., Batalov, S., Engstrom, P. G., Mizuno, Y., Faghihi, M. A., Sandelin, A., Chalk, A. M., Mottagui-Tabar, S., Liang, Z., Lenhard, B., and Wahlestedt, C. (2005). Antisense transcription in the mammalian transcriptome. Science 309, 1564–1566.
Kawaji, H., Kasukawa, T., Fukuda, S., Katayama, S., Kai, C., Kawai, J., Carninci, P., and Hayashizaki, Y. (2006). CAGE Basic/Analysis Databases: the CAGE resource for comprehensive promoter analysis. Nucleic Acids Res. 34, D632–D636.
Kin, T., Yamada, K., Terai, G., Okida, H., Yoshinari, Y., Ono, Y., Kojima, A., Kimura, Y., Komori, T., and Asai, K. (2007). fRNAdb: a platform for mining/annotating functional RNA candidates from non-coding RNA sequences. Nucleic Acids Res. 35, D145–D148.
Kogo, R., Shimamura, T., Mimori, K., Kawahara, K., Imoto, S., Sudo, T., Tanaka, F., Shibata, K., Suzuki, A., Komune, S., Miyano, S., and Mori, M. (2011). Long non-coding RNA HOTAIR regulates polycomb-dependent chromatin modification and is associated with poor prognosis in colorectal cancers. Cancer Res. 71, 6320–6326.
Langmead, B., Trapnell, C., Pop, M., and Salzberg, S. L. (2009). Ultrafast and memory-efficient alignment of short DNA sequences to the human genome. Genome Biol. 10, R25.
Lin, M. F., Jungreis, I., and Kellis, M. (2011). PhyloCSF: a comparative genomics method to distinguish protein coding and non-coding regions. Bioinformatics 27, i275–i282.
Mattick, J. (2010). Video Q&A: non-coding RNAs and eukaryotic evolution – a personal view. BMC Biol. 8, 67. doi:10.1186/1741-7007-8-67
Mattick, J. S., Taft, R. J., Pang, K. C., Mercer, T. R., and Dinger, M. (2010). Non-coding RNAs: regulators of disease. J. Pathol. 220, 126–139.
Mikkelsen, T. S., Ku, M., Jaffe, D. B., Issac, B., Lieberman, E., Giannoukos, G., Alvarez, P., Brockman, W., Kim, T. K., Koche, R. P., Lee, W., Mendenhall, E., O’donovan, A., Presser, A., Russ, C., Xie, X., Meissner, A., Wernig, M., Jaenisch, R., Nusbaum, C., Lander, E. S., and Bernstein, B. E. (2007). Genome-wide maps of chromatin state in pluripotent and lineage-committed cells. Nature 448, 553–560.
Mortazavi, A., Williams, B. A., Mccue, K., Schaeffer, L., and Wold, B. (2008). Mapping and quantifying mammalian transcriptomes by RNA-Seq. Nat. Methods 5, 621–628.
Okada, Y., Tashiro, C., Numata, K., Watanabe, K., Nakaoka, H., Yamamoto, N., Okubo, K., Ikeda, R., Saito, R., Kanai, A., Abe, K., Tomita, M., and Kiyosawa, H. (2008). Comparative expression analysis uncovers novel features of endogenous antisense transcription. Hum. Mol. Genet. 17, 1631–1640.
Pang, K. C., Stephen, S., Dinger, M. E., Engstrom, P. G., Lenhard, B., and Mattick, J. S. (2007). RNAdb 2.0 – an expanded database of mammalian non-coding RNAs. Nucleic Acids Res. 35, D178–D182.
Szymanski, M., Erdmann, V. A., and Barciszewski, J. (2007). Noncoding RNAs database (ncRNAdb). Nucleic Acids Res. 35, D162–D164.
Trapnell, C., Pachter, L., and Salzberg, S. L. (2009). TopHat: discovering splice junctions with RNA-Seq. Bioinformatics 25, 1105–1111.
Trapnell, C., Williams, B. A., Pertea, G., Mortazavi, A., Kwan, G., Van Baren, M. J., Salzberg, S. L., Wold, B. J., and Pachter, L. (2010). Transcript assembly and quantification by RNA-Seq reveals unannotated transcripts and isoform switching during cell differentiation. Nat. Biotechnol. 28, 511–515.
van Bakel, H., Nislow, C., Blencowe, B. J., and Hughes, T. R. (2010). Most “dark matter” transcripts are associated with known genes. PLoS Biol. 8, e1000371. doi:10.1371/journal.pbio.1000371
van Bakel, H., Nislow, C., Blencowe, B. J., and Hughes, T. R. (2011). Response to “The Reality of Pervasive Transcription.” PLoS Biol. 9. :e1001102. doi:10.1371/journal.pbio.1001102
Wang, Z., Gerstein, M., and Snyder, M. (2009). RNA-Seq: a revolutionary tool for transcriptomics. Nat. Rev. Genet. 10, 57–63.
Zang, C., Schones, D. E., Zeng, C., Cui, K., Zhao, K., and Peng, W. (2009). A clustering approach for identification of enriched domains from histone modification ChIP-Seq data. Bioinformatics 25, 1952–1958.
Zhu, J., He, F., Wang, D., Liu, K., Huang, D., Xiao, J., Wu, J., Hu, S., and Yu, J. (2010). A novel role for minimal introns: routing mRNAs to the cytosol. PLoS ONE 5, e10144. doi:10.1371/journal.pone.0010144
Appendix
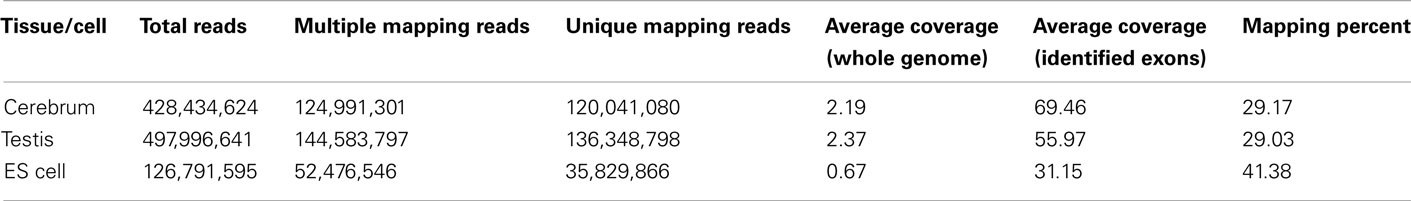
Table A1. The sequence mapping summary of rmRNA-seq data.
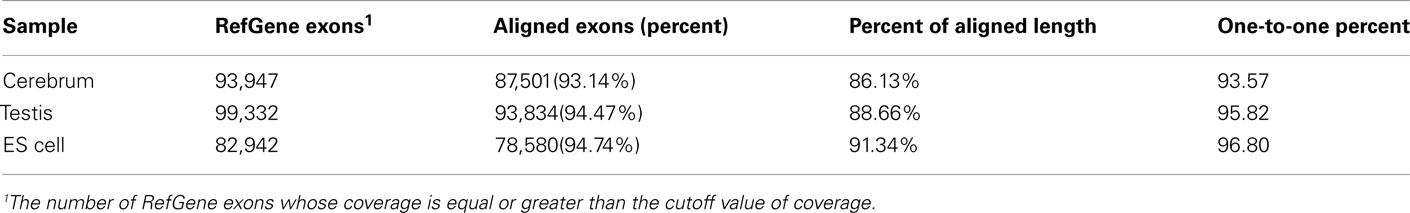
Table A2. The evaluation of exon identification.
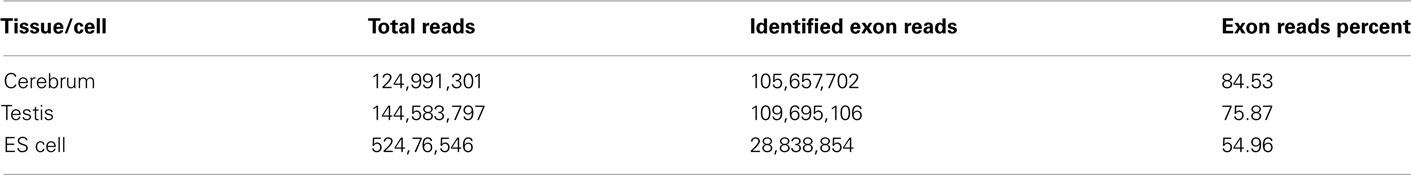
Table A3. The percentage of exon reads in all mapped reads.
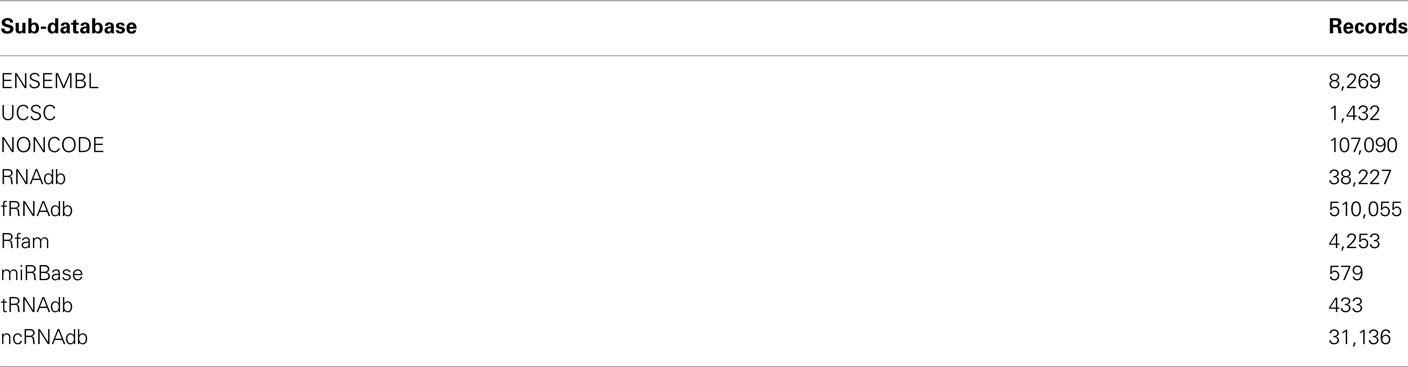
Table A4. The summary of ncRNA database records.
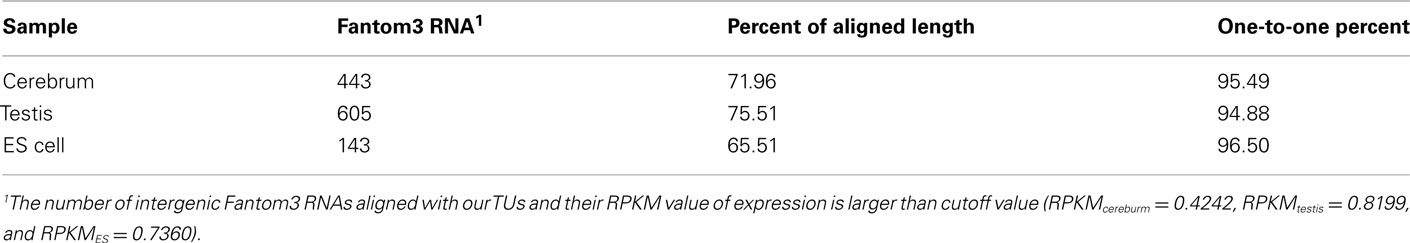
Table A5. The evaluation of TU building based on the Fantom3 RNAs with multiple exons.
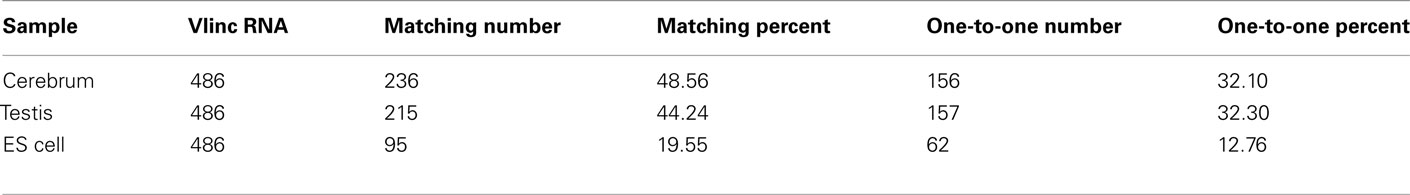
Table A6. The evaluation of TU building based on the vlinc RNA.
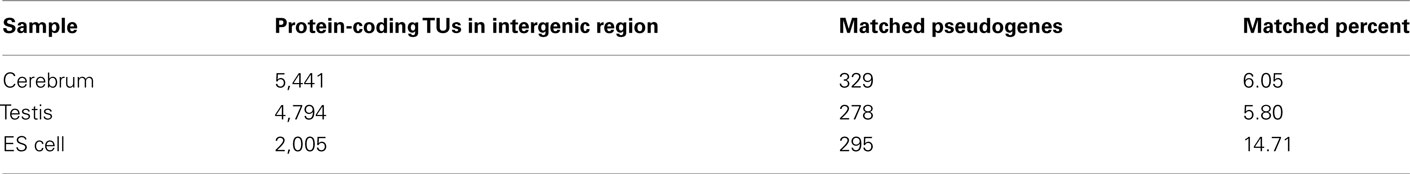
Table A7. The pseudogenes in novel intergenic TUs.

Figure A1. A flowchart of gene identification process. We mapped the ribo-minus RNA-seq data using TopHat and created the coverage file for genome and identified exons according to the coverage of each position (>= cutoff value). Since 95% intron lengths are > or =95 bp, we merged small exons (distance < or =95 bp). Moreover, since 95% exon lengths are > or =55, we only keep the exons whose length is equal or larger than 55 bp to reduce false positives. We remove low coverage exons to reduce errors. We also filter known exons and build novel TUs on the basis of H3K36me3, RNAPII, and the different distance of adjacent exons between internal of TUs and adjacent TUs. We evaluate the accuracy of TU building by comparing our TUs with Fantom3 RNAs of intergenic regions.
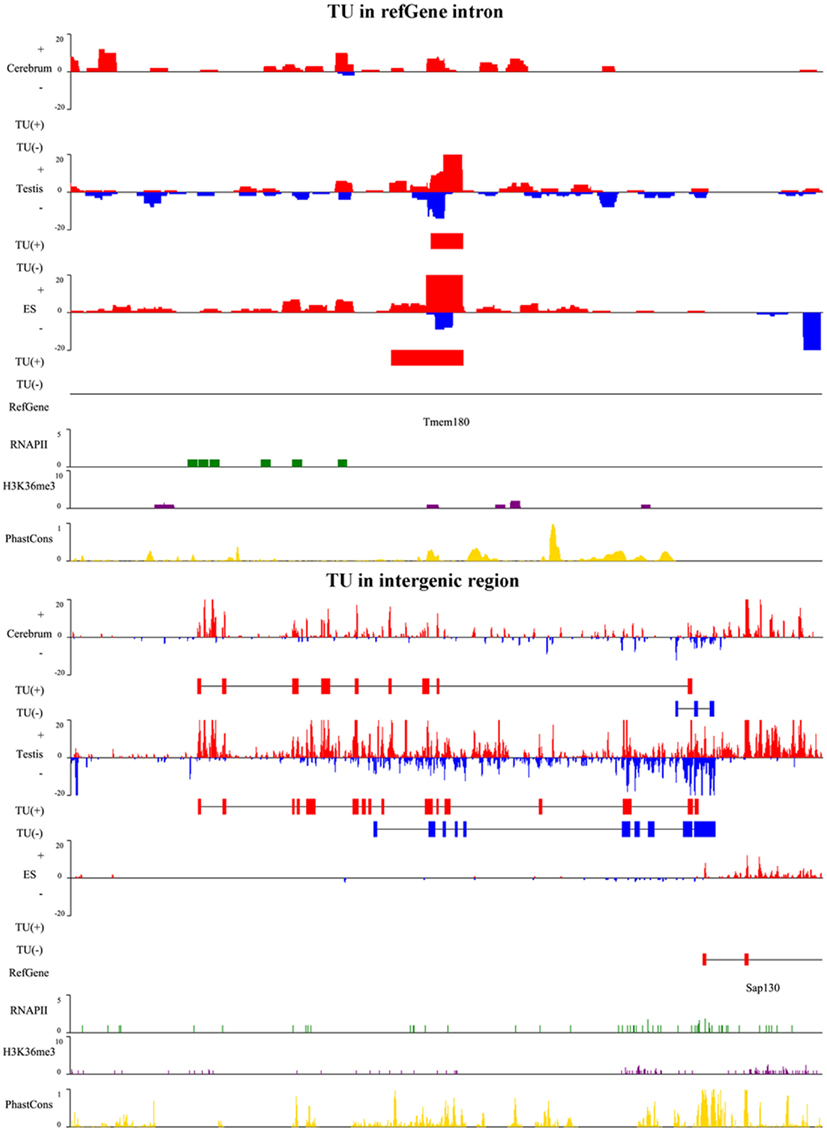
Figure A2. A snapshot for TUs in Refgene intron and intergenic region. The upper panel is a TU in an intron of the transmembrane protein gene, Tmem180, and lower panel is a TU adjacent to Sap130 gene. SAP130 is a subunit of the histone deacetylase-dependent SIN3A co-repressor complex which acts as a transcriptional repressor. The TU in plus and minus strands is shown as red and blue horizontal bars, respectively. For each TU, we show RNA expression level (vertical bars in red and blue), identified TU, Refgene, RNAPII signal (green), H3K36me3 signal (purple), and conservation score (yellow).
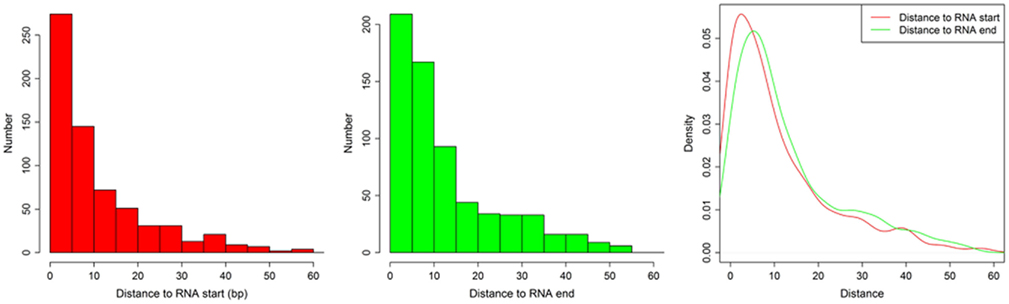
Figure A3. The distances between (1) motif start and RNA 5′ end and (2) between motif end and RNA 3′ end. The histogram shows the distance between motif start and RNA 5′ end (left), the distance between motif end and RNA 3′ end (middle), and the density of both (right).
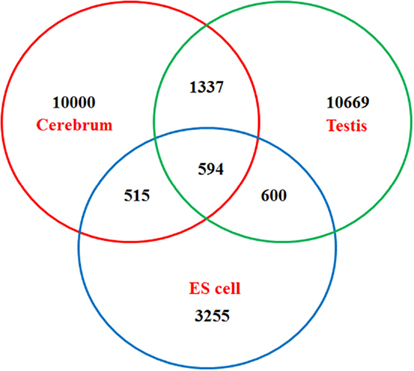
Figure A4. Venn diagram of newly identified non-coding TUs among mouse the cerebrum, testis, and ES cells.
Keywords: novel transcripts, non-coding RNA, ribo-minus RNA-seq, next-generation sequencing
Citation: Liu W, Zhao Y, Cui P, Lin Q, Ding F, Xin C, Tan X, Song S, Yu J and Hu S (2011) Thousands of novel transcripts identified in mouse cerebrum, testis, and ES cells based on ribo-minus RNA sequencing. Front. Gene. 2:93. doi: 10.3389/fgene.2011.00093
Received: 01 August 2011;
Accepted: 07 December 2011;
Published online: 26 December 2011.
Edited by:
Philipp Kapranov, St. Laurent Institute, USAReviewed by:
Philipp Kapranov, St. Laurent Institute, USAJohn Stanley Mattick, The University of Queensland, Australia
Piero Carninci, RIKEN, Japan
Copyright: © 2011 Liu, Zhao, Cui, Lin, Ding, Xin, Tan, Song, Yu and Hu. This is an open-access article distributed under the terms of the Creative Commons Attribution Non Commercial License, which permits non-commercial use, distribution, and reproduction in other forums, provided the original authors and source are credited.
*Correspondence: Shuhui Song, CAS Key Laboratory of Genome Sciences and Information, Beijing Institute of Genomics, Chinese Academy of Sciences, No.7, Beitucheng West Road, Chaoyang District, Beijing 100029, China. e-mail: songshh@big.ac.cn; Jun Yu, CAS Key Laboratory of Genome Sciences and Information, Beijing Institute of Genomics, Chinese Academy of Sciences, No.7, Beitucheng West Road, Chaoyang District, Beijing 100029, China. e-mail: junyu@big.ac.cn; Songnian Hu, CAS Key Laboratory of Genome Sciences and Information, Beijing Institute of Genomics, Chinese Academy of Sciences, No.7, Beitucheng West Road, Chaoyang District, Beijing 100029, China. e-mail: husn@big.ac.cn
†Wanfei Liu and Yuhui Zhao and Peng Cui have contributed equally to this work.