 María Muñoz1* Estefânia Alves1 Jordi Corominas2 Josep María Folch2 Joaquim Casellas2,3 Jose Luis Noguera3 Luis Silió1 Ana Isabel Fernández1
- 1 Departament Mejora Genética Animal, Instituto Nacional de Investigaciones Agrarias, Madrid, Spain
- 2 Departament de Ciència Animal i dels Aliments, Facultat de Veterinària, Universitat Autònoma de Barcelona, Bellaterra, Spain
- 3 Genètica i Millora Animal, IRTA Lleida, Lleida, Spain
Fatty acid composition is a critical aspect of pork because it affects sensorial and technological aspects of meat quality and it is relevant for human health. Previous studies identified significant QTLs in porcine chromosome 12 for fatty acid profile of back fat (BF) and intramuscular fat (IMF). In the present study, 374 SNPs mapped in SSC12 from the 60K Porcine SNP Beadchip were used. We have combined linkage and association analyses with expression data analysis in order to identify regions of SSC12 that could affect fatty acid composition of IMF in longissimus muscle. The QTL scan showed a region around the 60-cM position that significantly affects palmitic fatty acid and two related fatty acid indexes. The Iberian QTL allele increased the palmitic content (+2.6% of mean trait). This QTL does not match any of those reported in the previous study on fatty acid composition of BF, suggesting different genetic control acting at both tissues. The SNP association analyses showed significant associations with linolenic and palmitic acids besides several indexes. Among the polymorphisms that affect palmitic fatty acid and match the QTL region at 60 cM, there were three that mapped in the Phosphatidylcholine transfer protein (PCTP) gene and one in the Acetyl-CoA Carboxylase ∝ gene (ACACA). Interestingly one of the PCTP SNPs also affected significantly unsaturated and double bound indexes and the ratio between polyunsaturated/monounsaturated fatty acids. Differential expression was assessed on longissimus muscle conditional on the genotype of the QTL and on the most significant SNPs, according to the results obtained in the former analyses. Results from the microarray expression analyses, validated by RT-qPCR, showed that PCTP expression levels significantly vary depending on the QTL as well as on the own PCTP genotype. The results obtained with the different approaches point out the PCTP gene as a powerful candidate underlying the QTL for palmitic content.
Introduction
For several years, selection performed in most of the pig breeding schemes increased the efficiency of lean tissue deposition at the expense of back fat (BF) and intramuscular fat (IMF) content (De Vries and Kanis, 1994). These changes are unsuitable for eating quality of pig meat, because it is widely accepted that this latter largely depends on the amount and type of fat in meat (Webb and O’Neill, 2008). During the last decade, the selection objective of some pig breeding nuclei shifted toward dual goals combining carcass leanness and meat quality with a particular emphasis on IMF content (Lonergan et al., 2001; Schwab et al., 2009). Besides fat quantity, fatty acid composition is also a critical aspect of pork because it influences the sensorial and technological aspects of meat quality, such as juiciness, flavor, and tenderness (Wood et al., 2008).
The presence of a high content of polyunsaturated fatty acids (PUFA) is associated with low juiciness and can lead to abnormal flavor and rancidity in meat by excessive oxidation of free unsaturated fatty acids and production of undesirable volatile compounds (Lawrence and Fowler, 1997). Unsaturated fatty acids may undergo oxidation during the processing of dry-cured hams and lead to flavor, color, and texture deterioration (Ventanas et al., 2007). Dietary saturated fatty acids (SFA) are relevant nutrients for human health since some SFA with 14 or 16 carbon atoms chain length increase the level of plasmatic cholesterol and therefore the risk of cardiovascular disease (Lichtenstein, 2003). PUFA-rich diets play a cardiovascular health protective effect reducing cholesterol levels in blood, although nutritionists tend to focus more on the PUFA/SFA balance and the n−6/n−3 PUFA ratio rather than the content of particular fatty acids (Jimenez-Colmenero et al., 2010).
There are several studies reporting the role of genetic factors on fatty acid composition of porcine fats. Classical studies of QTL detection, using microsatellites genotyping data, have reported a few QTLs for BF and IMF fatty acid composition. QTLs affecting fatty acid composition of BF have been described on chromosomes 1, 2, 4, 5, 7, 8, 9, 10, 12, 15, and 17 (Kim et al., 2006; Nii et al., 2006). In addition, on porcine chromosomes 1, 3, 6, 7, 11, 12, 13, 14, 15, and 16, QTLs affecting IMF fatty acid composition have also been reported on different muscles from experimental and commercial pig populations (Sanchez et al., 2007; Quintanilla et al., 2011). Moreover, experimental research suggests that the genetic control of fatty acid composition might be different at diverse fat and muscle tissues (Muñoz et al., 2010; Uemoto et al., 2011). Among these results, SSC12 has been one of the porcine chromosomes showing consistent results. A previous work, focusing on SSC12 showed two QTLs affecting different BF fatty acids (Muñoz et al., 2007) and highly significant associations were found for two SNPs in the Acetyl-CoA Carboxylase ∝ gene (ACACA). Recent availability of a porcine genome wide SNP panel has prompted the genetic analysis of complex traits trough the use of high-density genotyping markers. In the current study, we have tried to identify regions in SSC12 influencing intramuscular fatty acid composition by using genotypes of SSC12 from high-density 60K porcine SNP Beadchip and combining linkage and association analyses approaches as well as expression data analyses.
Results and Discussion
QTL Detection
The total number of SNPs contained in the PorcineSNP60 Genotyping Bead Chip and potentially located in SSC12 was around 1,200 SNPs, following Sscrofa10 annotation. After filtering by genotype clustering quality, the number of available SNPs decreased to 614. In addition, SNPs with a minor allele frequency less than 0.15 and those that showed mapping errors (Muñoz et al., 2011) were also discarded. In total, the genotyping information from 374 SNPs was used for the different analyses performed in this study. The SSC12 linkage map constructed with the information of 374 SNPs displayed 91.46 cM length with a 0.25-cM averaged distance between markers.
In order to perform the QTL scan along SSC12 for IMF fatty acid composition traits (Table 1), three different models (a first one counting for additive and dominance effects, a second one counting only for additive effects and a last one counting only for dominant effects) were used and barely significant additive effects were detected. A QTL region affecting myristic, palmitic, and arachidonic fatty acids as well as the indexes unsaturation (UI), double bound index (DBI), SFA, and the ratio between polyunsaturated/monounsaturated fatty acids (PUFA/MUFA) was detected with nominal P-values lower than 0.005. This region, around the 60-cM position, was limited by ASGA0054160 and MARC0040388 probes (59–61 cM; Table 2). Another QTL region affecting gadoleic fatty acid with a nominal P-value lower than 0.005 was also identified around 17 cM (15–20 cM). Moreover, the likelihood profile across chromosome 12 (Figure 1) showed other highly significant regions around the 40- to 50-cM position for palmitic fatty acid, UI, and SFA. However, additional analyses considering two QTL in the statistical model did not reveal any significant evidence for a second QTL affecting these traits.
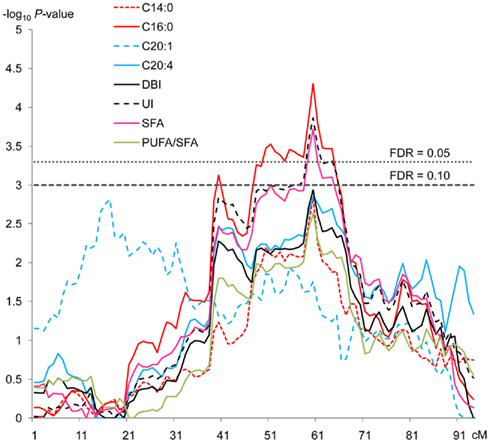
Figure 1. QTL significant profiles for different fatty acids and indexes across SSC12. QTL regions affecting C14:0, C16:0, C20:1, and C20:4 fatty acids and DBI, UI, SFA and PUFA/SFA indexes. For each test, on the y-axis are −log10 of P-values using a model of one QTL and on the x-axis, the position in cM. One of the cut off values is 3 representing a FDR = 0.10 and the other is 3.30 corresponding to a FDR = 0.05.
Table 1. Phenotypic data analyzed in F3, BC1, and BC2 generations from Iberian × Landrace intercross (IBMAP).
Table 2. Most relevant results of a QTL scan for fatty acid composition of intramuscular fat.
When we calculated the chromosome-wise thresholds for correcting multiple tests, only the QTL region for palmitic fatty acid, UI, and SFA at 60 cM remained significant at FDR < 0.05 (Table 2). The Q allele of this QTL region, which corresponds to the Iberian parental breed in accordance to our experimental design, increased the palmitic fatty acid content in a 2.6% of the mean trait. This is the most abundant of the SFA and therefore the reported effect is consistent with those observed on SFA and UI, equivalent to a +2.4 and −5.6% of their respective mean traits. These results are in accordance with phenotypical differences between Iberian and Landrace described by Serra et al. (1998). The relevance of these results comes from the important role of SFA and in particular of palmitic fatty acid in human health and in the organoleptic properties of pork. Palmitic acid is considered less hypercholesterolemic than other SFA with shorter carbon atoms chain length, such as lauric (C12:0) and myristic (C14:0; Li and Sinclair, 2002). An increase in the concentration of palmitic acid and therefore in monounsaturated fatty acids could be positively correlated with eating qualities (Cameron and Enser, 1991).
The QTL region detected in the present study does not match any of those reported in our previous study concerning BF fatty acid composition (Muñoz et al., 2007). This suggests that fatty acid composition could be under different genetic control at each tissue. Similar results were also reported by Uemoto et al. (2011) in a whole-genome QTL analysis for fatty acid composition and melting point of inner and outer subcutaneous fat, and inter and intramuscular fat in a purebred Duroc population. There are few published studies that focus on porcine QTL for fatty acid composition but even fewer that focus on fatty acid composition of IMF (Sanchez et al., 2007; Quintanilla et al., 2011; Uemoto et al., 2011). Nevertheless, the study performed by Quintanilla et al. (2011) in Duroc pigs revealed a significant QTL in SSC12 for SFA and another suggestive QTL for palmitic fatty acid in longissimus thoracis et lumborum muscles at position 72–73 cM. This QTL seems to be close to our QTL region, according to the lengths of the chromosome estimated in both studies. However, the study of Quintanilla et al. (2011) was conducted with a reduced number of markers, only four microsatellites, along the chromosome which probably did not allow them to reach higher statistical power and narrow confidence intervals. The QTL region identified in our study displayed a 95% CI of 3.00 cM that corresponds to only 0.99 Mb, according to the Sscrofa10 annotation. This narrow CI should facilitate the identification of the candidate gene to carry the causal mutation or mutations underlying this QTL.
SNP Association Analysis
The SNP association analyses based on the actual allele frequencies were carried out as an alternative approach to the classical QTL detection based on the parent line origin. The analyses were performed for the same traits that had previously been considered for the QTL detection (Table 2) and the same 374 selected SNPs were used. A first survey of the results showed a total of 253 associations between SNPs and IMF fatty acid percentages and indexes which displayed a nominal P-value lower than 0.05. Twenty SNPs showed association with linolenic acid (C18:3, n−3), 74 with palmitic acid (C16:0), 52 with DBI, 63 with UI, and 44 with PUFA/SFA (Tables A1– A5 in Appendix).
The associations detected for linolenic fatty acid content were the most statistically significants, in fact 11 out of 20 SNP associations reached a q-value lower than 0.05 (Table A1 in Appendix). It should be noted that 7 out of these 11 SNPs map very close to each other, around physical position 11–21 Mb on the chromosome (Figure 2), which indicates a genome region of around 10 Mb associated to this fatty acid that it was not detected in the previous linkage analyses. Linolenic fatty acid constitutes one of the most relevant PUFA as it is considered essential from a health point of view. This fatty acid cannot be de novo synthesized by monogastric animals but must be obtained from the diet. Therefore, the observed genetic association could be explained by an alteration in a gene related with the absorption, transformation or transport of linolenic acid in such a way this would result in an alteration of the amount of accumulated linolenic acid in IMF. Although seven out of the associated SNPs are located in annotated genes, none of them and neither the genes included in the reported SSC12 11–21 Mb region, were related with fatty acids transport or metabolism, except phosphatidylinositol transfer protein, cytoplasmic 1 gene (PITPNC1). PITPNC1, also known as M-rdgB beta, encodes for a protein that belongs to the Nir/rdgB family and is implicated in a broad spectrum of cellular functions such as regulation of lipid trafficking, metabolism, and signaling among others (Lev, 2004). However, the biological association between this gene and the linolenic fatty acid content is not easy to explain because protein domain/motifs within the RdgB proteins have been identified by bioinformatic analyses and in no case (with the possible exception of the PITP domain of DrdgBα) has their functional significance been experimentally tested (Trivedi and Padinjat, 2007).
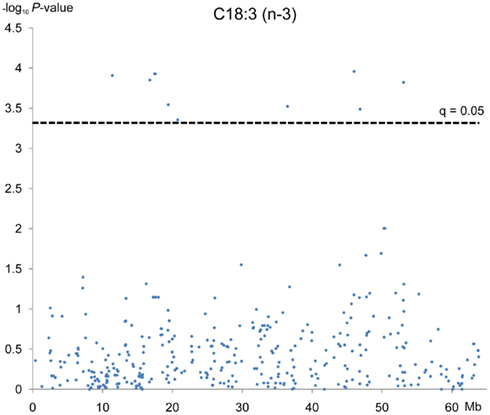
Figure 2. Association analyses between C18:3 fatty acid and 374 SNPs mapped in SSC12. Each dot represents one SNP. On the y-axis are −log10 of P-values and on the x-axis, the physical position of the SNP in the SSC12. Cut off value is 3.3 which represents a q = 0.10.
Out of the 74 SNPs associated with palmitic fatty acid, 49 of them reached a q-value lower than 0.10 (Table A2 in Appendix). The annotation of these 49 SNPs, following Sscrofa10, showed that 20 are located in intergenic regions, 28 on introns of annotated genes and one is not annotated. Since our linkage analysis revealed a significant QTL for palmitic percentage, we decided to center our attention on those SNPs with significant effects on the palmitic fatty acid percentage and that could be ascribed to genes mapped within or close to the QTL region that are potentially related with fatty acid metabolism. Twenty out of the 49 SNPs are mapped around the physical position of 30–40 Mb of chromosome SSC12. This would match the QTL region identified in the previous analyses, around the 60-cM position, assuming a recombination rate of 1.43 cM/Mb in SSC12 (Muñoz et al., 2011). Among the significant SNPs included in this interval with a significant effect on palmitic content, there were three (ASGA0054039 T > C, ASGA0054041 A > G, ASGA0054044 A > T) located in Phosphatidylcholine transfer protein (PCTP) gene and, another one (ALGA0066302 G > A) located in the Acetyl-CoA Carboxylase ∝ (ACACA) gene (Table 3; Figure 3). Both genes are related to lipid metabolism. PCTP, also known as STARD2, encodes for a protein that takes part in lipid and phospholipids transport, besides regulating genes like PPARG, PPARA, and CREBP that encode proteins involved in fatty acid metabolism (Wirtz, 1991; Kang et al., 2010a,b). The other gene, ACACA, encodes for an enzyme that catalyzes the carboxylation of acetyl-CoA to malonyl CoA and is the rate-limiting enzyme for long-chain fatty acid synthesis. These results indicate that both genes are good functional and positional candidate genes to carry the mutation or mutations underlying the QTL for IMF palmitic fatty acid percentage.
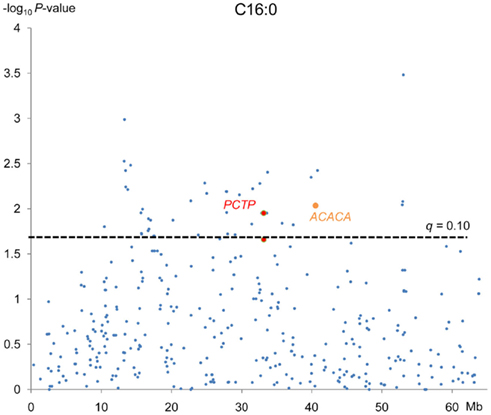
Figure 3. Association analyses between C18:3 (n−3) fatty acid and 374 SNPs mapped in SSC12. Each dot represents one SNP. On the y-axis are −log10 of P-values and on the x-axis, the physical position of the SNP in the SSC12. Cut off value is 1.6 which represents a q = 0.10.
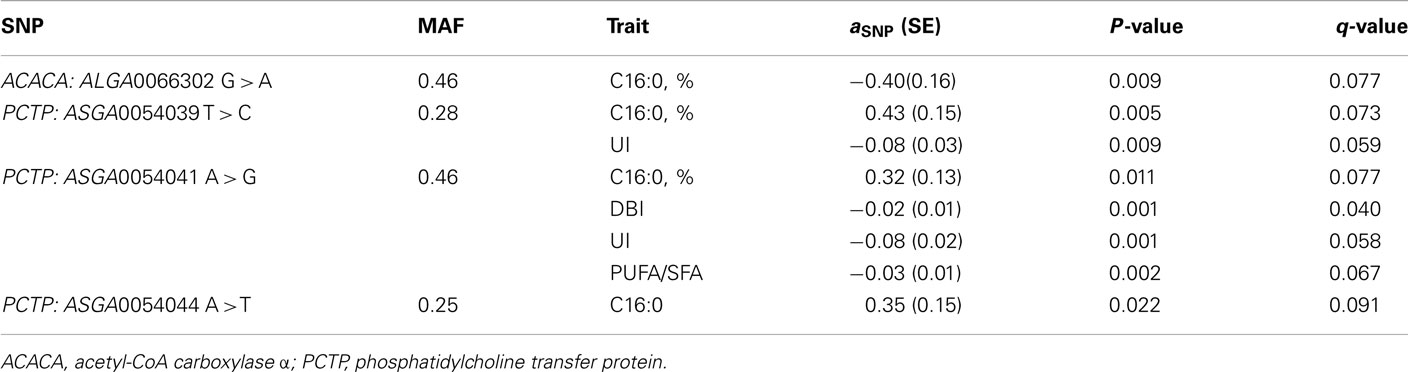
Table 3. Association analyses: significant effects of SNPs within candidate genes in the QTL region.
The double bond index (DBI) is a simple weighted average of the number of double bonds per fatty acid molecule, which partially reflects, in other way, the fatty acid composition. Out of the 52 SNPs associated with DBI, seven reached a q-value lower than 0.05 and six of them matched the previously mentioned SNPs that were significantly associated with palmitic fatty acid (Table A3 in Appendix). None of the seven SNPs map in genes related to fatty acid metabolism except one (ASGA0054041), located in the PCTP gene. This is also one of the SNPs that is associated with palmitic fatty acid in the above association analysis although with an opposite effect. The ASGA0054041G allele leads to a decrease of 0.02 units on the magnitude of double bonds, which in turn is consistent with the 0.32% increase observed on saturated palmitic acid (Table 3).
Seven out of the 63 SNPs associated with UI reached a q-value lower than 0.10 (Table A4 in Appendix) and six out of them match the SNPs showing association with DBI (q-value < 0.05). They included again the ASGA0054041 SNP located in the PCTP gene, which showed a significant effect on this index as well consistently with the effect observed on palmitic fatty acid. The ASGA0054041G allele leads to a reduction of 0.08 units of the unsaturation index.
Finally, the analyses on the PUFA/SFA index showed that 7 out of the 44 SNP associations overcame the threshold q-value of 0.10 (Table A5 in Appendix), the same seven SNPs that were associated with UI. The ASGA0054041G allele leads to a reduction of the ratio of 0.03 units as it was supposed to occur upon the observed effects on palmitic, DBI, and UI.
These results indicate that the effects on the fatty acid indexes are a direct consequence of the effect detected on the palmitic fatty acid, the most abundant SFA. Moreover, the overall results obtained for palmitic fatty acid, DBI, UI, and PUFA/SFA indexes support the relevance of PCTP as the main candidate gene to regulate the palmitic fatty acid content in IMF.
Marker-Assisted Association Tests
The classical QTL detection and the association analyses conducted in the present study show complementary results. A highly significant QTL for IMF palmitic fatty acid content has been identified by linkage analysis around position 30 Mb on SSC12, and the standard association analyses have detected effects of SNPs from two candidate genes mapping in this chromosomal region (ACACA and PCTP) on palmitic fatty acid content and other related indices (UI, DBI, PUFA/SFA). In addition, the association analyses have revealed another chromosomal region, around 11–21 Mb on SSC12, associated with the linolenic fatty acid content and not identified previously by the linkage analyses, although there is not a clear candidate gene to underlay this effect on IMF linolenic acid.
The aim of positional candidate analyses is to verify whether a particular mutation underlies or, at least, is closely linked to the QTL. Experimental designs based on intercrosses between divergent lines have a great power to detect QTL provided by extensive linkage disequilibrium (LD) generated by the cross but they also make it difficult to distinguish between causative and neutral mutations (Varona et al., 2005). Therefore, we performed additional analyses using a model which jointly tests QTL and SNP of candidate genes, in order to reduce the rate of spurious associations. Zhao et al. (2003) outlined that this marker-assisted association test can exclude, in some cases, the confounding effect of the extensive between-breed LD characteristic of intercrosses.
The three SNPs (ASGA0054039 T > C, ASGA0054041 A > G, ASGA0054044 A > T) of the PCTP gene and the one located in the ACACA gene (ALGA0066302 G > A) were tested using this model for the traits showing significant associations. These mutations display a similar frequency pattern in the parental breeds: fixation of one allele in the Iberian line and segregation of the other two alleles in the Landrace breed, with frequencies of the alternative allele ranging from 0.42 to 0.75. The results of these additional analyses are presented in Table 4. The significance of all the SNP effects was increased compared to the results of standard association analyses. In contrast, the results of the QTL scan (Table 2) shows that the inclusion in the model of the ACACA SNP reduced the significance of QTL effect on C16:0 (dropped from 10−5 to 10−3). Similarly, PCTP SNPs effects reduced the significance of QTL effects for all the analyzed traits. The QTL for PUFA/SFA disappeared when the PCTP: ASGA0054041 A > G polymorphism was included in the model (Figure 4).
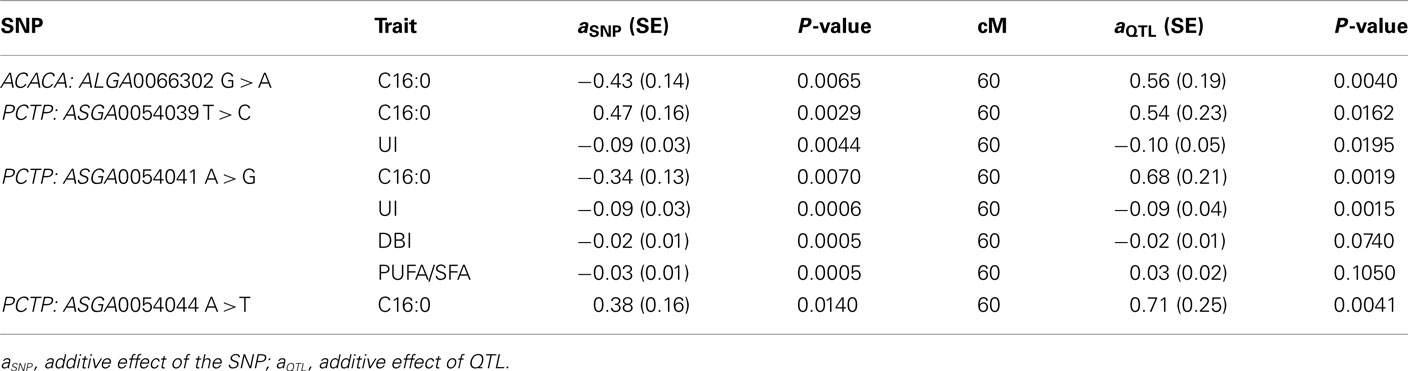
Table 4. Marker-assisted association tests: Results for ACACA and PCTP SNPs significantly associated for fatty acid composition in previous analyses.
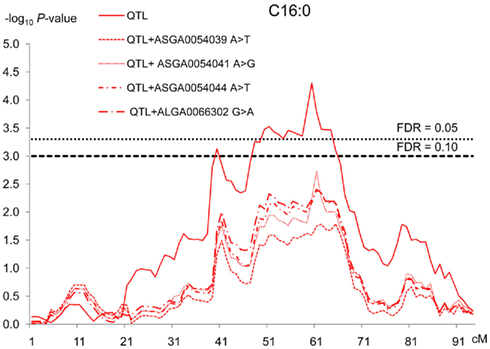
Figure 4. QTLs significance profiles for C16:0 fatty acid across SSC12 using different models. For each test, on the y-axis are −log10 of P-values and on the x-axis, the position in cM. Each line represents one QTL test using a different model. The continuous red line represents the test using a model of one QTL and the different red dash lines represent different tests using the model of marker-assisted association with four SNPs, three of them located within PCTP gene (ASGA0054039 T > C, ASGA0054041A > G, ASGA0054044A > T) and one in ACACA gene (ALGA0066302G > A).
Moreover, high LD between the PCTP SNPs was observed (Figure 5) using Haploview software v4.2 (Barrett et al., 2005). Three different haplotypes could be distinguished: TAA, CGT and CAT with frequencies of 0.40, 0.44, and 0.16 respectively. Additional association analyses with both standard animal and marker-assisted models were carried out for these haplotypes and the palmitic content. The results showed that although haplotypes were significantly associated with the trait, the significance was lower than those performed with the individual SNPs. Moreover, the analysis with the joint QTL and haplotype model showed that the inclusion in the model of the haplotype effects reduced the significance of QTL effects much less than those observed with the individual SNPs. These results suggest a close linkage of these SNPs to the causative mutation that could be particularly remarkable for the ASGA0054039 SNP of the PCTP gene because the magnitude of the SNP effect on C16:0 is the highest and the SNP inclusion in the marker-assisted test produces a greater decrease in the LR maximum value of the QTL than the other SNPs tested (Table 4).
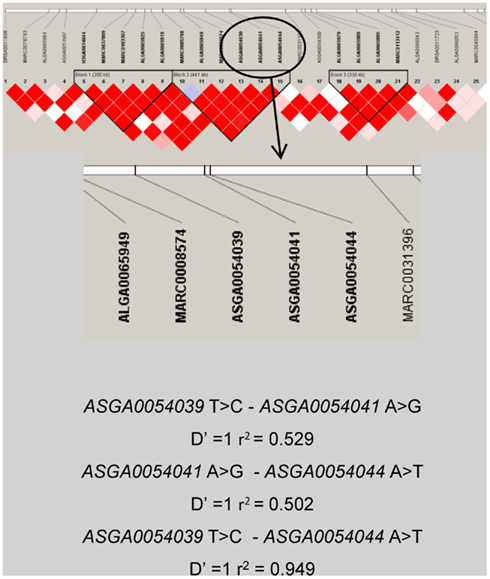
Figure 5. Haplotype diagram of the region located between 59.4 and 61.29 cM. Description of linkage block of PCTP SNPs (ASGA0054039 T > C, ASGA0054041A > G, ASGA0054044A > T) is described below.
These results contrast with those obtained in our previous study conducted on BF where the most significant associations were found for two ACACA SNPs with stearic, palmitoleic, and vaccenic fatty acid concentrations (Muñoz et al., 2007). Gallardo et al. (2009) also detected significant associations between two linked ACACA SNPs and percentages of saturated (myristic, palmitic, and stearic) and polyunsaturated (linoleic) fatty acids in the longissimus thoracis and lumborum muscle of Duroc pigs. These results support the hypothesis that there is a different genetic control of fatty acid composition acting at IMF and BF tissues. This is the first time that significant and consistent effects on the IMF fatty acid composition are described for the PCTP gene.
Gene Expression Analysis
The combination of gene expression with linkage and association data offers new options to maximize the success in the selection of candidate genes. In the present study, we have evaluated the longissimus muscle differential gene expression following two strategies: (a) conditional on the QTL genotype at the 60-cM genetic position of SSC12, and (b) conditional on the genotype of the most relevant SNPs according to the previous analyses.
In the first analysis, individuals were classified into two groups based on their probability of being Qq or qq for the QTL detected at 60 cM in SSC12. All the animals could be classified in one of the groups. This was considered a discontinuous effect in the statistical analysis model with two levels: (1) if the probability of being Qq was >0.9 and (2) if the probability of being qq was >0.9. Note that the gene expression analyses were carried out in samples of longissimus muscle from the BC2 pigs, which corresponds to the backcross of F1 animals (Qq) with Landrace (qq), therefore only Qq and qq genotypes could be used. A total of 18 differentially expressed (DE) probes were detected with posterior probability (PP) lower than 0.001 and an expression ratio over 1.1 (Table A6 in Appendix). All except one of the DE probes were annotated to known genes; 11 out of them were assigned to SSC12. Moreover, three of these genes map close or within the CI of the QTL, and one of them, the PCTP gene, is related to the fatty acid metabolism. This PCTP probe (Ssc.22988.1.S1_at) displayed an expression ratio between Qq and qq genotypes of 0.77.
The second strategy for the analysis of the gene expression was based on the genotype of one SNP located in the ACACA gene (ALGA0066302 G > A) and three SNPs in the PCTP gene (ASGA0054039 T > C, ASGA0054041A > G, ASGA0054044A > T). The genotype was introduced as a covariate into the statistical model that assumes values 0, 1, or 2 for the number of allelic copies. The analyses of the differential gene expression conditional on the ACACA SNP (ALGA0066302 G > A) showed 13 DE probes with a PP < 0.001 and an expression ratio over 1.1. All the probes were annotated but none of the genes have been biologically related with fatty acid metabolism (Tables A7 in Appendix and Table 5).
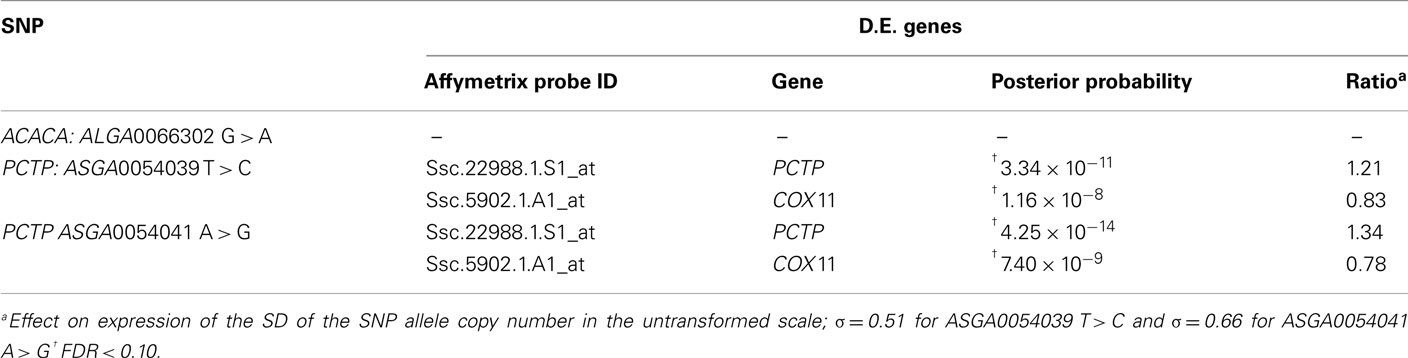
Table 5. Relevant DE genes on longissimu s muscle according to the SNP genotypes of ACACA and PCTP genes affecting palmitic acid content.
The analyses of the differential gene expression conditional on the three PCTP SNPs showed consistent results. Note that, the SNPs PCTP ASGA0054044A > T and ASGA54039T > C appeared cosegregating in the BC2 animals used for the expression analyses. The analysis conditional on the PCTP ASGA54039C allele copy number showed seven DE probes with PP < 0.001 and an expression ratio over 1.1 (Table A8 in Appendix). All the seven DE probes could be annotated and mapped. Among the identified genes, two map on SSC12 close to the CI of the QTL at 60 cM, which were Cytochrome C oxidase assembly homolog gene (COX11) and again the PCTP gene. Moreover, the PCTP gene resulted the most significantly DE. The expression ratio in the untransformed scale of 1.21 for PCTP transcript indicates an increase in expression of 21% produced by 1 SD (σ = 0.51 copies), therefore one copy of the ASGA54039C allele would lead to an increased expression of up to 41% (Table 5).
Similar results were obtained in the analysis performed according to the PCTP ASGA54041G allele copy number. A total of 21 probes showed differential expression with PP < 0.001 and an expression ratio over 1.1 (Table A9 in Appendix). All the probes could be annotated and six genes were assigned to SSC12, from which five map on the region close to CI of the QTL at 60 cM. Again PCTP and COX11 probes resulted the most significantly DE (Table 5). The expression ratio of 1.34 for the PCTP transcript indicates an increase of its expression (+31%) produced by 1 SD (σ = 0.66 copies), therefore one copy of the ASGA54041G allele would lead to an increased expression of up to 50% and two copies would duplicate the effect (Table 5).
In human both genes, PCTP and COX11, map very close to each other and also to a third gene, the hepatic leukemia factor (HLF) that codes the transcription factor HLF. Flowers et al. (2008) compared the DE of healthy mice to that of mice deficient in stearoyl-CoA desaturase-1 (Scd1) and observed that the latter displayed reduced expression levels for genes involved in detoxification and several facets of fatty acid metabolism including biosynthesis, elongation, desaturation, oxidation, transport, and ketogenesis. Among them, the HLF gene was one of the repressed genes. In addition, it is known that the coexpression of closing mapping genes involved in a similar mechanism could indicate a participation of a shared common transcription factor in the regulation of such genes. Our expression results could indicate that a common expression regulation mechanism, as a transcription factor such as HLF, could regulate both PCTP and COX11 gene expressions.
In order to validate the results of the microarray analysis, PCTP gene expression was quantified by using Real Time PCR in 28 BC2 pigs classified according to their genotypes for ASGA54039T > C and ASGA54041A > G SNPs. The three genotypes of ASGA54041A > G were represented in the sample set but for ASGA54039T > C only CC homozygous and CT heterozygous were available. The analysis of the expression data confirmed the results obtained with the microarray assay. The expression of the PCTP transcript was higher in ASGA54039CC animals than in CT ones (P < 0.05). Moreover, the analysis conditional on the ASGA54041A > G genotype revealed an increase of the PCTP transcript expression with each copy of the G allele (P < 0.001; Figure 6).
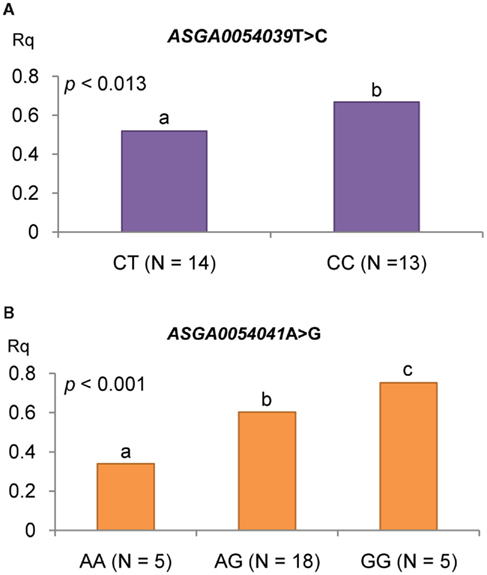
Figure 6. Phosphatidylcholine transfer protein gene expression using RT-qPCR conditional on the genotypes of PCTP SNPs (ASGA0054039 T > C, ASGA0054041A > G). PCTP gene expression conditional on genotypes of (A) ASGA0054039 T > C and (B) ASGA0054041 A > G).
In the association analysis, the false discovery rate applied for correcting multiple test only took into account the number of tested SNPs, although a more rigorous analysis should also consider the number of analyzed traits, which are very correlated. Nevertheless, the magnitude of the observed effects of PCTP and ACACA SNPs, let us to perform further analyses that supported the reliability of our analyses. The joint results obtained from the association and expression analyses point out the PCTP gene as a powerful gene to carry the mutation underlying the QTL detected in the present study for IMF palmitic fatty acid content at 60 cM in SSC12. Since all the analyzed PCTP SNPs map in intronic regions it is unlikely that they have any functional effect. However we cannot discard the possibility that intronic polymorphisms could affect transcriptional regulation if they reside in enhancer regions or might create alternative splicing sites and thereby change protein structure or function if they were near exon–intron boundaries. Another possibility, according to the expression results, may be that the causal mutation, in LD with the analyzed SNPs, would be localized in a nearby regulatory element shared by both PCTP and COX11 genes, such as the HLF transcription factor. In any case, a comprehensive analysis of the PCTP gene including characterization of his coding, untranslated, and promoters/enhancers regions is needed in order to identify the causal mutation underlying the QTL affecting IMF fatty acid composition.
Conclusion
Different approaches have been conducted employing the SNPs information of SSC12 contained in the high-density 60K porcine SNP array with the aim of identifying SSC12 regions affecting the IMF fatty acid composition. The different methods have yielded consistent results. A significant QTL at the 60-cM position of SSC12 has been detected, mainly affecting the IMF palmitic fatty acid (C16:0) percentage. This QTL does not match any of the ones reported in our own previous study concerning BF fatty acid composition, suggesting different genetic control mechanism acting at both tissues. The overall association analyses results suggest that the PCTP gene is a powerful candidate to carry the mutation underlying this QTL. Particularly remarkable is the significant association of the PCTP ASGA0054039 SNP with palmitic fatty acid percentage. Gene expression analyses conditional on the QTL genotypes as well as conditional on PCTP SNP genotypes have revealed differential expression of the own PCTP transcript. Since all the analyzed PCTP SNPs are located in intronic regions it is unlikely that they have any functional effect, therefore the potential causative mutation would probably be located in a regulatory region of PCTP gene.
Materials and Methods
Animal Samples and Genotyping
Animals from an experimental cross of Iberian × Landrace pig lines, known as IBMAP material (Ovilo et al., 2000, 2010), were used. Animal management and experimental assays were performed with standard procedures following internationally recognized guidelines and with the approval of the funding institutions ethics committee. The population was established from 3 F0 Iberian sires and 30 F0 Landrace dams and includes 70 F1, 403 F2, 56 F3, and 227 individuals from two backcrosses (79 from BC1 and 148 from BC2). Intramuscular fatty acid composition records were measured by gas chromatography in 200 g of longissimus dorsi samples taken from F3 and backcrosses animals (Table 1). Indexes (UI, AC, DBI, PI, and C20:4/C18:2 ratio) were calculated as described in Pamplona et al. (1998). A total number of 416 animals, from 62 families, belonging to the F3 and backcross generations of the IBMAP experimental cross were genotyped with the PorcineSNP60 Genotyping Bead Chip (Illumina) using the Infinium HD Assay Ultra protocol (Illumina). Raw individual data had high-genotyping quality (call rate > 0.99). The SNPs with call rates less than 0.85, those with a minor allele frequency less than 0.15, those located in sex chromosomes or those not mapped in the Sscrofa10 assembly were removed. Genotype quality filtering was performed using GenomeStudio software and the SNPs selection, filtering by allele frequency and position was done using PLINK software (Purcell et al., 2007).
Linkage Mapping and QTL Detection
A sex-averaged SSC12 linkage map was constructed using the option Fixed of the updated CRI-MAP v2.5021 (Green et al., 1990) as described in Muñoz et al. (2011). The order given to the SNPs within the chromosome followed the physical order of the Sscrofa10 assembly. QTL scanning was performed with the following models:
where yi is the i-th individual record; batch is the slaughter batch (eight in total); βc is a covariate coefficient with ci being carcass weight; aQTL is the QTL additive effect; Pai is the additive coefficient calculated as Pai = Pr(QQ) − Pr(qq), the probability of the i-th individual being homozygous for alleles of Iberian origin minus the probability of being homozygous of alleles of Landrace origin; dQTL is the QTL dominant effect; Pdi is the additive dominant calculated as Pdi = Pr(Qq); ui is the infinitesimal genetic effect; and ei is the random residual. A similar model fitting two different QTL effects was used for performing complementary analyses to check the hypothesis of a second QTL mapping in the same chromosome:

All the statistical analyses were performed using the Qxpak v.5.1 software (Perez-Enciso and Misztal, 2011). A total number of 374 markers were employed for calculating Pai and Pdi coefficients. Likelihood ratio tests (LRT) were calculated comparing the full model and a reduced model without the corresponding QTL effect. The nominal P-values were calculated assuming a χ2 distribution of the LRT with the degrees of freedom given by the difference between the number of estimated parameters in the reduced and full models. The procedure of Benjamini and Yekutieli (2005) based on the P-values of the multiple tests was used for controlling the false discovery rate (FDR) at a desired level. As it is recommended for QTL analysis, the chromosome positions with FDR < 0.05 were considered harboring significant QTL and those with FDR < 0.10 would fit suggestive QTL.
SNP Association Analysis
For the association analysis of the 374 available markers, the following standard animal model was used:

where λik is a vector 374 × 1 that includes an indicative variable related with the number of copies of one of the alleles of the kth SNP, which takes values of 1 or −1 when the i-th animal was homozygous for each allele or 0 if the animal was heterozygous; gk represented the additive effect of kth SNP. Multiple testing was performed and the number of tests (374) was the same as the number of analyzed SNPs. False discovery rate (FDR) was applied for correcting the multiple testing. The Q-value 1.0 software (Storey and Tibshirani, 2003) was used to calculate a FDR-based q-value in order to measure the statistical significance at the chromosome-wide level. The cut off of significant association at chromosome level was set at q-value ≤ 0.10. Additional analyses were performed for specific SNPs with significant association results in the previous analysis, using the following model of marker-assisted association test proposed by Zhao et al. (2003) in which both the QTL and SNP effects are considered:

Likelihood ratio tests for QTL and SNP effects were separately calculated comparing the appropriate full and reduced models. The SNPs significantly associated were mapped in the Sscrofa10 assembly. Gene annotations were retrieved from the Ensembl Genes 62 Database and confirmed after BLAST search against the human database2.
Microarray Data Analysis
Expression data were obtained of longissimus dorsi muscle samples from 100 RC2 individuals, using GeneChip Porcine Genome arrays (Affymetrix, Boston, MA, USA). Total RNA extraction, microarray hybridization, and scanning were performed according to Affymetrix protocols by Casellas et al. (2011). Expression data were generated with Affymetrix GCOS 1.1.1 software. Microarray data quality evaluation was carried out with AffyPLM software (Bioconductor)3. Data normalization was conducted to reduce technical variations between chips through Gene Chip Robust Multi-Array Average algorithm using BRB-Array Tools software (version 3.6.0)4. Normalized microarray expression data (background corrected and base-2 logarithmic-transformed) were analyzed through Bayesian inference using the GEAMM v.1.6 program (Casellas et al., 2008). The following model was used for searching the effects on expression data of different QTL or SNP genotypes:
where y (pq × 1 elements) is the vector of gene expression data sorted by array (q = 100) and probe within array (P = 24,123), and influenced by the overall effect of each array (a), as well as discrete (Di), and continuous (βj) within-probe effects both with dimensions 1 × P. Sex and batch discrete effects and carcass weight continuous effect are fitted in the model for all the performed analyses. Different classifications were adopted conditional on the QTL genotypes (as discrete effect) and on SNP genotypes (as continuous effect with values 0, 1, or 2 according to the number of copies of the most frequent allele). A priori distribution for Di and βj are assumed multivariate normal and a priori distributions for the remaining parameters in the model are assumed flat. All the unknowns in the model were sampled from their joint posterior distribution by Gibbs sampling (Gelfand and Smith, 1990). Additional details of the performed Bayesian procedure are reported by Casellas et al. (2008).
Inferences were made on the probe-specific difference between Di levels or on the regression coefficients in βj from the appropriate posterior distributions summarized by its mean, SD, and PP above (negative mean) or below (positive mean) zero. Posterior probabilities were treated as P-values for calculating their maximum value under multiple testing within the FDR approach of Benjamini and Hochberg (1995). The probes that displayed FDR < 0.10, PP < 0.001, and whose expression ratio in the untransformed scale was over 1.10 were assumed to present differential expression.
Expression probe annotation was conducted using the updated data file of Tsai et al. (2006). A functional assignation of the DE genes was performed using gene ontology (GO) information. The resulting list was assessed through database for annotation, visualization, and integrated discovery (DAVID)5 in order to investigate their functional implications.
RNA Isolation and Quantitative Real-Time PCR Analysis
Longissimus dorsi samples were used to obtain total RNA using the RiboPure™ RNA isolation kit (Ambion, Austin, TX, USA) following the manufacturer’s recommendations. RNA obtained was quantified using NanoDrop equipment (NanoDrop Technologies, Wilmington, DE, USA) and RNA quality was assessed with an Agilent bioanalyzer device (Agilent Technologies, Palo Alto, CA, USA). The RNA integrity number (RIN) values obtained were in the range of 8.0–9.0, assuring the homogeneity and high quality of the samples.
Quantitative Real Time PCR was used to validate microarray expression data of PCTP gene. A subset of 28 individuals was analyzed. First-strand cDNA synthesis was carried out with Superscript II (Invitrogen, Carlsbad, CA, USA) and random hexamers in a total volume of 20 μl containing 1 μg of total RNA and following the supplier’s instructions. Quantitative Real Time PCR was run on an MX3000P sequence detector (Stratagene, La Jolla, CA, USA) using cycling parameters defined by the manufacturer. Reactions consisted of 1× SYBR Green PCR master mix (Takara), 0.15 mM of each primer (Forward 5′-GTTGGGGATGTTGAAGGGATAAT-3′; Reverse 5′-GAGAAAAGTAGGACACGGGAAGC-3′), 2.5 μl of 1/20 dilution cDNA, and 0.4 μl of ROXII reference dye in a reaction volume of 20 μl. A no-template control was also included. Cycling conditions were 95° for 10 min followed by 40 cycles of 95° (15 s) and 60° (1 min). Finally a dissociation curve to test PCR specificity was generated by one cycle at 95° (15 s), 60° (1 min), and was ramped up (0.01°/s) to 95°. Data were analyzed with MxPro software (Stratagene). All points and samples were run in triplicate as technical replicates and dissociation curves were carried out for each individual replicate. Specific amplification was confirmed by single peaks observation on dissociation curves. PCR efficiency of each gene was estimated by standard curve calculation using four points of 10-fold cDNA serial dilutions. All PCR efficiencies were greater than 95%. Ct values were transformed to quantities using the comparative Ct method, setting the highest relative quantities for each gene to 1 (Qty = 10−ΔCt/slope). Data normalization was carried out using Glyceraldehyde-3-Phosphate Dehydrogenase (GAPDH) and Beta-2 Microglobulin (B2M) as reference genes. Gene expression relative measures obtained by RT-qPCR were analyzed conditional on genotypes of the PCTP ASGA0054039T > C and ASGA0054041A > G SNPs with a t-test.
Conflict of Interest Statement
The authors declare that the research was conducted in the absence of any commercial or financial relationships that could be construed as a potential conflict of interest.
Acknowledgments
This work was funded by MICINN projects AGL2008-04818-C03/GAN and CSD2007-00036. María Muñoz was funded by a FPI PhD grant from the INIA institution. J. Corominas was funded by a FPI PhD grant from the Spanish Ministerio de Educación (BES-2009-018223). We want to thank Dr. Martien Groenen (Wageningen, The Netherlands) for the SNP annotation on the Sscrofa10 assembly, and to Anna Mercadé and Anna Castelló for their technical assistance with the SNPs genotyping. We gratefully acknowledge Rita Benítez and Yolanda Nuñez for technical support and Wendy Raw for her valuable commentaries.
Footnotes
References
Barrett, J. C., Fry, B., Maller, J., and Daly, M. J. (2005). Haploview: analysis and visualization of LD and haplotype maps. Bioinformatics 21, 263–265.
Benjamini, Y., and Hochberg, Y. (1995). Controlling the false discovery rate: a practical and powerful approach to multiple testing. J. R. Stat. Soc. B Stat. Methodol. 57, 289–300.
Benjamini, Y., and Yekutieli, D. (2005). Quantitative trait loci analysis using the false discovery rate. Genetics 171, 783–790.
Cameron, N. D., and Enser, M. B. (1991). Fatty-acid composition of lipid in longissimus-dorsi muscle of Duroc and British Landrace pigs and its relationship with eating quality. Meat Sci. 29, 295–307.
Casellas, J., Ibanez-Escriche, N., Martinez-Giner, M., and Varona, L. (2008). GEAMM v.1.4: a versatile program for mixed model analysis of gene expression data. Anim. Genet. 39, 89–90.
Casellas, J., Noguera, J. L., Pena, R. N., Folch, J. M., Muñoz, M., and Ibáñez-Escriche, N. (2011). “T27 growth-related differential gene expression in the longissimusthoracis muscle of Iberian × Landrace back-crossed pigs,” in American Society of Animal Science (ASAS) (New Orleans: American Society of Animal Science).
De Vries, A. G., and Kanis, E. (1994). “Selection for efficiency of lean tissue deposition in pigs,” in Principles of Pig Science, eds D. J. A. Cole, J. Wiseman, and M. A. Varley (Nottingham: Nottingham University Press), 23–41.
Flowers, M. T., Keller, M. P., Choi, Y., Lan, H., Kendziorski, C., Ntambi, J. M., and Attie, A. D. (2008). Liver gene expression analysis reveals endoplasmic reticulum stress and metabolic dysfunction in SCD1-deficient mice fed a very low-fat diet. Physiol. Genomics 33, 361–372.
Gallardo, D., Quintanilla, R., Varona, L., Diaz, I., Ramirez, O., Pena, R. N., and Amills, M. (2009). Polymorphism of the pig acetyl-coenzyme A carboxylase alpha gene is associated with fatty acid composition in a Duroc commercial line. Anim. Genet. 40, 410–417.
Gelfand, A. E., and Smith, A. F. M. (1990). Sampling based approaches to calculating marginal densities. J. Am. Stat. Assoc. 85, 398–409.
Green, P., Falls, K., and Crooks, S. (1990). Documentation for Crimap. Available at: http://linkage.Rockefeller.Edu/soft/crimap (unpublished mimeo).
Jimenez-Colmenero, F., Ventanas, J., and Toldra, F. (2010). Nutritional composition of dry-cured ham and its role in a healthy diet. Meat Sci. 84, 585–593.
Kang, H. W., Kanno, K., Scapa, E. F., and Cohen, D. E. (2010a). Regulatory role for phosphatidylcholine transfer protein/StarD2 in the metabolic response to peroxisome proliferator activated receptor alpha (PPARalpha). Biochim. Biophys. Acta 1801, 496–502.
Kang, H. W., Wei, J., and Cohen, D. E. (2010b). PC-TP/StARD2: of membranes and metabolism. Trends Endocrinol. Metab. 21, 449–456.
Kim, J. H., Lim, H. T., Park, E. W., Ovilo, C., Lee, J. H., and Jeon, J. T. (2006). A gene-based radiation hybrid map of the pig chromosome 6q32 region associated with a QTL for fat deposition traits. Anim. Genet. 37, 522–523.
Lev, S. (2004). The role of the Nir/rdgB protein family in membrane trafficking and cytoskeleton remodeling. Exp. Cell Res. 297, 1–10.
Li, D., and Sinclair, A. J. (2002). Macronutrient innovations: the role of fats and sterols in human health. Asia Pac. J. Clin. Nutr. 11, S155–S162.
Lichtenstein, A. H. (2003). Dietary fat and cardiovascular disease risk: quantity or quality? J. Womens Health (Larchmt.) 12, 109–114.
Lonergan, S. M., Huff-Lonergan, E., Rowe, L. J., Kuhlers, D. L., and Jungst, S. B. (2001). Selection for lean growth efficiency in Duroc pigs influences pork quality. J. Anim. Sci. 79, 2075–2085.
Muñoz, G., Alves, E., Fernandez, A., Ovilo, C., Barragan, C., Estelle, J., Quintanilla, R., Folch, J. M., Silio, L., Rodriguez, M. C., and Fernandez, A. I. (2007). QTL detection on porcine chromosome 12 for fatty-acid composition and association analyses of the fatty acid synthase, gastric inhibitory polypeptide and acetyl-coenzyme A carboxylase alpha genes. Anim. Genet. 38, 639–646.
Muñoz, M., Fernandez, A. I., Rodriguez, C., Barragan, C., Folch, J. M., Noguera, J. L., Silio, L., and Alves, E. (2010). “QTL scan in SSC12 for fatty acid composition of intramuscular fat using combined information of candidate genes, microsatellites and SNP chip,” in 32 Conference of International Society of Animal Genetics, Edimburgh.
Muñoz, M., Alves, E., Ramayo-Caldas, Y., Casellas, J., Rodriguez, C., Folch, J. M., Silió, L., and Fernández, A. I. (2011). Recombination rates across porcine autosomes inferred from high-density linkage maps. Anim. Genet. doi: 10.1111/j.1365-2052.2011.02301.x
Nii, M., Hayashi, T., Tani, F., Niki, A., Mori, N., Fujishima-Kanaya, N., Komatsu, M., Aikawa, K., Awata, T., and Mikawa, S. (2006). Quantitative trait loci mapping for fatty acid composition traits in perirenal and back fat using a Japanese wild boar × large white intercross. Anim. Genet. 37, 342–347.
Ovilo, C., Fernandez, A., Fernandez, A. I., Folch, J. M., Varona, L., Benitez, R., Nunez, Y., Rodriguez, C., and Silio, L. (2010). Hypothalamic expression of porcine leptin receptor (LEPR), neuropeptide Y (NPY), and cocaine- and amphetamine-regulated transcript (CART) genes is influenced by LEPR genotype. Mamm. Genome 21, 583–591.
Ovilo, C., Perez-Enciso, M., Barragan, C., Clop, A., Rodriquez, C., Oliver, M. A., Toro, M. A., and Noruera, J. L. (2000). A QTL for intramuscular fat and back fat thickness is located on porcine chromosome 6. Mamm. Genome 11, 344–346.
Pamplona, R., Portero-Otin, M., Riba, D., Ruiz, C., Prat, J., Bellmunt, M. J., and Barja, G. (1998). Mitochondrial membrane peroxidizability index is inversely related to maximum life span in mammals. J. Lipid Res. 39, 1989–1994.
Perez-Enciso, M., and Misztal, I. (2011). Qxpak.5: old mixed model solutions for new genomics problems. BMC Bioinformatics 12, 202. doi: 10.1186/1471-2105-12-202
Purcell, S., Neale, B., Todd-Brown, K., Thomas, L., Ferreira, M. A., Bender, D., Maller, J., Sklar, P., De Bakker, P. I., Daly, M. J., and Sham, P. C. (2007). PLINK: a tool set for whole-genome association and population-based linkage analyses. Am. J. Hum. Genet. 81, 559–575.
Quintanilla, R., Pena, R. N., Gallardo, D., Canovas, A., Ramirez, O., Diaz, I., Noguera, J. L., and Amills, M. (2011). Porcine intramuscular fat content and composition are regulated by quantitative trait loci with muscle-specific effects. J. Anim. Sci. 89, 2963–2971.
Sanchez, M. P., Iannuccelli, N., Basso, B., Bidanel, J. P., Billon, Y., Gandemer, G., Gilbert, H., Larzul, C., Legault, C., Riquet, J., Milan, D., and Le Roy, P. (2007). Identification of QTL with effects on intramuscular fat content and fatty acid composition in a Duroc × Large White cross. BMC Genet. 8, 55. doi: 10.1186/1471-2156-8-55
Schwab, C. R., Mote, B. E., Du, Z. Q., Amoako, R., Baas, T. J., and Rothschild, M. F. (2009). An evaluation of four candidate genes for use in selection programmes aimed at increased intramuscular fat in Duroc swine. J. Anim. Breed. Genet. 126, 228–236.
Serra, X., Gil, F., Pérez-Enciso, M., Oliver, M. A., Vázquez, J. M., Gispert, M., Díaz, I., Moreno, F., Latorre, R., and Noguera, J. L. (1998). A comparision of carcass, meat quality and histochemical characterisitics of Iberian (Guadyerbas line) and Landrace pigs. Livest. Prod. Sci. 56, 215–223.
Storey, J. D., and Tibshirani, R. (2003). Statistical significance for genome wide studies. Proc. Natl. Acad. Sci. U.S.A. 100, 9440–9445.
Trivedi, D., and Padinjat, R. (2007). RdgB proteins: functions in lipid homeostasis and signal transduction. Biochim. Biophys. Acta 1771, 692–699.
Tsai, S., Cassady, J. P., Freking, B. A., Nonneman, D. J., Rohrer, G. A., and Piedrahita, J. A. (2006). Annotation of the Affymetrix porcine genome microarray. Anim. Genet. 37, 423–424.
Uemoto, Y., Soma, Y., Sato, S., Ishida, M., Shibata, T., Kadowaki, H., Kobayashi, E., and Suzuki, C. (2011). Genome-wide mapping for fatty acid composition and melting point of fat in a purebred Duroc pig population. Anim. Genet. doi: 10.1111/j.1365-2052.2011.02218.x
Varona, L., Gomez-Raya, L., Rauw, W. M., and Noguera, J. L. (2005). A simulation study on the detection of causal mutations from F2 experiments. J. Anim. Breed. Genet. 122, 30–36.
Ventanas, S., Ventanas, J., Tovar, J., Garcia, C., and Estevez, M. (2007). Extensive feeding versus oleic acid and tocopherol enriched mixed diets for the production of Iberian dry-cured hams: effect on chemical composition, oxidative status and sensory traits. Meat Sci. 77, 246–256.
Webb, E. C., and O’Neill, H. A. (2008). The animal fat paradox and meat quality. Meat Sci. 80, 28–36.
Wood, J. D., Enser, M., Fischer, A. V., Nute, G. R., Sheard, P. R., Richardson, R. I., Hughes, S. I., and Whittington, F. M. (2008). Fat deposition, fatty acid composition and meat quality: a review. Meat Sci. 78, 343–358.
Zhao, H. H., Rothschild, M. F., Fernando, R. L., and Dekkers, J. C. M. (2003). Tests of candidate genes in breed cross populations for QTL mapping in livestock. Mamm. Genome 14, 472–482.
Appendix
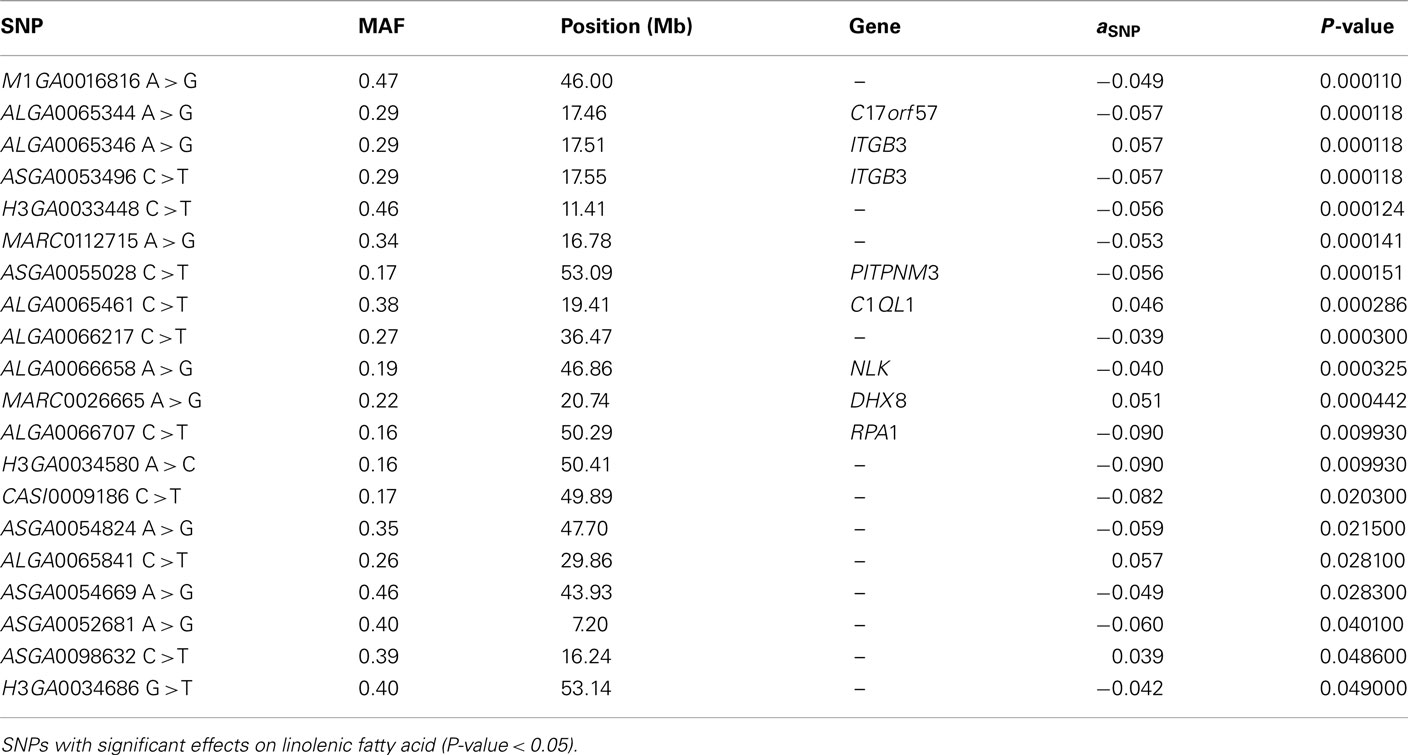
Table A1. Association analysis.
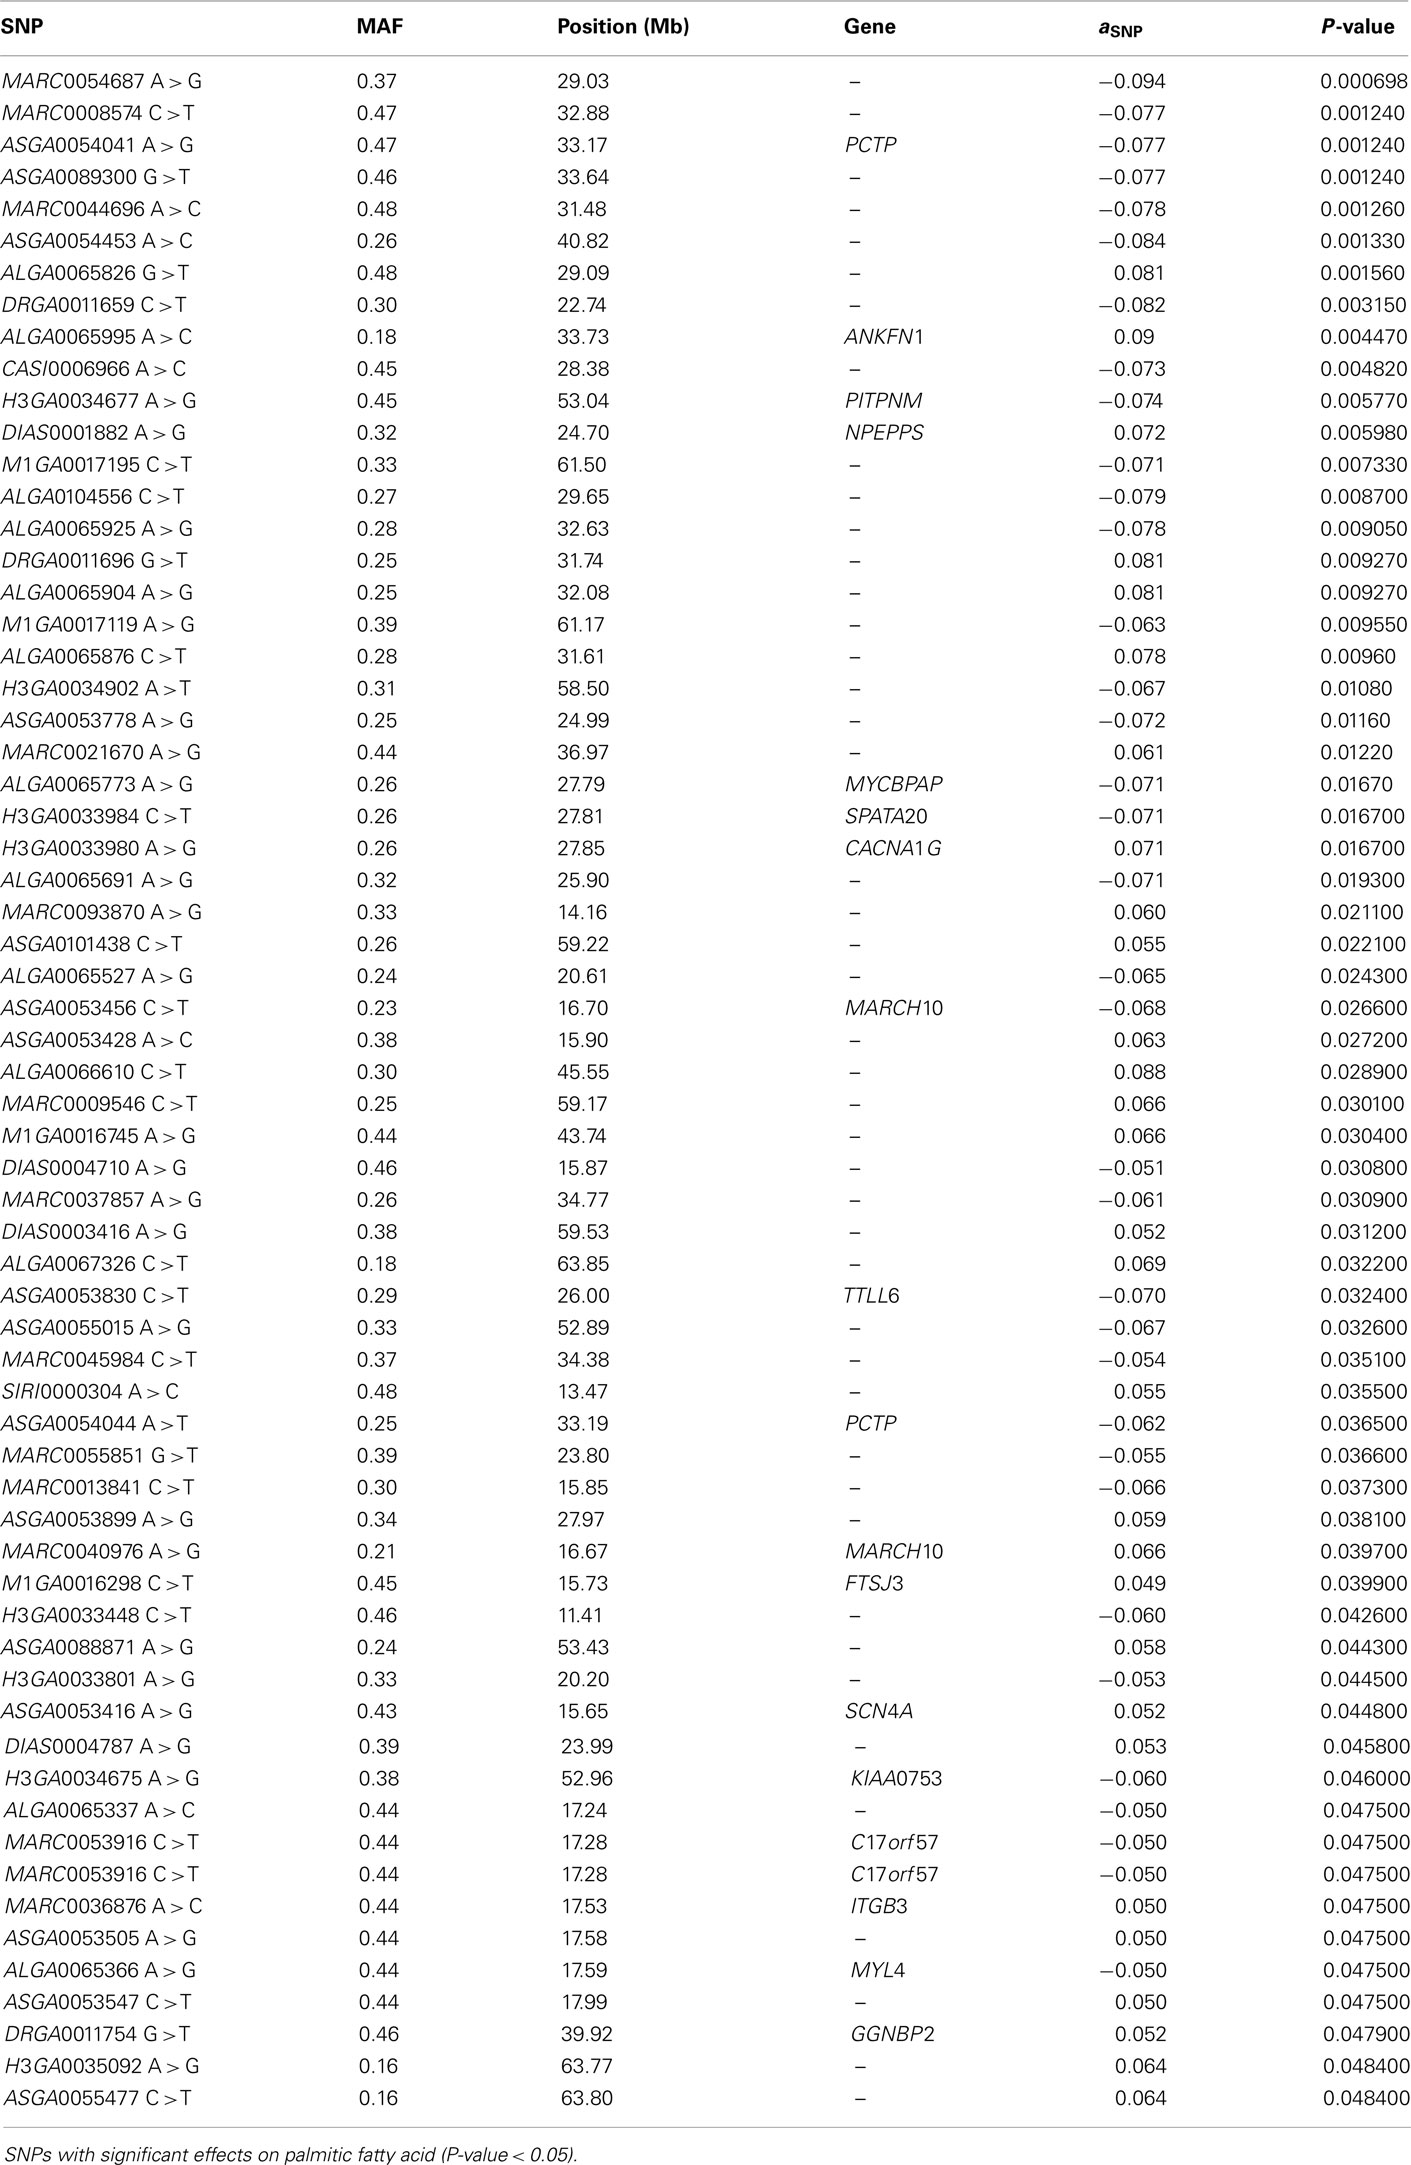
Table A2. Association analysis.
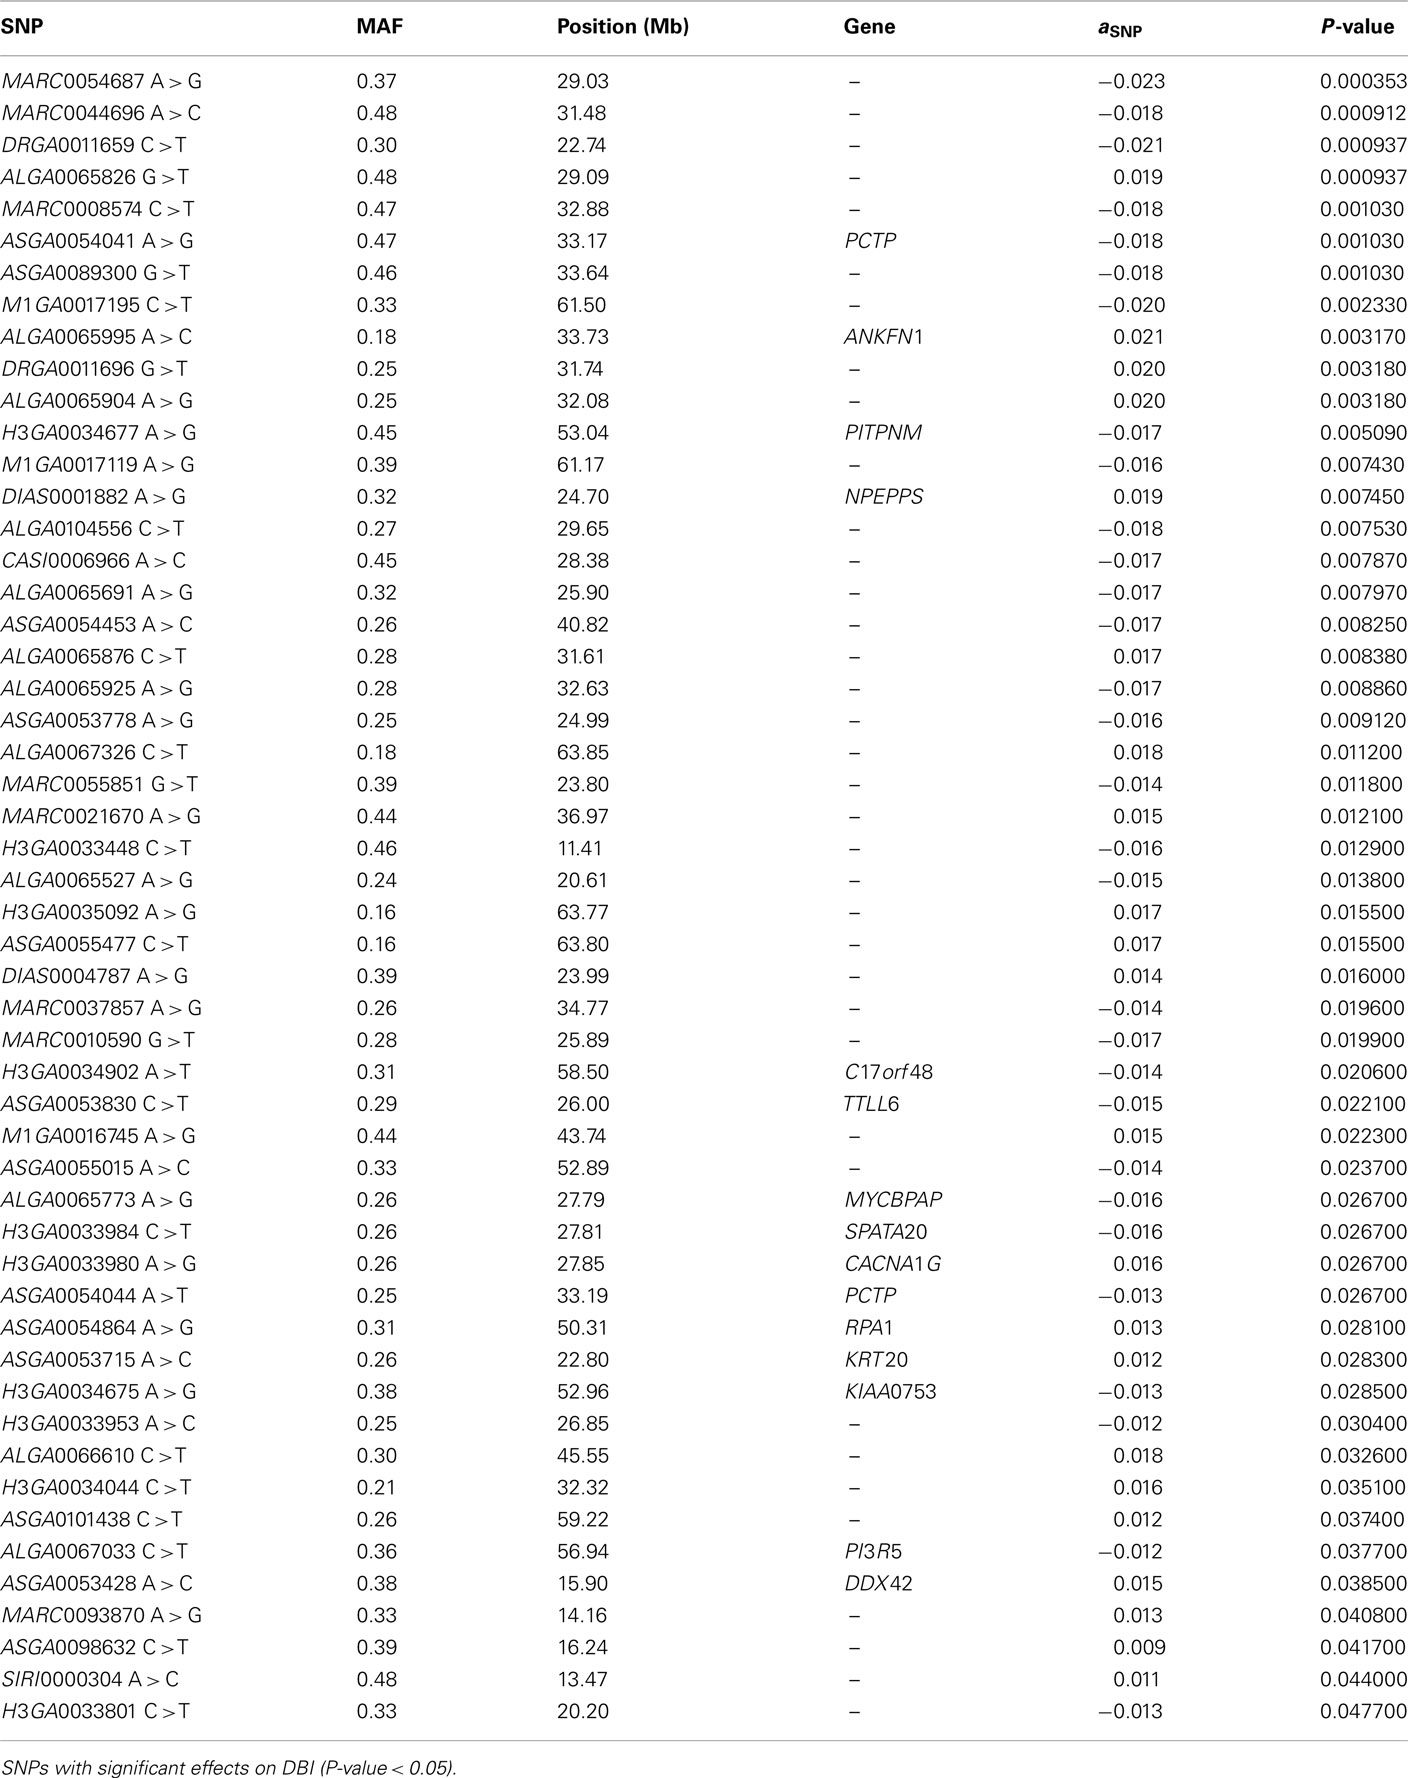
Table A3. Association analysis.
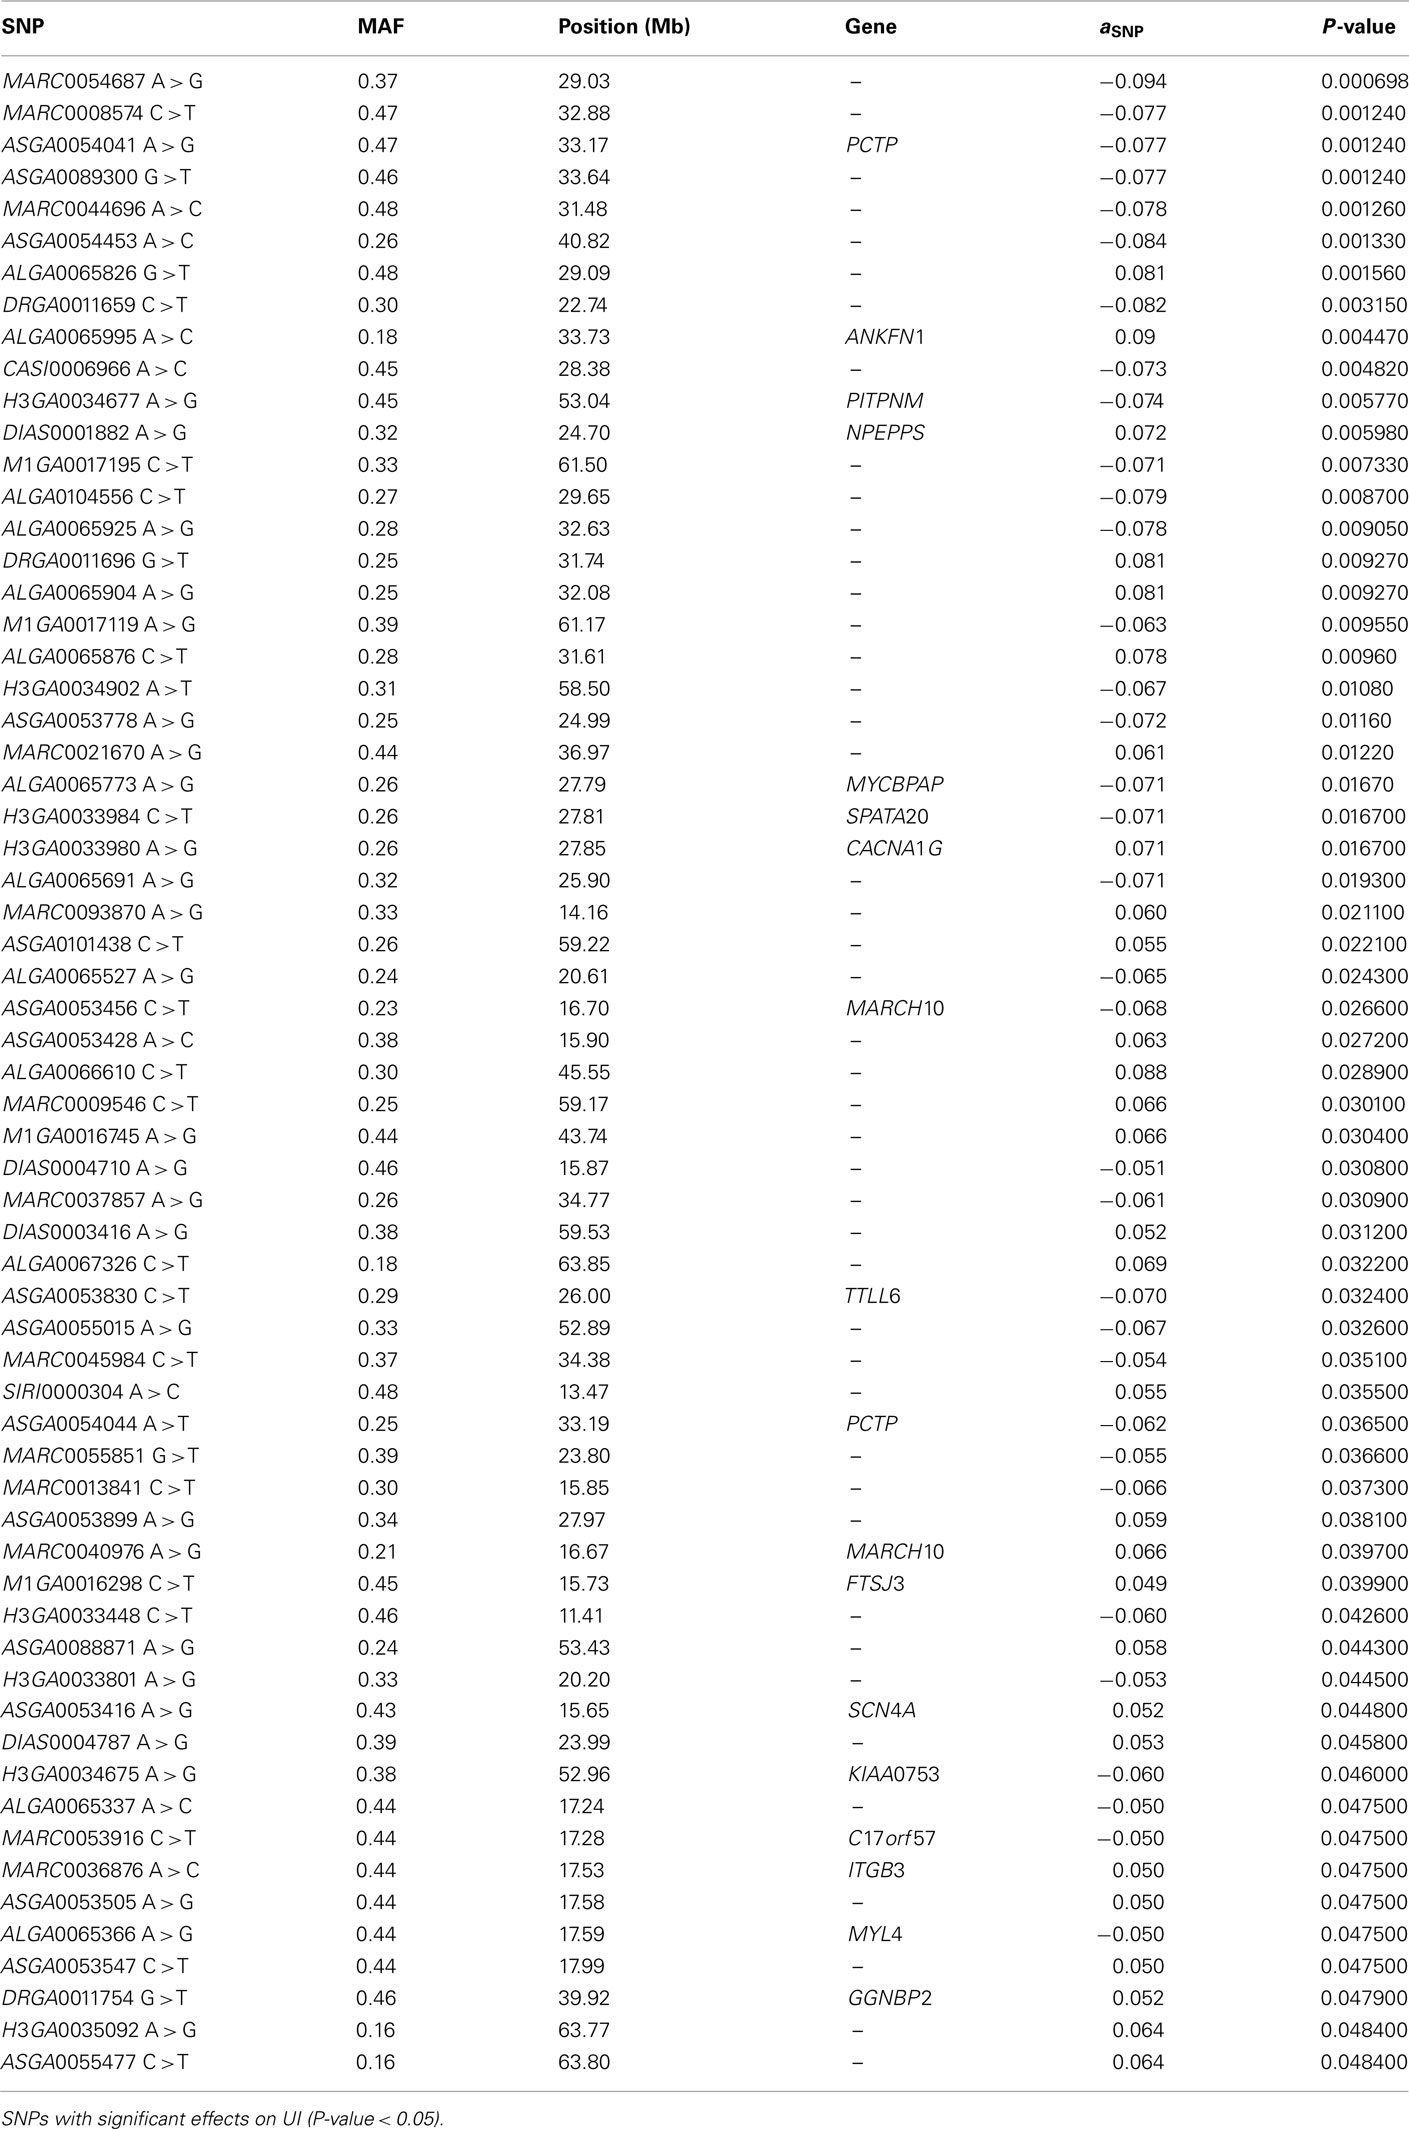
Table A4. Association analysis.
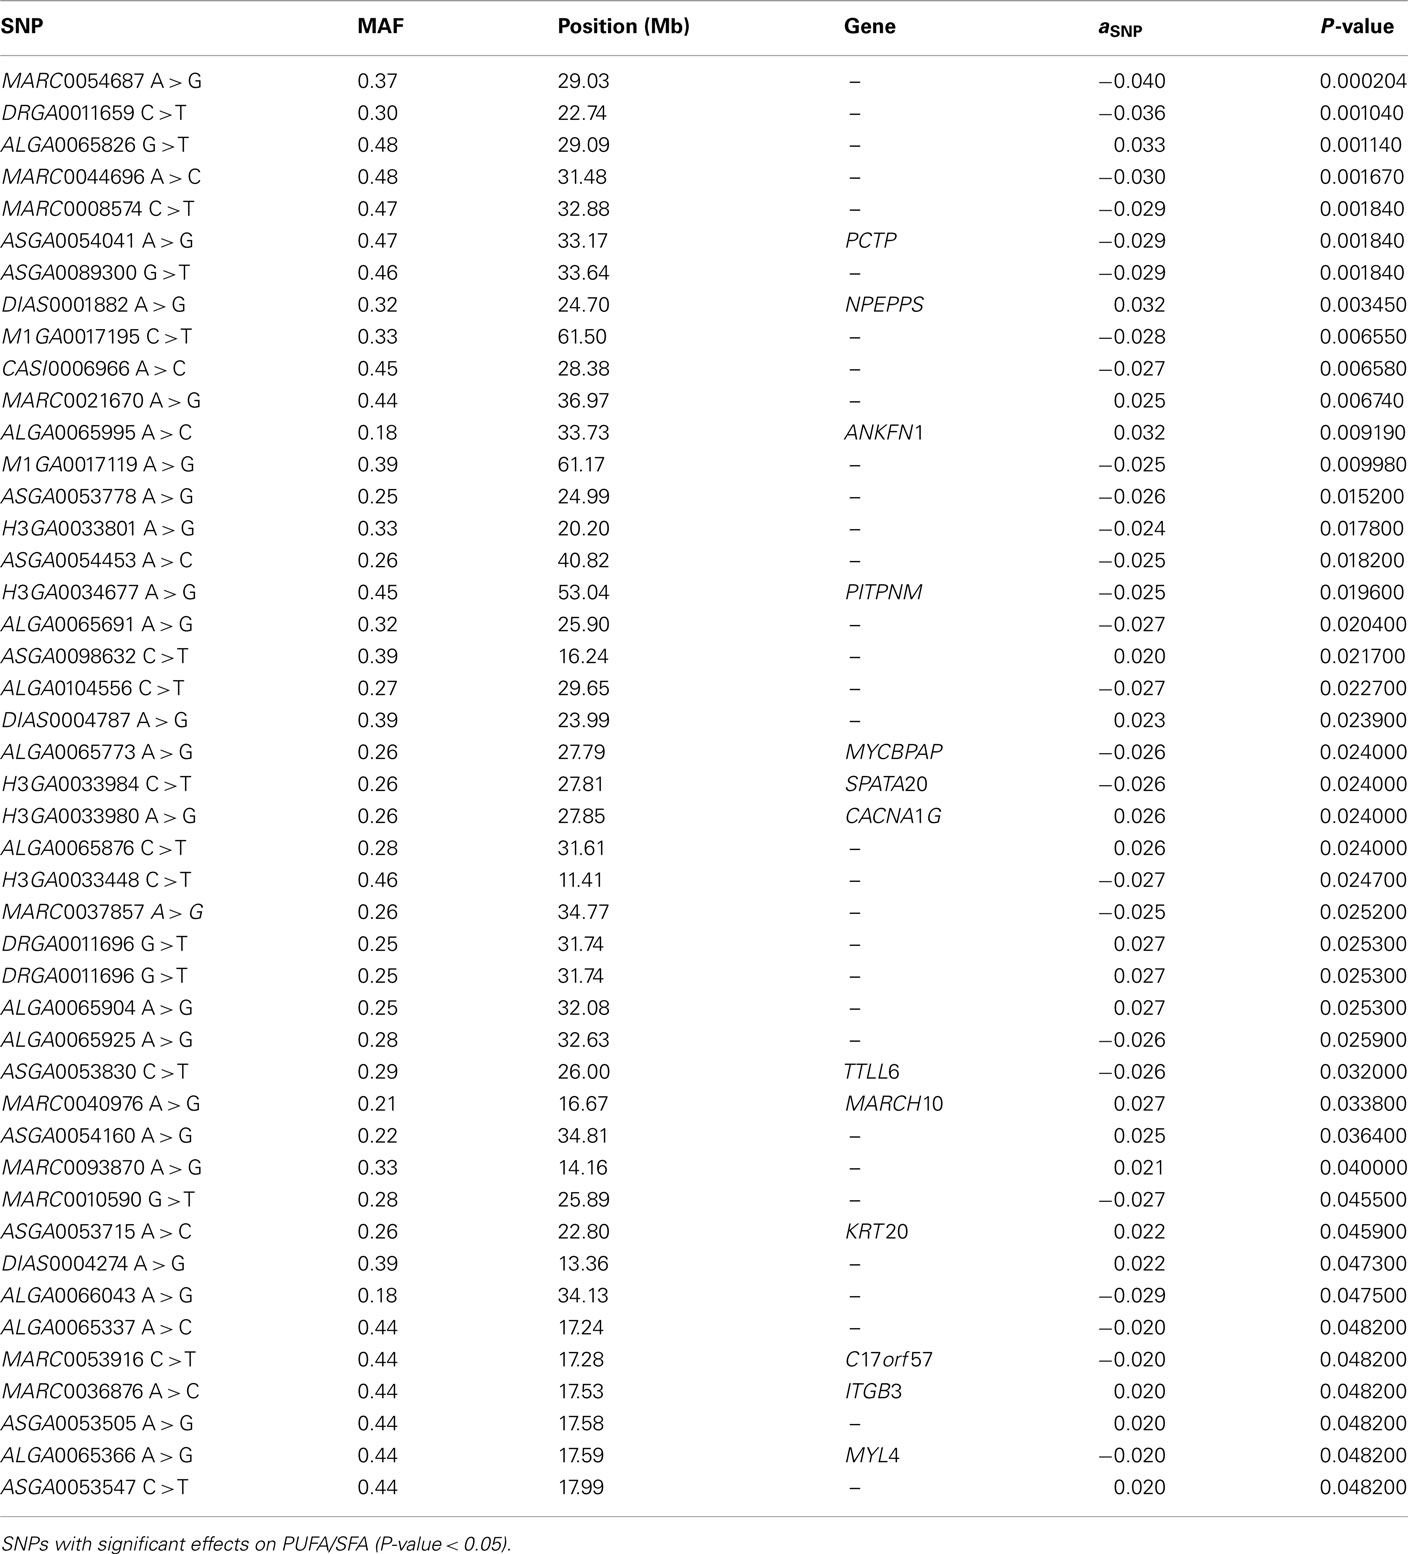
Table A5. Association analysis.
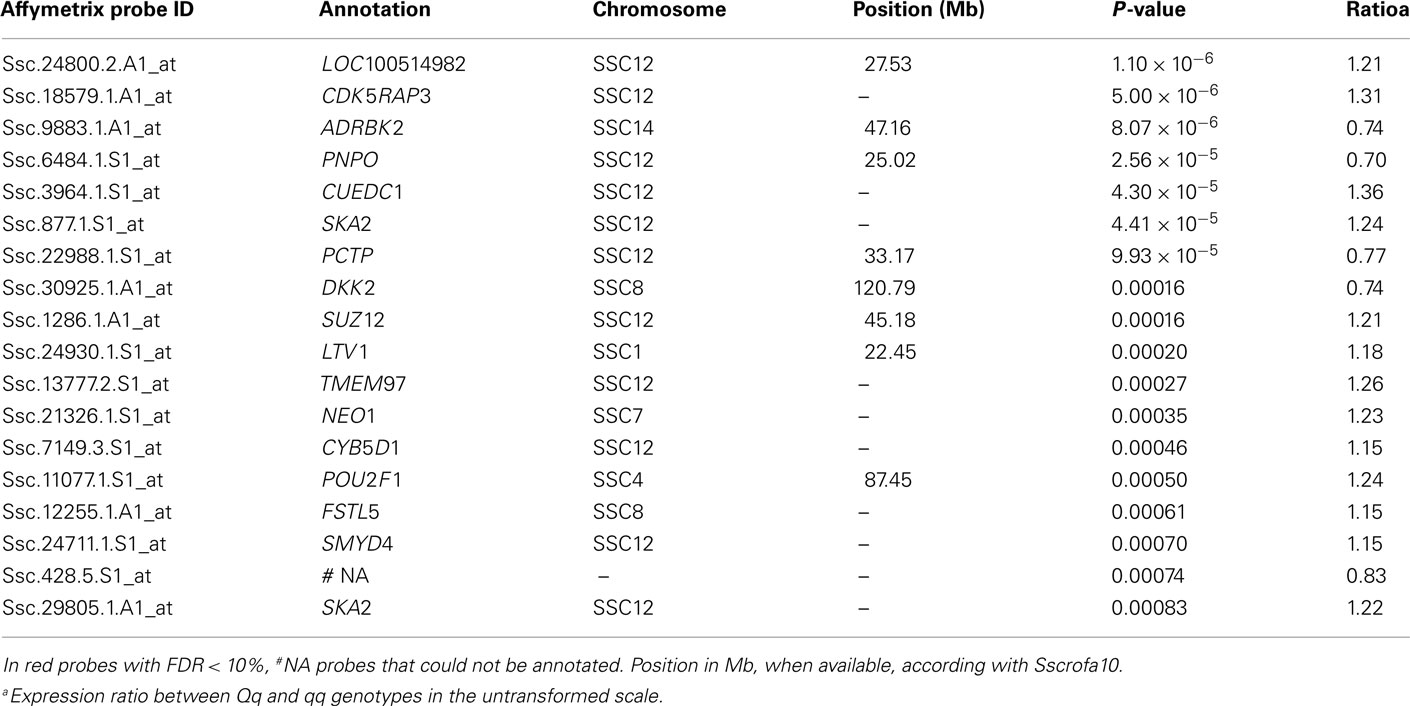
Table A6. Differentially expressed probes between Qq and qq QTL genotypes with effect on C16:0.
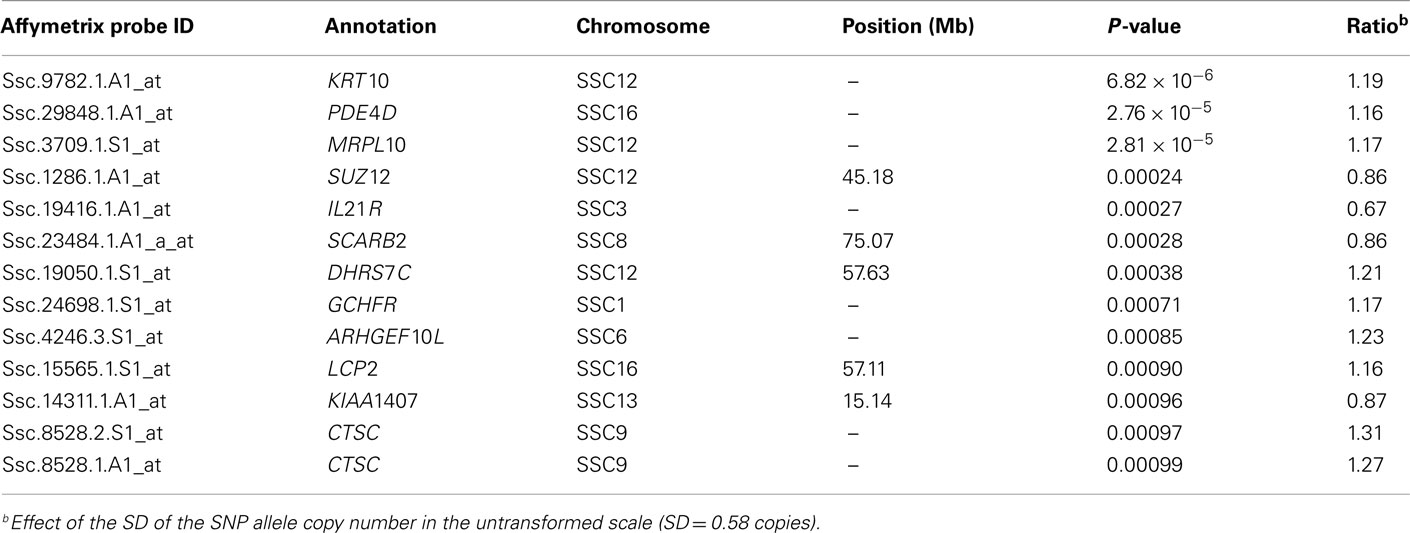
Table A7. Differentially expressed probes conditional on copy number of ACACA ASGA0066302A allele.
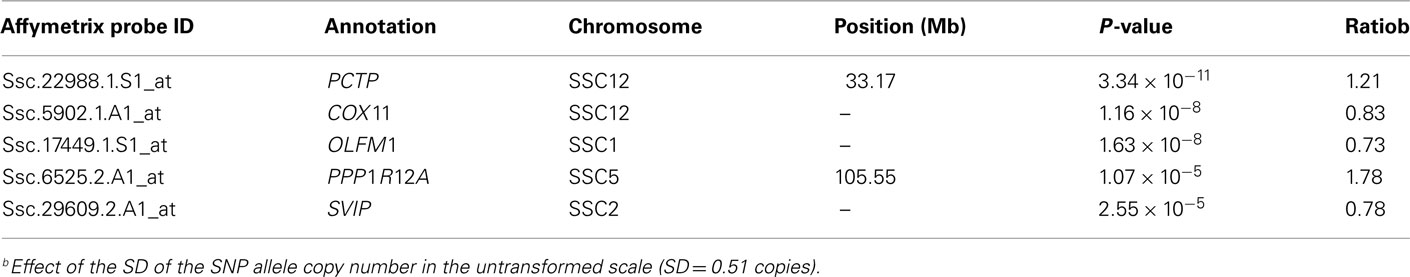
Table A8. Differentially expressed probes conditional on copy number of PCTP ASGA0054039C.
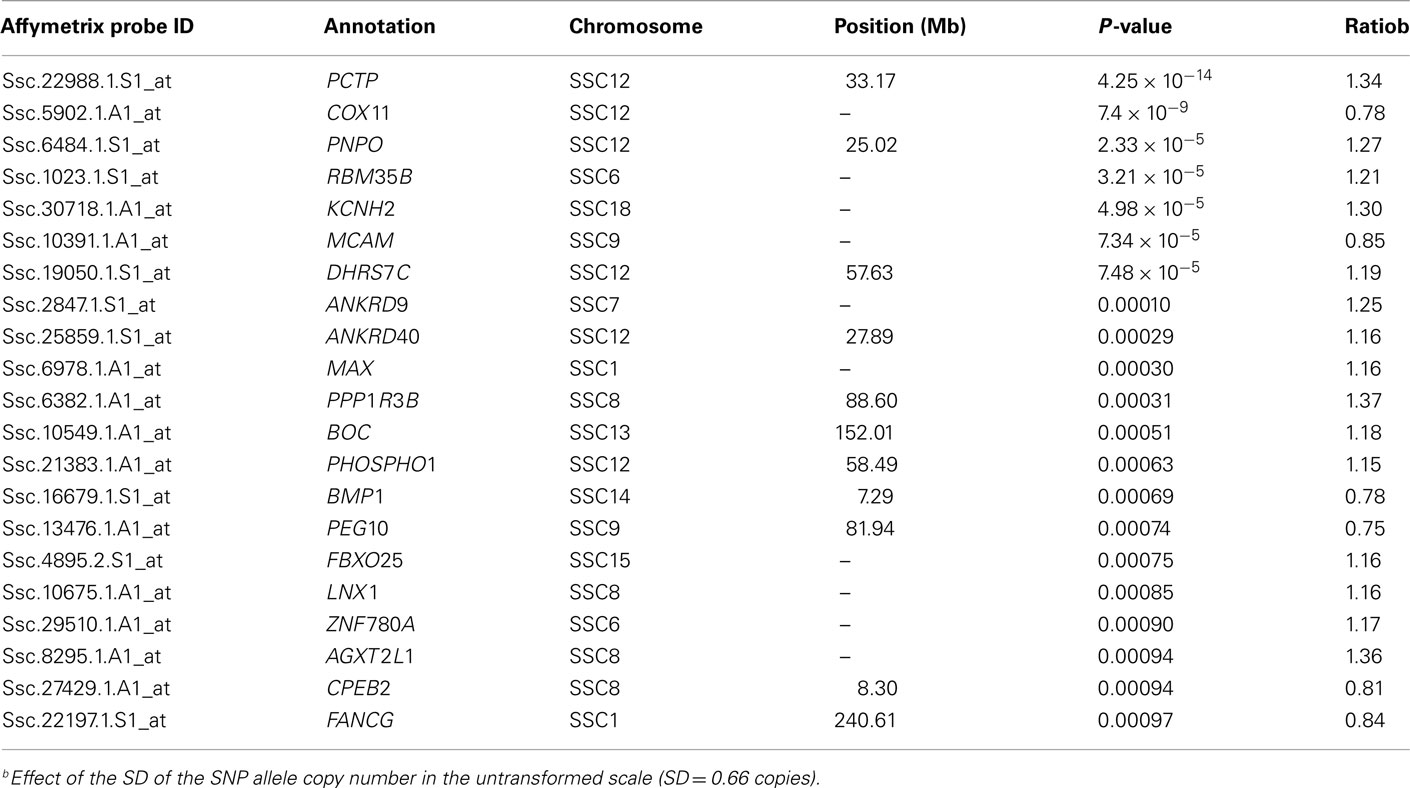
Table A9. Differentially expressed probes conditional on copy number of PCTP ASGA0054041G.
Keywords: SSC12, fatty acid composition, high-density SNP chip
Citation: Muñoz M, Alves E, Corominas J, Folch JM, Casellas J Noguera JL, Silió L and Fernández AI (2012) Survey of SSC12 regions affecting fatty acid composition of intramuscular fat using high-density SNP data. Front. Gene. 2:101. doi: 10.3389/fgene.2011.00101
Received: 12 September 2011; Accepted: 14 December 2011;
Published online: 05 January 2012.
Edited by:
Tad Stewart Sonstegard, United States Department of Agriculture, USAReviewed by:
John B. Cole, United States Department of Agriculture, USAMarcos Vinicius Silva, Embrapa, Brazil
Jeffrey O’Connell, University of Maryland, USA
Copyright: © 2012 Muñoz, Alves, Corominas, Folch, Casellas, Noguera, Silió and Fernández. This is an open-access article distributed under the terms of the Creative Commons Attribution Non Commercial License, which permits non-commercial use, distribution, and reproduction in other forums, provided the original authors and source are credited.
*Correspondence: María Muñoz, Departamento de Mejora Genética Animal, Instituto Nacional de Investigaciones Agrarias, Carretera de la Coruña km 7.5, 28040 Madrid, Spain. e-mail: marmunozmunoz@gmail.com