- 1 Institute for Behavioral Genetics, University of Colorado Boulder, Boulder, CO, USA
- 2 Department of Psychology and Neuroscience, University of Colorado Boulder, Boulder, CO, USA
- 3 Department of Human Development and Family Studies, University of Connecticut, Storrs, CT, USA
We examined the magnitude of genetic and environmental influences on observed negative emotionality at age 14, 20, and 24 months. Participants were 403 same-sex twin pairs recruited from the Longitudinal Twin Study whose emotional responses to four different situations were coded by independent raters. Negative emotionality showed significant consistency across settings, and there was evidence of a latent underlying negative emotionality construct. Heritability decreased, and the magnitude of shared environmental influences increased, for the latent negative emotionality construct from age 14 to 24 months. There were significant correlations between negative emotionality assessed at age 14, 20, and 24 months, and results suggested common genetic and shared environmental influences affecting negative emotionality across age, and that age-specific influences are limited to non-shared environmental influences, which include measurement error.
Introduction
Temperament has been defined as early emerging, heritable behavioral attributes that remain stable over time and place and predict later development (Buss and Plomin, 1984). Although not all researchers agree with this definition and there are several different conceptualizations of temperament (see Goldsmith et al., 1987), almost all of these include a construct that could be called negative emotionality, or the predisposition to experience unpleasant affective states (e.g., Watson and Clark, 1984). Measurement of negative emotionality in young children includes the assessment of traits such as irritability, difficulty, fussiness, distress, anger, and crying (e.g., Buss and Plomin, 1984; Belsky et al., 1991). Other terms referring to the same construct include neuroticism and negative affectivity.
Several researchers have suggested that negative emotionality is an important common feature that underlies many forms of psychopathology (e.g., Lahey and Waldman, 2003; Lilienfeld, 2003), and there are significant associations between negative emotionality and both internalizing and externalizing disorders (e.g., Keiley et al., 2003; Khan et al., 2005; Wolff and Ollendick, 2006). Therefore, understanding the etiology of negative emotionality is an important goal. The definition of temperament as early emerging, heritable, and stable over time suggests there should be significant genetic influences on negative emotionality in very young children.
Several studies have examined the magnitude of genetic and environmental influences in negative emotionality in infants and young children, and in general, they suggest evidence of moderate heritability of negative emotionality. Goldsmith et al. (1997) calculated weighted intraclass correlations in a meta-analysis of studies examining commonly used parent questionnaires of temperament, and found that the estimated monozygotic (MZ) and dizygotic (DZ) correlations for the emotionality scale from the emotionality, activity, sociability, impulsivity (EASI) Temperament Survey, the EAS Questionnaire, or the Colorado Childhood Temperament Inventory were 0.57 and 0.11, respectively, whereas the estimated MZ and DZ correlations for the mood scale from the Revised Infant Temperament Questionnaire, Toddler Temperament Scale, or the Behavior Style Questionnaire were 0.60 and 0.41, respectively. Moreover, Schmitz et al. (1999) found that genetic influences explained the covariation between emotionality from age 14 to 36 months and internalizing and externalizing problems at age 4 years. Gjone and Stevenson (1997) also reported evidence of common genetic influences between emotionality in childhood and attention problems and aggressive behavior measured 2 years later.
One of the limitations in the existing literature is that most genetically informative studies of negative emotionality have examined parent reports. Although parent reports have the advantages of being cost–efficient and providing a general measure of temperament across contexts, they have well-recognized methodological limitations. One is rater bias, which is the tendency to over- or under-report a trait consistently, and which may reflect the parents’ characteristics rather than the children’s characteristics (e.g., Neale and Cardon, 1992; van der Valk et al., 2001). Another is the contrast effect, or the tendency to exaggerate the differences between DZ children; the contrast effect can lead to near-zero or even negative correlations in DZ twin pairs, and hence to inflated heritability estimates. The contrast effect is a common problem in twin studies assessing temperament via parent reports (e.g., Saudino, 2005).
An alternative to parent reports is assessing temperament via observations by independent raters. Given that two separate raters assess the two siblings in most studies, rater bias and contrast effects are not a problem. Also, observational measures are more objective, and less likely to reflect the characteristics of the raters than parent reports. In contrast to the number of studies examining parent reports of negative emotionality, there are fewer genetically informative studies examining observed negative emotionality in the literature. However, the observational measures used in the studies and the results reported are variable. Goldsmith and Gottesman (1981) reported significant genetic influences on the “irritability” factor from behavioral ratings at age 4 years, but the difference between MZ and DZ correlations was not significant for “emotional reactivity” at age 4 or 7 years or for “frustration tolerance” at age 7 years. Several studies have examined observed negative emotionality in approximately half of the sample examined in the present study, the Longitudinal Twin Study (LTS) sample. Emde et al. (1992) examined two different measures of observed negative emotionality and reported a non-significant heritability of 0.10 for “negative hedonic tone” and 0.15 for “frustration” at age 14 months. Plomin et al. (1993) conducted a follow-up study and found that the heritability decreased from 0.10 to 0.03 for “negative hedonic tone” but increased from 0.15 to 0.35 for “frustration” (referred to as reactivity in the second study) at age 20 months, and the cross-trait cross-twin correlations were greater for MZ than DZ twin pairs only for negative hedonic tone. Another LTS study examined protest strength during Restraint, and found common genetic influences on protest strength assessed at all three ages, and no age-specific genetic influences (Emde et al., 2001). In the Louisville Twin Study, Wilson and Matheny (1986) reported that the MZ and DZ correlations for an observed measure of emotional tone were similar at age 9 months, and also at 12 months, but significantly higher in MZs than DZs at 18 and 24 months. They also noted that age-to-age changes in emotional tone were more closely synchronized for MZ twin pairs than for DZ twin pairs.
These inconsistencies in the literature could be due to methodological limitations of observations, which include being limited to specific situations and providing only brief snapshots of behavior. A recent review of the genetics of putatively environmental influences found that heritability estimates from studies examining observations were substantially lower than those examining informant- or self-reports, and suggested that heritability of observations may be limited by unreliable measurement due to very short sampling frames, short-term fluctuations, and random influences (Kendler and Baker, 2007). It is also possible that the variability in assessments and measurement error may have led to the discrepant results in previous studies of observed temperament in the literature.
The aim of the present study was to examine the magnitude of genetic and environmental influences on negative emotionality assessed in very young children. In the present study, negative emotionality was operationalized as behaviors including pouting, frowning, protesting, whimpering, fussing, and crying, and negative affect including anger and distress. The present study addressed the limitations of the existing literature on the etiology of negative emotionality in several ways. First, observations of negative emotionality were examined, because of the small number of genetically informative studies examining observed negative emotionality, and the methodological limitations (i.e., rater bias and contrast effects) of studies examining negative emotionality via parent reports. The current study presents data from a sample that is approximately two times greater than previous LTS studies of observed negative emotionality. Second, the criticism that observed temperament only provides brief snapshots of behavior was addressed by examining observed negative emotionality in four different situations, and evaluating the evidence for a latent observed negative emotionality construct, which is less affected by measurement error. Third, the present study examined negative emotionality across three ages (14, 20, and 24 months), as there are few studies examining the etiology of the stability of negative emotionality.
Materials and Methods
Participants
The LTS is a sample of same-sex twin pairs recruited through the Colorado Department of Health born between 1986 and 1990 in Colorado. Of the parents initially contacted, more than 50% of the families who lived within a 2-h drive of Boulder, Colorado enrolled in the study. The ethnicity distribution of the LTS is 86.6% Caucasian, 8.5% Hispanic, 0.7% African–American, 1.2% Asian, and 2.9% other, which corresponds well to that reported for Boulder County, Colorado in the 1990 United States Census (89.5% Caucasian, 3.8% Hispanic, 0.9% African–American, 2.4% Asian, and 3.4% other). The mean number of years of education was 14.29 years for mothers and 14.42 years for fathers. Of all parents, 5% did not complete high school, 29% completed high school without post-secondary education, 49% had some post-secondary education, and 17% had some graduate-level education. More detailed information regarding the LTS is available in Rhea et al. (2006).
Participants who had data on observed negative emotionality at any age were included, resulting in a total of 403 twin pairs: 117 MZ female, 80 DZ female, 107 MZ male, and 99 DZ male twin pairs. There were no opposite-sex twin pairs. Table 1 presents the number of individuals with available data for each measure at each age.
Zygosity Determination
Zygosity of the twin pairs was determined using ratings from the testers across the ages. Twin similarity on 10 physical characteristics (e.g., eye color, hair color, shape of the ears; Nichols and Bilbro, 1966) was rated by the testers each time the twins were seen in person. Twins who were rated highly similar across the ages were rated as MZ, and twins who had two or more features rated as only somewhat similar or one feature rated as not at all similar were rated as DZ. Twin pairs were considered unambiguously MZ or DZ if 85% of the raters agreed on their zygosity, and blood testing was used to resolve ambiguity in nine twin pairs. Zygosity ratings were confirmed using 11 polymorphic microsatellite markers if DNA was available.
Measures
The present study examined data collected during home and laboratory visits at ages 14, 20, and 24 months. Home visits were conducted at the convenience of the mothers, and laboratory visits usually took place within 2 weeks of the home visit at the Institute for Behavioral Genetics at the University of Colorado at Boulder.
Observations of negative emotionality were assessed using two coding schemes. In the Frustration coding scheme, the child’s expressivity, protest strength, and distress strength were assessed in two situations: Restraint and Toy Removal. In the Restraint procedure, children were restrained as the examiner put on an identifying vest or bib on a child and as the child was measured and instructed to lie still, typically up to 20 s. In the Toy Removal procedure, a toy was abruptly taken away from the child after the child was intently involved with the toy for 2 min. In the Negative Hedonic Tone coding scheme (Emde and Easterbrooks, 1983), the child’s strongest negative affect during the administration of Bayley Scales of Infant Development (1-min intervals during four 5-min segments) and Free Play (30-s intervals across 15 min) was recorded. The Bayley Scales of Infant Development (Bayley, 1976) assess cognitive ability, including problem solving, fine motor coordination, and language skills. In the Free Play, examiners arranged a set of twelve toys in the family’s living room, and the children played freely without interruption by the examiners for 15 min. The inter-rater reliability was 0.69 for expressivity, 0.75 for protest strength, and 0.89 for distress in the Frustration coding scheme and 0.84 for the Negative Hedonic Tone coding scheme. The frustration score for Restraint and Toy Removal was the sum of expressivity, protest strength, and distress strength scores during each task. The Negative Hedonic Tone scores for Bayley Scales and Free Play were the average negative affect score across all intervals coded.
The four observed negative emotionality scores examined at each age were Restraint, Toy Removal, Bayley Scales, and Free Play, as described above. The distributions of these variables were not normal, and log transformation or square-root transformation of the data led to a normal distribution with skewness and kurtosis values less than 1.0 only for Toy Removal. Therefore, the Restraint, Bayley Scales, and Free Play variables were binned into ordinal variables, with the number of categories (seven categories for Restraint and three categories for Bayley Scales and Free Play) chosen to avoid small cell sizes. Table 2 shows the proportion of individuals in each category of Restraint, Bayley Scales, and Free Play at each age.
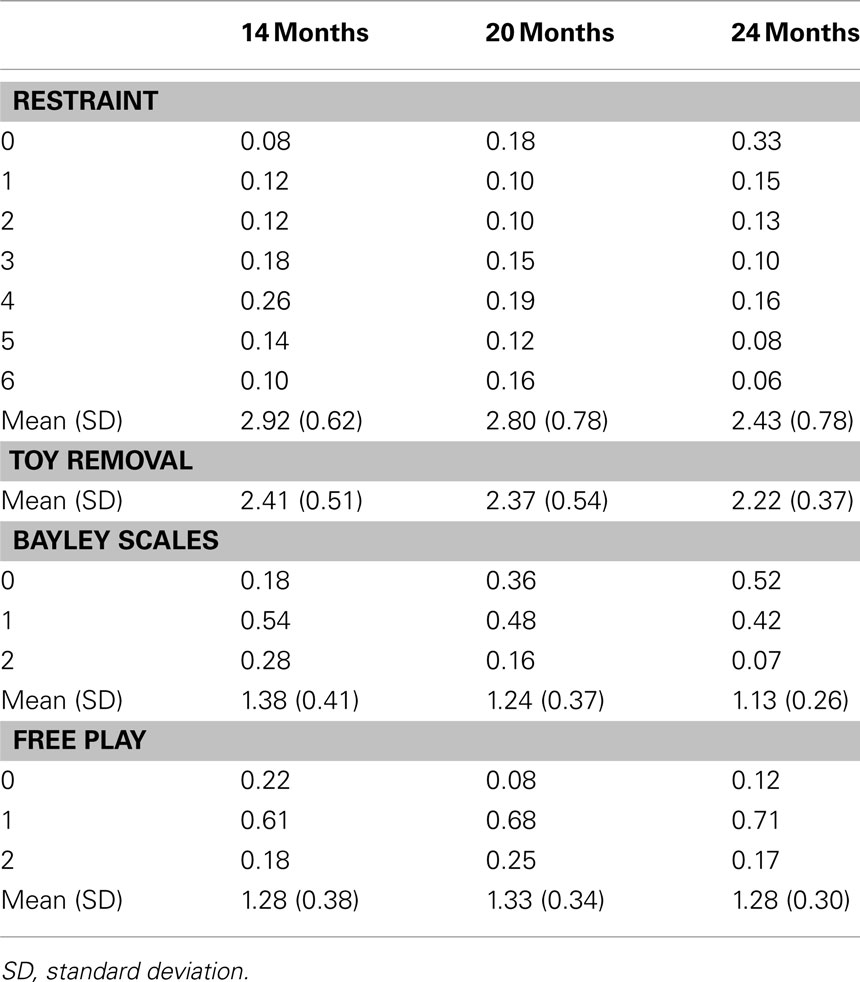
Table 2. Proportion of individuals in each category and mean (SD) of Restraint, Bayley Scales, and Free Play and the mean (SD) of Toy Removal at each age.
Analyses
This section describes the general analytic issues, and specific details regarding the analyses are presented in the results section. All analyses were conducted in Mplus 6.1 (Muthén and Muthén, 1998–2010). Mplus has the advantage of allowing analyses of a combination of ordinal and continuous data, which was relevant in the present study, as the Restraint, Bayley Scales, and Free Play were ordinal, and the Toy Removal was continuous. In analyses where data from individuals were examined, the fact that data from two twins in a twin pair are correlated and non-independent was addressed by specifying that the twins are nested within twin pairs; Mplus takes non-independence of observations into account when computing SEs and model fit. Given that several ordinal variables were examined, the weighted least square mean and variance (WLSMV) estimation method was used. When WLSMV is used, Mplus uses pairwise deletion. Statistical significance of the parameters was determined by their p-values, which are based on a z-statistic yielded by the ratio of each parameter to its SE. Given that the traditionally used measure of model fit, χ2, is sensitive to sample size, we also examined the comparative fit index (CFI; Bentler, 1990), the Tucker–Lewis index (TLI; Bentler, 1990), and the root mean square error of approximation (RMSEA; Browne and Cudeck, 1993). A CFI and TLI greater than 0.95 and RMSEA less than 0.06 indicate good model fit (Hu and Bentler, 1998).
Results
Level of Negative Emotionality at Each Age
Table 2 shows the descriptive statistics for the four negative emotionality measures. For Toy Removal, a continuous measure, the mean and the SD are shown. For the three ordinal variables (Restraint, Bayley Scales, and Free Play), the proportion of individuals in each category is shown, but the mean and the SD of these variables (prior to binning into ordinal variables) are also shown to illustrate more easily how negative emotionality scores change from 14 to 24 months. These results suggest that there was a decrease in negative emotionality assessed from 14 to 24 months, with the exception of negative emotionality during Free Play. This decrease was statistically significant, as a model fixing the means (for Toy Removal, the continuous variable) and the thresholds (for Restraint, Bayley Scales, and Free Play, the ordinal variables) to be equal across age fit the data significantly worse than a model that allowed the means and thresholds to differ across age, Δχ2(18) = 751.623, p < 0.01. Results were similar when the means/thresholds for each variable were examined separately.
Correlations among Variables at Each Age
A model was fit at each age to calculate the phenotypic (within-person cross-trait) correlations (e.g., twin 1 Restraint and twin 1 Toy Removal), the within-trait cross-twin correlations (e.g., twin 1 Restraint and twin 2 Restraint), and the cross-trait cross-twin correlations (e.g., twin 1 Restraint and twin 2 Toy Removal). The phenotypic correlations were estimated to be the same regardless of twin number or zygosity. The within-trait cross-twin correlations and cross-trait cross-twin correlations varied between MZ and DZ twin pairs. The equivalent cross-trait cross-twin correlations between twin 1 and twin 2 (e.g., the twin 1 Restraint and twin 2 Toy Removal correlation and the twin 1 Toy Removal and twin 2 Restraint correlation) were fixed to be equal.
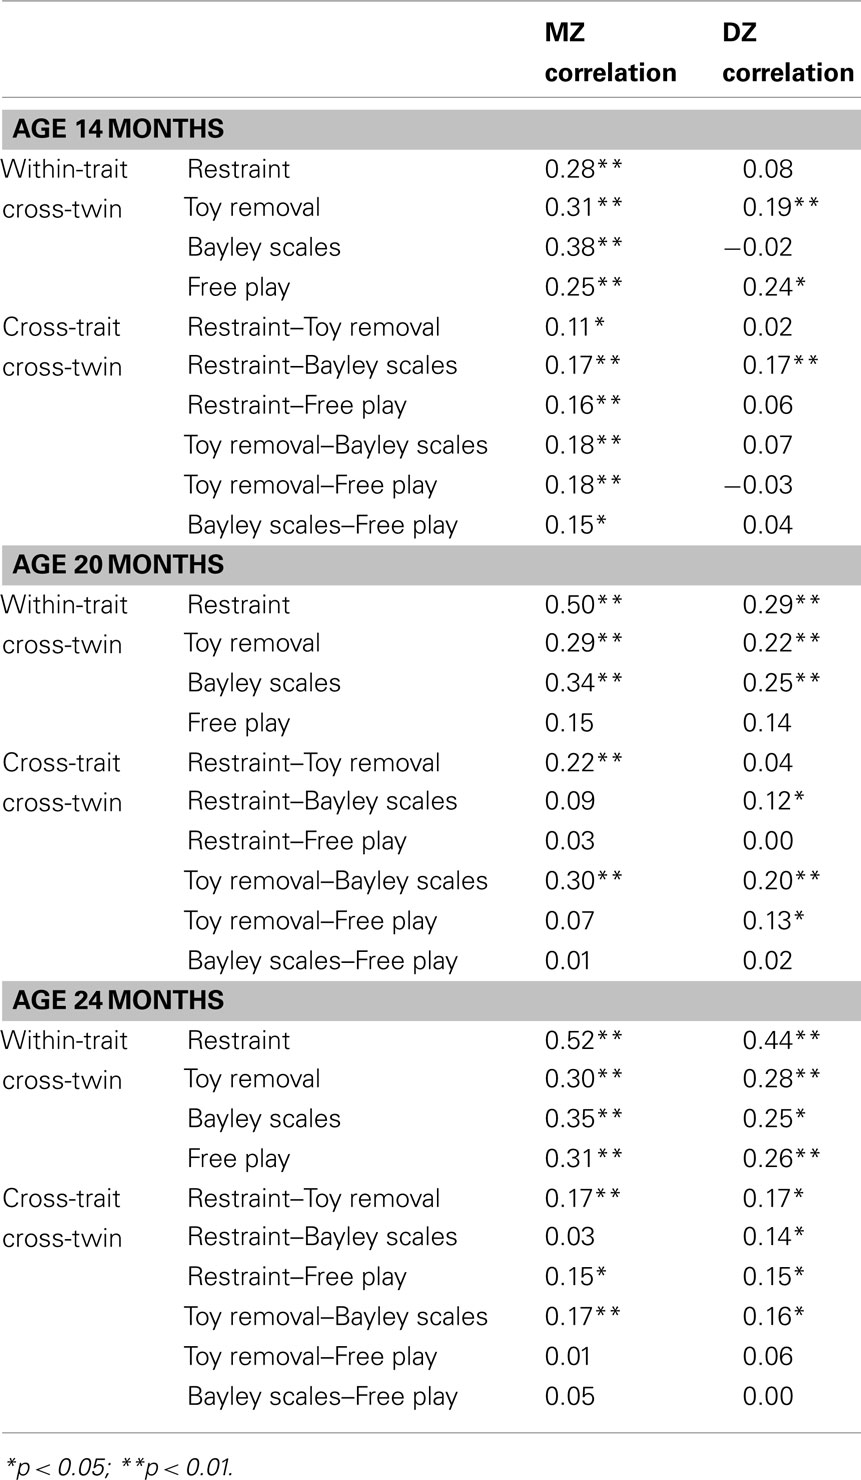
In regard to the within-trait cross-twin correlations, a greater MZ than DZ correlation suggests genetic influences, a DZ correlation greater than half the MZ correlation suggests shared environmental influences, and an MZ correlation less than 1.0 suggests non-shared environmental influences (which may include measurement error). In regard to the cross-trait cross-twin correlations, a greater MZ than DZ correlation suggests genetic influences on the covariation between traits, a DZ correlation greater than half the MZ correlation suggests shared environmental influences on the covariation between traits, and an MZ correlation less than the phenotypic correlation suggests non-shared environmental influences on the covariation between traits.
This model fit the data well at each age (14 months – χ2 (100) = 103.976, p = 0.37, CFI = 0.98, TLI = 0.98, RMSEA = 0.20; 20 months – χ2 (100) = 107.390, p = 0.29, CFI = 0.97, TLI = 0.96, RMSEA = 0.03; 24 months – χ2 (100) = 101.936, p = 0.43, CFI = 0.99, TLI = 0.99, RMSEA = 0.02). Also, at each age, a model fixing the parameters to be equal across gender did not fit significantly worse than a model allowing them to be free across gender (14 months – Δχ2(28) = 27.163, p = 0.51; 20 months – Δχ2(28) = 34.792, p = 0.18; 24 month – Δχ2(28) = 23.150, p = 0.72).
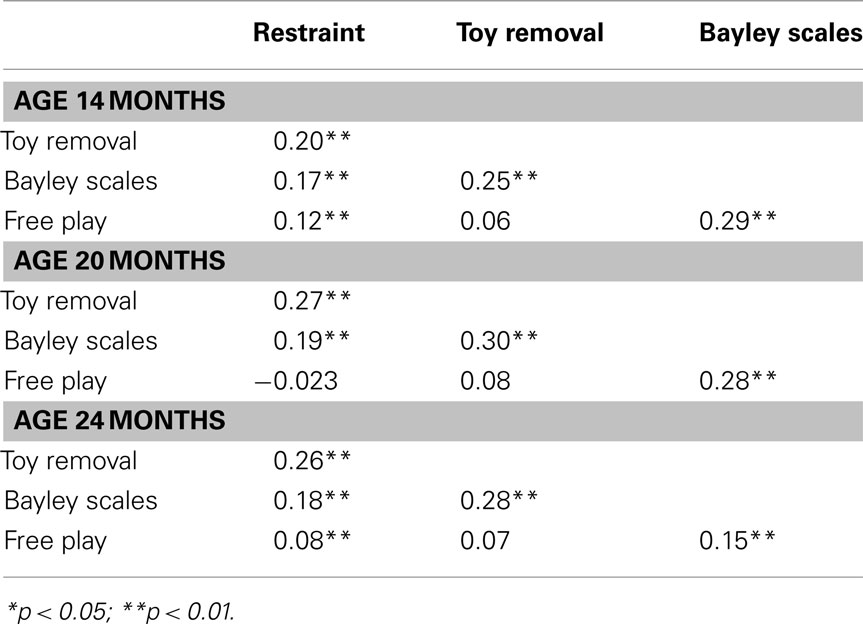
Table 3 shows the phenotypic correlations at each age. In general, there were significant, positive correlations among negative emotionality observed in the four settings; however, at each age, negative hedonic tone assessed during Free Play was more highly correlated with negative hedonic tone during Bayley Scales than with other measures, and not significantly correlated with Restraint or Toy Removal (with the exception of a significant correlation between 14-month Free Play and Restraint).
Table 4 shows the within-trait cross-twin and cross-trait cross-twin correlations at each age. The within-trait cross-twin correlations were generally higher for MZ twin pairs than for DZ twin pairs, suggesting genetic influences. There was a general trend of both the average MZ correlations (14 months – r = 0.31; 20 months – r = 0.32; 24 months – r = 0.37) and the average DZ correlations (14 months – r = 0.12; 20 months – r = 0.23; 24 months – r = 0.31) increasing with age, with DZ correlations increasing more than the MZ correlations. The cross-trait cross-twin correlations were generally higher for MZ twins than for DZ twins at age 14 months, suggesting genetic influences, but similar to each other at age 20 and 24 months. There was a general trend of the average MZ correlations decreasing (average correlation at 14 months – r = 0.16; average correlation at 20 months – r = 0.12; average correlation at 24 months – r = 0.10) and the average DZ correlations increasing (14 months – r = 0.06; 20 months – r = 0.09; 24 months – r = 0.11) with age.
Gender Differences
Results of t-tests indicated that there were not significant gender differences in the mean Toy Removal score [14 months – t(769) = 0.398, p = 0.69; 20 months – t(661) = −1.427, p = 0.15; 24 months – t(661) = −1.172, p = 0.24]. Gender differences in the ordinal variables were examined by comparing the fit of a model where the thresholds were free to vary for males and females to that of a model where the thresholds were fixed to be equal between males and females. A χ2 difference test indicated that gender differences in the thresholds were not significant, Δχ2(24) = 22.336, p = 0.56. Also, as noted above, models constraining the correlations among the variables to be equal for males and females did not fit significantly worse than models allowing them free to vary. Therefore, data from males and females were combined in the subsequent biometrical model fitting analyses.
Confirmatory Factor Analyses of Negative Emotionality Assessed at 14, 20, and 24 Months
Confirmatory factor analyses were conducted to examine the relations among the four observed negative emotionality items at each age. A model assuming that there is a single factor underlying Restraint, Toy Removal, Bayley Scales, and Free Play items only fit the data well at age 24 months (see Table 5). A model that also included a residual correlation between Bayley Scales and Free Play fit the data well at all three ages (see Table 5); however, in this model, Free Play did not have a statistically significant loading on the latent factor at age 20 and 24 months. Therefore, all further analyses examined a latent negative emotionality factor with the three variables that had significant loadings on the latent factor at all three ages: Restraint, Toy Removal, and Bayley Scales.

Table 5. Model fitting results for confirmatory factor analyses of observed negative emotionality data.
Figure 1 shows a model for a confirmatory factor analysis of negative emotionality data at age 14, 20, and 24 months. This model posits a latent negative emotionality factor (with loadings on Restraint, Toy Removal, and Bayley Scales) at each age, and correlations among the latent factors. There are also residual correlations between negative emotionality assessed at the same setting across age (e.g., Restraint at age 14 months and Restraint at age 20 months). This model fit the data well, χ2 (15) = 15.778, p = 0.40, CFI = 0.99, TLI = 0.99, RMSEA = 0.01. Each observed variable at each age had a significant factor loading on its respective latent factor, and the latent factors were significantly correlated. There were also residual correlations between the Restraint and Bayley Scales measured across age.
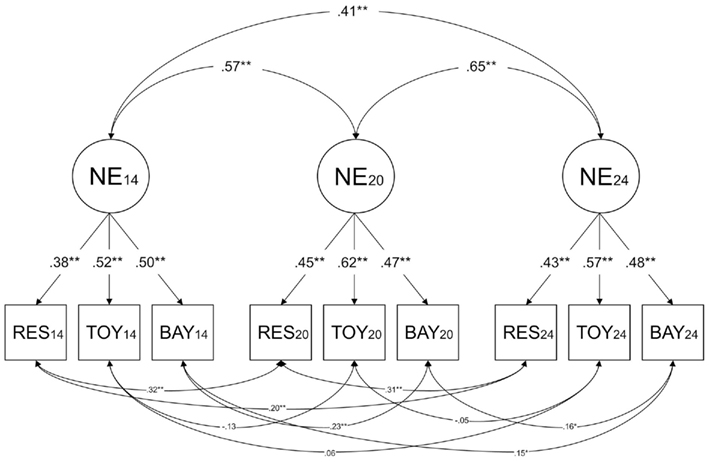
Figure 1. Results of confirmatory factor analysis of negative emotionality at age 14, 20, and 24 months. NE14, NE20, and NE24 = latent negative emotionality at 14, 20, and 24 months; RES14, RES20, and RES24 = Restraint at 14, 20, and 24 months; TOY14, TOY20, and TOY24 = Toy Removal at 14, 20, and 24 months; BAY14, BAY20, and BAY24 = Bayley Scales at 14, 20, and 24 months; +p < 0.10; *p < 0.05; **p < 0.01.
Biometrical Models of Negative Emotionality data at 14, 20, and 24 Months
Two alternative models were fit to the data. The first was a Cholesky model, which is an atheoretical model and the less restrictive of the two models. In the Cholesky model, the number of genetic, shared environmental, and non-shared environmental influences is equal to the number of variables. The first set of influences affect all variables, the second set of influences affect all of the variables except for the first variable, the third set of influences affect all of the variables except the first two variables, and so on. The Cholesky model fit the data well, χ2 (313) = 302.429, p = 0.66, CFI = 1.0, TLI = 1.0, RMSEA < 0.01.
The second model was an independent pathway model based on the confirmatory factor analysis of the negative emotionality data at age 14, 20, and 24 months (see Figures 2 and 3). Here, the three latent negative emotionality factors (i.e., representing ages 14, 20, and 24 months) have a common set of genetic, shared environmental, and non-shared environmental influences, as well as age-specific genetic, shared environmental, and non-shared environmental influences. This model also includes residual correlations among the same observed variables assessed at each age (e.g., Restraint at age 14 months and Restraint at age 20 months), as in the confirmatory factor analysis. The residual correlations within the same twin (e.g., twin 1 Restraint at age 14 months and twin 2 Restraint at age 20 months) were fixed to be equal between twin 1 and twin 2 and between MZ and DZ twin pairs. The residual correlations across twins (e.g., twin 1 Restraint at age 14 months and twin 2 Restraint at age 20 months) were allowed to differ between MZ and DZ twin pairs.
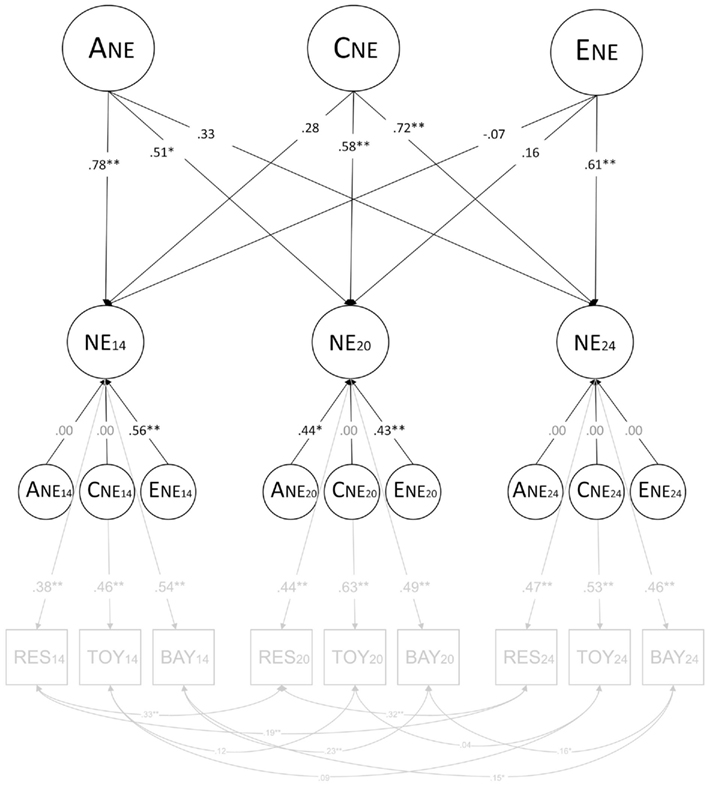
Figure 2. Results of full independent pathway model. ANE = common genetic influences; CNE = common shared environmental influences; ENE = common non-shared environmental influences; ANE14, ANE20, and ANE24 = genetic influences specific to 14, 20, and 24 months; CNE14, CNE20, and CNE24 = shared environmental influences specific to 14, 20, and 24 months; ENE14, ENE20, and ENE24 = non-shared influences specific to 14, 20, and 24 months; NE14, NE20, and NE24 = latent negative emotionality at 14, 20, and 24 months; RES14, RES20, and RES24 = Restraint at 14, 20, and 24 months; TOY14, TOY20, and TOY24 = Toy Removal at 14, 20, and 24 months; BAY14, BAY20, and BAY24 = Bayley Scales at 14, 20, and 24 months; +p < 0.10; *p < 0.05; **p < 0.01. Parameters that had to be fixed to zero are shown in gray rather than black font.
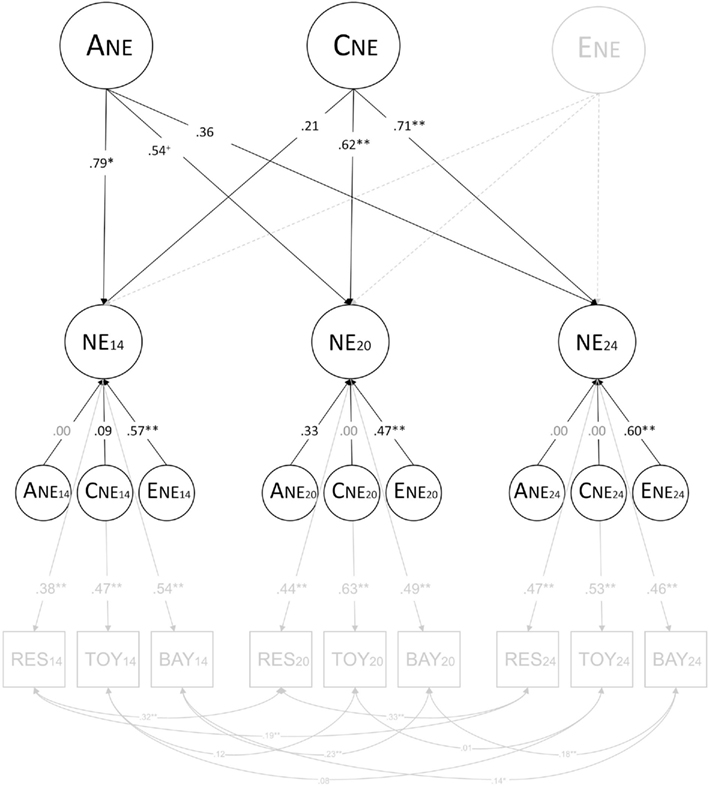
Figure 3. Results of independent pathway model with no common non-shared environmental influences. ANE = common genetic influences; CNE = common shared environmental influences; ENE = common non-shared environmental influences; ANE14, ANE20, and ANE24 = genetic influences specific to 14, 20, and 24 months; CNE14, CNE20, and CNE24 = shared environmental influences specific to 14, 20, and 24 months; ENE14, ENE20, and ENE24 = non-shared influences specific to 14, 20, and 24 months; NE14, NE20, and NE24 = latent negative emotionality at 14, 20, and 24 months; RES14, RES20, and RES24 = Restraint at 14, 20, and 24 months; TOY14, TOY20, and TOY24 = Toy Removal at 14, 20, and 24 months; BAY14, BAY20, and BAY24 = Bayley Scales at 14, 20, and 24 months; +p < 0.10; *p < 0.05; **p < 0.01. Parameters that had to be fixed to zero are shown in gray rather than black font.
This model fit the data well, χ2 (351) = 334.219, p = 0.73, CFI = 1.0, TLI = 1.0, RMSEA < 0.0111. In regard to the common non-shared environmental influences, the magnitude of non-shared environmental influences at age 14 months (−0.07, p = 0.73) and at age 20 months (0.16, p = 0.32) were low and non-significant. An alternative model that dropped the common non-shared environmental influences also fit the data well, χ2 (352) = 335.668, p = 0.73, CFI = 1.0, TLI = 1.0, RMSEA < 0.012 (see text footnote 1).
Figure 2 shows the results of the full independent pathway model, and Figure 3 shows the results of the independent pathway model after dropping the common non-shared environmental influences. The measurement portion of the model (i.e., the portion of the model reflecting the relations between the latent and observed variables and among the observed variables) is shown in light gray font. In Figure 3, the common non-shared environmental influences, which could be dropped without a significant decrement in fit, are also shown in light gray font and dashed lines.
The genetic influences shared in common across age had a significant influence on negative emotionality assessed at age 14 and 20 months, but not at age 24 months. Also, there was a decline in the magnitude of genetic influences with age. Conversely, there was an increase in the magnitude of shared environmental influences with age, with the magnitude of shared environmental influences not being significant at age 14 months, but being significant at age 20 and 24 months. We examined whether the decrease in genetic influences and increase in shared environmental influences was significant by testing models where the magnitudes of genetic influences and the magnitudes of shared environmental influences were fixed to be the same across 14, 20, and 24 months. A model fixing the magnitude of genetic influences to be the same across age led to a significant decrement in fit, Δχ2(2) = 7.285, p = 0.03, suggesting that the decrease in heritability is significant. However, the model fixing the magnitude of shared environmental influences to be the same across age did not harm fit, Δχ2(2) = 4.499, p = 0.11, suggesting that the increase in the magnitude of shared environmental influences across ages was not significant.
Table 6 shows the variance of negative emotionality at each age due to A, C, and E shared in common across ages and age-specific A, C, and E, which were derived by squaring the paths shown in Figure 3. The influence of common genetic influences decreased and that of common shared environmental influences increased from 14 to 24 months. Age-specific influences were mostly non-shared environmental influences, which were significant at each age.
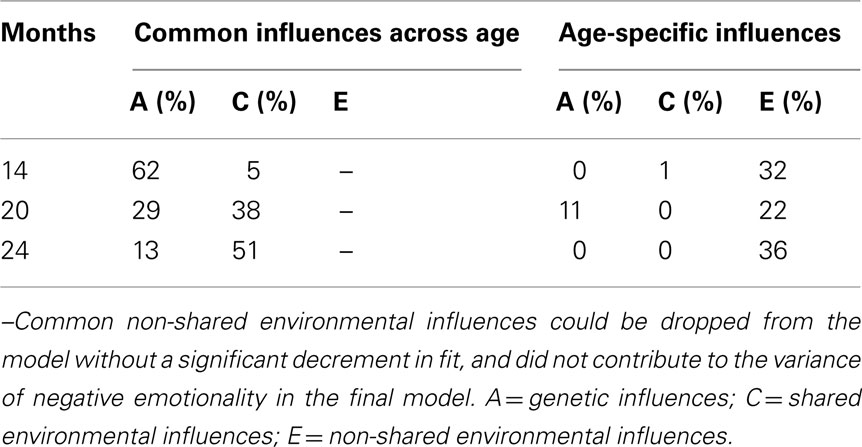
Table 6. Percentage of variance of negative emotionality explained by genetic and environmental influences at age 14, 20, and 24 months.
Table 7 shows the covariance of negative emotionality across each age due to A, C, and E and the respective percentages; these were also derived from the paths shown in Figure 3. The percentage of covariance between negative emotionality across age due to genetic influences ranged from 30 to 76%, and that due to shared environmental influences ranged from 24 to 70%.
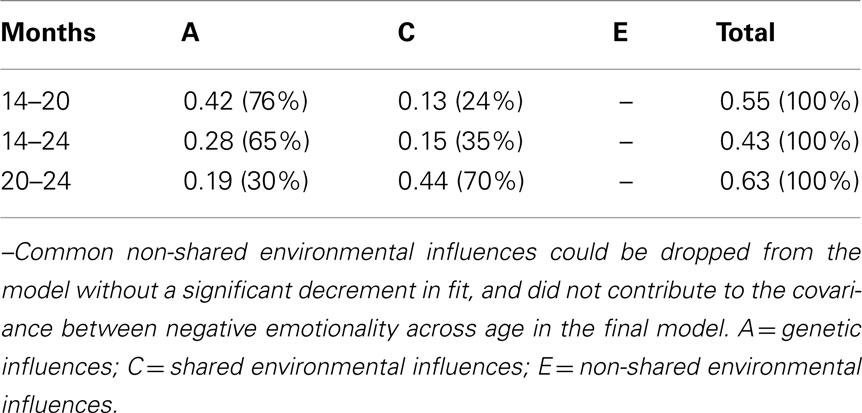
Table 7. Covariance (%) between negative emotionality across age explained by genetic and environmental influences.
Discussion
We examined the magnitude of genetic and environmental influences on observational measures of negative emotionality at age 14, 20, and 24 months, and on the stability of negative emotionality across age. First, we found evidence of a latent observed negative emotionality construct at each age. Second, we found that the latent negative emotionality factor was significantly heritable at age 14 months, but that heritability decreased and the magnitude of shared environmental influences increased from age 14 to 24 months. Third, the stability of negative emotionality was explained by common genetic and shared environmental influences, whereas age-specific influences were limited mostly to non-shared environmental influences.
Although there are many studies examining the magnitude of genetic influences on negative emotionality in very young children, most have examined parent reports, which have the methodological limitations of rater bias and contrast effects. Also, previous twin studies examining observed negative emotionality have had inconsistent results, and a criticism of observational measures is that they provide very brief snapshots of behavior, and may reflect state, rather than trait, behaviors (e.g., Kendler and Baker, 2007). We addressed these problems by examining observed negative emotionality across multiple settings: Restraint, Toy Removal, Bayley Scales, and Free Play. Negative emotionality levels assessed in three of these settings (Restraint, Toy Removal, and Bayley Scales) were all significantly intercorrelated at 14, 20, and 24 months2. Our results provide evidence that observed negative emotionality shows significant consistency across settings, and that there is a latent negative emotionality construct underlying the observed negative emotionality across situations.
Observed negative emotionality was significantly heritable at age 14 months, a result consistent with the definition of temperament as early emerging and heritable (Buss and Plomin, 1984). However, there was also evidence that heritability decreased and the magnitude of shared environmental influences increased with age. The decrease in the magnitude of genetic influences was significant, as fixing the genetic parameter to be equal across age led to a significant decrement in the fit of the model. This result conflicts with other genetically informative studies examining the development of temperament, which suggest that heritability actually increases with age (e.g., Wilson and Matheny, 1986).
The decrease in the magnitude of genetic influences and the increase in the magnitude of shared environmental influences may be a result of the type of observations examined in the present study. As noted above, there was a general decrease in negative emotionality in three out of four negative emotionality measures. During these assessments, children were restrained (Restraint), had a toy taken away (Toy Removal), or engaged in tests of cognitive ability (Bayley Scales). That is, these measures examined negative emotionality during situations involving mild stressors. In contrast, negative emotionality during Free Play, which did not involve a mild stressor, did not show a decrease with age, and was dropped from the biometrical model fitting analyses because it did not correlate significantly with all other measures of negative emotionality. These results suggest that children may be maturing and learning to cope with mild stressors from 14 to 24 months. Another possibility is that this is a developmental period during which children’s language abilities increase significantly (e.g., Reznick et al., 1997), and children’s verbal understanding of these situations may be increasing. Moreover, it is possible that children are finding these situations less stressful at later ages, as the same procedures are repeated at age 20 and 24 months.
It is possible that the decrease in heritability of negative emotionality may be limited to the negative emotionality responses to the particular situations examined here, and that responses to more stressful situations at later ages, or other measures of trait-based negative emotionality, such as neuroticism, may be more heritable. Therefore, a future direction we plan to pursue is an examination of the associations between these early measures of negative emotionality and later different operationalizations of negative emotionality and neuroticism.
The increase in shared environmental influences, especially the increase in similarity of DZ twin pairs, suggests that home environmental influences shared by siblings may make them more similar in their negative emotional responses to these mildly stressful situations over time. Several studies indicate that maternal style and family climate may be an important home environmental influence. For example, Matheny (1986) reported significant stability of temperament between 12 and 24 months, but that the infants who became more tractable (i.e., less negative, more attentive, more socially oriented, and less reactive) had mothers who were more expressive and involved with the child and families that were more cohesive. Similarly, Washington et al. (1986) found that premature infants who switched from difficult to easy temperament had mothers with higher scores on positive parenting scores than those who switched from easy to difficult temperament. One of our future goals is to examine the reciprocal influences between children’s negative emotionality and positive parenting across age in order to understand better the increase in shared environmental influences on negative emotionality.
Although there was a decrease in negative emotionality from 14 to 24 months, there were also significant and moderate cross-age correlations for the latent negative emotionality construct (0.41–0.65), suggesting that individuals with higher negative emotionality at 14 months were likely to have higher negative emotionality relative to others at later ages as well. The present study’s results suggested that the stability of negative emotionality, or the covariance between negative emotionality examined across age, was due mostly to common genetic and shared environmental influences, and that there was little evidence of common non-shared environmental influences. Common genetic influences accounted for more of the covariance between negative emotionality assessed at age 14 and 20 months and common shared environmental influences accounted for more of the covariance between negative emotionality assessed at age 20 and 24 months. In contrast, age-specific influences were largely limited to non-shared environmental influences, which also include measurement error. These results suggest that although the magnitude of genetic and shared environmental influences varied across age, the same genetic, and shared environmental influences affect negative emotionality from 14 to 24 months. An important next step is the examination of the etiology of individual differences in the decrease in negative emotionality. We plan to address this question by conducting latent growth curve modeling and estimating the magnitude of genetic and environmental influences on the intercept (i.e., variance that is stable with the initial level) and the slope (i.e., change from the initial level) of negative emotionality.
In conclusion, the present study found evidence of a latent negative emotionality construct that had significant loadings on negative emotionality observed in different situations, with very similar results at age 14, 20, and 24 months. Heritability decreased, and the magnitude of shared environmental influences increased, with age. There were significant correlations between negative emotionality assessed at age 14, 20, and 24 months, and evidence suggested common genetic and shared environmental influences affect negative emotionality across age, and that age-specific influences are limited to non-shared environmental influences, which include measurement error. Future directions include examining the role of positive parenting in the increase in shared environmental influences with age, the etiology of the associations between these early measures of negative emotionality and later different manifestations of negative emotionality and neuroticism, and the etiology of individual differences in change in negative emotionality.
Conflict of Interest Statement
The authors declare that the research was conducted in the absence of any commercial or financial relationships that could be construed as a potential conflict of interest.
Acknowledgments
This research was supported in part by grants from the MacArthur Foundation and NIH Grants MH016880, HD010333, HD007289, and HD050346. We thank Corinne Wright, Sally Ann Rhea, our research assistants, and our participants.
Footnotes
- ^The Cholesky model and the independent pathway model are nested. However, it was not possible to conduct a χ2 difference test between these models. In both models, several zero parameters had to be fixed to zero, because a parameter approaching its boundary can cause the model to fail. The same issue prevented a χ2 difference test between the full independent pathway model and the model where the common non-shared environmental influences were dropped.
- ^Negative emotionality assessed during Free Play was significantly correlated only with negative emotionality assessed during Bayley Scales at all three time points, possibly because Free Play and Bayley Scales shared a common coding scheme. It is possible that negative emotionality assessed during Restraint, Toy Removal, and Bayley Scales are more associated with each other than negative emotionality assessed during Free Play because the first three situations are more stressful to young children than Free Play. Also, the 15-min of Free Play that were coded occurred at the end of the entire home visit, and it is possible that fatigue contributed to the lower association between negative emotionality during Free Play and negative emotionality assessed in other settings.
References
Bayley, N. (1976). Manual for the Bayley Scales of Infant Development. New York: Psychological Corporation.
Belsky, J., Fish, M., and Isabella, R. (1991). Continuity and discontinuity in infant negative and positive emotionality: family antecedents and attachment consequences. Dev. Psychol. 37, 421–431.
Browne, M. W., and Cudeck, R. (1993). “Alternative ways of assessing model fit,” in Testing Structural Equation Models, eds K. A. Bollen and J. S. Long (Newbury Park, CA: Sage Publications, Inc.), 136–162.
Buss, A., and Plomin, R. (1984). Temperament: Early Developing Personality Traits. Hillsdale, NJ: Erlbaum.
Emde, R. N., and Easterbrooks, A. (1983). Hedonic Tone Scales. Denver, CO: University of Colorado School of Medicine.
Emde, R. N., Plomin, R., Robinson, J. A., Corley, R., DeFries, J., Fulker, D. W., Reznick, J. S., Campos, J., Kagan, J., and Zahn-Waxler, C. (1992). Temperament, emotion, and cognition at fourteen months: the MacArthur Longitudinal Twin Study. Child Dev. 63, 1437–1455.
Emde, R. N., Robinson, J. L., Corley, R. P., Nikkari, D., and Zahn-Waxler, C. (2001). “Reactions to restraint and anger-related expressions during the second year,” in Infancy to Early Childhood: Genetic and Environmental Influences on Developmental Change, eds R. Emde and J. Hewitt (New York, NY: Oxford University Press), 127–140.
Gjone, H., and Stevenson, J. (1997). A Longitudinal Twin Study of temperament and behavior problems: common genetic or environmental influences? J. Am. Acad. Child Adolesc. Psychiatry 36, 1448–1456.
Goldsmith, H. H., Buss, A. H., Plomin, R., Rothbart, M. K., Thomas, A., Chess, S., Hinde, R. A., and McCall, R. B. (1987). Roundtable: what is temperament? Four approaches. Child Dev. 58, 509–529.
Goldsmith, H. H., Buss, K. A., and Lemery, K. S. (1997). Toddler and childhood temperament: expanded content, stronger genetic evidence, and new evidence for the importance of environment. Dev. Psychol. 33, 891–905.
Goldsmith, H. H., and Gottesman, I. I. (1981). Origins of variation in behavioral style: a Longitudinal study of temperament in young twins. Child Dev. 52, 91–103.
Hu, L., and Bentler, P. M. (1998). Fit indices in covariance structure modeling: sensitivity to underparameterized model misspecification. Psychol. Methods 3, 424–453.
Keiley, M. K., Lofthouse, N., Bates, J. E., Dodge, K. A., and Pettit, G. S. (2003). Differential risks of covarying and pure components in mother and teacher reports of externalizing and internalizing behavior across ages 5 to 14. J. Abnorm. Psychol. 31, 267–283.
Kendler, K. S., and Baker, J. H. (2007). Genetic influences on measures of the environment: a systematic review. Psychol. Med. 37, 615–626.
Khan, A. A., Jacobson, K. C., Gardner, C. O., Prescott, C. A., and Kendler, K. S. (2005). Personality and comorbidity of common psychiatric disorders. Br. J. Psychiatry 186, 190–196.
Lahey, B. B., and Waldman, I. D. (2003). “A developmental propensity model of the origins of conduct problems during childhood and adolescence,” in Causes of Conduct Disorder and Juvinile Delinquency, eds B. B. Lahey, T. E. Moffit, and A. Caspi (New York: Guilford Press), 76–117.
Lilienfeld, S. O. (2003). Comorbidity between and within childhood externalizing and internalizing disorders: reflections and directions. J. Abnorm. Child Psychol. 31, 285–291.
Matheny, A. P. Jr. (1986). “Stability and change of infant temperament: contributions from the infant, mother, and family environment,” in Temperament Discussed, ed. G. Kohnstamm (Berwyn, PA: Swets North America), 49–58.
Muthén, L. K., and Muthén, B. O. (1998–2010). Mplus User’s Guide, 6th Edn. Los Angeles, CA: Muthén and Muthén.
Neale, M. C., and Cardon, L. R. (1992). Methodology for Genetic Studies of Twins and Families. Dordrecht: Kluwer Academic Publishers Group.
Nichols, R. C., and Bilbro, W. C. Jr. (1966). The diagnosis of twin zygosity. Acta Genet. Stat. Med. 16, 265–275.
Plomin, R., Kagan, J., Emde, R. N., Reznick, J. S., Braungart, J. M., Robinson, J. A., Campos, J., Zahn-Waxler, C., Corley, R., Fulker, D. W., and DeFries, J. C. (1993). Genetic change and continuity from fourteen to twenty months: the MacArthur Longitudinal Twin Study. Child Dev. 64, 1354–1376.
Reznick, J. S., Corley, R., and Robinson, J. (1997). A Longitudinal Twin Study of intelligence in the second year. Monogr. Soc. Res. Child Dev. 62, 1–160.
Rhea, S. A., Gross, A. A., Haberstick, B. C., and Corley, R. P. (2006). Colorado twin registry. Twin Res. Hum. Genet. 9, 941–949.
Saudino, K. J. (2005). Behavioral genetics and child temperament. J. Dev. Behav. Pediatr. 26, 214–223.
Schmitz, S., Fulker, D. W., Plomin, R., Zahn-Waxler, C., Emde, R. N., and DeFries, J. C. (1999). Temperament and problem behavior during early childhood. Int. J. Behav. Dev. 23, 333–355.
van der Valk, J. C., van den Oord, E. J. C. G., Verhulst, F. C., and Boomsma, D. I. (2001). Using parental ratings to study the etiology of 3-year-old twins’ problem behaviors: different views or rater bias? J. Child Psychol. Psychiatry 42, 921–931.
Washington, J., Minde, K., and Goldberg, S. (1986). Temperament in preterm infants: style and stability. J. Am. Acad. Child Psychiatry 25, 493–502.
Watson, D., and Clark, L. A. (1984). Negative affectivity: the disposition to experience aversive emotional states. Psychol. Bull. 98, 219–235.
Wilson, R. S., and Matheny, A. P. Jr. (1986). “Behavior genetics research in infant temperament: the Louisville Twin Study,” in The Study of Temperament: Changes, Continuities and Challenges, eds R. Plomin and J. Dunn (Hillsdale, NJ: Erlbaum), 81–97.
Keywords: negative emotionality, neuroticism, development, genetic influences, environmental influences
Citation: Rhee SH, Corley RP, Friedman NP, Hewitt JK, Hink LK, Johnson DP, Robinson J, Smith AK and Young SE (2012) The etiology of observed negative emotionality from 14 to 24 months. Front. Gene. 3:9. doi: 10.3389/fgene.2012.00009
Received: 01 October 2011;
Paper pending published: 10 November 2011;
Accepted: 12 January 2012;
Published online: 02 February 2012.
Edited by:
Andrew M. McIntosh, The University of Edinburgh, UKReviewed by:
Jeremy Hall, The University of Edinburgh, UKHeather C. Whalley, The University of Edinburgh, UK
Copyright: © 2012 Rhee, Corley, Friedman, Hewitt, Hink, Johnson, Robinson, Smith and Young. This is an open-access article distributed under the terms of the Creative Commons Attribution Non Commercial License, which permits non-commercial use, distribution, and reproduction in other forums, provided the original authors and source are credited.
*Correspondence: Soo Hyun Rhee, Department of Psychology and Neuroscience, University of Colorado Boulder, Campus Box 345, Boulder, CO 80309-0345, USA. e-mail: soo.rhee@colorado.edu


