 Robnet T. Kerns1,2 Pierre R. Bushel1,3*
- 1 Microarray and Genome Informatics, National Institute of Environmental Health Sciences, Research Triangle Park, NC, USA
- 2 Biostatistics Branch, National Institute of Environmental Health Sciences, Research Triangle Park, NC, USA
- 3 SRA International, Inc., Research Triangle Park, NC, USA
The era of toxicogenomics has introduced a new way of monitoring the effect of environmental stressors and toxicants on biological systems via quantification of changes in gene expression. Because the liver is one of the major organs for synthesis and secretion of substances which metabolize endogenous and exogenous materials, there has been a great deal of interest in elucidating predictive and mechanistic genomic markers of hepatotoxicity. This mini-review will bring context to a limited number of toxicogenomics studies which used genomics to evaluate the transcriptional changes in blood and liver in response to acetaminophen (APAP) or other liver toxicants, but differed according to the classification of interest (COI), i.e., the partitioning of the samples a priori according to a common toxicological characteristic. The toxicogenomics studies highlighted are characterized by a classification of either no/low vs. high APAP dose exposure, none vs. observed necrosis, and severity of necrosis. The overlap or lack thereof between the gene classifiers and the modulated biological processes that are elucidated will be discussed to enhance the understanding of the effect of the particular COI model and experimental design used for prediction.
Toxicogenomics
In toxicogenomics, gene expression data has been used to understand the transcriptional changes in response to exposure to environmental stressors and toxicants. The transcriptome may be a more effective marker or predictor for drug-induced liver injury (DILI) compared to other biomarkers (for a review see Watkins, 2009). Several toxicogenomics studies have monitored the gene expression changes in the liver and/or the blood following exposure to hepatotoxicants (Bushel et al., 2007; Huang et al., 2008, 2010). Figure 1A illustrates a few examples of descriptors used in toxicogenomics studies. For a given classical dose response curve, regions can be ill-defined as having no effect, an observable effect on the transcription of genes, or bracketed into a maximum limit where the highest dose produces an effect without appreciable toxicity (Figure 1A left inset). In other cases, measurements of serum enzymes alanine transaminase (ALT) and aspartate transaminase (AST) are typically used to monitor liver damage and separate samples into responders and non-responders of an exposure to a toxicant. However, increases in these transaminases are not good prognosticators of liver injury and as such, have limitations in their use as biomarkers (Blei, 2005). For instance, ALT measurements do not always correlate well with histopathological data. There can be cases where the variation of the ALT measure among samples sharing the same necrosis severity score is large (Huang et al., 2010). In a more practical approach, liver injury severity measures can be grouped into a composite score or according to the similarity of the biological processes of the samples to reflective a more intuitive phenotypic representation of the toxicant effect (Figure 1A right inset). Furthermore, and to complicate matters even further, when time is a function of the exposure along with dose, biological and transcriptional responses take the form of those exhibited in an acute/short-term effect that may or may not be reversible vs. a chronic or repeated effect resulting in a long-term manifestation of an injury. Cleary these limited, albeit general, representations of the interplay between toxicology and genomics provide good examples of how the desired end result of a toxicogenomics study ultimately depend on how one structures the study design and categorizes the phenotypic response(s).
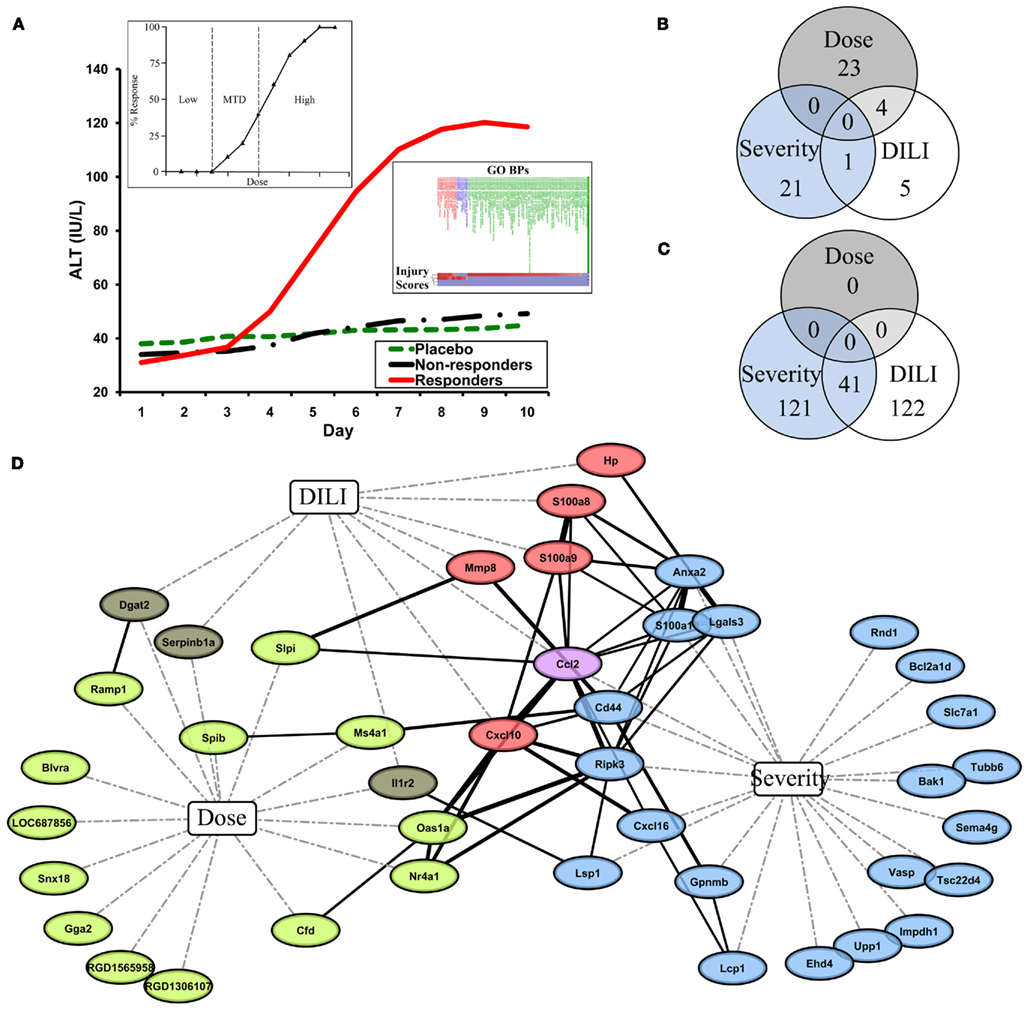
Figure 1. (A) A few examples of descriptors used in toxicogenomics studies. Main inset: ALT over time as a function of sample type. Left inset: classical dose response curve. MTD: minimum tolerated dose. Right inset: liver injury severity measures grouped according to similarity to gene ontology biological processes (GO BPs) (B,C) Intersection of COI-specific predictive gene signature probes (B) and gene ontologies enriched in those predictive gene signatures (C). (D) Network analysis of predictive gene signatures shows a common central gene relational network. Corresponding gene symbols of predictive gene signatures were submitted to STRING to generate a Gene Relational Network (solid black lines; line width correlates to STRING combined score, which is the computed final confidence score for association between two proteins). Nodes are connected to COIs Dose, Severity, and DILI by dashed lines. Node color further represents COI. Green: dose. Brown: dose and DILI. Red: DILI. Violet: DILI and severity. Blue: severity.
Classification of Interest
A region of interest (ROI) is commonly used in scientific research and analysis to focus on a particular area or subset of data identified for a particular purpose. In digital imaging for example, a ROI might be the focal point of a digital representation of an object. The ability to focus on a specific subset of data is useful to investigators in order to have a broader understanding of the larger experimental system or problem. Similarly, in toxicogenomics the classification of interest (COI) is defined as the a priori partitioning of biological samples according to a common toxicological characteristic.
Here we examine a set of three similar toxicogenomics studies (Bushel et al., 2007; Huang et al., 2008, 2010), each of which used the same toxicant for exposure, but varied according to COI. The first study, Bushel et al. (2007), investigated the utility of rat blood gene expression data to predict exposure to acetaminophen (APAP). The samples were segregated based on a binary COI defined as either no or low dose exposure vs. high dose exposure. In another study, Huang et al. (2008) targeted rat liver gene expression data to predict the extent of necrosis in the liver. Here the COI was defined as the severity of liver necrosis determined by visual histopathology. In the final study, Huang et al. (2010) explored the use of rat blood gene expression data to predict liver necrosis. The COI for this latter study was no visual liver necrosis vs. some observable sign of necrosis in the treated samples. Although each study was similarly designed to identify predictive markers based on rat gene expression in response to APAP exposure, the predictive gene signatures generated share very few microarray probes in common. Further, the predictive gene signatures from the three studies differ widely in enriched biological processes and thus biological interpretation. It is unclear how these subtle differences in the study COI contributed to the identification of predictor genes, biological interpretation of these gene signatures and therefore the ultimate conclusions.
Comparison of Studies
The three toxicogenomic studies examined each define similar predictive transcriptomic signatures based on related yet distinctive COI, i.e., blood transcriptomic signatures that predict dose of APAP exposure, liver transcriptomic signatures that predict the severity of liver necrosis, and blood and liver transcriptomic signatures that predict DILI (Table 1). To give an overview of the studies, these experiments are summarized and characterized as follows.
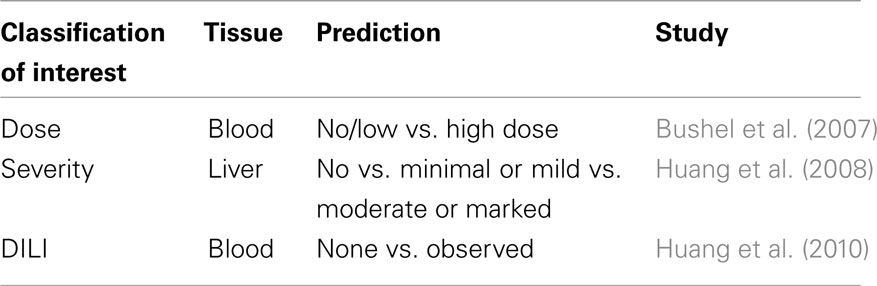
Table 1. Summary of predictive transcriptomics for APAP/DILI.
Using a blood gene expression dataset in rat, Bushel et al. (2007) reported a gene signature that predicted an endpoint of APAP exposure and classified the endpoint by level (no dose/low dose vs. high dose). Here into called the Dose-Classification. Using the Agilent 011868 Rat Oligo Microarray G4130A, pooling of the highly accurate classifiers common to any two out of the four prediction algorithms (k-NN/DME-ANOVA, PCA/EPIG, fuzzy-ARTMAP/DME-ANOVA, fuzzy-ARTMAP/DCE-ANOVA)1 resulted in 27 gene-probes. The classifiers were built to take advantage of dose as a main effect in the study with treatments levels divided into non\sub-toxic (0, 150 mg/kg) and toxic (1500, 2000 mg/kg) without considering the duration of exposure.
Huang et al. (2008) used rat liver gene expression assayed on the same array platform as Bushel et al. (2007) but from samples exposed to eight hepatotoxicants as a training set to predict the severity of liver injury. Here into called the Severity-Classification. An independent test set comprised of liver gene expression from rats treated with APAP, carbon tetrachloride and allyl alcohol. The union of the classifiers from the Random Forest and support vector machine prediction algorithms resulted in 22 gene-probes. The classifiers were trained using the partition of groups created by merging severity levels of a histopathological endpoint depending on the similarity of the biological processes of samples (group1: no necrosis; group2: minimal and mild necrosis; group3: moderate and marked necrosis) irrespective of the dose and/or time of exposure.
Huang et al. (2010) used liver and blood gene expression data from the Huang et al. (2008) study but predicted DILI within and across tissues, i.e., used the same predictive gene signature trained on liver expression to predict DILI based on both liver and blood gene expression data (and vice verse). Here into called the DILI-Classification. DILI was defined as a binary response (no necrosis vs. some observable sign of necrosis) without considering the dose and/or time of exposure. From the various, highly accurate predictors, 10 gene-probes occurred most often.
A meta-analysis of the data from these studies illustrates the effect of the COI in the identification of predictor genes and the interpretation of results. Although each study was similarly designed to identify predictive markers related to samples treated with APAP, there are very few probes common to all three gene signatures. While no gene-probes are common to each predictive gene signature, half of the DILI-Classification predictive gene signature probes (n = 10) overlap with either the Dose-Classification or Severity-Classification predictive gene signatures (n = 27 and n = 22, respectively), which have no gene-probes common amongst themselves (Figure 1B). The pattern of overlap of the gene signatures from the three studies is only partially reinforced by similar patterns of intersection of functionally enriched ontologies in the predictive gene signatures (Figure 1C) as the Dose-Classification signature is not functionally enriched for gene ontologies after multiple test correction. Yet, despite the presence of only a single gene-probe common to both predictive signatures (Figure 1C), the Severity-Classification and DILI-Classification studies revealed a large amount of functional overlap (Figure 1C; Table 2). Although there are no gene-probes or enriched gene ontologies common to all three gene signatures, surprisingly, genes from the three signatures together comprise a STRING-generated Gene Relational Network (Figure 1D) that is enriched for inflammatory and immune response ontologies (Table 2).
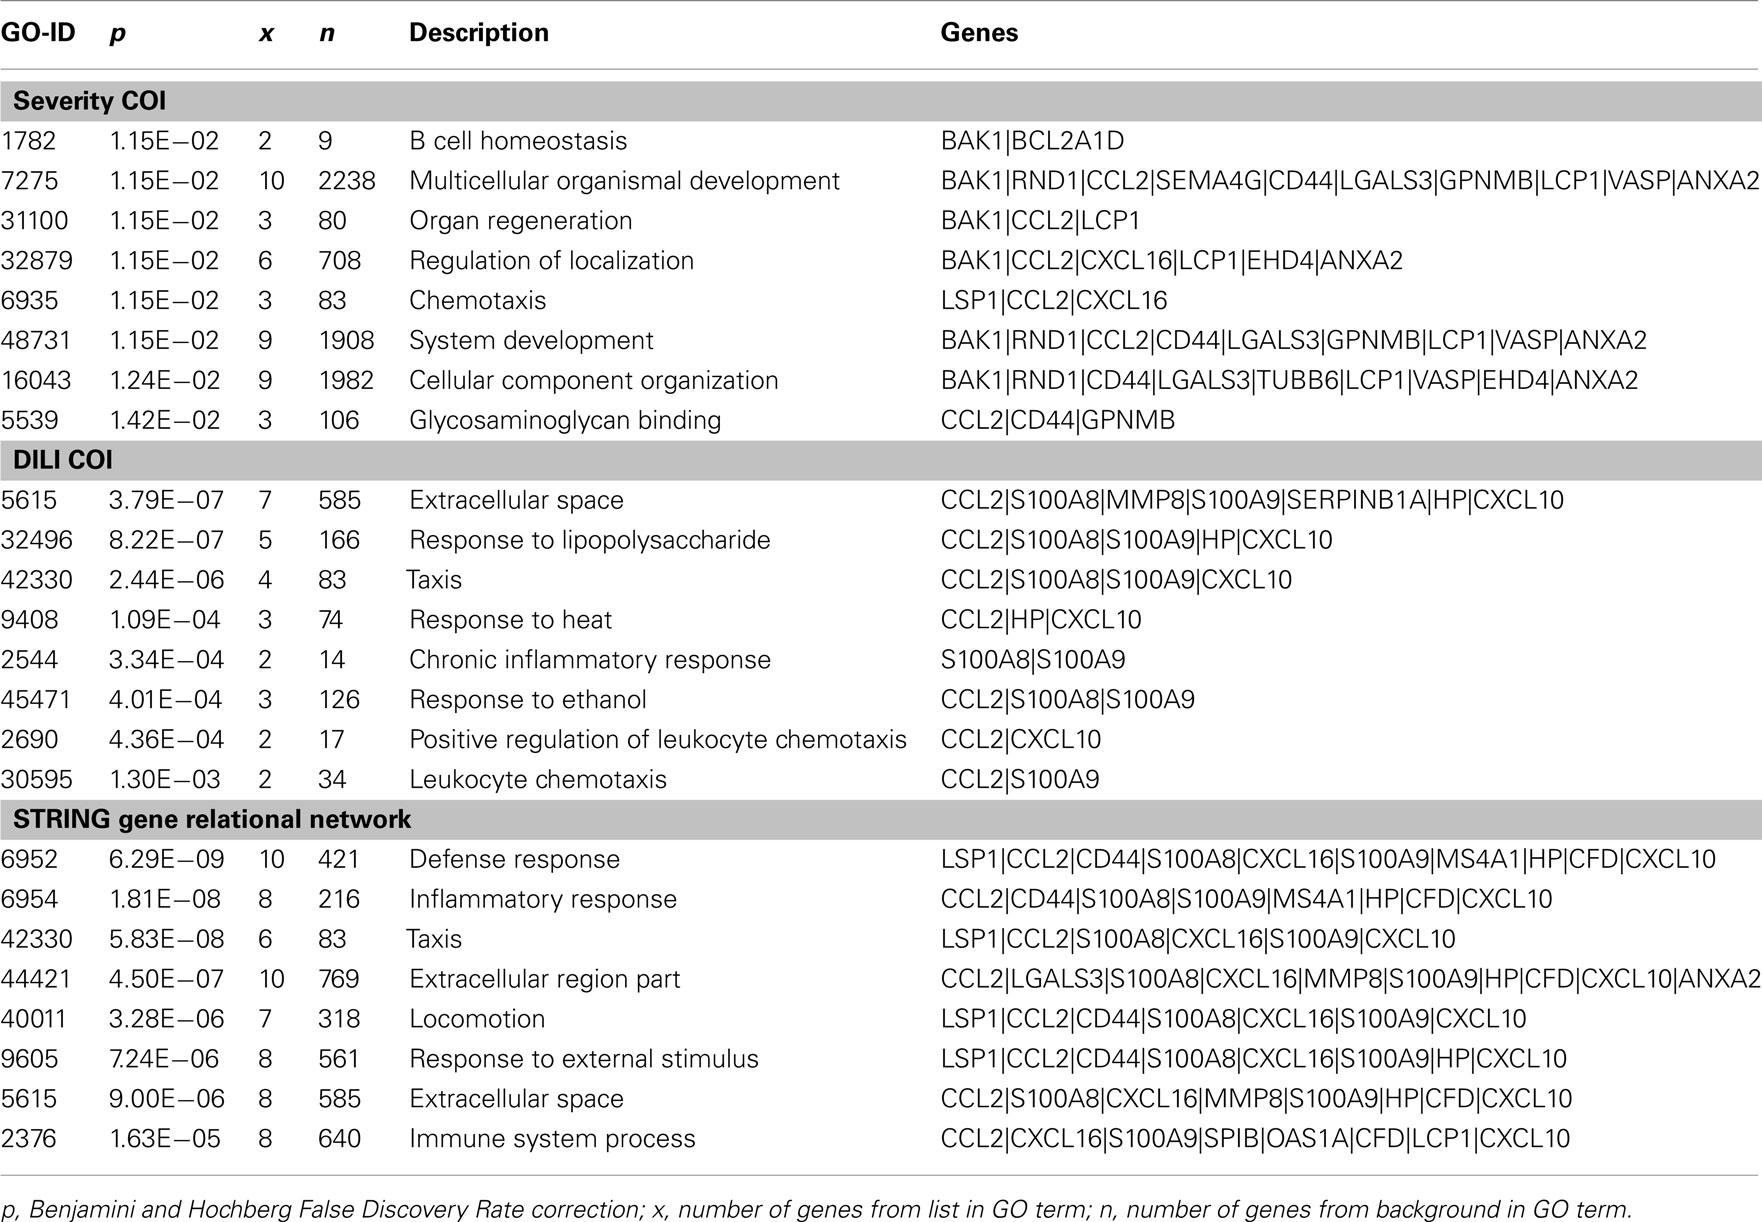
Table 2. Top eight BiNGO gene ontology terms enriched in Severity and DILI predictive gene signatures, and STRING gene relational network generated from the three predictive signatures.
Common to gene signatures that predict liver injury based on both liver and blood gene expression (Severity-Classification and DILI-Classification) was chemokine (C–C motif) ligand 2 (Ccl2), a key chemokine that regulates migration and infiltration of monocytes and macrophages, and has a putative role in APAP exposure and DILI. The Ccl2 protein measured by ELISA was shown to be elevated in blood from patients following acute APAP overdose (James et al., 2005). The role of Ccl2 in DILI was further implicated in a study of Ccl2-deficient mice which showed protection from necrosis when administered carbon tetrachloride (Zamara et al., 2007). In addition, when a mouse model genetically deficient in the C-C chemokine receptor and negatively mediates Ccl2 expression is challenged with APAP, an ELISA revealed elevated liver necrosis and increased Ccl2 protein (Hogaboam et al., 2000). The genes from the three COIs together form a relational network dominated by inflammatory responsive genes. These inflammatory responsive genes appear to be central to the major biological pathways that are presumably part of the mechanism(s) leading to APAP liver tissue damage.
One would certainly expect more overlap between the predictors for the different COIs. However, there is no reason why very few genes, even a single one would not have the predictive power to accurately classify the exposed samples. If more mechanistic information needs to be gleaned from the predictors, the number of genes in the classifiers can be enlarged. This will undoubtedly bring more biological context to the classifiers but definitely at the expense of losing prediction accuracy due to the addition of potentially noisy genes or genes as false positives. Where to draw the line is not abundantly clear. What is certain is that depending on a typical toxicogenomics study, if the gene expression data is analyzed using different COIs, then several different predictors can be derived as potential biomarkers which may have a small but biologically relevant common theme, yet still captures the underpinnings of the data surveyor’s interest. Possible solutions to this problem may be (1) include more descriptors for a study design, i.e., increase the size of the data used, (2) leverage a composite phenotype of many endpoint measurements, and/or (3) focus on a more informative classifier and improved training set.
Conflict of Interest Statement
The authors declare that the research was conducted in the absence of any commercial or financial relationships that could be construed as a potential conflict of interest.
Acknowledgments
This research was supported, in part by, the Intramural Research Program of the National Institutes of Health (NIH) and National Institute of Environmental Health Sciences (NIEHS; Z01 ES102345-04).
Footnote
- ^The prediction algorithms are designated as the method used for making the prediction followed by the method used to select the genes to build the classifier (i.e., k-NN/DME). k-NN, k-nearest neighbors; DME-ANOVA, an analysis of variance model with dose as the main effect; PCA, principal component analysis; EPIG, extracting patterns and identifying genes; fuzzy-ARTMAP, fuzzy adaptive resonance theory map (neural network); DCE-ANOVA, an analysis of variance model with dose as a confounded effect.
References
Blei, A. T. (2005). Selection for acute liver failure: have we got it right? Liver Transpl. 11(Suppl. 2), S30–S34.
Bushel, P. R., Heinloth, A. N., Li, J., Huang, L., Chou, J. W., Boorman, G. A., Malarkey, D. E., Houle, C. D., Ward, S. M., Wilson, R. E., Fannin, R. D., Russo, M. W., Watkins, P. B., Tennant, R. W., and Paules, R. S. (2007). Blood gene expression signatures predict exposure levels. Proc. Natl. Acad. Sci. U.S.A. 104, 18211–18216.
Hogaboam, C. M., Bone-Larson, C. L., Steinhauser, M. L., Matsukawa, A., Gosling, J., Boring, L., Charo, I. F., Simpson, K. J., Lukacs, N. W., and Kunkel, S. L. (2000). Exaggerated hepatic injury due to acetaminophen challenge in mice lacking C-C chemokine receptor 2. Am. J. Pathol. 156, 1245–1252.
Huang, J., Shi, W., Zhang, J., Chou, J. W., Paules, R. S., Gerrish, K., Li, J., Luo, J., Wolfinger, R. D., Bao, W., Chu, T. M., Nikolsky, Y., Nikolskaya, T., Dosymbekov, D., Tsyganova, M. O., Shi, L., Fan, X., Corton, J. C., Chen, M., Cheng, Y., Tong, W., Fang, H., and Bushel, P. R. (2010). Genomic indicators in the blood predict drug-induced liver injury. Pharmacogenomics J. 10, 267–277.
Huang, L., Heinloth, A. N., Zeng, Z. B., Paules, R. S., and Bushel, P. R. (2008). Genes related to apoptosis predict necrosis of the liver as a phenotype observed in rats exposed to a compendium of hepatotoxicants. BMC Genomics 9, 288.
James, L. P., Simpson, P. M., Farrar, H. C., Kearns, G. L., Wasserman, G. S., Blumer, J. L., Reed, M. D., Sullivan, J. E., and Hinson, J. A. (2005). Cytokines and toxicity in acetaminophen overdose. J. Clin. Pharmacol. 45, 1165–1171.
Maere, S., Heymans, K., and Kuiper, M. (2005). BiNGO: a Cytoscape plugin to assess overrepresentation of gene ontology categories in biological networks. Bioinformatics 21, 3448–3449.
Smoot, M. E., Ono, K., Ruscheinski, J., Wang, P. L., and Ideker, T. (2011). Cytoscape 2.8: new features for data integration and network visualization. Bioinformatics 27, 431–432.
Szklarczyk, D., Franceschini, A., Kuhn, M., Simonovic, M., Roth, A., Minguez, P., Doerks, T., Stark, M., Muller, J., Bork, P., Jensen, L. J., and Mering, C. V. (2011). The STRING database in 2011: functional interaction networks of proteins, globally integrated and scored. Nucleic Acids Res. 39, D561–D568.
Watkins, P. B. (2009). Biomarkers for the diagnosis and management of drug-induced liver injury. Semin. Liver Dis. 29, 393–399.
Zamara, E., Galastri, S., Aleffi, S., Petrai, I., Aragno, M., Mastrocola, R., Novo, E., Bertolani, C., Milani, S., Vizzutti, F., Vercelli, A., Pinzani, M., Laffi, G., LaVilla, G., Parola, M., and Marra, F. (2007). Prevention of severe toxic liver injury and oxidative stress in MCP-1-deficient mice. J. Hepatol. 46, 230–238.
Appendix
Addendum: Bioinformatics Methods Used for Analysis
Gene ontologies enriched in the assembled gene signatures for the three studies were created using BiNGO as described below.
Biomolecular interaction networks of predictive gene signatures were generated using STRING (Szklarczyk et al., 2011). Gene symbols from the three assembled gene signatures were submitted to STRING using the default settings, the output was downloaded as a text file and then imported into Cytoscape (Smoot et al., 2011) for graphical visualization. Interactions between genes and nodes representing a COI were manually added prior to import into Cytoscape.
Over-representation analysis of gene signatures and networks rendered in Cytoscape was by the BiNGO v. 2.44 plug-in (Maere et al., 2005) using the default settings, GO_Full as the selected ontology file and Rattus norvegicus as the selected annotation. For intersection comparison of gene ontologies enriched in gene signatures, all terms with Benjamini and Hochberg FDR correction p < 0.05 were used. For reporting significant functionally enriched ontologies in tabular format, terms were filtered to remove less significant ontologies with redundant gene lists; and, only the top eight filtered ontologies ranked by increasing p were reported.
Keywords: toxicogenomics, prediction, classification, gene expression, genomics, biomarker
Citation: Kerns RT and Bushel PR (2012) The impact of classification of interest on predictive toxicogenomics. Front. Gene. 3:14. doi: 10.3389/fgene.2012.00014
Received: 02 November 2011;
Paper pending published: 30 November 2011;
Accepted: 21 January 2012;
Published online: 07 February 2012.
Edited by:
Juergen Borlak, Fraunhofer Institute of Toxicology and Experimental Medicine Toxicology, GermanyCopyright: © 2012 Kerns and Bushel. This is an open-access article distributed under the terms of the Creative Commons Attribution Non Commercial License, which permits non-commercial use, distribution, and reproduction in other forums, provided the original authors and source are credited.
*Correspondence: Pierre R. Bushel, Biostatistics Branch, National Institute of Environmental Health Sciences, P.O. Box 12233, Research Triangle Park, NC 27709, USA. e-mail: bushel@niehs.nih.gov