
- 1 Department of Electrical Engineering ESAT-SCD, Katholieke Universiteit Leuven, Leuven, Belgium
- 2 IBBT-KU Leuven Future Health Department, Katholieke Universiteit Leuven, Leuven, Belgium
- 3 Department of Physiology, McGill University, Montreal, QC, Canada
- 4 Department of Biochemistry, Immunology and Microbiology, University of Ottawa, Ottawa, ON, Canada
- 5 Ottawa Hospital Research Institute, Ottawa, ON, Canada
High-throughput molecular biology studies, such as microarray assays of gene expression, two-hybrid experiments for detecting protein interactions, or ChIP-Seq experiments for transcription factor binding, often result in an “interesting” set of genes – say, genes that are co-expressed or bound by the same factor. One way of understanding the biological meaning of such a set is to consider what processes or functions, as defined in an ontology, are over-represented (enriched) or under-represented (depleted) among genes in the set. Usually, the significance of enrichment or depletion scores is based on simple statistical models and on the membership of genes in different classifications. We consider the more general problem of computing p-values for arbitrary integer additive statistics, or weighted membership functions. Such membership functions can be used to represent, for example, prior knowledge on the role of certain genes or classifications, differential importance of different classifications or genes to the experimenter, hierarchical relationships between classifications, or different degrees of interestingness or evidence for specific genes. We describe a generic dynamic programming algorithm that can compute exact p-values for arbitrary integer additive statistics. We also describe several optimizations for important special cases, which can provide orders-of-magnitude speed up in the computations. We apply our methods to datasets describing oxidative phosphorylation and parturition and compare p-values based on computations of several different statistics for measuring enrichment. We find major differences between p-values resulting from these statistics, and that some statistics recover “gold standard” annotations of the data better than others. Our work establishes a theoretical and algorithmic basis for far richer notions of enrichment or depletion of gene sets with respect to gene ontologies than has previously been available.
Introduction
High-throughput studies often generate large sets of “interesting” genes that must be further researched from available annotation resources. This research may encompass literature reviews and querying various databases. This process leads to a multitude of information to consider for each gene as well as inconsistent gene descriptions from one resource to another. The application of a statistic to a particular annotation resource can identify the statistically significant classifications common to the set of interesting genes (Man et al., 2000; Berriz et al., 2003; Castillo-Davis and Hartl, 2003; Diaz-Uriarte and Dopazo, 2003; Doniger et al., 2003; Draghici et al., 2003; Hosack et al., 2003; King et al., 2003; Al-Shahrour et al., 2004; Zhang et al., 2004; Khatri and Draghici, 2005). In this paper we generalize previous work by allowing genes to have weighted memberships in classifications.
Weighted membership functions offer far more expressive power than traditional binary membership functions, as we demonstrate below. They allow us to represent complicated relationships within an ontology, distinguish good from weak representatives of a classification, account for the strength of evidence from a high-throughput study, or more generally account for relationships between different data sets. Thus, the extension of gene ontology (GO) analysis to weighted membership is an important one.
The problem of determining statistical significance under weighted membership is more complicated than under binary membership. There is a computational “cost” to the generality we gain. In this sense, it is reminiscent of the well-known knapsack problem. The knapsack problem is trivially solvable if all items have unit weight. If items have arbitrary weights, it is NP-complete, although a pseudopolynomial-time dynamic program can usually solve realistic instances quite efficiently. In similar fashion, we derive a pseudopolynomial-time dynamic programming algorithm for computing exact p-values for the statistical significance of enrichment or depletion of classifications under weighted membership. Moreover, we show that for several specific weighted membership functions, the algorithm can be specialized to gain greater computational efficiency. We apply these methods to two test data sets, where we show that weighted membership functions are better able to extract biologically meaningful classifications than traditional binary analysis.
Gene Ontology
Our methods are not restricted to any particular ontology, but because of its popularity, we focus on the well-known GO. GO (The Gene Ontology Consortium, 2000) is a controlled, hierarchically organized vocabulary that aims to provide a consistent description of genes to the biological community, along with relationships between these descriptions. GO includes three principal classifications: molecular function, biological process, and cellular component, as well as many more specific classifications. Molecular functions are the biochemical roles of genes, for example, GTPase activity. Biological processes involve one or more molecular functions over multiple distinguished steps. An example of this would be mitosis, where each interaction of proteins in the progression of the cell cycle would be considered a step. Cellular components are described as the localization of a protein in the cell or its membership in a complex. An example would be the proteins that are members of the ribosomal complex.
The relationships between classifications define a directed acyclic graph (DAG), in which vertices in the DAG correspond to classifications and a directed edge from classification X to classification Y means that Y is a direct specialization of X. Some authors assume that there is no more general classification than the three principal classifications. We assume a root vertex gene ontology, with the principal classifications as children. Having defined a root, we therefore discuss the GO DRAG (Directed Rooted Acyclic Graph) in the rest of this paper. All vertices except the root have at least one parent, and may have more. Hexose biosynthesis, for example, has two parents, hexose metabolism and monosaccharide biosynthesis (The Gene Ontology Consortium,
Genes may be mapped to one or more classifications. A mapping is the association of a gene to a classification. Cytochrome c is one such example; it is mapped to the molecular function classification electron transporter activity, the biological process classifications oxidative phosphorylation and induction of cell death, and cellular component classifications mitochondrial matrix and mitochondrial inner membrane. As parent vertices are less specific classifications than their child vertices, genes mapped to the child vertices are understood to be also described by the parent vertices. We say that gene X is a member of classification Y if X is directly mapped to Y or if it is mapped to any classification that specializes Y – that is, to any classification which is reachable in the DRAG from Y.
While GO provides classifications that can be used to describe the genes in an interesting set, it does not provide guidance on which of the classifications are of interest to researchers for further investigation. The number of classifications to consider can be reduced by focusing on classifications that are enriched or depleted as defined in a statistical framework (Draghici et al., 2003; Zeeberg et al., 2003).
Weighted Membership in Classifications
Suppose a gene g has been flagged as interesting based on a laboratory experiment. For example, gene g may be differentially expressed in a microarray experiment or may have a specific post-transcriptional modification. Now consider a classification v. Does g provide evidence, and if so, how much, for the involvement of classification v in the condition under study? The simplest heuristic would be to say that g provides evidence for v if and only if g is a member of v (Draghici et al., 2003; Zeeberg et al., 2003). However, one may also consider weighted membership scores, which might account for relationships between classifications, degrees of differential expression, or other knowledge. For example, consider the DRAG and gene mappings depicted in Figure 1. Gene g2 is mapped to classifications v7 and v8. If g2 is flagged as interesting, we do not know if it is because of the involvement of v7, v8, or both. In any case, however, the flagging of g2 indicates the involvement of classification v4. So, we might interpret g2 as providing stronger evidence, or greater weight, for v4 than either of v7 and v8. Then again, if g5 is also flagged, and has much greater differential expression than g2, we might decide the strongest evidence is for classification v6. Conversely, some genes in a classification many never be differentially expressed, and that should not be taken as evidence against the classification. For example, in signaling or metabolic pathways, it is common for many proteins to be ubiquitously expressed at a basal rate, whether the pathway is active or not. One might want to give such genes small or even zero membership weight in that pathway – for the purpose of determining which pathways are represented in the interesting set of genes – so that when the genes that are regulated change their expression, the activity in the pathway is more apparent. Thus, we wish to be able to determine significance for more general notions of evidence, or weighted membership functions.
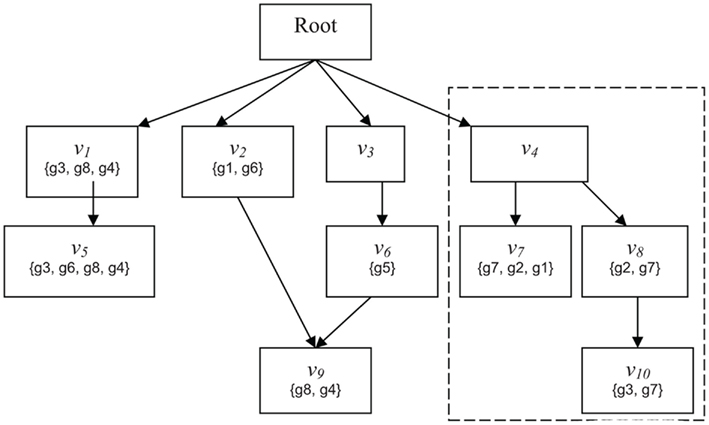
Figure 1. Schematic of GO. Abstract example of an ontology illustrating the principles of the GO DRAG and the scoring functions Boxes labeled with Root or n correspond to classifications Sets represent the genes directly mapped to each classification. The broken line indicates the subgraph rooted at v − i.
Given a DRAG and a population set of genes G, we define a weighted membership function Φ:G × V → Z+, where V is the set of all classifications and Z+ is the set of non-negative integers. Φ(g, v) is always zero if g is not a member of v, but otherwise Φ(g, v) is unconstrained. The standard membership function is an important special case, which we will denote by Φ1(g, v) = {1 if g ∈ v; 0 if g ∉ v}. We will consider two other weighted membership functions, although many interesting choices are possible. We define Φ2(g, v) as the number of paths in the ontology DRAG from v to any vertex v′ to which g is mapped. This is intended to account for situations such as for g2 in the example of the previous paragraph. In that example, Φ2(g2, v7) = Φ2(g2, v8) = 1, but Φ2(g2, v4) = 2, indicating that, all other things being equal, we have greater confidence that g2 is representative of classification v4 than it is of either v7 or v8 under any particular circumstance. For Φ3 we assume access to an integer-valued vector X, where X(g) might represent, for example, a discretized measure of differential expression from a high-throughput gene expression experiment. We define Φ3(g, v) = {X(g) if g ∈ v; 0 if g ∉ v}.
Ultimately, we want to assess the enrichment or depletion of a set of genes with respect to a classification. For this purpose, any weighted membership function Φ can be generalized to take as input a set of genes H and a classification, simply by summing the scores of the individual genes. That is, Φ(H, v) = Σg∈HΦ(g, v).
P-Values for the Significance of Enrichment or Depletion
We assume now that a laboratory experiment has flagged a set of interesting genes H, and we want to know whether the set H provides evidence for a classification v. We choose a weighted membership function ΦA, and want to know whether ΦA(H, v) is significantly greater than would be expected by chance. To define this precisely, we must account for properties of the interesting set, H. If H is large, for example, we generally expect higher classification scores, and thus the threshold for significant enrichment ought to be higher. More generally, we allow conditioning not just on the size of H, but on the score of the set H under any weighted membership function ΦB evaluated at the root classification. Thus, let H′ represent a random subset of G, which we take to be uniformly distributed over all subsets of G satisfying ΦB(H′, r) = ΦB(H, r), where r is the root classification. In general, we consider p-values for enrichment of classification v of the form:

where ΦA and ΦB can be any two weighted membership functions and r is the root classification. We use the shorthand notation ΦA | ΦB to denote this p-value. (See Figure A1 in Appendix for some worked examples based on Figure 1.) The p-value for depletion simply has the inequality reversed.
In the special case that ΦA = ΦB = Φ1, the condition ΦB(H′, r) = ΦB(H, r) implies that H′ is restricted to sets of the same size as H and ΦA(H′, v) is just the number of genes in H′ that are members of v. The p-value is then just the widely used membership p-value, which can be computed via the hypergeometric equation as (Draghici et al., 2003; Zeeberg et al., 2003):
where N is the number of genes that are members of v, M is the number of genes in G that are not members of v, c = |H|, and m = c − n. We can also write this without reference to N, M, or c using the substitutions N = Φ1(G, v), M = Φ1(G, r) − Φ1(G, v) and c = Φ1(H, r). More generally, if ΦB = Φ1 but ΦA is not equal to Φ1, then the p-value represents the chance of getting a score ΦA(H′, v) ≥ ΦA(H, v) if H′ is uniformly random from all sets of genes of the same size as H.
The simple formula for Φ1 | Φ1 is often introduced in the context of ball-and-urn models. One imagines N red balls and M blue balls mixed together in an urn, and then c balls are drawn from the urn randomly but without replacement. This metaphor fails for general ΦA | ΦB for two reasons. First, because membership is weighted, the balls, corresponding to genes, do not have equal significance. Second, because a gene g may have ΦA(g, v) > 0 and ΦA(g, v) ≠ ΦB(g, r) > 0, the balls may be not just strictly red or blue but some combination of both. There is no simple formula for ΦA | ΦB in general, but in the next section we describe dynamic programming algorithms for computing this p-value.
Due to representation of GO as a DRAG and the mapping of genes to GO, an exact method for measuring such p-values has never been proposed. More precisely, the main challenges presented by the GO model are the lack of independent and unique genes. As genes can be mapped to one or more classifications, they are not unique. For example, in Figure 1, g6 is mapped to both v2 and v5. Due to this feature of the model, genes can be reachable in both a subgraph rooted at v and in its complement  Thus, such genes are not independent as selecting them in v will also require that they be selected in
  For example, in Figure 1, g1 is reachable in both the subgraph rooted at v4 (mapped to v7) and at its complement (mapped to v2).
Looking at Figure 2, one can better appreciate the difference in an unweighted versus a weighted model. Unweighted values can be seen as the balls in urn A. As these balls are independent, the possible observations can be easily modeled by the hypergeometric. Under a weighted model, this is not possible due to the interrelated nature of the balls. The balls in urn B are dependent as they are attached by a string, hence the hypergeometric model cannot be used to model observations of randomly picking balls from urn B. Thus, the probability of observing two gray balls given four balls were selected from urn B is 0.16.
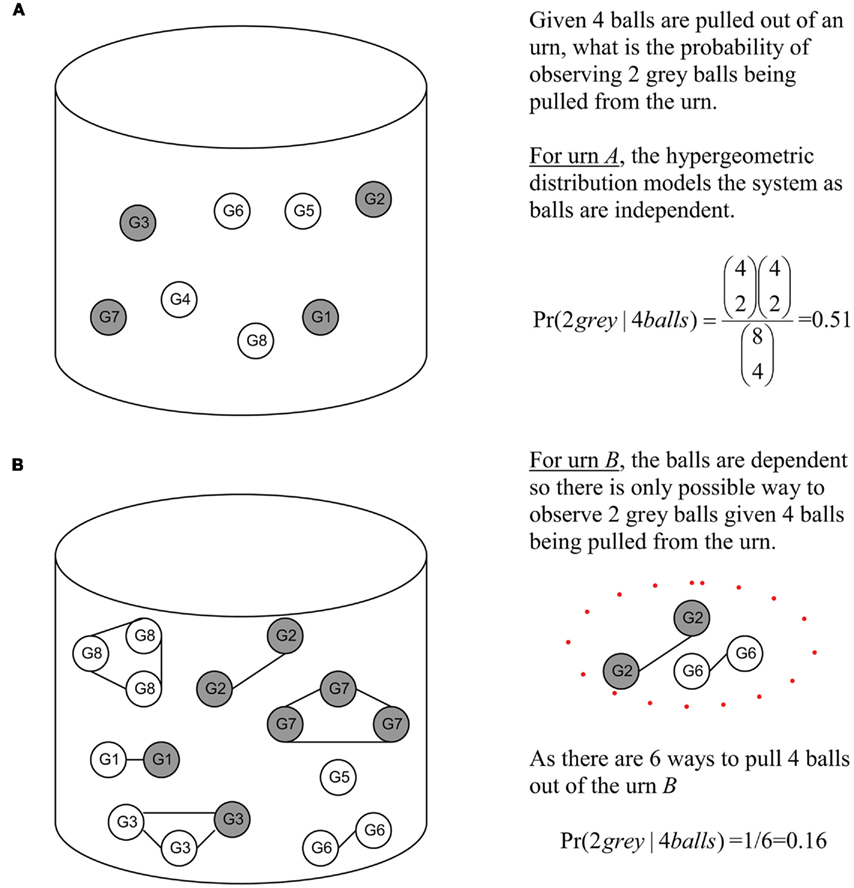
Figure 2. Urn representation of Figure 1 diagram illustrating the principles of independent versus interrelated models. Gray balls (genes) are those found at or below v4 and white balls (white) are those found in the rest of the DRAG. (A) Gray and white balls (genes) in urn arc independent. (B) Gray and while (genes) in urn are interrelated, the GO DRAG and the scoring functions. The solid lines indicate that balls (genes) are related.
Our primary technical contribution is to describe how to determine p-vales given a model where one cannot assume gene weights to be independent or unique. Precise computation of the p-values allows greater confidence in biological assertions made based on the statistical modeling.
Materials and Methods
Exact computation of the p-value (Eq. 1) is NP-complete, for example, by reduction from the 0 to 1 knapsack problem. Like the 0–1 knapsack problem, however, it can be solved in pseudopolynomial-time by a dynamic programming method. We first describe a generic dynamic programming method for computing the p-value, and then describe several improvements and special cases that can significantly speed the computation.
Naïve Dynamic Programming Approach
We construct a two-dimensional table T, where T(a, b) represents the number of subsets H′ of G for which ΦA(H′, v) = a and ΦB(H′, r) = b. The main loop is over genes g in G. The update rule for the table (see line five below), T(a + ΦA(g, v), b + ΦB(g, r)) ← T(a, b) + T(a + ΦA(g, v), b + ΦB(g, r)), is based on the observation that any subset H′ satisfying the constraints ΦA(H′, v) = a and ΦB(H′, r) = b either includes the gene g or does not include g. Values for a range from 0 to Amax = ΦA(G, v), and values for b range from 0 to Bmax = ΦB(G, r). Line 8 of the code below accounts for a set H′ made up of only the gene g. To simplify the presentation of the code, we have allowed it to access T outside of these ranges; such values should always be taken to be zero.
(1) Initialize: T(a, b) ← 0 for all a, b
(2) For each g ∈ G
(3) For a = 0 to Amax
(4) For b = 0 to Bmax
(5) T(a + ΦA(g, v), b + ΦB(g, r)) ← T(a, b) +
T(a + ΦA(g, v), b + ΦB(g, r))
(6) End
(7) End
(8) T(ΦA(g, v),ΦB(g, r)) ← T(ΦA(g, v),ΦB(g, r)) + 1
(9) End
The desired p-value, ΦA | ΦB, is the computed as:
The time complexity of this algorithm, measured by the number of table updates, is O(|G | Amax Bmax). The table entries can easily become larger than integer or long integer precision, and so it is necessary to use arbitrary precision arithmetic. Nevertheless, this computation is feasible for typical problems in which |G| may be of the order 103 or 104 and Amax and Bmax may be of the order 103–105. This gives the p-value for enrichment of only a single classification. If p-values for multiple, even all, of the classifications are sought, the time complexity is multiplied by the number of classifications being tested. For particular choices of ΦA and ΦB, more efficient dynamic programs can be developed. This is the subject of the following subsections.
Improvements to the Naïve Dynamic Program
Several changes to the naïve dynamic program can drastically increase its computational and storage efficiencies. First, one only needs the first ΦB(H, r) columns of the table T, as it is the last column that is used in the computation of the p-value. Although a simple observation, this can be a dramatic improvement if ΦB(H, r) is small. For example, if ΦB = Φ1 and considering that typically |H| = |G|, one could expect to save at least an order of magnitude computation and storage.
Second, many genes g may have the same weights, ΦA(g, v) and ΦB(g, r). We define the weight count Wi,j to be the number of genes g with ΦA(g, v) = i and ΦB(g, r) = j. These groups of genes can be treated simultaneously – if k of these genes are included in a subset H′, then the contribution to ΦA(H′, v) and ΦB(H′, r) is the same regardless of precisely which k are chosen. If we add an innermost loop over k to our dynamic program, the main update rule above (step 5) can thus be restated as:
A third optimization is possible in the case that ΦA(g, v) = 0 for many genes g. We can split the dynamic program into two tables, T1 and T2. T1(a, b) is the number of subsets H′ of genes with ΦA(H′, v) = a and ΦB(H′, r) = b, where H′ is restricted to contain only genes for which ΦA(g, v) > 0. T2 is a one-dimensional table in which T2(b) is the number of subsets H′ of genes with ΦB(H′, r) = b, where H′ is restricted to contain only genes for which ΦA(g, v) = 0. From these two tables, the original T(a, b) can be reconstructed as T(a, b) = Σb′ T1(a, b′)*T2(b − b′).
These improvements can be used independently or combined for the greatest effect, and may even be further improved in some particular cases. In the next subsection we discuss three particular p-values we use in our experiments in relation to these improvements to the dynamic program.
Dynamic Programs for Φ2 | Φ1, Φ2 | Φ2 and Φ3 | Φ3
There are many possible choices for Φ, and many combinations, resulting in different p-values for measuring the statistical significance of enrichment or depletion of GO classifications. Recall that in Section “P-Values for the Significance of Enrichment or Depletion” we defined several possible choices of Φ (see also Table 1 for a notational reminder): Φ1 is the standard binary membership function, Φ2(g, v) measured the number of paths in the DRAG from v to any classification v′ to which g is mapped, and Φ3(g, v) is equal to some global “score” (e.g., differential expression) assigned to g if g is mapped to v, and otherwise is equal to zero. Here, we derived specialized, more efficient dynamic programs for computing p-values involving these three choices of Φ. The first is Φ2 | Φ1. Conditioning on Φ1 is perhaps most natural when H is determined experimentally (say by a microarray study), because the size of H often depends on some arbitrary significance cut-off or other practical considerations. Secondly, we consider Φ2 | Φ2, which may be more natural when genes of interest are not determined experimentally but based on some other property – for example, sharing a particular transmembrane domain. Finally we consider Φ3 | Φ3, which reflects an intuitively compelling situation where one wishes to make use of expression level measurements, which are common to many genomics studies. We describe the implementations of these cases below.
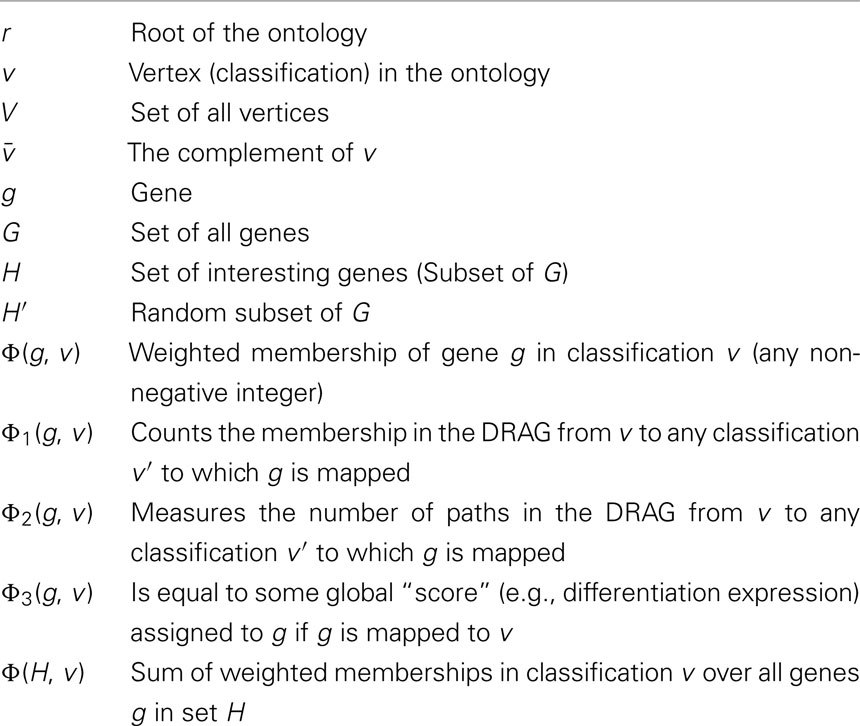
Table 1. Summary of notation used in this paper.
We use all three optimizations described in Section “Improvements to the Naïve Dynamic Program” to compute Φ2 | Φ1. In the two-table decomposition, the second table does not actually need to be computed, as T2(b) is just M choose b, where M is the number of genes that are not members of classification v. The weight counts Wi,j are zero for j≠1, so we can drop the j subscript and refer simply to Wi. Let I be the maximum value of i for which Wi is positive. The pseudocode for computing table T1 is as follows.
(1) Initialize T1(a, b) = 0 for all a, b
(2) For i = 1 to I
(3) For b = 1 to |H|
(4) For a = 1 to Amax
(5) For k = 1 to Wi
(6) 
(7) End
(8) End
(9) End
(10) For k = 1 to Wi
(11) 
(12) End
(13) End
To compute Φ2 | Φ1, the summation Σb′T1(a, b′)*(M choose (b − b′)) can be substituted for T(a, b) in Eq. 3. However, the denominator is simply (|G| choose |H|) in this case, so we can simply compute Φ2 | Φ1 = ΣaΣb′T1(a, b′)*(M choose (b − b′)), where the a in the sum goes from Φ2(H, v) to Amax, and divide by (|G| choose |H|).
For Φ2 | Φ2 we need to compute tables T1 and T2 explicitly. The straightforward computation of T1 would be wasteful because for any subset of genes H′ we have Φ2(H′, r) ≥ Φ2(H′, v). Thus, all entries of T1 below the main diagonal would be zero. Instead, we slightly redefine T1 so that the columns correspond to Φ2(H′, r) − Φ2(H′, v) instead of just Φ2(H′, r). For simplicity, we omit the weight count optimization, so that the pseudocode for computing T1 is then:
(1) Initialize T1(a, b) ← 0 for all a, b
(2) For each gene g with Φ2(g, v) > 0
(3) For b = 0 to Φ2(G, r) − Φ2(G, v)
(4) For a = 1 to Φ2(G, v)
(5) T1(a + Φ2(g, v), b + (Φ2(g, r) − Φ2(g, v))) ←
T1(a, b) + T1(a + Φ2(g, v), b + (Φ2(g, r) − Φ2(g, v)))
(6) End
(7) End
(8) T1(Φ2(g, v),Φ2(g, r) − Φ2(g, v)) ←
T1(Φ2(g, v),Φ2(g, r) − Φ2(g, v)) + 1
(9) End
The computation of T2 is straightforward. T2(b) is the number of ways of making Φ2(H′, r) using only genes g, for which Φ2(g, v) = 0. We use the weight count trick to speed to computation, defining J to be the maximum j for which W0,j > 0. The pseudocode for creating the table is as follows:
(1) Initialize T2(b) ← 0 for all b
(2) For j = 1 to J
(3) For b = 1 to Φ2(G, r)
(4) For k = 1 to Wj
(5) 
(6) End
(7) End
(8) For k = 1 to Wj
(9) 
(10) End
(11) End
The p-value Φ2 | Φ2 can be computed using Eq. 3 with the substitution T(a, b) = Σb′T1(a, b′ − a)*T2(b − b′). The p-value Φ3 | Φ3 can be computed similarly.
Data Sources
To test our approaches, we used the OXPHOS-CR (oxidative phosphorylation co-regulated) dataset (53 genes) from (Subramanian et al., 2005). The dataset can be characterized as containing OXPHOS genes that are tightly co-regulated across many tissues. Three other datasets were derived from this dataset, each assigned 100, 300, and 500 additional random genes to mimic noisy datasets.
We also applied the four methods of determining significance described above (Φ1 | Φ1, Φ2 | Φ1, Φ3 | Φ3, and Φ2 | Φ2) to a publicly available dataset concerning changes in gene expression in the rat uterus at different stages of parturition (Girotti and Zingg, 2003). The Girotti study used rat Genome U34A GeneChips (Affymetrix) to measure five time-points in rat pregnancy: day 0, day 20, at term but not in labor, at term and in labor, and postpartum. The Girotti study presents a literature search for genes showing differential expression in at least one time-point comparison. Filtering criteria applied in the study resulted in 4137 genes (Girotti erroneously reported the number as 4138) forming the population set of genes, of which 431 interesting genes (non-redundant genes that were differentially expressed between day 0 and any other time-point) were annotated using various annotation resources (SwissProt, ExPASy, and other databases) into 17 user-defined classifications. In our study, the GO DRAG was limited to vertices to which the 4137 genes (the set G) are mapped. The 431 genes were used to define the interesting set H. The GO definitions were supplied by GO for the U34A GeneChip (Affymetrix; (The Gene Ontology Consortium,
Results and Discussion
In order to evaluate the quantitative performance of the methods, we ran them on the OXPHOS-CR dataset and took the 35 classifications that were annotated to this dataset to be a “golden standard.” In practice, a set of interesting genes will not only be composed of purely interesting genes but also noise (false positives). We therefore ran our methods on the “noisy” datasets that were derived from the golden standard by the addition of random genes (+100 genes, +300 genes, +500 genes).
The results, shown in Table 2, show that the Φ2 | Φ2 method was able to maintain the ranking of golden standard classifications better than the Φ1 | Φ1 (traditional hypergeometric) or the Φ2 | Φ1 methods when applied to the noisy datasets. Figure 3 provides the ROC plot of the rankings of the classifications for the “noisy” datasets resulting from the application of all three methods. Looking at the added 500 random genes dataset (Figure 3A), it is clear that the Φ2 | Φ2 method provides the best ranking of the classifications. Looking again at Table 2, one can see that the methods differ with respect to specificity and sensitivity (with statistical significance threshold set at p ≤ 0.05). Overall, the Φ2 | Φ1 and Φ1 | Φ1 had good specificity but poor sensitivity. In contrast the Φ2 | Φ2 had much better sensitivity than the other two methods but variable specificity. Likewise, Φ2 | Φ2 consistently had a better AUC than the other two methods.
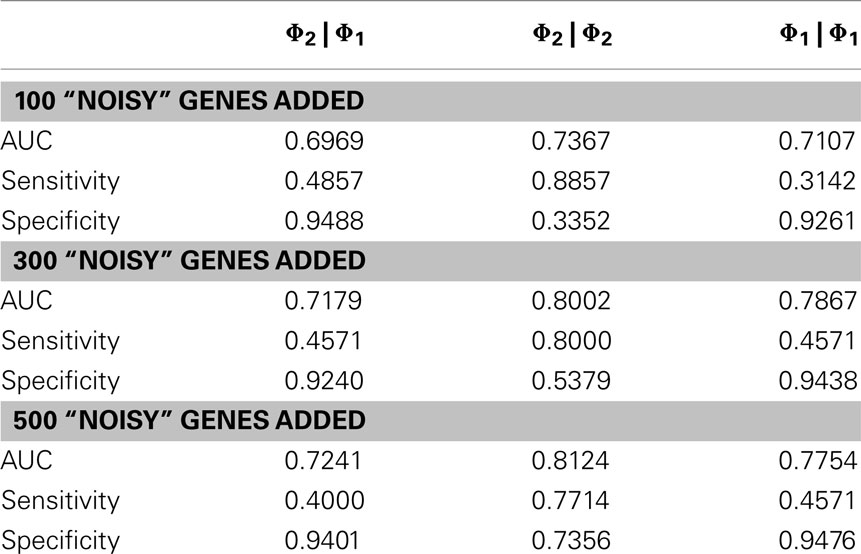
Table 2. Comparison of methods with added noise.
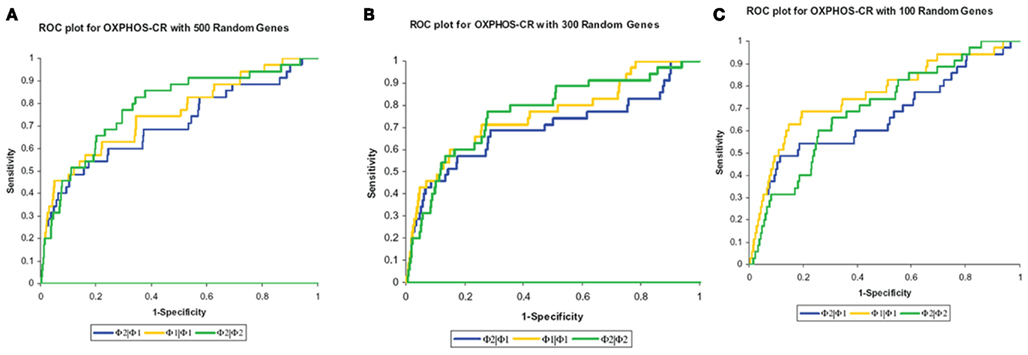
Figure 3. Maintenance of rank. The methods were compared based on their ability to maintain the rank of the “golden standard” classifications. (A) ROC plot of the rankings of the classifications from the added 500 random genes dataset. (B) ROC plot of the rankings of the classifications from the added 300 random genes dataset. (C) ROC plot of the rankings of the classifications from the added 100 random genes dataset.
In order to further evaluate the performance of the methods, we used the Girotti and Zingg (2003) study, which identified several user-defined classifications without the use of any statistical framework. In Table 3, we look at the analogous GO classifications and compare p-values from the four methods described above. Many of these classifications are significantly enriched at p ≤ 0.05 according to at least one of the methods, or are weakly significant. With regard to the biological relevance of the classifications, defense response, cell motility, extracellular matrix, and cytoskeleton maintained low p-values across all methods. This is consistent with the parturition process, as it is involves immune suppression and cell remodeling. There are, however, some surprising disagreements between the methods. For example, p-values for protein modification range over four orders-of-magnitude, going from 4.2 × 10⁻⁵ (Φ2 | Φ2) to 0.923 (Φ3 | Φ3). (See Figure A2 in Appendix for scatter plots of different pairs of p-values across all classifications.) It was surprising that p-values could differ so greatly between the methods. Table 4 shows how many classifications are identified as significantly enriched by each method individually (main diagonal) and by each pair of methods (off diagonal) using the p-value threshold of p < 0.05.
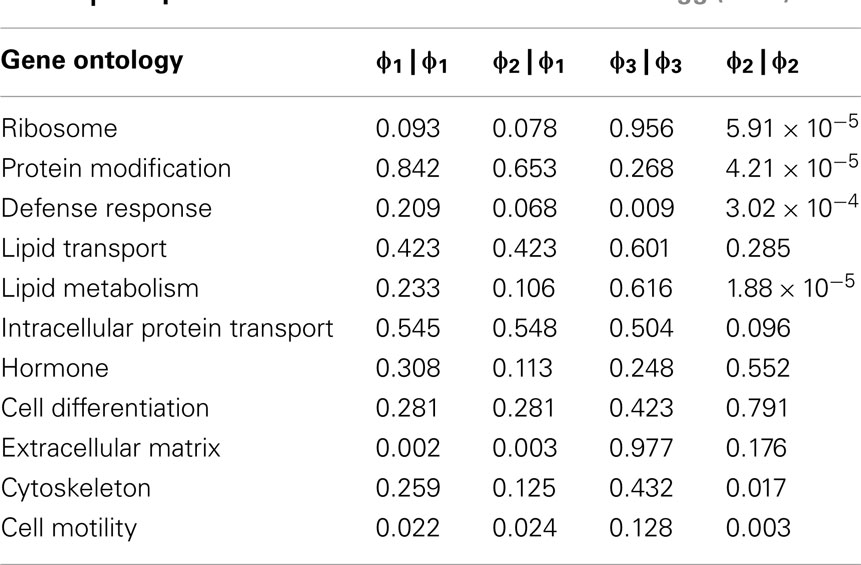
Table 3. Comparison of methods on the Girotti and Zingg (2003) data.
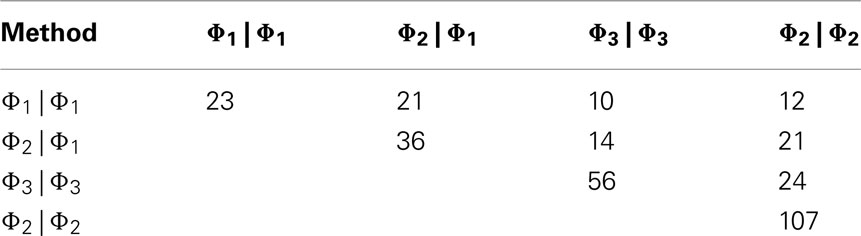
Table 4. Agreement of significance calls.
A conspicuously different value for cytoskeleton, between Φ2 | Φ2 and Φ1 | Φ1, can be observed in Table 3. While we have discussed above (see Introduction) the theoretical difference in how significance is computed under Φ2 | Φ2 and Φ1 | Φ1, it may serve as an informative exercise to look at some of the numbers that give rise to the difference in p-value for cytoskeleton under these two settings. Under the setting of Φ1, 4 significant genes are mapped to cytoskeleton out of a total possible 25. Under the setting of Φ2, 10 significant paths are mapped to cytoskeleton out of a possible 49. That is, while there are only 4 of 25 cytoskeleton genes in the interesting set, they are multifunctional – accounting for a total of 10 paths to mappings (an average 2.5 per gene), versus an average of slightly less than 2 paths to mappings for cytoskeleton genes over all. Thus, while these paths may describe different precise functions, they collectively implicate the overall cytoskeleton classification. Following up on the relevance of the cytoskeleton classification with respect to this experimental setting, it becomes clear that interesting genes mapped to it represent a biological reality worthy of distinguishing this category as significant. One of these genes is TPM1, which is an Actin binding protein and provides stability to Actin filaments. Accordingly, Actin is also present. Actin is a component of the cytoskeleton, which provides mechanical support to the cell. Actin also works with Myosin during muscle contraction in a calcium dependent interaction mechanism. Myosin is also one of the interesting genes. Myosin is a contractile protein whose function depends on the hydrolysis of ATP. Together, the presence of these genes reflects the physical demand placed on cytoskeleton with respect to the contraction and remodeling of the uterus, which occur during pregnancy (Slater et al., 2002; Wang and Hirsch, 2003; Salomonis et al., 2005).
Computing p-values for all 397 classifications by Φ2 | Φ1, Φ2 | Φ2, and Φ3 | Φ3 takes, on average, approximately 2 h. This is longer than for Φ1 | Φ1 and other statistics in the literature (Khatri and Draghici, 2005). However, it is still much more rapid than annotation by hand (Girotti took weeks to construct her annotation), and is readily justified by the time and expense that goes into collecting the data. Indeed, although microarray data analysis is typically “fast,” other modern types of analysis (e.g., analysis of high-throughput sequencing data) typically takes hours or even days, depending on their complexity. Using repeated weights (Wi,j), which allowed us to treat genes with equal scores simultaneously, is an important factor in the speed of the algorithm. For determining the value for a = Φ2(H′, r), from table T, |W| = 54, T had 5581 entries, and required 8,172,874 operations. With 4137 genes and Amax as large as 22771, the naïve dynamic program would have required a table with approximately 500 million entries (22771*22771), and would have required approximately 2 trillion updates (4137*22771*22771).
One may wonder whether exact computation of the p-values is necessary as described here. While it is intuitive that approximations will differ from exact p-values, it is not readily apparent that such approximations are inutile. For this reason, we used the hypergeometric equation to approximate Φ2 | Φ2 and found that values do indeed differ significantly. When compared, the two were found to be only weakly correlated (R2 = 0.2610). This is a concern not only for ontological analysis, but for broader, integrative analyses as well. Increasingly, the experimental design of high-throughput experimentation has grown to include probabilistic frameworks in which knowing the exact probabilities or p-values is important. An example would be Bayesian modeling (Segal et al., 2001). In large Bayesian networks, multiple classifications may be used as factors for the inference. Small errors in p-values can propagate when being used as conditioning values. Thus, exact computation of p-values is important not just for determining significance, but also for the sake of larger integrative studies.
Our dynamic programming approaches, for Φ2 | Φ2 in particular, can easily be generalized to compute p-values for other scoring functions. For example, one might define the score of a gene X with respect to a classification Y by the number of classifications reachable from Y to which X is mapped. Of course, interesting genes could also be selected based on features that have no direct connection to expression or ontology structure, such as presence of an amino-acid motif or of a common upstream motif. Our methods are also applicable to other annotation resources available to the bioinformatics community. For example, databases such as Kyoto Encyclopedia of Genes and Genomes (KEGG; Kanehisa and Goto, 2000) or Munich Information Center for Protein Sequences (MIPS; Mewes et al., 2000), have organized annotations to which statistics can be applied in a similar manner as described here.
While the methods presented here compute individual p-values exactly, one must consider the use of such statistics in context. Naïve application of these methods to a large number of candidate classifications creates a multiple hypothesis testing problem and risks the identification of related classifications. These problems can be addressed by adjusting the p-value threshold and by sampling-based methods (Zhong et al., 2004).
Conflict of Interest Statement
The authors declare that the research was conducted in the absence of any commercial or financial relationships that could be construed as a potential conflict of interest.
Acknowledgments
The authors wish to thank Marie-Eve Carrier, Dominic Devost, Karen Hellauer, and Elisa Monaco for their advice and assistance. Funding: This material is based upon work supported by grants from NSERC and CIHR. Any opinions, findings, and conclusions or recommendations expressed in this publication are those of the author(s) and do not necessarily reflect the views of the funding agencies.
References
Al-Shahrour, F., Diaz-Uriarte, R., and Dopazo, J. (2004). FatiGO: a web tool for finding significant associations of gene ontology terms with groups of genes. Bioinformatics 20, 578–580.
Berriz, G. F., King, O. D., Bryant, B., Sander, C., and Roth, F. P. (2003). Characterizing gene sets with FuncAssociate. Bioinformatics 19, 2502–2504.
Castillo-Davis, C. I., and Hartl, D. L. (2003). GeneMerge – postgenomic analysis, data mining, and hypothesis testing. Bioinformatics 19, 891–892.
Diaz-Uriarte, R., and Dopazo, J. (2003). “Use of GO terms to understand the biological significance of microarray differential gene expression data,” in Methods of Microarray Data Analysis III, Papers from Camda ’02, Chap. 15, eds K. F. Johnson, and S. M. Lin (Durham: Kluwer Inc.), 233–247.
Doniger, S. W., Salomonis, N., Dahlquist, K. D., Vranizan, K., Lawlor, S. C., and Conklin, B. R. (2003). MAPPFinder: using geneontology and GenMAPP to create a global gene-expression profile from microarray data. Genome Biol. 4, R7.
Draghici, S., Khatri, P., Bhavsar, P., Shah, A., Krawetz, S. A., and Tainsky, M. A. (2003). Onto-tools, the toolkit of the modern biologist: onto-express, onto-compare, onto-design and onto-translate. Nucleic Acids Res. 31, 3775–3781.
Girotti, M., and Zingg, H. H. (2003). Gene expression profiling of rat uterus at different stages of parturition. Endocrinology 144, 2254–2265.
Hosack, D. A., Dennis, G. Jr., Sherman, B. T., Lane, H. C., and Lempicki, R. A. (2003). Identifying biological themes within lists of genes with EASE. Genome Biol. 4, R70.
Kanehisa, M., and Goto, S. (2000). KEGG: Kyoto encyclopedia of genes and genomes. Nucleic Acids Res. 28, 27–30.
Khatri, P., and Draghici, S. (2005). Ontological analysis of gene expression data: current tools, limitations, and open problems. Bioinformatics 21, 3587–3595.
King, O. D., Foulger, R. E., Dwight, S. S., White, J. V., and Roth, F. P. (2003). Predicting gene function from patterns of annotation. Genome Res. 13, 896–904.
Man, M. Z., Wang, Z., and Wang, Y. (2000). Power sage: comparing statistical tests for sage experiments. Bioinformatics 16, 953–959.
Mewes, H. W., Frishman, D., Gruber, C., Geier, B., Haase, D., Kaps, A., Lemcke, K., Mannhaupt, G., Pfeiffer, F., Schüller, C., Stocker, S., and Weil, B. (2000). MIPS: a database for genomes and protein sequences. Nucleic Acids Res. 28, 37–40.
Salomonis, N., Cotte, N., Zambon, A. C., Pollard, K. S., Vranizan, K., Doniger, S. W., Dolganov, G., and Conklin, B. R. (2005). Identifying genetic networks underlying myometrial transition to labor. Genome Biol. 6, R12.
Segal, E., Taskar, B., Gasch, A., Friedman, N., and Koller, D. (2001). Rich probabilistic models for gene expression. Bioinformatics 17(Suppl. 1), S243–S252.
Slater, M. D., Zervou, S., and Thornton, S. (2002). Prostaglandins and prostanoid receptors in human pregnancy and parturition. J. Soc. Gynecol. Investig. 9, 118–124.
Subramanian, A., Tamayo, P., Mootha, V. K., Mukherjee, S., Elbert, B. L., Gillette, M. A., Paulovich, A., Pomeroy, S. L., Golub, T. R., Lander, E. S., and Mesirov, J. P. (2005). Gene set enrichment analysis: a knowledge-based approach for interpreting genome-wide expression profiles. Proc. Natl. Acad. Sci. U.S.A. 102, 15545–15550.
The Gene Ontology Consortium. (2000). Gene ontology: tool for the unification of biology. Nat. Genet. 25, 25–29.
Wang, H., and Hirsch, E. (2003). Bacterially-induced preterm labor and regulation of prostaglandin-metabolizing enzyme expression in mice: the role of toll-like receptor 4. Biol. Reprod. 69, 1957–1963.
Zeeberg, B. R., Feng, W., Wang, G., Wang, M. D., Fojo, A. T., Sunshine, M., Narasimhan, S., Kane, D. W., Reinhold, W. C., Lababidi, S., Bussey, K. J., Riss, J., Barrett, J. C., and Weinstein, J. N. (2003). GoMiner: a resource for biological interpretation of genomic and proteomic data. Genome Biol. 4, R28.
Zhang, B., Schmoyer, D., Kirov, S., and Snoddy, J. (2004). GOTree machine (GOTM): a web-based platform for interpreting sets of interesting genes using gene ontology hierarchies. BMC Bioinformatics 5, 16.
Zhong, S., Tian, L., Li, C., Storch, K.-F., and Wong, W. H. (2004). Comparative analysis of gene sets in the gene ontology space under the multiple hypothesis testing framework. Proc. IEEE Comput. Syst. Bioinform. Conf. 2004, 425–35.
Appendix
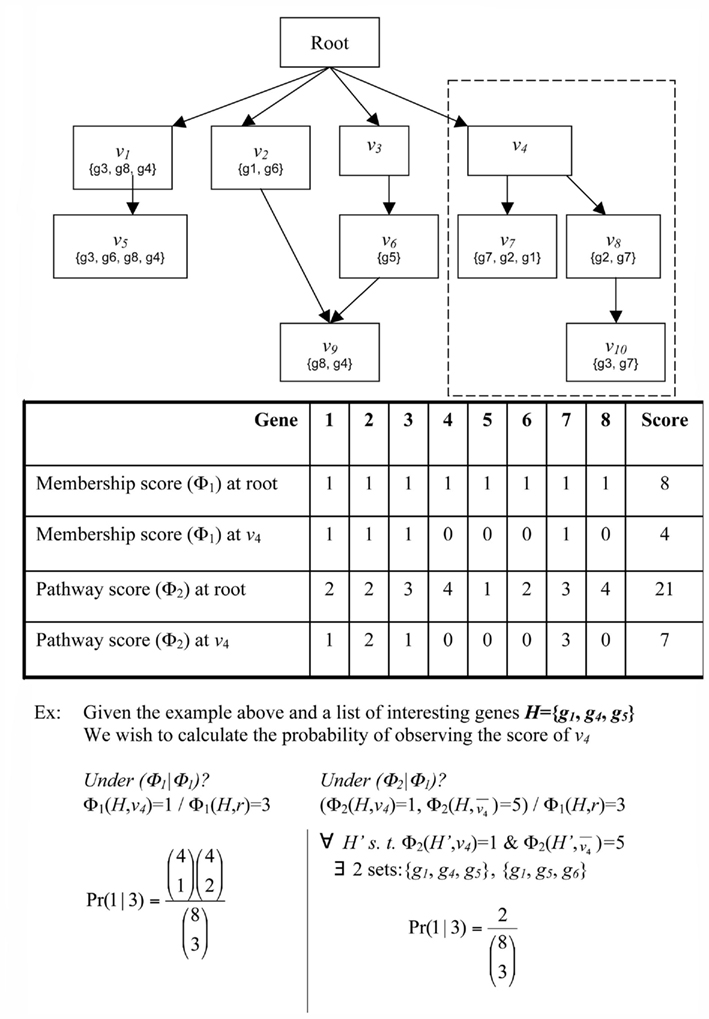
Figure A1. Explicit examples of weighted membership functions and p-value computations.
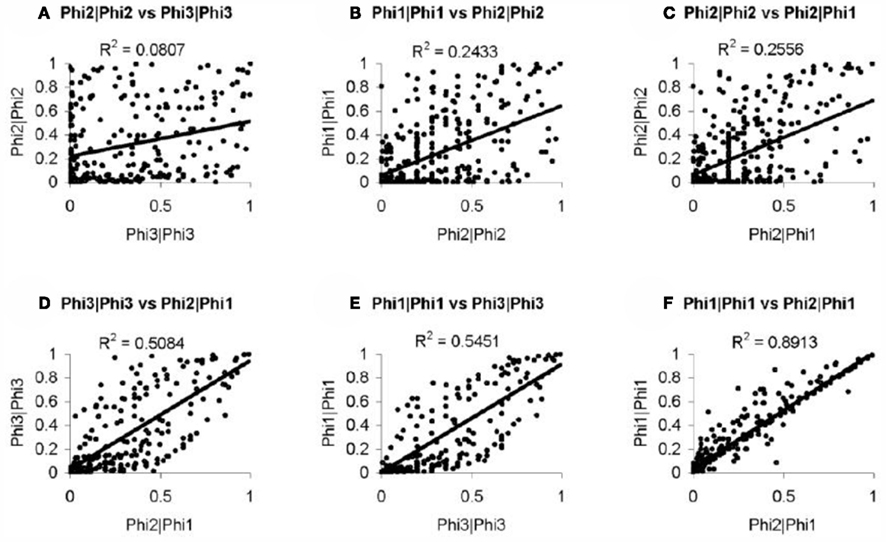
Figure A2. Method comparisons (A–F) pair-wise p-value comparisons between methods, these scatter pots show the degree of agreement between methods. R2 values are provided as a summary of the agreement.
Keywords: gene ontology, weighted membership, enrichment, depletion, dynamic programming
Citation: Iacucci E, Zingg HH and Perkins TJ (2012) Methods for determining the statistical significance of enrichment or depletion of gene ontology classifications under weighted membership. Front. Gene. 3:24. doi: 10.3389/fgene.2012.00024
Received: 04 November 2011;
Paper pending published: 19 November 2011;
Accepted: 06 February 2012;
Published online: 23 February 2012.
Edited by:
Radhakrishnan Nagarajan, University of Arkansas for Medical Sciences, USAReviewed by:
Chi Zhang, University of Nebraska Lincoln, USAPreetam Ghosh, Virginia Commonwealth University, USA
Copyright: © 2012 Iacucci, Zingg and Perkins. This is an open-access article distributed under the terms of the Creative Commons Attribution Non Commercial License, which permits non-commercial use, distribution, and reproduction in other forums, provided the original authors and source are credited.
*Correspondence: Ernesto Iacucci, IBBT-KU Leuven Future Health Department, Katholieke Universiteit Leuven, Kasteelpark Arenberg 10, Box 2446, 3001 Leuven, Belgium. e-mail: ernesto.iacucci@gmail.com