
- 1 Department of Animal Production, Complutense University of Madrid, Madrid, Spain
- 2 Department of Dairy Science, University of Wisconsin Madison, Madison, WI, USA
- 3 Section on Statistical Genetics, Biostatistics Department, University of Alabama-Birmingham, Birmingham, AL, USA
- 4 Department of Animal Sciences, University of Wisconsin Madison, Madison, WI, USA
The impact of extent of genetic relatedness on accuracy of genome-enabled predictions was assessed using a dairy cattle population and alternative cross-validation (CV) strategies were compared. The CV layouts consisted of training and testing sets obtained from either random allocation of individuals (RAN) or from a kernel-based clustering of individuals using the additive relationship matrix, to obtain two subsets that were as unrelated as possible (UNREL), as well as a layout based on stratification by generation (GEN). The UNREL layout decreased the average genetic relationships between training and testing animals but produced similar accuracies to the RAN design, which were about 15% higher than in the GEN setting. Results indicate that the CV structure can have an important effect on the accuracy of whole-genome predictions. However, the connection between average genetic relationships across training and testing sets and the estimated predictive ability is not straightforward, and may depend also on the kind of relatedness that exists between the two subsets and on the heritability of the trait. For high heritability traits, close relatives such as parents and full-sibs make the greatest contributions to accuracy, which can be compensated by half-sibs or grandsires in the case of lack of close relatives. However, for the low heritability traits the inclusion of close relatives is crucial and including more relatives of various types in the training set tends to lead to greater accuracy. In practice, CV designs should resemble the intended use of the predictive models, e.g., within or between family predictions, or within or across generation predictions, such that estimation of predictive ability is consistent with the actual application to be considered.
Introduction
Genome-enabled prediction is a very current topic in livestock production, for example for inferring breeding values of selection candidates (Meuwissen et al., 2001; Goddard and Hayes, 2007), or assessment of producing ability for optimized management practices (Avendaño et al., 2010; Weigel et al., 2010), as well as in biomedicine, where interest often focuses in prediction of yet-to-be observed phenotypes for personalized medicine purposes (de los Campos et al., 2010; Makowsky et al., 2011). The genomic breeding value or direct genomic value (DGV) is estimated as the sum of marker effects. Accuracy of DGV depends on many factors, such as the method used to estimate marker effects (Luan et al., 2009), the heritability of the trait (Calus and Veerkamp, 2007; Habier et al., 2007), the structure (Hayes et al., 2009; Habier et al., 2010), and the size of the reference population (VanRaden et al., 2009), and the reliability of the breeding values when the latter are used as response variable (Luan et al., 2009). Hence, assessment of the quality of model predictions in genomic applications is of critical importance.
Evaluation of the quality of a model for genome-based prediction is typically done using cross-validation (CV) techniques (e.g., Goddard and Hayes, 2007; Vazquez et al., 2010), under the assumption that random partitioning of the data results in independent training and testing sets. However, in animal breeding applications individuals present varying degrees of genetic relationships, and obtaining independent training and testing sets is seldom possible.
In this context, the manner in which training–testing partitions is constructed has an important effect on CV results, and the level of relatedness among individuals is a factor (Pérez-Cabal et al., 2010). Yet, the available literature in this topic is somehow contradictory. For example, Legarra et al. (2008) partitioned mice data across and within families, with the latter resulting in greater accuracy. In this study, however, familial covariances could have been inflated due to common environmental effects (such as cage) contributing additional similarity to members of full-sib families. Likewise, Habier et al. (2007), using simulated data, and Habier et al. (2010) with real data, reported that for both high and low heritability traits individuals in the testing set with greater additive genetic relationships with individuals in the training set had higher prediction accuracy than individuals with weaker relationships. Conversely, Luan et al. (2009) obtained a wide range of accuracy values that depended on the method used to separate the training and the testing sets, and suggested that relatedness was not very important. They found that a cohort design yielded greater accuracy when the effects of the markers were estimated by BLUP, whereas a random design produced better results when using a mixture model and the BayesB method (Meuwissen et al., 2001).
Therefore, the aim of this study was to assess the importance of genetic relatedness on CV accuracy of DGV using data from a dairy cattle population. In addition, alternative strategies for partitioning the data into training and testing sets were compared, including a proposed method that uses information on additive genetic relationships to generate less related subsets of individuals.
Materials and Methods
Data
A representative sample of US Holstein dairy cattle population was used, for which two traits were considered: protein yield, with heritability of about 0.30 (Interbull, 2008a), and somatic cell score (SCS), with a heritability of about 0.12 (Interbull, 2008b). Here, progeny-test derived predicted transmitting abilities (PTA) were used as response variables. Predicted transmitting ability is a model-based estimate of one-half of the breeding value of an individual, and was chosen as response variable because of the high reliability of predictions for both traits (averages of 89.6 and 81.2% for protein yield and SCS, respectively). In addition, previous analyses using a subset of 2,700 out of the 4,703 sires from the same population (not shown) produced large estimated correlations between PTA and daughter yield deviation (0.96–0.98). Given that and the results from Guo et al. (2010), who compared daughter deviation and estimated breeding value as response variables and concluded that either both can be used leading to similar results, the choice of using PTA as response variable was considered reasonable. These data were provided by the Animal Improvement Programs Laboratory at the USDA-ARS Beltsville Agricultural Research Center (Beltsville, MD, USA) and included 4,703 sires with single-nucleotide polymorphism (SNP) genotypes derived from the Illumina® BovineSNP50 BeadChip (Illumina Inc., San Diego, CA, USA). Analyses were performed using SNP genotypes for 32,518 markers after editing, as described by Weigel et al. (2009). The pedigree of these sires involved 14,809 individuals.
Alternative Cross-Validation Layouts
In order to avoid differences in accuracy due to different set sizes across layouts (Erbe et al., 2010), the sizes of training and testing sets were kept constant for each layout such that 3,305 sires were included in the training set and 1,398 sires constituted the testing set (the same as in VanRaden et al., 2009).
Four CV layouts were studied. Two designs were based on a generational partition (GEN), where the older individuals were used to train the model and the youngest were employed for validation, following a standard animal breeding selection scheme. The difference between the two layouts was in the sources of information used to estimate the PTA of training sires, as explained later. The third design was obtained by distributing individuals in the training and testing sets completely at random (RAN) regardless of relationship between individuals. The last scenario was designed to obtain two subsets that were as unrelated as possible (UNREL). While both GEN designs allowed accuracy comparisons regarding the information used to obtain the training PTA, the RAN, and UNREL designs addressed the effect of the familial information used in the training set on the accuracy of genomic predictions.
The two GEN designs were based on stratification by generation. In the first GEN approach (denoted here by GEN_0308), models were trained with 3,305 sires born before 1999, using PTA from their 2003 progeny-test evaluations as proposed by VanRaden et al. (2009). These PTA do not include information pertaining to the sires used for validation. Reliability of 2003 PTA ranged from 50 to 99% for protein yield and from 7 to 99% for SCS. The model was tested with 1,398 sires born after 1999 using PTA from the 2008 genetic evaluation as response variable.
In the second GEN design (GEN_0808), as well as in all other dairy cattle scenarios, PTA from the 2008 genetic evaluation was used for animals either in the training set or in the testing set. Individuals were partitioned in the same manner as in GEN_0308, but in this case records from testing animals contributed to the PTA of animals in the training set. This partition aimed to measure the effect of the contribution of information from progeny in the training set, which could not be avoided in the RAN and UNREL designs. The Pearson correlation between 2003 and 2008 PTA was 0.99 and 0.71 for protein and SCS, respectively. The reliability of the 2008 PTA of training sires for protein ranged from 58 to 99%. For SCS, the reliability ranged from 31 to 99%.
In the third design, sires were assigned completely at random to training and testing sets. The 2008 progeny-test PTA was used as the response variable in both training and testing sets.
The objective of the fourth design was to obtain training and testing sets that were as genetically unrelated as possible. To build two genetically “distant” sets we first performed an eigen-decomposition of the additive relationship matrix as A = ΛDΛ′, where D is a diagonal matrix formed from the n eigenvalues of A, with dimensions n × n, and the columns of Λ are the corresponding n eigenvectors of A. The decompositions were implemented using the eigen function of R version 2.9.0 (R Development Core Team, 2009). The first 55 eigenvalues explained 25% of the variance in the dairy data. Then, the data points (individuals) were clustered based on the first 55 eigenvectors using the k-means procedure (Hartigan and Wong, 1979) of R version 2.9.0 (k-means function) with two centers for both populations. Individuals were assigned to each cluster according to their closest center, with some switches were performed to ensure that the training and testing sets had the same size as the other layouts, i.e., 3,305 individuals in the training set. Table 1 shows the structure of the training set for each of the four layouts.
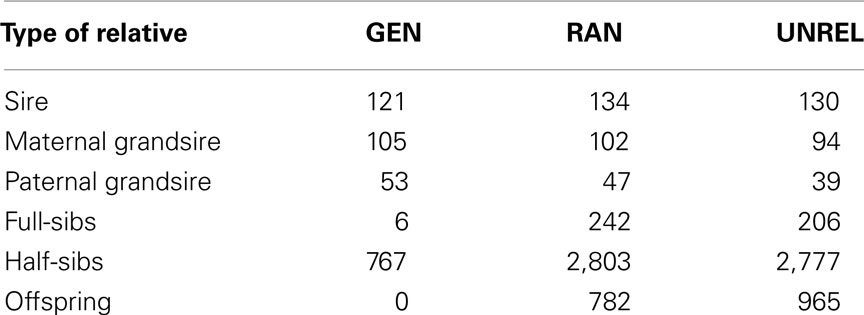
Table 1. Relatives in the training set from testing bulls in the generational (GEN), random (RAN), and the A-matrix decomposition (UNREL) designs.
Relationship Measures
To measure the relatedness between sets, the additive relationship matrix A was split into three sub-matrices, such that ATr is the sub-matrix of relationships between sires in the training set; ATs is the sub-matrix of relationships between sires in the testing set; and ATrTs is the sub-matrix of relationships between sires across training and testing sets. Similarities within and between training and testing sets for each design were measured by averaging the off-diagonal elements of ATr, ATs, and ATrTs, denoted as aTr, aTs, and aTrTs, respectively, such that lower values indicate more genetically different populations.
Many individuals are related through more than one relationship path, e.g., one individual could be the father as well as maternal grandfather of another. The number of informative relatives in the training set for every individual in the testing set was weighted with a score (Nscore). Nscore was defined as a weighted count of the number of relatives in the training set that contribute a minimum additive genetic relatedness of 0.25 or 0.5. Specifically, it was expressed as Nscore = N0.5 + 0.5N0.25–0.5, where N0.5 is the number of close relatives (additive genetic relationship greater or equal to 0.5, i.e., sires, offspring, and full-sibs), and N0.25–0.5 is the number of other relatives with additive genetic relationship between 0.25 and 0.499 (i.e., half-sibs, grandsires, and grandsons). Therefore, individuals with aTrTs less than 0.25 (distant relatives) were not considered in the Nscore calculations.
Statistical Analyses
Standardized sire PTAs for protein yield and SCS were regressed on marker covariates in the training set using the model  where μ is a location parameter common to all observations; xij is the genotype of individual i (i = 1, 2,…,n) for SNP marker j (j = 1, 2,…,p), coded as the number of copies of a specific allele (i.e., xij = 0, 1, or 2); βj is the effect of marker j; and ei is the random residual for the ith observation.
A Bayesian LASSO approach (Park and Casella, 2008) was used to estimate marker effects and was implemented via Gibbs sampling using the package BLR (de los Campos and Pérez, 2010) of R. The probability model in the Bayesian LASSO was described in Weigel et al. (2009). The following specifications were assumed for hyper-parameters of the prior distributions: df = 1 and S = 0.5 for the residual variance, and α1 = 1.4 and α2 = 1.4 for the regularization parameter λ. A chain of 70,000 samples was run in each analysis, and the first 20,000 samples were discarded as burn-in. Posterior summaries were computed using a thinning rate of 10. Convergence was checked by visual inspection of trace plots.
The accuracy of the predictions was defined as Pearson’s correlation between DGV and the realized PTA for individuals in the testing sets.
Results
In this paper we aimed to evaluate the effect of relationships on CV accuracy of genome-enabled predictions by alternative strategies for partitioning the data into training and testing sets. First, we computed the genetic relationships between training and testing individuals. Then we measured the accuracy of prediction as the correlation between genomic predictions and the realized PTA for individuals in the testing sets for each of the different designs.
Genetic Relationships
Figure 1 shows the boxplot of the average (left) and maximum (right) additive genetic relationships between subjects in training and testing sets for the designs achieved for the three methods of partition (GEN, RAN, and UNREL). The UNREL design led to more distant training–testing sets.
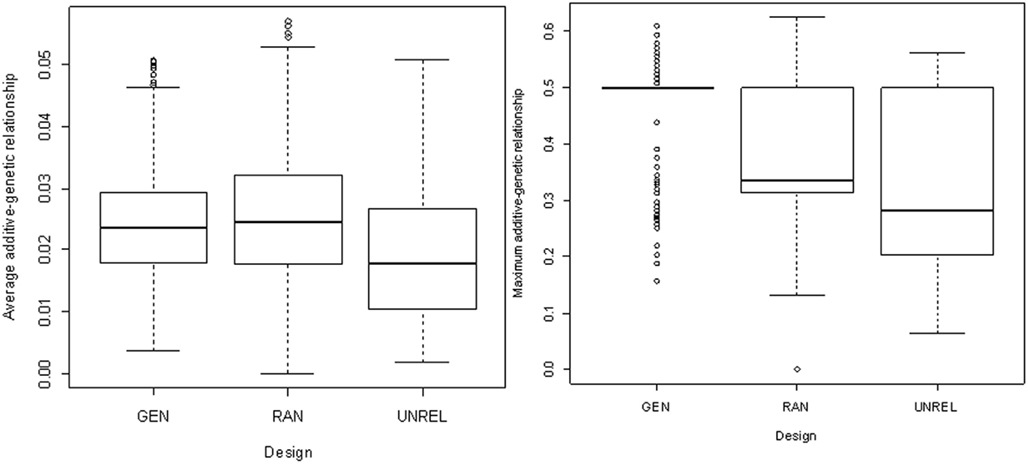
Figure 1. Box plots of average and maximum additive genetic relationships between a testing individual and all individuals in the training set for the generational (GEN), random (RAN), and the A-matrix decomposition (UNREL) designs.
The total number of individuals in the training set by degree of relatedness with testing individuals is shown in Table 2. Sires from the GEN design had two and five times more individuals with a high degree of relatedness (aTrTs ≥ 0.5) in the training set than those from the RAN and the UNREL designs, respectively. However, RAN had almost three times more sibs or grandsires than GEN, which led to a larger Nscore. The smallest Nscore was obtained with the UNREL design.
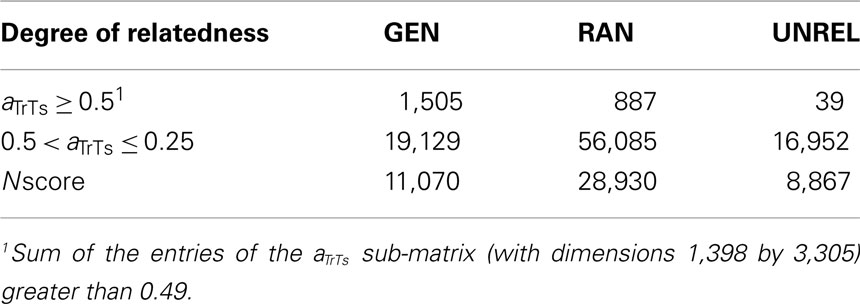
Table 2. Total number of relatives of individuals in the testing set contributing to the training set by degree of relatedness (aTrTs), and the weighted number of relatives (Nscore) in the generational (GEN), random (RAN), and the A-matrix decomposition (UNREL) designs for dairy cattle data.
Accuracy of Predictions
The CV designs are compared in terms of their estimated model prediction ability. The accuracy of predictions for protein yield and SCS was the same for GEN_0308 and GEN_0808 (results not shown). GEN_0308 was designed by VanRaden et al. (2009). The models are trained with 2003 PTA, where information from the progeny is not yet included; these models are tested in the sires born after 1999 using their 2008 PTA. All other designs use 2008 PTAs (since the partition is not generational). Differences could be attributable to either the partition design or to having more accurate PTA in 2008 compared with 2003. The average accuracy of 2003 progeny-test PTA for the training sires was 87%, and it increased to 90% for 2008 progeny-test PTA. Therefore, GEN_0808 serves as a benchmark to evaluate the importance of the former comparison. A summary of the prediction accuracies for protein yield and SCS is shown in Table 3.
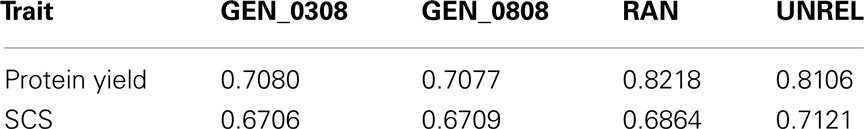
Table 3. Accuracy measured as the correlation between direct genomic values and realized PTA in the testing set for protein yield and somatic cell score (SCS) for different training–testing designs: generational (GEN), random (RAN), and the A-matrix decomposition (UNREL).
The impact on accuracy of the number and type of relatives, with genetic relationship greater or equal than 0.25, is shown in Figure 2, for both protein yield and SCS. For individuals with no relatives (0 + 0) the information from far relatives (genetic relationship less than 0.25) is contributing to the prediction. If only one close relative is present in the training set (1 + 0) the accuracy is higher than having only other relatives (0 + 1). The accuracy tends to increase with the number of close relatives. Figure 3 illustrates the contribution of relatives to accuracy for three testing sires common to all layouts. The summary of the relatives in training set for each of these individuals is shown in Table 4.
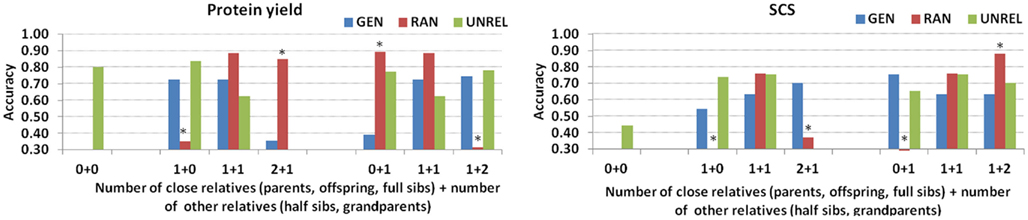
Figure 2. Accuracy of predictions for protein yield and somatic cell score (SCS) depending on the number and type of relatives in the training set for the generational (GEN), random (RAN), and the A-matrix decomposition (UNREL) designs (* indicates correlation obtained from less than 10 individuals).
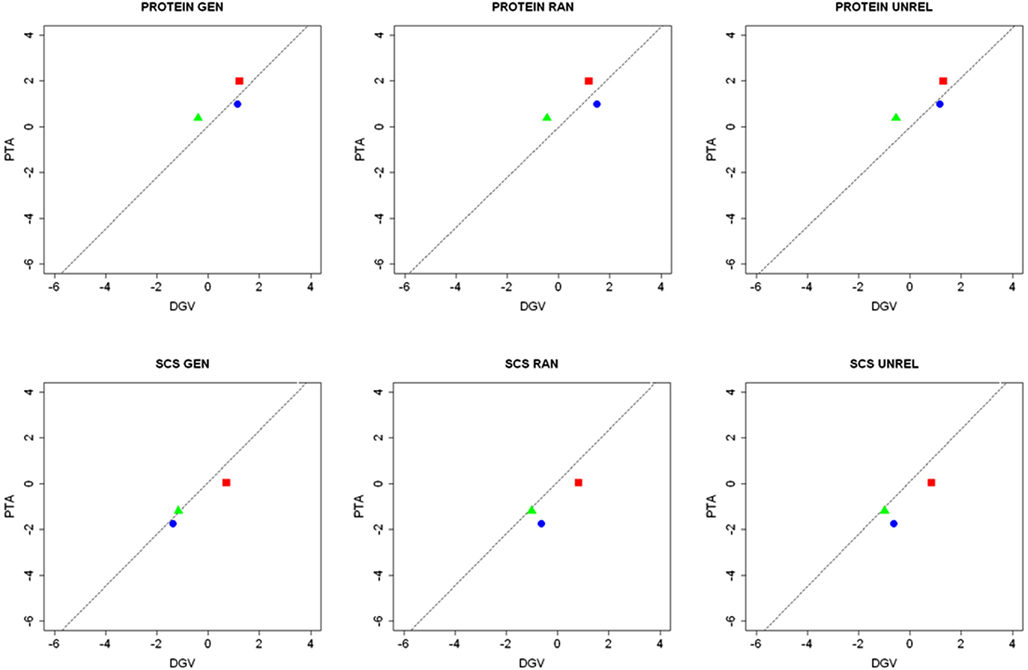
Figure 3. Scatter plots of direct genomic value and PTA, as well as the regression line (dashed line), for three testing sires common in all the layouts, which differed in the number of relatives included in the training set (Red square: no close relatives; Green triangle: one close relative; Blue circle: two close relatives).
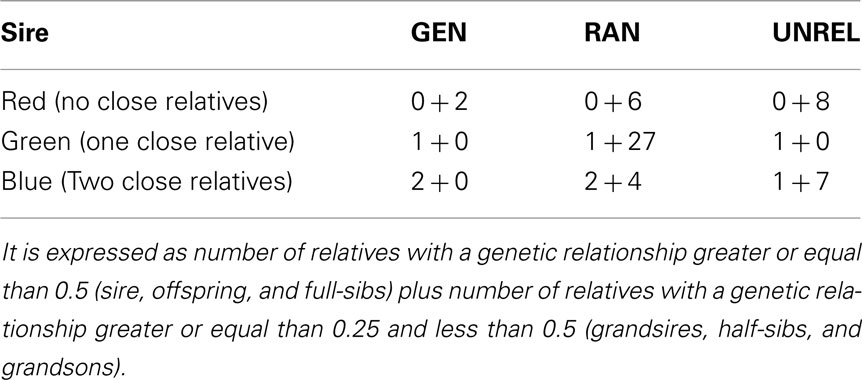
Table 4. Summary of relatives in the training set for three testing sires common to all layouts (GEN, generational; RAN, random; UNREL, A-matrix decomposition).
Table 5 shows the accuracy of predictions for protein yield and SCS, as a function of presence or absence of offspring in the training set. Regardless of the design, there was an increase in accuracy for sires with offspring among the relatives present in the training set. Also, accuracy was greater for protein yield than for SCS.
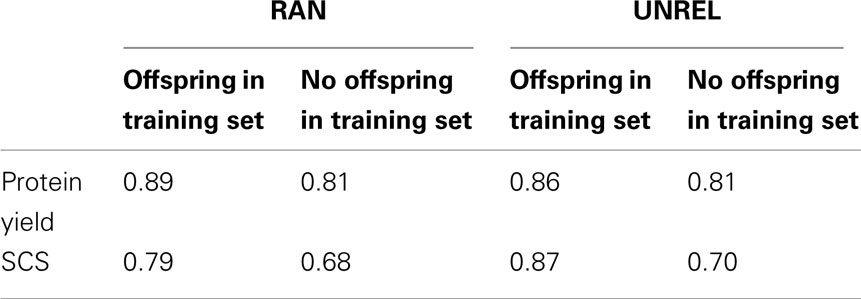
Table 5. Accuracy measured as the correlation between direct genomic values and realized PTA in the testing set for protein yield and somatic cell score (SCS) in sires with and without offspring in the training set, as estimated from the random (RAN) and the A-matrix decomposition (UNREL) designs.
Discussion
The methods used for partitioning the data into training and testing sets were compared in terms of additive genetic relationships between individuals within and between subsets. The UNREL design led to more distant training–testing sets. The distributions of average and maximum relationships between the training and testing sets are represented in Figure 1. The GEN and RAN designs had almost the same median relationship, but the dispersion was larger in the RAN design (Figure 1, left panel). However, the maximum additive relationship better indicated the difference between the family structures in these two designs (Figure 1, right panel). Habier et al. (2010) used the maximum additive genetic relationship between bulls in training and testing sets to obtain different designs. They found that the average additive genetic relationship was less helpful than the maximum additive genetic relationships to describe the family structure. In fact, the similarity in average relationship for GEN and RAN (0.024 and 0.025, respectively, see Figure 1, left panel) is probably due to the total number of relatives in the 2° of relatedness considered. In the RAN design there were less close relatives than in the GEN design but there are almost four times more relatives less related, which balance the average additive genetic relationship (Table 2). On the contrary, although the UNREL design had similar number of relatives than in the GEN design between 0.25 and 0.5, there were only 39 close relatives in the training set.
As previously stated, PTA was the dependent variable used in this study instead of daughter deviation or deregressed proofs because preliminary analyses produced large estimated correlations between both variables, and therefore, similar results could be expected, as Guo et al. (2010) reported. However, the use of either daughter deviation or deregressed PTA would have been a more appropriate and less controversial choice (VanRaden et al., 2009; Mäntysaari et al., 2010; Olson et al., 2011). Most sires in the training set had a highly accurate PTA in 2003. Then, the PTA accuracy for 2008 (used for GEN_0808, RAN, and UNREL) did not improve their PTA markedly. Accuracy was greater for protein yield than for SCS, in agreement with previous studies (Calus and Veerkamp, 2007). The RAN and UNREL designs produced very similar accuracies (Table 3), which were about 15 and 4% higher than in the GEN design for protein yield and SCS, respectively. As previously indicated by Habier et al. (2007), increasing the degree of genetic relatedness among individuals in the training and testing sets by including offspring leads to higher accuracy of genomic predictions. The Nscore obtained for the RAN and UNREL designs (Table 2) is consistent with results of Makowsky et al. (2011), who found a clear and positive relationship between predictive ability and the number of relatives in the training set, measured by a score index which weighted the level of relatedness to the testing individual. The UNREL design was expected to generate less genetically related training and testing sets and, consequently, lower accuracy values. Although the UNREL design decreased the average genetic relationships between training and testing animals (Figure 1, left panel), this difference did not translate into lower accuracy compared to the GEN design. However, when comparing to the RAN design, the accuracy decreased, which is due to the offspring, as Table 5 shows. Such results indicate that the connection between average genetic relationships across training and testing sets and the estimated prediction ability is not straightforward, and may depend on the types of relationships that exist between the two subsets. Our results indicate that co-lateral relatives can improve the prediction of the breeding value of an individual. Co-lateral relatives contribute information about the breeding value of the individual’s parents, whereas information on its progeny contributes directly to the knowledge of the individual’s Mendelian segregation term.
If avoiding parent–offspring relationships (or any other strong genetic ties) between training and testing sets is sought in a CV strategy, other sources of genetic relationships may be inevitably favored such that the consequences on accuracy of genome-enabled predictions become uncertain. Obtaining accuracy of individual animal predictions is only possible with simulated data, in which case true breeding values are unknown. Alternatively, under some assumptions and with specific modeling approaches (e.g., GBLUP), accuracies can be obtained directly from the mixed model equations (Strandén and Garrick, 2009). In this paper we are focused on CV, and in this case we compare methods based on overall (average) accuracies. Individual accuracies would be extremely interesting, but how to obtain them from CV with real data is a topic that is still in the works in many groups developing research in genomic selection, but it is beyond the objective of this manuscript. Several analyses were performed to evaluate accuracy depending on the different genetic relationship measures (number of close relatives, and number of other relatives). This did not produce any obvious pattern and a somewhat counterintuitive trend was sometimes observed (Figure 2). For instance, the contribution of one close relative to increase accuracy of protein yield DGV is higher than the contribution from other relatives, regardless the number. Moreover, those individuals with no close relatives at all can achieve high accuracy from the contribution of several half-sibs or grandsires (Figure 3). However, for SCS, even only one-half-sib has a large impact on accuracy, although the presence of at least one sire, full-sib or offspring can lead to accuracies never reached with only other relatives.
Conclusion
This study evaluated the accuracy of genome-enabled predictions for two important traits in dairy cattle using four different CVs layouts. Different partitions of the data into training and testing sets resulted in somewhat different predictive abilities and, in most cases, higher accuracy levels were observed for higher genetic relationships between training and testing sets. This study also offered a methodology to produce training and testing sets that reduces the relationships between the sets, which served as a control layout.
Information regarding genetic relationships between individuals in the training and testing sets should be taken into account when planning a CV study, as well as when interpreting the results. The use of progeny in the training set consistently increased the predictive correlation by 0.10–0.15. However, in practice, validation studies should be designed to mimic the manner in which genomic predictions will be used for selection decisions in the field. Then close relatives as full-sibs can largely contribute to achieve high accuracy instead. For high heritability traits, close relatives such as parents and full-sibs make the greatest contributions to accuracy, which can be compensated by half-sibs or grandsires in the case of lack of close relatives. However, for the low heritability traits the inclusion of close relatives is crucial and including more relatives of various types in the training set tends to lead to greater accuracy.
Conflict of Interest Statement
The authors declare that the research was conducted in the absence of any commercial or financial relationships that could be construed as a potential conflict of interest.
Acknowledgments
M. Angeles Pérez-Cabal would like to acknowledge financial support by the MITC (PDT 2008-0278) program. K. A. Weigel acknowledges financial support from the National Association of Animal Breeders (Columbia, MO, USA), as well as support from National Research Initiative competitive grant no. 2009-35205-05099 from the USDA National Institute for Food and Agriculture Animal Genome Program (Washington, DC, USA).
References
Avendaño, S., Watson, K. A., and Kranis, A. (2010). “Genomics in poultry breeding – from utopias to deliverables,” in Proceedings of 9th WCGALP, Leipzig.
Calus, M. P. L., and Veerkamp, R. F. (2007). Accuracy of breeding values when using and ignoring the polygenic effect in genomic breeding value estimation with a marker density of one SNP per cM. J. Anim. Breed. Genet. 124, 362–368.
de los Campos, G., Gianola, D., and Allison, D. B. (2010). Predicting genetic predisposition in humans: the promise of whole-genome markers. Nat. Rev. Genet. 11, 880–886.
de los Campos, G., and Pérez, P. (2010). BLR: Bayesian Linear Regression. R package version 1.2. Available at: http://www.r-project.org/
Erbe, M., Pimentel, E. C. G., Sharifi, A. R., and Simianer, H. (2010). “Assessment of cross-validation strategies for genomic prediction in cattle,” in Proceedings of 9th WCGALP, Leipzig.
Guo, G., Lund, M. S., Zhang, Y., and Su, G. (2010). Comparison between genomic predictions using daughter yield deviation and conventional estimated breeding value as response variables. J. Anim. Breed. Genet. 127, 423–432.
Habier, D., Fernando, R. L., and Dekkers, J. C. M. (2007). The impact of genetic relationship information on genome-assisted breeding values. Genetics 177, 2389–2397.
Habier, D., Tetens, J., Seefried, F. R., Lichtner, P., and Thaller, G. (2010). The impact of genetic relationship information on genomic breeding values in German dairy cattle cattle. Genet. Sel. Evol. 42, 5.
Hayes, B. J., Visscher, P. M., and Goddard, M. E. (2009). Increased accuracy of artificial selection by using the realized relationship matrix. Genet. Res. 91, 47–60.
Interbull. (2008a). Interbull Routine Genetic Evaluation for Dairy Production Traits. Available at: http://www-interbull.slu.se/eval/framesida-prod.htm (accessed September 14, 2010).
Interbull. (2008b). Interbull Routine Genetic Evaluation for Udder Health Traits. Available at: http://www-interbull.slu.se/udder/framesida-udder.htm (accessed September 14, 2010).
Legarra, A., Robert-Granié, C., Manfredi, E., and Elsen, J. M. (2008). Performance of genomic selection in mice. Genetics 180, 611–618.
Luan, T., Woolliams, J. A., Lien, S., Kent, M., Svendsen, M., and Meuwissen, T. H. E. (2009). The accuracy of genomic selection in Norwegian Red cattle assessed by cross-validation. Genetics 183, 1119–1126.
Makowsky, R., Pajewski, N. M., Klimentidis, Y. C., Vazquez, A. I., Duarte, C. W., Allison, D. B., and de los Campos, G. (2011). Beyond missing heritability: prediction of complex traits. PLoS Genet. 7, e1002051.
Mäntysaari, E., Liu, Z., and VanRaden, P. (2010). Interbull validation test for genomic evaluations. Interbull Bull. 41, 17–22.
Meuwissen, T. H. E., Hayes, B. J., and Goddard, M. E. (2001). Prediction of total genetic value using genome-wide dense marker maps. Genetics 157, 1819–1829.
Olson, K. M., VanRaden, P. M., Tooker, M. E., and Cooper, T. A. (2011). Differences among methods to validate genomic evaluations for dairy cattle. J. Dairy Sci. 94, 2613–2620.
Pérez-Cabal, M. A., Vazquez, A. I., Gianola, D., Rosa, G. J. M., and Weigel, K. A. (2010). “Accuracy of genomic predictions in USA Holstein cattle from different training-testing designs,” in Book of Abstracts of 9th WCGALP, Leipzig, 150.
R Development Core Team. (2009). R Foundation for Statistical Computing. Vienna. Available at: http://www.R-project.org
Strandén, I., and Garrick, D. J. (2009). Technical note: derivation of equivalent computing algorithms for genomic predictions and reliabilities of animal merit. J. Dairy Sci. 92, 2971–2975.
VanRaden, P. M., Van Tassell, C. P., Wiggans, G. R., sonstegard, T. S., Schnabel, R. D., Taylor, J. F., and Schenkel, F. S. (2009). Reliability of genomic predictions for North American dairy bulls. J. Dairy Sci. 92, 16–24.
Vazquez, A. I., Rosa, G. J. M., Weigel, K. A., de los Campos, G., Gianola, D., and Allison, D. B. (2010). Predictive ability of subsets of SNP with and of parent average for several traits in US Holstein. J. Dairy Sci. 93, 5942–5949.
Weigel, K. A., de los Campos, G., González-Recio, O., Naya, H., Wu, X. L., Long, N., Rosa, G. J. M., and Gianola, D. (2009). Predictive ability of genomic breeding values estimated from selected subsets of single nucleotide polymorphism markers for lifetime net merit in Holtein cattle. J. Dairy Sci. 92, 5248–5257.
Keywords: accuracy, genetic relationships, training–testing designs
Citation: Pérez-Cabal MA, Vazquez AI, Gianola D, Rosa GJM and Weigel KA (2012) Accuracy of genome-enabled prediction in a dairy cattle population using different cross-validation layouts. Front. Gene. 3:27. doi: 10.3389/fgene.2012.00027
Received: 08 November 2011; Accepted: 13 February 2012;
Published online: 28 February 2012.
Edited by:
Henner Simianer, Georg-August University Goettingen, GermanyReviewed by:
Joanna Szyda, Wroclaw University of Life Sciences, PolandChristian Karl Ludwig Edel, Bavarian State Research Center for Agriculture, Germany
Copyright: © 2012 Pérez-Cabal, Vazquez, Gianola, Rosa and Weigel. This is an open-access article distributed under the terms of the Creative Commons Attribution Non Commercial License, which permits non-commercial use, distribution, and reproduction in other forums, provided the original authors and source are credited.
*Correspondence: M. Angeles Pérez-Cabal, Department of Animal Production, Complutense University of Madrid, Avda. Puerta de Hierro, s/n 28040, Madrid, Spain. e-mail: mapcabal@vet.ucm.es