
- 1 Department of Biochemistry and Microbiology, University of Victoria, Victoria, BC, Canada
- 2 School of Biological Sciences, Louisiana Tech University, Ruston, LA, USA
- 3 Department of Obstetrics and Gynecology, Medical University of South Carolina, Hollings Marine Laboratory, Charleston, SC, USA
Nitrate and nitrite are common aqueous pollutants that are known to disrupt the thyroid axis. In amphibians, thyroid hormone (TH)-dependent metamorphosis is affected, although whether the effect is acceleration or deceleration of this developmental process varies from study to study. One mechanism of action of these nitrogenous compounds is through alteration of TH synthesis. However, direct target tissue effects on TH signaling are hypothesized. The present study uses the recently developed cultured tail fin biopsy (C-fin) assay to study possible direct tissue effects of nitrate and nitrite. Tail biopsies obtained from premetamorphic Rana catesbeiana tadpoles were exposed to 5 and 50 mg/L nitrate (NO3–N) and 0.5 and 5 mg/L nitrite (NO2–N) in the absence and presence of 10 nM T3. Thyroid hormone receptor β (TRβ) and Rana larval keratin type I (RLKI), both of which are TH-responsive gene transcripts, were measured using quantitative real time polymerase chain reaction. To assess cellular stress which could affect TH signaling and metamorphosis, heat shock protein 30, and catalase (CAT) transcript levels were also measured. We found that nitrate and nitrite did not significantly change the level of any of the four transcripts tested. However, nitrate exposure significantly increased the heteroscedasticity in response of TRβ and RLKI transcripts to T3. Alteration in population variation in such a way could contribute to the previously observed alterations of metamorphosis in frog tadpoles, but may not represent a major mechanism of action.
Introduction
Currently over 100,000 manufactured chemicals are produced in the marketplace (European Union Commission, 2006). Many of these chemicals have endocrine disrupting abilities and more specifically, are disruptors of the thyroid axis. Most endocrine disruptors can be classified as plasticizers, pesticides, industrial chemicals, heavy metals, or plant and fungal compounds; however, ions such as nitrate  and nitrite
  have endocrine disrupting abilities as well (Crain, 2000; Sampat, 2000; Gray et al., 2001). Environmental nitrate can come from many sources including agricultural fertilizer, waste from animal production, and burning fossil fuels, industrial effluent, and wastewater treatment plant discharges (Rouse et al., 1999; Camargo et al., 2004; De Groef et al., 2006).
In the US, the current public health maximal level for safe drinking water is 10 mg/L nitrate (measured as NO3–N) and 1 mg/L nitrite (NO2–N; US EPA, 2006, 2009). In Canada, the Canadian Council of Ministers of the Environment (CCME) guideline for the protection of aquatic life has set the maximum level of nitrate at 13 mg/L in freshwater and 16 mg/L
  in marine water; the level for nitrite in freshwater is 60 μg/L
  and there is no level set for marine water (CCME, 2007). Health Canada has set the maximal allowable concentration in drinking water at 10 mg/L nitrate (NO3–N) and 3.2 mg/L nitrite (NO2–N; Health Canada, 2008). Nitrate concentrations have been found as high as 25 mg/L NO3–N in surface waters and 100 mg/L NO3–N in ground water, yet there is currently no guideline for the protection of wildlife (Rouse et al., 1999; Camargo et al., 2004).
In aquatic environments, nitrogen exists in four forms in descending order of toxicity: ammonium ion, ammonia, nitrite, and nitrate. Although nitrate is the least toxic form of the four, it is the most stable and therefore the most abundant. Under aerobic conditions, ammonia and ammonium can be oxidized to nitrite by Nitrosomonas bacteria, and then to nitrate by Nitrobacter and Nitrospira bacteria (Sharma and Ahlert, 1977). When oxygen is low, denitrifying bacteria can use nitrate as a terminal electron acceptor and make nitrogen gas (N2; reviewed in Camargo et al., 2005).
Aquatic animals are exposed to nitrate and nitrite through ingestion or epithelial absorption across skin or gills (Onken et al., 2003). High levels of these contaminants cause methemoglobinemia, also called “brown blood” disease in fish and amphibians and “blue baby” syndrome in humans. Methemoglobin is formed from nitrate/nitrite-induced oxidation of hemoglobin, which prevents normal oxygen binding and leads to hypoxia (Porter et al., 1999). Toxicity of nitrite and nitrate depends on body size and developmental stage, increases with increasing concentration and exposure time, and decreases with water salinity and environmental adaptation (Rouse et al., 1999; Camargo et al., 2004).
In addition to the toxic effects of nitrate and nitrite, exposure to these chemicals adversely affects the thyroid axis in multiple vertebrate species (reviewed in Edwards et al., 2006). For example, high doses of nitrate caused goiter and depressed serum thyroxine (T4) and 3,5,3′-triiodothyronine (T3) in rats and sheep (Zaki et al., 2004) and nitrite decreased serum T4 while T3 levels were unchanged in the sea bream (Deane et al., 2007). Toad and frog tadpoles exposed to nitrate exhibit altered metamorphic development; a TH-dependent process (Wyngaarden et al., 1952, 1953; Xu and Oldham, 1997; Edwards et al., 2006; Ortiz-Santaliestra and Sparling, 2007). Although these observations can be explained, in part, by competition of nitrate and nitrite with iodine uptake, transport, and retention in the thyroid gland that impairs TH synthesis (Crow et al., 2001; Hampel and Zollner, 2004), the contribution of nitrate and nitrite to alteration of TH signaling pathways at the cellular level in amphibian target tissues is not known.
The present study uses the recently developed “C-fin” assay to expose Rana catesbeiana premetamorphic tadpole tail fin biopsies to nitrate and nitrite with or without T3 to determine if nitrate and nitrite affect TH-signaling within a TH-responsive tissue directly. We assessed TH-signaling by quantifying the levels of TH-responsive gene transcripts, thyroid hormone receptor β (TRβ) and Rana larval type I keratin (RLKI), as well as cellular stress markers, heat shock protein (HSP30), and catalase (CAT). Alteration of the transcriptome is an essential component in TH-mediated tadpole metamorphosis (Shi, 2000) and part of the change in the tail transcriptome includes an increase in TRβ transcripts and a decrease in RLKI transcripts (Domanski and Helbing, 2007). There is considerable precedent linking TRβ transcript levels to progression through TH-dependent metamorphosis where perturbations from expected levels are indicative of altered postembryonic development (Crump et al., 2002; Opitz et al., 2006; Veldhoen et al., 2006a; Zhang et al., 2006; Helbing et al., 2007a,b; Ji et al., 2007; Skirrow et al., 2008).
Materials and Methods
Experimental Animals
Premetamorphic R. catesbeiana tadpoles were caught locally (Victoria, BC, Canada) or purchased from Ward’s Natural Science Ltd. (St. Catherines, ON, Canada). Taylor and Kollros (TK; Taylor and Kollros, 1946) stage VI–VIII animals were used. Animals were housed in the University of Victoria aquatics facility and maintained in 100 gallon fiberglass tanks containing recirculating water at 12°C with exposure to natural daylight. Tadpoles were fed daily with spirulina (Aquatic ELO-Systems, Inc., FL, USA). Animals used in this study were treated and maintained in accordance with the guidelines of the Canadian Council on Animal Care.
Organ Culture of Tail Fin Biopsies
Preparation of the tail fin biopsy cultures was adapted from conditions described previously (Veldhoen et al., 2006b; Ji et al., 2007). Premetamorphic (TK stage VI–VIII; Taylor and Kollros, 1946) R. catesbeiana tadpoles were euthanized in 0.1% tricaine methanesulfonate (Syndel Laboratories, Vancouver, BC, Canada) in 25 mM sodium bicarbonate, and subsequently washed four times in 125 mL per tadpole of sterile magnesium-free (MFM) solution (7.5 mM Tris–HCl pH 7.6, 88 mM NaCl, 1 mM KCl, 2.4 mM NaHCO3, 0.88 mM CaCl2). Eight biopsies were obtained per animal (n = 7–16 animals), from the dorsal and ventral tail fins using a 6 mm dermal biopsy punch (Miltex, Inc., York, PA, USA), to allow the assessment of eight treatments per animal. Sixteen animals were used for each exposure.
Test chemicals were prepared in water as 1,000× concentrates and stored at −20°C. They were applied in equal volumes at 1 μL chemical stock/mL of media. Treatments included: a vehicle control (NaOH), sodium gluconate control (Na-G, used as a control for sodium; CAS S-2054, Sigma-Aldrich), sodium nitrate (NaNO3; CAS BP360-500g, Fisher; measured as 5 and 50 mg/L NO3–N), or sodium nitrite (NaNO2; CAS S2252-500g, >99.5% purity, Sigma-Aldrich; measured as 0.5 and 5 mg/L NO2–N), in the absence and presence of 10 nM T3 (prepared as a 10−5 M stock in 400 μM NaOH), as well as a 10 nM T3 treatment alone. Where treatments did not include T3, an equal volume of NaOH vehicle was applied to a final concentration of 400 nM. This concentration did not affect the medium pH. Biopsies were cultured individually in 1 mL 70% strength Leibovitz’s L15 medium (Gibco, Invitrogen) supplemented with 10 mM HEPES pH 7.5, 50 units/mL penicillin G sodium, 50 μg/mL streptomycin sulfate (Gibco, Invitrogen), and 50 μg/mL neomycin (Sigma-Aldrich), using 24-well culture plates (Primaria, BD Biosciences) at 25°C in air for 48 h.
The biopsies were pretreated with 0.5 mL of the appropriate concentration of the test chemical or NaOH control in culture media for 2 h prior to the addition of T3. After the 2 h incubation, 0.5 mL of the appropriate concentration of the test chemical plus 20 nM T3 (in 800 μM NaOH) were added into the wells giving a final concentration of 10 nM T3 (in 400 nM NaOH). For the wells not containing T3, 0.5 mL of the appropriate concentration of the test chemical plus 800 μM NaOH (for a final concentration of 400 nM NaOH) were added. At the end of the 48 h incubation period for each treatment, the biopsy was stored in 100 μL of RNAlater (Ambion Inc., Austin, TX, USA) for 24 h at 4°C and then transferred to −20°C until it was processed for RNA.
Isolation of RNA and Quantification of Gene Expression
RNA was isolated using TRIzol reagent as described previously (Hinther et al., 2010a,b). cDNA was synthesized from 5 μL (∼0.5 μg) total RNA as per manufacturer’s protocol using the RevertAid H Minus First Strand cDNA Synthesis Kit (Fermentas) as described in (Hinther et al., 2010b). The cDNA products were diluted fivefold prior to PCR amplification and stored at −20°C.
The levels of mRNAs encoding TRβ, RLKI, HSP30, CAT, and ribosomal protein L8 (rpL8) were determined using a MX3005P real time quantitative PCR system (Stratagene, La Jolla, CA, USA) using gene-specific primers as described previously (Hinther et al., 2010b). Expression profiles of the rpL8 transcript normalizer were invariant (p = 0.998 and 0.950, nitrate and nitrite data sets, respectively). The amplified DNA signals for all QPCR reactions were evaluated for specificity based upon their thermodenaturation profiles. Data that failed to produce a profile indicative of gene target-specific detection were removed before analysis. If a control condition did not pass the quality measure above for a given animal, then the data for all conditions associated with that animal were removed for that gene transcript due to the repeated measures nature of the data set.
Statistical Analyses
Statistical analyses were performed using PASW 18.0 (Chicago, IL, USA) software. The C-fin data were not normally distributed based upon the Shapiro–Wilk test. We used the Friedman and paired Wilcoxon tests since these data were generated from a repeated measures type of experimental design. Homogeneity of variance was determined using the Levene’s test. Correlation coefficients were generated using Spearman’s rho.
The data were analyzed in two ways: First, the test chemical results in the absence of T3 were examined relative to the vehicle control. Second, the test chemicals in combination with T3 results were compared relative to T3 alone. In the latter case, the response to a test chemical in the presence of T3 was expressed as a fold change relative to the response to T3 alone for each individual. This approach reduces the effect of inter-animal variation, enabling us to better identify chemical-induced perturbations relative to each individual’s ability to respond to T3. Therefore the T3 values in this comparison were given a value of one and the graphs show the fold change relative to the T3-induced response. Statistical significance was identified when p < 0.05.
Results and Discussion
In order to validate the assay, we first examined the biopsy responses to T3 treatment alone. Figure 1A shows the biological variation of the controls and the relative variation in T3 response before taking repeated measures into account. Figure 1B shows the data after normalizing the data to the individual animal’s baseline transcript levels into such that every control animal was assigned a value of 1. T3 treatment alone increased the TRβ transcript levels by a median 7.7-fold (p = 0.0001, Wilcoxon, n = 23; Figure 1), decreased RLKI transcript levels by 2.9-fold (p = 0.0001, Wilcoxon, n = 26; Figure 1), increased HSP30 transcript levels by 1.7-fold (p = 0.024, Wilcoxon, n = 31; Figure 1), and reduced CAT transcript levels by a median 1.3-fold (p = 0.024, Wilcoxon, n = 32; Figure 1). All transcript responses were similar to previous observations (Hinther et al., 2010a,b, 2011).
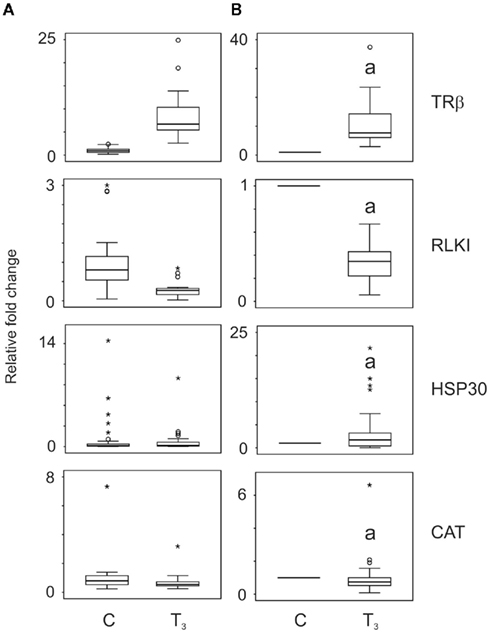
Figure 1. The effect of application of repeated measures analysis on QPCR data generated for thyroid hormone receptor β (TRβ), Rana larval keratin I (RLKI), heat shock protein 30 (HSP30), and catalase (CAT) transcripts. Tail fin biopsies were exposed to vehicle control (C) or 10 nM T3. The data (n = 23–32) are plotted as independent measures in (A) and then as repeated measures in (B). Taking the individual’s baseline expression levels greatly reduces overall variation and enables the identification of perturbation of a response to T3 relative to each individual’s normal T3 response. Box plots show medians ± first and third quartiles. The whiskers indicate minimum and maximum values excluding outliers and extreme values. Outlier (cases between 1.5 and 3.0 box lengths from the upper or lower edge of the box) and extreme values (cases >3.0 box lengths from the upper or lower edge of the box) are indicated by an open circle and asterisk, respectively. Statistical significance is indicated with the letter “a” for p < 0.05.
The C-fin experimental design allows for the determination of relationship between the individual animal’s baseline transcript levels and the extent of change in transcript level in response to chemical treatment. We examined the correlation between the baseline (control) levels of each transcript to each other and to the individual’s level of fold induction in response to T3 exposure (Table 1). A strong negative correlation between baseline transcript levels and the degree of fold response to T3 for all four transcripts was observed (Table 1). This observation was consistent with previously reported observations for TRβ and RLKI transcripts (Hinther et al., 2010a). A strong negative correlation was observed between the baseline levels of CAT and the T3-dependent reduction of RLKI transcripts and RLKI and the T3-dependent decrease of the CAT transcript (Table 1). A positive correlation was observed between the baseline levels of HSP30 and the T3-dependent increase of TRβ mRNAs (Table 1).
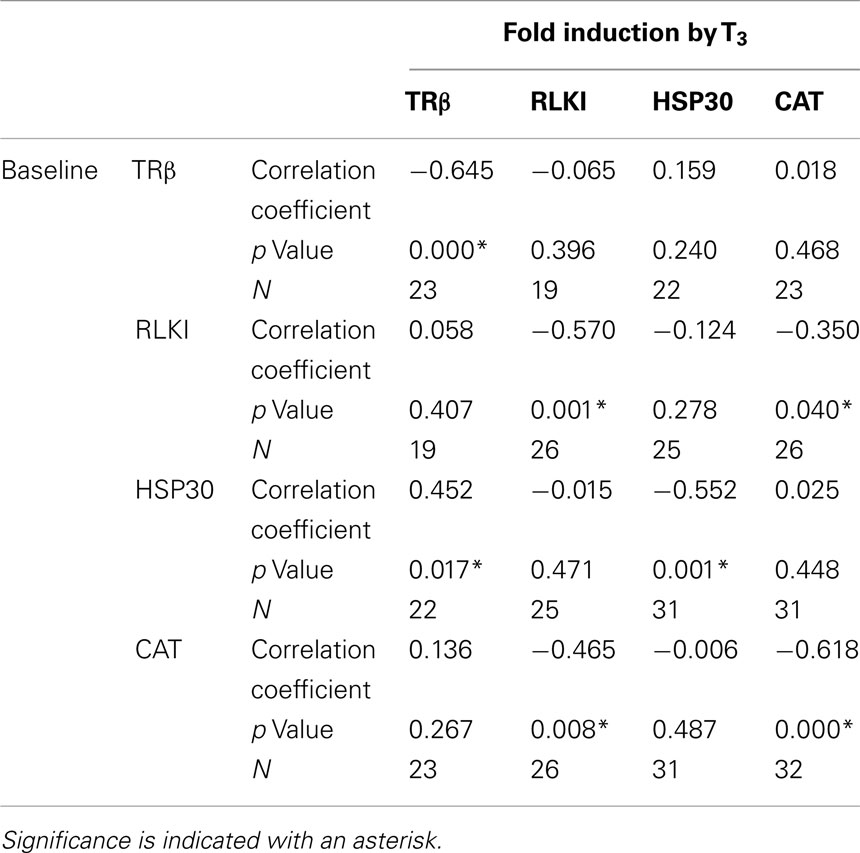
Table 1. Spearman’s rho correlation analysis comparing baseline transcript levels with extent of (fold) induction in response to T3 treatment.
Exposure to 0.5 and 5 mg/L NO2–N (in the form of NaNO2) for 48 h did not have any effect on the TH-responsive gene transcripts, TRβ and RLKI, in the absence (p = 0.683 and 0.257, respectively; Friedman) or presence of T3 (p = 0.282 and 0.751, respectively, Friedman; Figure 2). Exposure to 5 mg/L sodium gluconate (Na-G; as a control for sodium) also did not result in a significant effect compared to the control (p = 0.300–0.875, Wilcoxon; Figure 2).
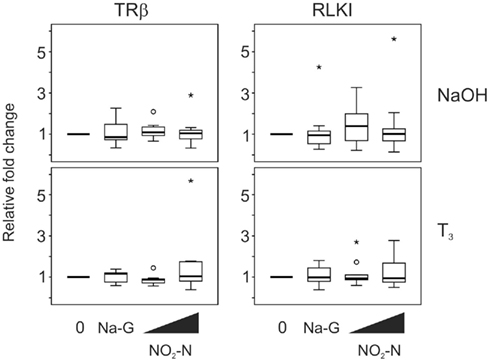
Figure 2. QPCR analysis of thyroid hormone receptor β (TRβ) and Rana larval keratin I (RLKI) transcript levels in the C-fin assay after exposure to nitrite in the absence or presence of 10 nM T3. Tail fin biopsies were exposed to vehicle control (water; 0) and the indicated test chemicals for 48 h in the presence of 400 nM NaOH or 10 nM T3 in 400 nM NaOH solvent. Test chemical concentrations were 5 mg/L sodium control (in the form of sodium gluconate, Na-G), 0.5 and 5 mg/L NO2–N (in the form of NaNO2). The results are expressed as fold change relative to the vehicle control (NaOH; upper panels) or to the vehicle +T3-induced levels (lower panels) and represent QPCR data from n = 7–12 animals. Increasing concentrations of test chemicals are represented by bevels. See Figure 1 legend for more details.
Exposure to 5 and 50 mg/L NO3–N (in the form of NaNO3) did not result in a change in TRβ and RLKI transcript levels in the absence (p = 0.565 and 0.913, respectively, Friedman; Figure 3) or presence of T3 (p = 0.066 and 0.529, respectively, Friedman; Figure 3). The 50 mg/L sodium control (in the form of sodium gluconate, Na-G) in this experiment had no effect as well (p = 0.480–1.000, Wilcoxon; Figure 3).
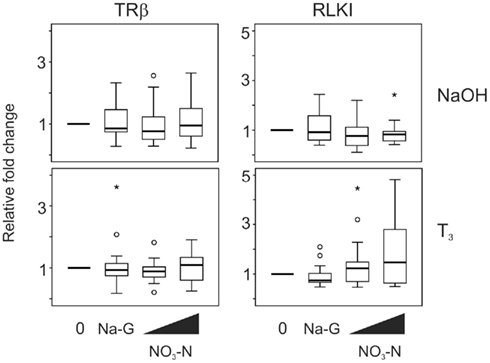
Figure 3. QPCR analysis of thyroid hormone receptor β (TRβ) and Rana larval keratin I (RLKI) transcript levels in the C-fin assay after exposure to nitrate in the absence or presence of 10 nM T3. Tail fin biopsies were exposed to vehicle control (water; 0) and the indicated test chemicals for 48 h in the presence of 400 nM NaOH or 10 nM T3 in 400 nM NaOH solvent. Test chemical concentrations were 50 mg/L sodium control (in the form of sodium gluconate, Na-G), 5 and 50 mg/L NO3–N (in the form of NaNO3). The results are expressed as fold change relative to the vehicle control (NaOH; upper panels) or to the vehicle +T3-induced levels (lower panels) and represent QPCR data from n = 14–16 animals. Increasing concentrations of test chemicals are represented by bevels. See Figure 1 legend for more details.
Exposure to 0.5 and 5 mg/L NO2–N did not affect HSP30 and CAT transcript levels in the absence (p = 0.444 and 0.185, respectively, Friedman; Figure 4) or presence of T3 (p = 0.570 and 0.779, respectively, Friedman; Figure 4). Exposure to 5 mg/L Na-G also did not result in a significant effect (p = 0.438–0.717, Wilcoxon; Figure 4).
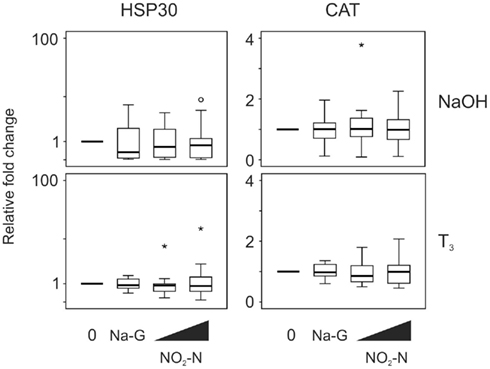
Figure 4. QPCR analysis of heat shock protein 30 (HSP30) and catalase (CAT) transcript levels in the C-fin assay after exposure to nitrite in the absence or presence of 10 nM T3. Tail fin biopsies were exposed to vehicle control (water; 0) and the indicated test chemicals for 48 h in the presence of 400 nM NaOH or 10 nM T3 in 400 nM NaOH solvent. Test chemical concentrations were 5 mg/L sodium control (in the form of sodium gluconate, Na-G), 0.5 and 5 mg/L NO2–N (in the form of NaNO2). The results are expressed as fold change relative to the vehicle control (NaOH; upper panels) or to the vehicle +T3-induced levels (lower panels) and represent QPCR data from n = 15–16 animals. Increasing concentrations of test chemicals are represented by bevels. See Figure 1 legend for more details.
Exposure to 5 and 50 mg/L NO3–N did not result in a change in stress-responsive transcript levels in the absence (p = 0.282 and 0.819, HSP30 and CAT transcripts respectively, Friedman) or presence of T3 (p = 0.074 and 0.819, respectively, Friedman; Figure 5). Exposure to 50 mg/L Na-G had no effect on the stress-responsive transcripts (p = 0.796–1.000, Wilcoxon; Figure 5).
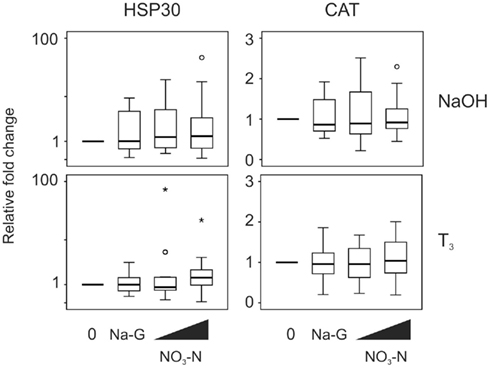
Figure 5. QPCR analysis of heat shock protein 30 (HSP30) and catalase (CAT) transcript levels in the C-fin assay after exposure to nitrate in the absence or presence of 10 nM T3. Tail fin biopsies were exposed to vehicle control (water; 0) and the indicated test chemicals for 48 h in the presence of 400 nM NaOH or 10 nM T3 in 400 nM NaOH solvent. Test chemical concentrations were 50 mg/L sodium control (in the form of sodium gluconate, Na-G), 5 and 50 mg/L NO3–N (in the form of NaNO3). The results are expressed as fold change relative to the vehicle control (NaOH; upper panels) or to the vehicle +T3-induced levels (lower panels) and represent QPCR data from n = 16 animals. Increasing concentrations of test chemicals are represented by bevels. See Figure 1 legend for more details.
Changes in population variation have been associated with endocrine disruptive events and exposure to pollutants (Orlando and Guillette, 2001). An increase in variance is often found in contaminant-exposed sites compared with reference site populations, in part, due to varying individual responses to the environmental stressor. Since more individuals are at the perimeter of a population range away from the more homogeneous central part of the range, the contaminant-exposed population is less able to adapt to environmental stress and may require additional energy budget expenditures to survive (Orlando and Guillette, 2001). Thus, variation can represent an additional indicator of population health not necessarily captured by measures of central tendency (Orlando and Guillette, 2001). No alterations in heteroscedasticity were observed for any transcripts between the Na-G controls or the nitrite treatments (Table 2). This was also the case for nitrate in the absence of hormone. However, when T3 was present, nitrate exposure affected the degree of heteroscedasticity in both TRβ and RLKI mRNAs, but not HSP30 or CAT transcripts (Table 2). A change in heteroscedasticity, as observed with nitrate exposure, suggests an alteration in the response to TH at the tissue level that is consistent with the conflicting acceleratory and inhibitory effects on TH-dependent processes that have previously been observed (Xu and Oldham, 1997; Edwards et al., 2006; Ortiz-Santaliestra and Sparling, 2007). The data in the present study suggest that nitrate and nitrite differ in cellular effects on TH signaling while not eliciting stress responses in the TH-responsive tail fin tissue. Moreover, direct cellular effects of nitrate on peripheral tissues as a mechanism in influencing metamorphosis still remains a possibility but that this effect is not straightforward. Examination of additional time points would be useful to evaluate whether TH-mediated response kinetics are altered.

Table 2. Analysis of variation using Levine’s test.
It has been postulated that nitrite and nitrate could act as nitric oxide donors through a non-genomic mechanism (Guillette and Edwards, 2005; Hannas et al., 2010). Nitric oxide donors have been shown to mimic the ability of T4 to suppress catalase enzyme activity associated with tail shortening and apoptosis in vitro (Kashiwagi et al., 1999). However, a definitive connection between nitrate and nitrite and nitric oxide production in amphibian tissues has not been established, although this relationship has been shown in Daphnia (Hannas et al., 2010). The fact that nitrate elicited some response whereas nitrite did not on cultured tail fin suggest that this influence could be limited. Direct effects of nitrate and nitrite upon other amphibian tissues (such as the thyroid gland) through genomic and/or non-genomic methods from tissue culture experiments and comparison to molecular responses elicited from whole animal exposures remain to be determined.
Conflict of Interest Statement
The authors declare that the research was conducted in the absence of any commercial or financial relationships that could be construed as a potential conflict of interest.
Acknowledgments
This work was funded through a grant from the Natural Sciences and Engineering Research Council to CCH.
References
Camargo, J. A., Alonso, A., and de la Puente, M. (2004). Multimetric assessment of nutrient enrichment in impounded rivers based on benthic macroinvertebrates. Environ. Monit. Assess. 96, 233–249.
Camargo, J. A., Alonso, A., and Salamanca, A. (2005). Nitrate toxicity to aquatic animals: a review with new data for freshwater invertebrates. Chemosphere 58, 1255–1267.
CCME. (2007). Canadian Water Quality Guidelines for the Protection of Aquatic Life, Environment Canada. Ottawa: Canadian Council of Ministers of the Environment.
Crain, E. F. (2000). Environmental threats to children’s health: a challenge for pediatrics: 2000 ambulatory pediatric association (APA) presidential address. Pediatrics 106, 871–875.
Crow, G. L., Luer, W. H., and Harshbarger, J. C. (2001). Histological assessment of goiters in elasmobranch fishes. J. Aquat. Anim. Health 13, 1–7.
Crump, D., Werry, K., Veldhoen, N., Van Aggelen, G., and Helbing, C. C. (2002). Exposure to the herbicide acetochlor alters thyroid hormone-dependent gene expression and metamorphosis in Xenopus laevis. Environ. Health Perspect. 110, 1199–1205.
Deane, E. E., Zhou, L., and Woo, N. Y. (2007). Effects of mitogenic hormones on HSP70 expression in a silver sea bream fibroblast cell line and a primary macrophage preparation. Gen. Comp. Endocrinol. 152, 183–188.
De Groef, B., Decallonne, B. R., Van der Geyten, S., Darras, V. M., and Bouillon, R. (2006). Perchlorate versus other environmental sodium/iodide symporter inhibitors: potential thyroid-related health effects. Eur. J. Endocrinol. 155, 17–25.
Domanski, D., and Helbing, C. C. (2007). Analysis of the Rana catesbeiana tadpole tail fin proteome and phosphoproteome during T3-induced apoptosis: identification of a novel type I keratin. BMC Dev. Biol. 7, 94. doi:10.1186/1471-213X-7-94
Edwards, T. M., McCoy, K. A., Barbeau, T., McCoy, M. W., Thro, J. M., and Guillette, L. J. Jr. (2006). Environmental context determines nitrate toxicity in Southern toad (Bufo terrestris) tadpoles. Aquat. Toxicol. 78, 50–58.
European Union Commission. (2006). Environmental Fact Sheet, “REACH – A New Chemicals Policy for the EU.” Brussels: European Commission.
Gray, B. R., Hill, W. R., and Stewart, A. J. (2001). Effects of development time, biomass and ferromanganese oxides on nickel sorption by stream periphyton. Environ. Pollut. 112, 61–71.
Guillette, L. J., and Edwards, T. M. (2005). Is nitrate an ecologically relevant endocrine disruptor in vertebrates? Integr. Comp. Biol. 45, 19–27.
Hampel, R., and Zollner, H. (2004). Iodine supply and incidence of goitrogenics in Germany. Ernahrungs Umschau 51, 132.
Hannas, B. R., Das, P. C., Li, H., and LeBlanc, G. A. (2010). Intracellular conversion of environmental nitrate and nitrite to nitric oxide with resulting developmental toxicity to the crustacean Daphnia magna. PLoS ONE 5, e12453. doi:10.1371/journal.pone.0012453
Health Canada. (2008). Guidelines for Canadian Drinking Water Quality Summary Table. Ottawa: Government of Canada, 1–14.
Helbing, C., Bailey, C., Ji, L., Gunderson, M., Zhang, F., Veldhoen, N., Mu, R., Lesperance, M., Holcombe, G., Kosian, P., Tietge, J., Korte, J. J., and Degitz, S. (2007a). Identification of gene expression indicators for thyroid axis disruption in a Xenopus laevis metamorphosis screening assay Part 1: effects on the brain. Aquat. Toxicol. 82, 227–241.
Helbing, C. C., Ji, L., Bailey, C. M., Veldhoen, N., Zhang, F., Holcombe, G. W., Kosian, P. A., Tietge, J., Korte, J. J., and Degitz, S. J. (2007b). Identification of gene expression indicators for thyroid axis disruption in a Xenopus laevis metamorphosis screening assay Part 2. Effects on the tail and hindlimb. Aquat. Toxicol. 82, 215–226.
Hinther, A., Bromba, C., Wulff, J., and Helbing, C. (2011). Effects of triclocarban, triclosan, and methyl triclosan on thyroid hormone action and stress in frog and mammalian culture systems. Environ. Sci. Technol. 45, 5395–5402.
Hinther, A., Domanski, D., Vawda, S., and Helbing, C. C. (2010a). C-fin: a cultured frog tadpole tail fin biopsy approach for detection of thyroid hormone-disrupting chemicals. Environ. Toxicol. Chem. 29, 380–388.
Hinther, A., Vawda, S., Skirrow, R. C., Veldhoen, N., Collins, P., Cullen, J. T., van Aggelen, G., and Helbing, C. C. (2010b). Nanometals induce stress and alter thyroid hormone action in amphibia at or below North American water quality guidelines. Environ. Sci. Technol. 44, 8314–8321.
Ji, L., Domanski, D., Skirrow, R. C., and Helbing, C. C. (2007). Genistein prevents thyroid hormone-dependent tail regression of Rana catesbeiana tadpoles by targetting protein kinase C and thyroid hormone receptor alpha. Dev. Dyn. 236, 777–790.
Kashiwagi, A., Hanada, H., Yabuki, M., Kanno, T., Ishisaka, R., Sasaki, J., Inoue, M., and Utsumi, K. (1999). Thyroxine enhancement and the role of reactive oxygen species in tadpole tail apoptosis. Free Radic. Biol. Med. 26, 1001–1009.
Onken, H., Tresguerres, M., and Luquet, C. M. (2003). Active NaCl absorption across posterior gills of hyperosmoregulating Chasmagnathus granulatus. J. Exp. Biol. 206, 1017–1023.
Opitz, R., Lutz, I., Nguyen, N. H., Scanlan, T. S., and Kloas, W. (2006). Analysis of thyroid hormone receptor beta A mRNA expression in Xenopus laevis tadpoles as a means to detect agonism and antagonism of thyroid hormone action. Toxicol. Appl. Pharmacol. 212, 1–13.
Orlando, E. F., and Guillette, L. J. Jr. (2001). A re-examination of variation associated with environmentally stressed organisms. Hum. Reprod. Update 7, 265–272.
Ortiz-Santaliestra, M. E., and Sparling, D. W. (2007). Alteration of larval development and metamorphosis by nitrate and perchlorate in southern leopard frogs (Rana sphenocephala). Arch. Environ. Contam. Toxicol. 53, 639–646.
Porter, W. P., Jaeger, J. W., and Carlson, I. H. (1999). Endocrine, immune, and behavioral effects of aldicarb (carbamate), atrazine (triazine) and nitrate (fertilizer) mixtures at groundwater concentrations. Toxicol. Ind. Health 15, 133–150.
Rouse, J. D., Bishop, C. A., and Struger, J. (1999). Nitrogen pollution: an assessment of its threat to amphibian survival. Environ. Health Perspect. 107, 799–803.
Sampat, P. (2000). Groundwater shock: the polluting of the world’s major freshwater stores. World Watch 10–22.
Shi, Y.-B. (2000). Amphibian Metamorphosis: From Morphology to Molecular Biology. New York, NY: Wiley-Liss.
Skirrow, R. C., Veldhoen, N., Domanski, D., and Helbing, C. C. (2008). Roscovitine inhibits thyroid hormone-induced tail regression of the frog tadpole and reveals a role for cyclin C/Cdk8 in the establishment of the metamorphic gene expression program. Dev. Dyn. 237, 3787–3797.
Taylor, A. C., and Kollros, J. J. (1946). Stages in the normal development of Rana pipiens larvae. Anat. Rec. 94, 7–24.
US EPA. (2006). National Recommended Water Quality Criteria. Office of Water, Office of Science and Technology. Washington, DC: United States Environment Protection Agency.
US EPA. (2009). National Drinking Water Regulations. Office of Water, Office of Science and Technology. Washington, DC: United States Environment Protection Agency.
Veldhoen, N., Skirrow, R., Osachoff, H., Wigmore, H., Clapson, D., Gunderson, M., van Aggelen, G., and Helbing, C. (2006a). The bactericidal agent triclosan modulates thyroid hormone-associated gene expression and disrupts postembryonic anuran development. Aquat. Toxicol. 80, 217–227.
Veldhoen, N., Skirrow, R. C., Ji, L., Domanski, D., Bonfield, E. R., Bailey, C. M., and Helbing, C. C. (2006b). Use of heterologous cDNA arrays and organ culture in the detection of thyroid hormone-dependent responses in a sentinel frog, Rana catesbeiana. Comp. Biochem. Physiol. Part D Genomics Proteomics 1, 187–199.
Wyngaarden, J. B., Stanbury, J. B., and Rapp, B. (1953). The effects of iodine, perchlorate, thiocyanate, and nitrate administration upon the iodide concentrating mechanism of the rat thyroid. Endocrinology 52, 568–574.
Wyngaarden, J. B., Wright, B. M., and Ways, P. (1952). The effect of certain anions upon the accumulation and retention of iodide by the thyroid gland. Endocrinology 50, 537–549.
Xu, Q., and Oldham, R. S. (1997). Lethal and sublethal effects of nitrogen fertilizer ammonium nitrate on common toad (Bufo bufo) tadpoles. Arch. Environ. Contam. Toxicol. 32, 298–303.
Zaki, A., Chaoui, A. A., Talibi, A., Derouiche, A. F., Aboussaouira, T., Zarrouck, K., Chait, A., and Himmi, T. (2004). Impact of nitrate intake in drinking water on the thyroid gland activity in male rat. Toxicol. Lett. 147, 27–33.
Keywords: nitrate, nitrite, frog, thyroid hormone, metamorphosis, C-fin, organ culture assay, quantitative real time polymerase chain reaction
Citation: Hinther A, Edwards TM, Guillette Jr. LJ and Helbing CC (2012) Influence of nitrate and nitrite on thyroid hormone responsive and stress-associated gene expression in cultured Rana catesbeiana tadpole tail fin tissue. Front. Gene. 3:51. doi: 10.3389/fgene.2012.00051
Received: 23 January 2012; Paper pending published: 26 February 2012;
Accepted: 20 March 2012; Published online: 04 April 2012.
Edited by:
Jonathan Freedman, National Institute of Environmental Health Science, National Institute of Health, USACopyright: © 2012 Hinther, Edwards, Guillette Jr. and Helbing. This is an open-access article distributed under the terms of the Creative Commons Attribution Non Commercial License, which permits non-commercial use, distribution, and reproduction in other forums, provided the original authors and source are credited.
*Correspondence: Caren C. Helbing, Department of Biochemistry and Microbiology, University of Victoria, P.O. Box 3055 STN CSC, Victoria, BC, Canada V8W 3P6. e-mail: chelbing@uvic.ca