
- The Roslin Institute and Royal (Dick) School of Veterinary Studies, University of Edinburgh, Edinburgh, UK
This paper identifies issues associated with field disease data and their implications on the interpretation of estimated genetic parameters and experimental designs. The main focus is on concepts relating to the impacts of diagnostic test properties and exposure to infection, and how exposure to infection is intricately related to within-herd epidemic dynamics. The following are raised challenges: (i) to more fully understand and describe the dynamic impacts of disease epidemics on genetic interpretations; (ii) to develop statistical methods to jointly estimate epidemiological and genetic parameters from complex epidemiological data; (iii) to develop and explore optimal experimental designs for case-control studies, exploiting field disease data. Solving these problems would add insight to both disease genetic and epidemiological studies, as well as enabling us to better select animals for increased disease resistance.
Introduction
High throughput genomics techniques open hitherto unforeseen opportunities for dissecting, and genetically improving, complex traits in livestock. Foremost amongst complex traits is resistance to infectious disease, which is now the focus of many studies. A detailed appraisal of infectious diseases that may be amenable to host genetic studies is presented by Davies et al. (2009). Disease genetics studies typically require observations on many animals in order to quantify genetic variation or perform a genome scan of sufficient power. This usually necessitates utilizing field data because, with the exception of some aquacultural species (e.g., Moen et al., 2009; Houston et al., 2010), challenge experiments of a sufficient scale are not possible. For example, data may be captured from populations suffering endemic diseases with predictable prevalence, or from a population undergoing an epidemic such as bovine tuberculosis (Brotherstone et al., 2010) or infectious pancreatic necrosis (IPN; Houston et al., 2008). However this requirement for extensive data can also be turned into an opportunity, as dense SNP-chip based genomic prediction techniques provide the means to retrieve genetic information where it would otherwise not have been possible. Consider a population undergoing an epidemic; even in the absence of known pedigrees or reliable animal identification, classification of DNA as coming from cases or control may enable the development of genomic predictors of resistance that can (in principle) be applied to any animal from the same breed.
Before using field disease data for any genetic study, its properties must be understood. A generic problem with field disease data is that it is very “noisy”: diagnosis of infection or disease may be imprecise, it can be difficult to determine when infection of an individual occurred and it is often unclear whether or not apparently healthy individuals have been exposed to the infection. These factors can greatly complicate the interpretation of field disease data and even lead to skepticism by some regarding its usefulness at all. However, from an analytical perspective, they are merely biases that in principle can be factored into any expectation or analysis. These concepts, and the impacts of these “noise” factors on variance component estimation, were first presented by Bishop and Woolliams (2010). These authors derived formulae, in the context of viral or bacterial infections, to illustrate the biases to estimated heritabilities caused by incomplete exposure or imperfect diagnosis of infection.
Here we further develop the necessary concepts to interpret field disease data and summarize their impact on heritability and SNP association studies. Additionally, we consider how the interpretation of SNP association studies may be influenced by the data collection strategies, we suggest experimental designs for genome scans which may perform better than classic matched case-control studies and we identify issues yet to be resolved.
Disease Data Properties: Assuming Static Conditions
In reality most field disease data is collected from a dynamic epidemic situation, where the number of infected animals changes over time, due to interactions between infected and susceptible individuals. These are complex functions of environmental and host genetic factors. Analogies may be drawn between the spread of infection and so-called associative effects models (Muir, 1996; Bijma et al., 2007) in which an animal’s phenotype is a function of its own phenotype and the phenotype of its herd mates. For simplicity we firstly ignore such dynamic interactions, and consider the case of binary classification of animal phenotypes at a particular point in time as healthy or diseased.
Incomplete Exposure to Infection
Suppose there is an infective dose of pathogen (μ) which may be expected to result in a typical animal becoming infected and then diseased (i.e., showing clinical signs). Animals receiving an infective dose greater than μ are defined as exposed, with the proportion of animals in this category being ε. The fraction of the whole population that is identified as diseased is a function of (i) the proportion of individuals that have been exposed to the pathogen (ε) and (ii) the virtual prevalence (p), i.e., the prevalence when ε = 1. Assuming that exposure is random and independent of host genotype, then the observed prevalence is εp. Of the 1 − εp proportion of individuals that are healthy, ε(1 − p) are exposed and apparently resistant, whilst (1 − ε) have not yet been exposed and have not expressed any genotype related to “disease resistance.” The phenotypic variance of observed “disease resistance” is εp (1 − εp). Incomplete exposure results in a downwards bias in both estimated SNP effects from association studies and heritabilities as follows.
SNP effect biases
The bias in the estimated allelic substitution effect (α) is simply the regression of observed phenotype on virtual phenotype (that which would have been observed with complete exposure), i.e., ε.
Heritability biases
The heritability bias is a function of both the level of exposure and, assuming an underlying normal distribution for liability, the altered prevalence thresholds. From Bishop and Woolliams (2010), heritabilities on the observed and liability scales are ε2ϕ(xp)2(εp)−1(1 − εp)−1h2 and ε2ϕ(xp)2ϕ(xεp)−2h2, respectively, where h2 is the liability heritability with complete exposure and ϕ(xp) is the corresponding normal density function evaluated at xp.
Imperfect Diagnostic Tests
Animals will be classified into healthy and diseased categories by means of a diagnostic test. Implicit to all diagnostic tests are the concepts of specificity and sensitivity. Specificity (Sp) is the probability that a truly healthy individual is classified by the diagnostic test as healthy and sensitivity (Se) is the probability that a truly diseased individual is classified by the diagnostic test as diseased. From Table 1 it can be seen that observed prevalence (p′) can be expressed as a regression on true prevalence, i.e., p′ = (1 − Sp) + (Sp + Se − 1)p. Biases in estimated SNP effects and heritabilities are as follows.
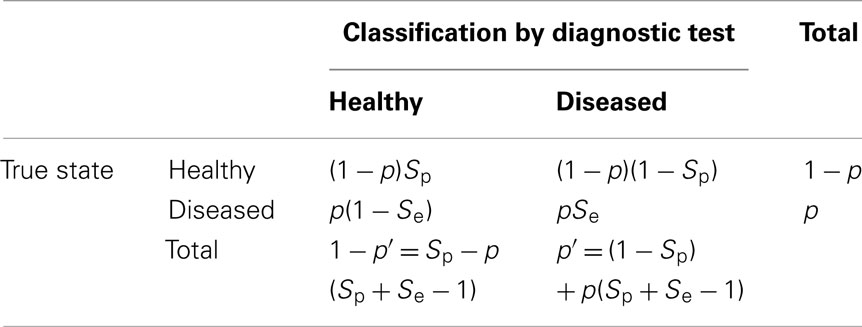
Table 1. Proportions of individuals classified as healthy or diseased, as a function of specificity (Sp) or sensitivity (Se).
SNP effect biases
The bias in α is the regression of observed phenotype on true phenotype, i.e. (Sp + Se − 1).
Heritability biases
The heritability biases take the same form as for exposure, being a function of the regression of observed on true and the altered liability thresholds. Thus, the heritabilities on the observed and liability scales are, respectively (Sp + Se − 1)2ϕ(xp)2p′−1(1 − p′)−1h2 and (Sp + Se − 1)2ϕ(xp)2ϕ(xp′)−2h2.
Combining Incomplete Exposure and Imperfect Diagnoses
Thus far, diagnostic test properties and exposure are considered independently, however often both factors will jointly affect the observed data. It is readily shown from Table 1 that with incomplete exposure and imperfect diagnostic tests, the observed prevalence is p′ = (1 − Sp) + (Sp + Se − 1)εp, where p is the true prevalence when ε = 1. It then follows that the bias in estimated α is (Sp + Se − 1)ε and the heritabilities on the observed and liability scales are ε2(Sp + Se − 1)2ϕ(xp)2p′−1(1 − p′)−1h2 and ε2(Sp + Se − 1)2ϕ(xp)2ϕ(xp′)−2h2, respectively.
Implications of Variable Infection Pressure
In different disease or epidemic scenarios there will be different infection pressures (B), i.e., dosage levels faced by animals when challenged. This will cause ε to change as the proportion of animals receiving an infective dose greater than μ will vary as some function of B. This will lead to different estimated SNP effects and heritabilities, as described above, however differences in B (and hence ε) will potentially also alter the apparent mode of inheritance of the SNP effects (i.e., additive, recessive, dominant).
For any given B value, and hence expected challenge level of pathogen, an animal’s susceptibility to infection determines its probability of becoming infected (hence diseased). For very low challenges the probability of infection will be negligible, whereas for very high challenges, an animal will become infected (provided that it is genetically capable of being infected). This is analogous to dosage levels in deliberate challenge studies where the dosage may be calibrated to obtain a pre-determined mortality (e.g., 50%) during the course of the trial.
The change in probability of infection as B increases may be described by a dose-response curve. For illustration, assuming that the probability of infection tends to κ as B becomes very high this curve may be conveniently described by the cumulative Normal distribution function , where μ is the dosage level leading to a mean infection proportion of 0.5κ and the σ determines the rate at which infection probability increases as dosage increases.
Within a population, different genotypes may differ in μ and/or σ. Similarly, the force of infection varies both between epidemics and over time within an epidemic, leading to exposure probabilities varying similarly. Dose-response curves for three hypothetical genotypes differing in μ (homozygous susceptible, homozygous resistant, and heterozygous) are plotted in Figure 1 (κ = 1). Whilst the resistance allele will be declared additive for a wide range of B levels, at low levels it will be declared dominant whereas at high B levels it will be thought to be partially recessive. Empirical agreement comes from published results for resistance to the viral disease IPN in Atlantic salmon, where a single QTL has been shown in repeated studies to account for nearly all the genetic variation in the resistance of salmon fry (Moen et al., 2009; Gheyas et al., 2010; Houston et al., 2010). In the studies of Moen et al. and Gheyas et al. where in the challenge tests the population average mortality was close to 60 and 70%, respectively, the QTL effect was additive with no evidence of dominance. However, in the study of Houston et al. population average mortality was 9%, and the resistance haplotype was almost completely dominant over the susceptibility haplotype.
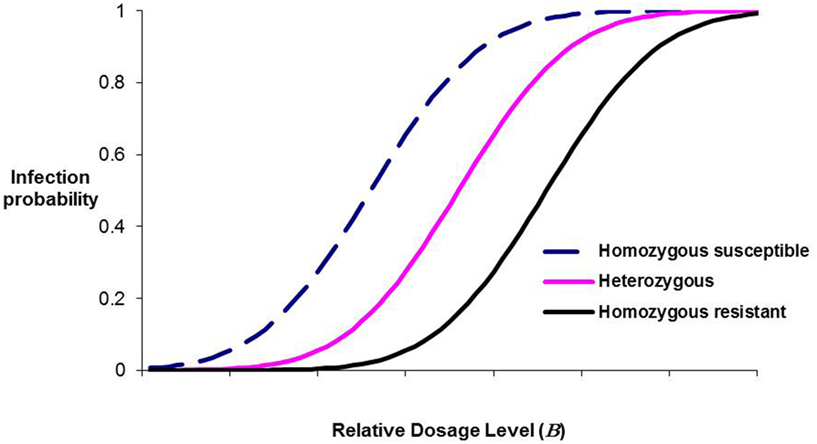
Figure 1. Infection probability as a function of dosage level for three hypothetical major-gene genotypes, illustrating how the inferred mode of resistance will change as dosage level changes.
Disease Data Properties: Assuming Dynamic Conditions
The key factor ignored so far is that most epidemics are dynamic ever-changing processes, with infectious animals infecting immunologically susceptible animals. Thus an individual animal’s expressed phenotype is influenced by the phenotypes of other animals in contact with it, a situation analogous to associative effects models (Muir, 1996; Bijma et al., 2007). The basic theoretical principles underlying epidemic processes have been well and exhaustively described (Anderson and May, 1991), although most theory assumes individuals are genetically homogeneous.
In terms of infection dynamics during an epidemic, the critical concept to note is that the infection pressure (i.e., B) will change as the number of infectious animals changes. Therefore, depending on when during an epidemic data is collected, B and ε will change, and consequently inferences made about SNP effects, SNP inheritance patterns and heritabilities will all alter. However, these changes are complex and will depend upon the transmission properties of the infection. Simple principles are now described.
Consider a simple situation in which animals are defined as being in one of three categories, viz. (i; immunologically) susceptible to infection, (ii) infected and infectious, or (iii) recovered from infection (and consequently no longer infectious or susceptible to infection). The numbers of animals in each category at any point in time are S, I, and R, respectively. The epidemic dynamics are: dS/dt = −βSI + λR, dI/dt = γI, and dI/dt = γI − λR, where t is time (days), β is the transmission coefficient, γ is the rate of recovery of infectious animals, and λ is the rate at which recovered animals lose immunity and become immunologically susceptible again. In an SI model, in which animals remain infectious after becoming infected, γ and λ are both zero. In an SIR model recovered animals do not lose immunity, hence λ is zero. In an SIRS model, in which animals may potentially become infected multiple times, all three parameters are non-zero and an endemic equilibrium prevalence may be reached.
Figure 2 presents a plot of the predicted number of infectious animals for each model, for constant (arbitrary) non-zero parameters and a population size of 1000. The infection pressure B will vary in proportion to βI, and this changes dramatically over time and it varies markedly with transmission model. In an SI model, B rises until all animals that can be infected have been infected; in an SIR model B rises to a maximum and then declines as most infectious animals recover; in an SIRS model (depending on parameter combinations) B may rise then reach an equilibrium value. In the SIR model example shown, unexposed animals remain in the population even after 350 days. In all three models, the change in B with time indicates that there is genetic information in when animals became infected, as well as which animals became infected. In cases where animals are genetically heterogeneous, animals infected early in an epidemic became infected when B was lower and therefore, chance contact effects aside, these animals are more susceptible.
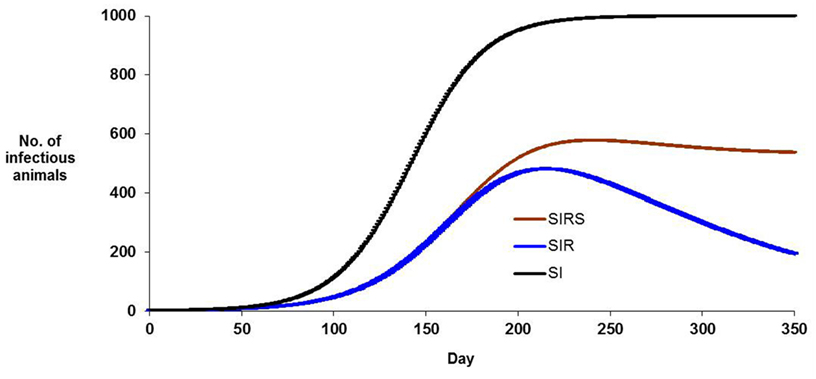
Figure 2. Numbers of infectious animals during the course of an hypothetical epidemic, for three modes of transmission of infection, (i) SI model in which infected animals remain infectious, (ii) SIR model in which infected animals recover so that they are no longer infectious and remain immune to the infection, (iii) SIRS model in which recovered animals lose their immunity and become immunologically susceptible again. Non-zero parameter values are identical for each model. Population size is 1000 animals.
Fully accounting for the impacts of the dynamic nature of data from disease epidemics remains a complex and unsolved problem. Conclusions drawn will depend upon when during the epidemic the data is recorded, the duration of data recording and the power (i.e., sensitivity and specificity) of the diagnostic tests. For example, a diagnostic test or data recording strategy which can determine which animals have ever been infected or diseased will be more powerful than one which can only detect currently infected or diseased animals.
Perspectives
Synopsis
Field data from infectious disease epidemics are interesting, informative, and complex. We have demonstrated that noise elements associated with such data do cause biases in the results obtained, however these biases can be predicted given knowledge of the disease. Downward biases in estimated SNP effects are linear with exposure probability or with diagnostic test inaccuracy, whereas biases in heritabilities are more complex, being a function of altered disease prevalence and squared terms in exposure or diagnostic test accuracy. Further, the apparent SNP mode of inheritance may change with infection pressure and exposure probability.
Interpretations of genetic parameters (i.e., variance components and SNP effects) obtained from field data may change substantially given knowledge of the disease biology. For example, a genetic signal in field disease data, even a weak signal, may well be indicative of much stronger underlying genetic control of resistance or strong genetic control of the components of the immune response that contribute to variation in disease resistance. Specific examples where this may be the case (viz. the impact of exposure on the heritability of IPN resistance in salmon and the impact of imperfect diagnostic tests on the heritability of bovine tuberculosis resistance) were elaborated by Bishop and Woolliams (2010).
Implications for Experimental Design
The results and principles discussed here may have implications for optimal experimental design of case-control genome scans. Consider the definitions of the cases and controls. Under the assumption that the specificity of the diagnostic test is good (i.e., very few false positives), then cases are self-evidently genetically susceptible individuals that have been exposed to infection and have been diagnosed as diseased. At best, controls have been exposed to infection, have had the opportunity to express their resistance genotype and have subsequently been correctly diagnosed as healthy. At worst, the controls have not been exposed to infection or they have been misdiagnosed. In this worst case scenario, controls will simply be representative of the population average and (depending on the virtual prevalence) information is still obtainable from the comparison of cases and population average. This is the so-called “Wellcome Trust design”; although the comparison of cases vs. average is less powerful than cases vs. true controls, this weaker contrast may be offset in some circumstances by having a larger number of population average animals available and genotyped. For example, this is the situation in dairy cattle breeding where large numbers of animals, including all widely used sires, have been genotyped with SNP chips.
Notwithstanding the appropriateness of the “Wellcome Trust design” in some circumstances, improved designs for case-control studies may be proposed from the results presented here. In most situations, animals will be sampled across several herds, which will differ in stage of epidemic and disease prevalence, so (assuming that we target animals of the same breed and equivalent environmental circumstances) the question is from which cohorts should the animals be sampled, and when during an epidemic should this sampling take place? Commonly used experimental protocols have cases and controls matched for risk factors such as age, farm, and sex. Whilst this may be an efficient design for investigating and quantifying risk factors that are not a part of the objectives of the experiment, it is potentially inefficient for identification of genetic effects as it ignores genetic information that can be inferred from epidemic dynamics. In other words, it is designed for the wrong purpose. In general terms, controls sampled when prevalence, and hence B, is low will be poorly informative and resemble population average animals. Conversely, cases sampled when prevalence is low (prior to peak prevalence) are likely to be those that are most susceptible to infection whilst those sampled at peak prevalence will contain animals that are amongst the least susceptible of the ultimately infected animals.
We propose a more rational design for a case-control genome scan study, such that epidemiological principles are incorporated into the choice of cases and controls. In broad terms, the aim is to target animals such that (i) cases are likely to be the most susceptible, i.e., ideally they should be sampled from situations where B and hence ε are low and (ii) controls have had maximal opportunity to demonstrate that they are truly resistant, i.e., ideally they should be sampled from situations where B and hence ε are high. Achieving this could utilize information both within and across herds. Within a herd, all other factors being constant, targeting earlier-infected animals as cases is likely to increase their genetic differentiation from the population average, whilst controls should be those that remain uninfected even at peak prevalence. In principle, similar information is obtainable from between-herd differences in prevalence, although there are risks of hidden biases affecting outcomes – the most obvious being herd-specific diagnostic test sensitivities. Targeted, rather than random, sampling of animals from herds risks introducing biases into the estimation of non-genetic effects, a situation also true with conventional case-control designs. This may be partly addressed by including some function of herd-level prevalence as a covariate in analyses which combine data across herds. In all situations, hidden genetic structure remaining in the data must be corrected for using the genetic similarity information inherent in SNP array (or sequencing) genotypes.
Challenges
Understanding how disease and epidemiological factors affect disease data can greatly influence how we interpret the results, and possibly even lead to more efficient experimental design. However, the theory describing these impacts is still somewhat rudimentary and concepts that have been presented have yet to be fully explored. We see the following as challenges:
• To more fully understand and describe the dynamic impacts of disease epidemics on genetic interpretations. We need to better understand how type of epidemic, and sampling strategy during the epidemic, influence estimated parameters and accuracy of selection.
• To develop statistical methods to jointly estimate epidemiological parameters (e.g., β, γ) or concepts (e.g., exposure, sensitivity, specificity) simultaneously with genetic parameters (e.g., heritability) from complex epidemiological data. Such methods will conceivably build on Bayesian frameworks which exist to analyze epidemic data from heterogeneous populations.
• To further develop and explore optimal experimental designs for case-control studies exploiting field disease data, and quantify the consequences of GWAS studies performed in different stages and different types of epidemics.
Meeting these challenges would formally bring together the disciplines of genetics and epidemiology, add considerable value to ongoing disease genetic studies, allow us to better understand and dissect host responses to infection, and enable us to better select animals for improved resistance.
Conflict of Interest Statement
The authors declare that the research was conducted in the absence of any commercial or financial relationships that could be construed as a potential conflict of interest.
Acknowledgments
We thank the BBSRC (Institute Strategic Programme Grant) and the Scottish Government Rural and Environment Research and Analysis Directorate (through the Strategic Partnership on Animal Science Excellence initiative) for funding.
References
Anderson, R. M., and May, R. M. (1991). Infectious Diseases of Humans. Dynamics and Control. Oxford: Oxford University Press.
Bijma, P., Muir, W. M., and Van Arendonk, J. A. M. (2007). Multilevel selection 1: quantitative genetics of inheritance and response to selection. Genetics 175, 277–288.
Bishop, S. C., and Woolliams, J. A. (2010). On the genetic interpretation of disease data. PLoS ONE 5, e8940. doi:10.1371/journal.pone.0008940
Brotherstone, S., White, I. M. S., Coffey, M., Downs, S. H., Mitchell, A. P., Clifton-Hadley, R. S., More, S. J., Good, M., and Woolliams, J. A. (2010). Evidence of genetic resistance of cattle to infection with Mycobacterium bovis. J. Dairy Sci. 93, 1234–1242.
Davies, G., Genini, S., Bishop, S. C., and Giuffra, E. (2009). An assessment of the opportunities to dissect host genetic variation in resistance to infectious diseases in livestock. Animal 3, 415–436.
Gheyas, A. A., Houston, R. D., Mota-Velasco, J. C., Guy, D. R., Tinch, A. E., Haley, C. S., and Woolliams, J. A. (2010). Segregation of infectious pancreatic necrosis resistance QTL in the early life cycle of Atlantic Salmon (Salmo salar). Anim. Genet. 5, 531–536.
Houston, R. D., Haley, C. S., Hamilton, A., Guy, D. R., Mota-Velasco, J., Gheyas, A., Tinch, A. E., Taggart, J. B., Bron, J. E., Starkey, WG., McAndrew, B. J., Verner-Jeffreys, D. W., Paley, R. K., Rimmer, G. S. E., Tew, I. J., and Bishop, S. C. (2010). The susceptibility of Atlantic salmon fry to freshwater infectious pancreatic necrosis is largely explained by a major QTL. Heredity (Edinb.) 105, 318–327.
Houston, R. D., Haley, C. S., Hamilton, A., Guy, D. R., Tinch, A., Taggart, J. B., McAndrew, B. J., and Bishop, S. C. (2008). Major QTL affect resistance to infectious pancreatic necrosis in Atlantic salmon (Salmo salar). Genetics 178, 1109–1115.
Moen, T., Baranski, M., Sonesson, A. K., and Kjoglum, S. (2009). Confirmation and fine-mapping of a major QTL for resistance to infectious pancreatic necrosis in Atlantic salmon (Salmo salar): population-level associations between markers and trait. BMC Genomics 10, 368. doi:10.1186/1471-2164-10-368
Keywords: epidemiology, animal, heritability, genome wide association analysis, field data
Citation: Bishop SC, Doeschl-Wilson AB and Woolliams JA (2012) Uses and implications of field disease data for livestock genomic and genetics studies. Front. Gene. 3:114. doi: 10.3389/fgene.2012.00114
Received: 15 May 2012; Accepted: 01 June 2012;
Published online: 22 June 2012.
Edited by:
Jean Michel Claude Elsen, Institut National de la Recherche Agronomique, FranceReviewed by:
Michelle Martinez-Montemayor, Universidad Central del Caribe, Puerto RicoChristian Maltecca, North Carolina State University, USA
Copyright: © 2012 Bishop, Doeschl-Wilson and Woolliams. This is an open-access article distributed under the terms of the Creative Commons Attribution Non Commercial License, which permits non-commercial use, distribution, and reproduction in other forums, provided the original authors and source are credited.
*Correspondence: Stephen C. Bishop, The Roslin Institute and Royal (Dick) School of Veterinary Studies, University of Edinburgh, Midlothian, Edinburgh EH25 9RG, UK. e-mail: stephen.bishop@roslin.ed.ac.uk