
- Auckland Cancer Society Research Centre, Faculty of Medical and Health Sciences, The University of Auckland, Auckland, New Zealand
The epithelial–mesenchymal transition (EMT) describes a reversible switch from an epithelial-like to a mesenchymal-like phenotype. It is essential for the development of the normal epithelium and also contributes to the invasive properties of carcinomas. At the molecular level, the EMT transition is characterized by a series of coordinated changes including downregulation of the junctional protein E-cadherin (CDH1), up-regulation of transcriptional repressors of E-cadherin such as Snail (SNAI1) and Slug (SNAI2), and up-regulation of N-cadherin. We wished to determine whether cultured normal melanocytes and melanoma cell lines, which are derived from the neural crest, showed signs of a similarly coordinated phenotypic switch. We investigated normal melanocytes and 25 cell lines derived from New Zealand patients with metastatic melanoma. Most lines had been previously genotyped for common mutations such as BRAF, NRAS, PIK3CA (phosphatidylinositol-3-kinase), TP53 (p53), and CDKN2A (p16). Expression of E-cadherin, N-cadherin, microphthalmia-associated transcription factor (MITF), Snail, Slug, Axl, p53, and Hdm2 was compared by western blotting. Normal melanocytes expressed each of these proteins except for Snail, while normal melanocytes and almost every melanoma line expressed Slug. Expression of individual markers among different melanoma lines varied from high to low or undetectable. Quantitation of western blots showed that expression of MITF-M, the melanocyte-specific isoform of MITF, was positively related to that of E-cadherin but inversely related to that of N-cadherin and Axl. There was also no apparent relationship between expression of any particular marker and the presence of BRAF, NRAS, PIK3CA, TP53, or CDKN2A mutations. The results suggest that melanomas do not show the classical epithelial and mesenchymal phenotypes but rather display either high E-cadherin/high MITF-M expression on one hand, or high N-cadherin/high Axl expression on the other. These may correspond to differentiated and invasive phenotypes in vivo.
Introduction
The epithelial–mesenchymal transition (EMT) describes a reversible phenotypic change in epithelial cells that is essential for embryogenesis and wound healing in normal tissues. It is characterized by the loss of functional E-cadherin containing junctions and loss of cell polarity, and is particularly associated with the expression of zinc-finger transcription factors Snail (SNAI1) and Slug (SNAI2), as well as of ZEB1 (zinc-finger E-box-binding homeobox 1), ZEB2, FoxC2 (forkhead box protein C2), and TWIST (Lim and Thiery, 2012). Expression of the intermediate filament protein vimentin appears to be upregulated by Slug in cells undergoing EMT; vimentin then up-regulates the Axl tyrosine kinase, which contributes to changes in cytoskeletal architecture and migratory potential (Ivaska, 2011). These changes in adhesion proteins cause cells to change to a morphology resembling that of mesenchymal cells and to a functional change toward migration, invasion, and resistance to apoptosis. Evidence for EMT has also been found in carcinomas, leading to the proposal that it is involved in both invasion and metastasis (Lim and Thiery, 2012).
Melanocytes differ from epithelial cells in having their origin in the neural crest, a collection of multipotent and migratory cells in the vertebrate embryo that is also important for the development of cartilage, bone, neurons, glia, and smooth muscle. Although the term EMT arose from studies in epithelial tissues, it has been applied to a variety of developmental tissues including migratory neural crest cells that are the precursors of melanocytes. Slug appears to be essential for precursor migration and melanocyte development in mammals; Slug knockout mice exhibit some features of the Waardenburg syndrome in humans, which is associated with hypopigmentation and hearing loss (Shirley et al., 2012), while loss of one Slug allele in humans is associated with piebaldism (Sanchez-Martin et al., 2003). Expression of Slug is closely related to that of microphthalmia-associated transcription factor (MITF; Sanchez-Martin et al., 2002), which in turn is essential for expression of proteins mediating the production of melanin by mature melanocytes. Such cells also express E-cadherin, presumably allowing both functional interaction with E-cadherin expressed on keratinocytes (Kuphal and Bosserhoff, 2012) and transfer of melanosomes.
Melanoma cells differ from melanocytes by acquiring invasive and/or metastatic properties, depending on the state of the melanoma (Orgaz and Sanz-Moreno, 2013). It has been suggested that the invasive and metastatic potential of melanoma cells reflects their ability to undergo EMT-like reversible phenotypic changes (Shirley et al., 2012). Histological studies of melanoma show frequent expression of Slug, E-cadherin, and MITF but also considerable heterogeneity of expression of these proteins among individual cells from the same specimen (Shirley et al., 2012). The aim of this study was to assess the degree of coordinated expression of EMT-associated markers in a series of low passage human melanoma cell lines, comparing expression with that of cultured normal melanocytes. We utilized a series of melanoma lines that were originally derived from New Zealand patients with metastatic melanoma to assess responses to radiotherapy and chemotherapy (Marshall et al., 1992, 1994; Kim et al., 2012). Many of these cell lines have been characterized for genetic mutations in BRAF, NRAS, PIK3CA (phosphatidylinositol-3-kinase), TP53 (p53), and CDKN2A (p16) genes (Parmar et al., 2000; Charters et al., 2011). In this study, we have grown 25 of these melanoma cell lines, characterized their expression of E-cadherin, N-cadherin, Snail, Slug, Axl, p53, Hdm2, and MITF, examining the relationship between protein expression and common genetic aberrations.
Materials and Methods
Culture of Melanoma Cells and Melanocytes
The 25 New Zealand melanoma (NZM) cell lines were generated from surgical samples of metastatic melanoma as previously described (Marshall et al., 1994; Kim et al., 2012). Written consent was obtained from all patients under Auckland Area Health Board Ethics Committee guidelines. NZM cell lines were grown under low oxygen conditions (5% O2) in order to mimic physiologically low oxygen levels in tumors. NZM lines were grown in α-modified minimal essential medium (αMEM; Invitrogen, USA) supplemented with insulin (5 μg/mL), transferrin (5 μg/mL), and sodium selenite (5 ng/mL; Roche Applied Sciences, Germany), 100 U/mL of penicillin, 100 μg/mL of streptomycin (PS), and 5% fetal bovine serum (FBS). Human primary melanocytes were purchased from Invitrogen and grown in light sensitive Medium 254 supplemented with human melanocyte growth supplement (HMGS-2; Invitrogen) and PS. Human melanocytes were cultured in an atmosphere of 5% CO2 in air at 37°C. Genetic analyses of BRAF, NRAS, TP53, CDKN2A, and PIK3CA in NZM cell lines were carried out. Selected melanoma cell lines were sequenced for mutations in BRAF, NRAS, and PIK3CA as previously described (Kim et al., 2012). Sequencing for mutations in the TP53 and CDKN2A genes has been previously described (Parmar et al., 2000; Charters et al., 2011).
Western Blotting
After NZM cells were grown to about 80% confluence, they were washed in ice-cold phosphate buffered saline (PBS), lysed in radioimmunoprecipitation assay buffer and prepared for western blotting as previously described (Kim et al., 2009). Antibodies used were specific for the following epitopes: E-cadherin, N-Cadherin, Snail, Slug, and Axl were from Cell Signaling Technology; MITF was from Abcam; and p53, HDM2, and β-actin were from Santa Cruz. Western blots were quantified using Image J software and expressed as a ratio to β-actin.
Statistical Analysis
Spearman’s rank correlation coefficient (rs) and statistical significance (p) were calculated using standard methods (SPSS). Values of p < 0.05 were considered to be statistically significant. Correlation plots were also fitted with best-fit hyperbolae.
Results
Expression of E-Cadherin, N-Cadherin, Snail, and Slug
Since EMT is normally associated with loss of E-cadherin expression and gain of N-cadherin, we first measured cadherin expression. Normal melanocytes expressed both proteins and about half of the lines (NZM11, NZM85, NZM86, NZM9, NZM17, NZM26, NZM40, NZM50, NZM59, NZM4, and NZM82) showed moderate to strong N-cadherin expression but no E-cadherin expression. The other lines all expressed E-cadherin except for NZM22, which expressed neither (Figure 1A). When we quantified the western blots and normalized it to β-actin expression (Figure 1B), we observed an inverse correlation between E-cadherin and N-cadherin expression (Figure 2A). Quantification and statistical analysis showed a significant negative correlation between E-cadherin and N-cadherin expression (rs = -0.578; p = 0.002). Slug, the putative transcriptional repressor for E-cadherin, was expressed in normal melanocytes as well as in all lines with the exception of NZM17. The relative expression of E-cadherin and Snail suggested an inverse correlation (Figure 1A). However, quantification (Figure 2B) showed this to be not statistically significant (rs = –0.272; p = 0.18). We also tested whether expression of these markers was associated with any of the mutations shown in Table 1, but no clear relationship was found.
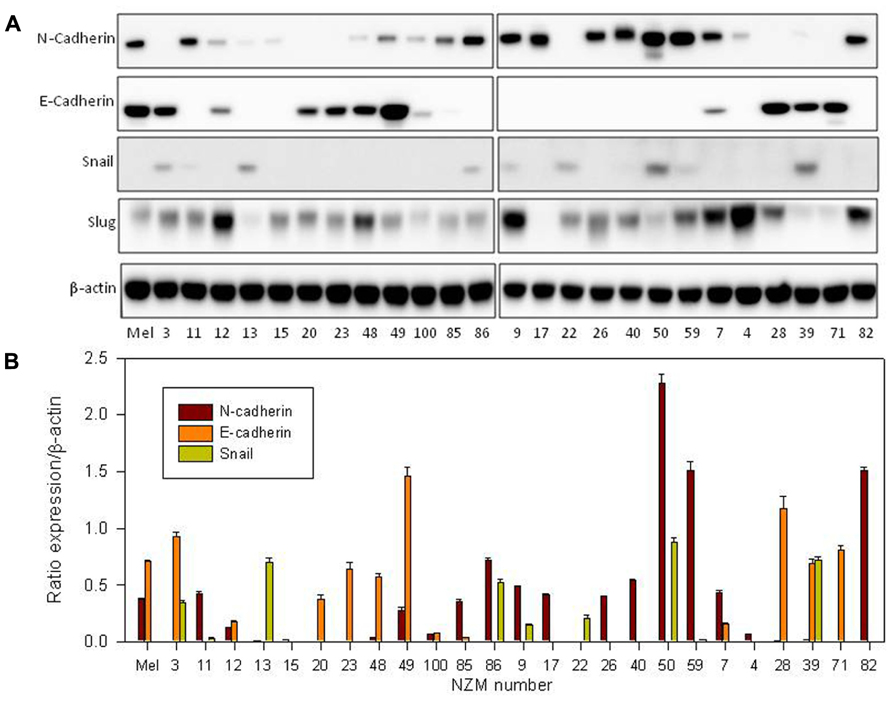
FIGURE 1. (A) Western blots of whole-cell extracts derived from cultures of normal melanocytes and of a number of melanoma lines, indicating expression of N-cadherin, E-cadherin, Snail, and Slug. The numbers indicate the identities of members of the New Zealand melanoma collection (e.g., 3 = NZM3); Mel indicates data for normal melanocytes. The western blot shown is representative of three independent repeats. (B) Western blot quantification of E-cadherin, N-cadherin, and Snail as ratios to β-actin loading controls. Bars show SEM.
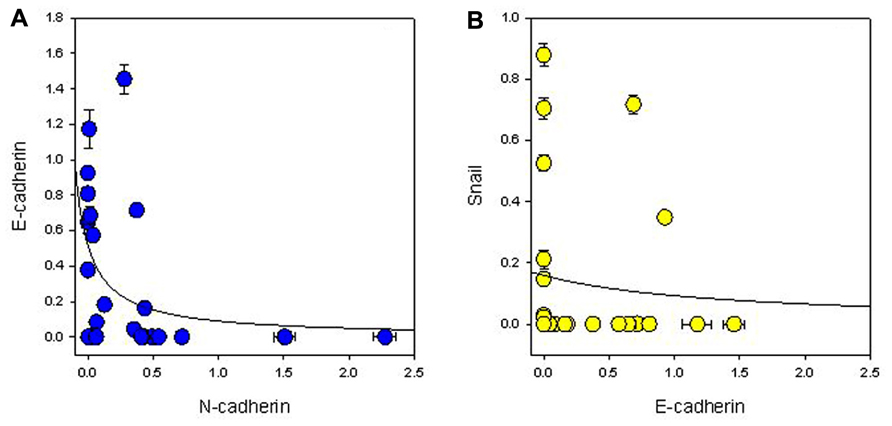
FIGURE 2. Relationship between expression of (A) N-cadherin and E-cadherin, and (B) E-cadherin and Snail normalized to β-actin expression. The lines indicate best-fit hyperbolae.
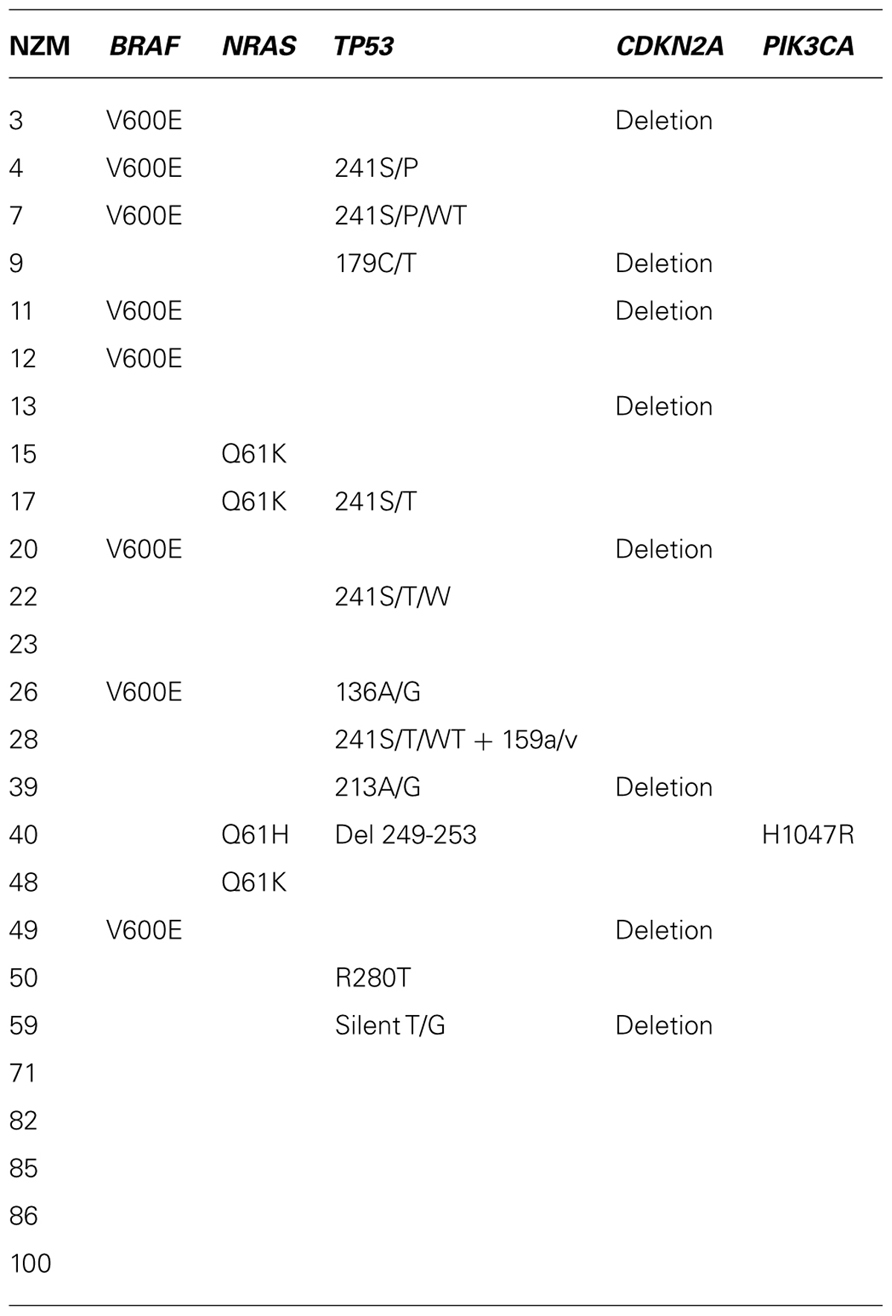
TABLE 1. Genetic status of the melanoma lines used in this study.
Expression of Axl, MITF, p53, and Hdm2
It has been previously reported that EMT is associated with increased Axl expression (Gjerdrum et al., 2010) and reduced MITF expression (Sensi et al., 2011). We measured Axl expression and found it only in a proportion of cell lines (Figure 3A). Although it appeared from western blots that Axl expression was inversely correlated to E-cadherin expression, quantitation failed to show significance (rs = -0.108). MITF has several isoforms (Yasumoto et al., 1998), and the A and M isoforms are expressed in the melanocyte lineage (Goding, 2000) with the M isoform having differentially spliced variants (Hodgkinson et al., 1993; Steingrimsson et al., 1994; Selzer et al., 2002). Both MITF-A and MITF-M were found in the cell lines (Figure 3), with the MITF-M isoform appearing as two differentially spliced variants. We quantified blots for MITF isoforms (Figure 3B) and observed a statistically significant inverse relationship (p = 0.006) between MITF-M expression and Axl expression (Figure 4A). Several cell lines (NZM49, NZM22, and NZM7), as well as melanocytes, expressed both Axl and MITF. Interestingly, NZM49 and NZM22, which express both MITF and Axl, expressed more MITF-A than other cell lines. Furthermore, there was a significant negative correlation between MITF-M and N-cadherin expression (rs = –0.562; p = 0.007; Figure 4B) and a significant positive correlation between MITF-M expression and E-cadherin (rs = 0.514; p = 0.007; not shown). Since it has been reported that loss of p53 expression is associated with EMT (Gadea et al., 2007), we also measured expression of p53 and of Hdm2, a protein closely associated with p53 degradation (Araki et al., 2010). However, there was no obvious relationship between expression of either p53 or Hdm2 and that of other EMT markers (Figure 3A). As MITF has been noted to be one of the key molecular switches that determine switching of different cell progeny (Cheli et al., 2011), we also stained for MITF to observe expression in individual cells within the same cell line. Interestingly, in NZM86 and NZM40 (two cell lines that express very low MITF as determined by western blotting) we observed individual cells that expressed detectable levels of MITF (Figure 5) scattered amongst low MITF expressing cells.

FIGURE 3. (A) Western blots of extracts from cultures of normal melanocytes and of a number melanoma lines, indicating expression of MITF-M (bottom two bands), MITF-A (top band), Axl, p53, and Hdm2. The numbers indicate the identities of members of the New Zealand melanoma collection; Mel indicates data for normal melanocytes. The western blot shown is representative of three independent repeats. (B) Western blot quantification of MITF-M and Axl as ratios to β-actin loading controls. Bars show SEM.
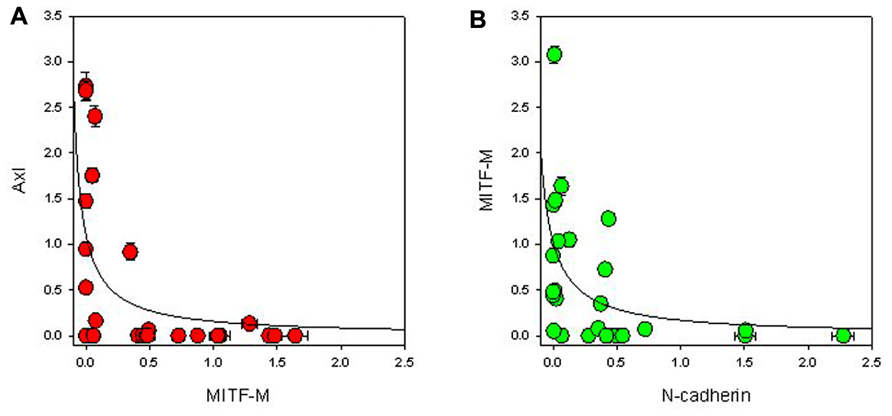
FIGURE 4. Relationship between expression of (A) MITF-M and Axl, and (B) MITF-M and N-cadherin normalized to β-actin expression. The lines indicate best-fit hyperbolae.
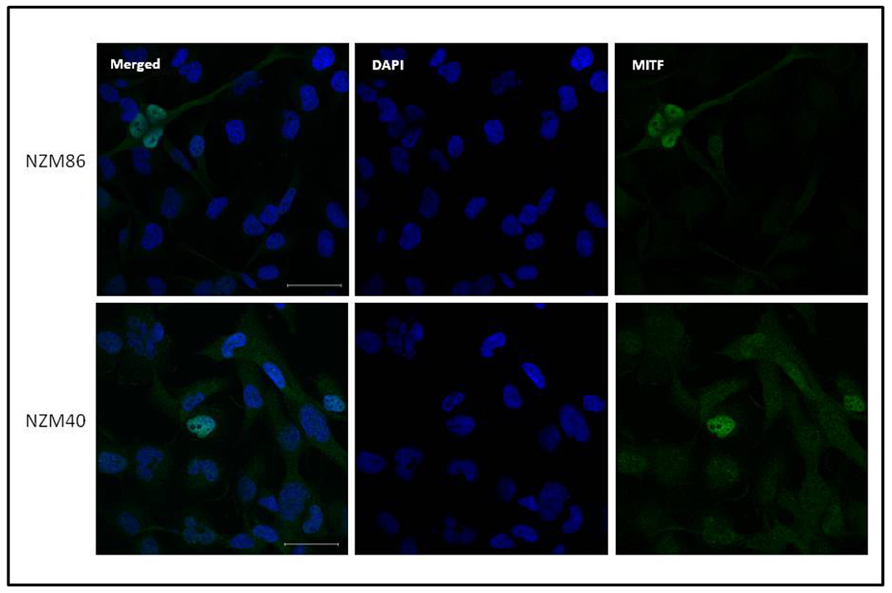
FIGURE 5. Immunofluorescent images of NZM40 and NZM86 stained for MITF (green) and for DNA (diaminophenylindole: blue). Scale bars on the merged image indicate 50 μm.
Discussion
The analysis of this series of early passage human melanoma lines has shown them to be highly heterogeneous not only with respect to expression of proteins directly associated with EMT such as E-cadherin, Snail, Slug, and Axl (Figure 1) but also with respect to expression of proteins that are more indirectly associated with EMT, such as MITF and p53 (Figure 3). Melanoma lines (with one exception) and normal melanocytes, expressed Slug. Other markers are generally strongly expressed in some lines but not others. Among the melanoma lines, we found that expression of MITF-M, the melanocyte-specific isoform of MITF, was positively related to that of E-cadherin but inversely related to that of N-cadherin and Axl (Figures 4A,B). A possible interpretation of the results is that melanoma lines show mesenchymal properties overall, but that individual lines vary between a high E-cadherin/high MITF-M expression and a high N-cadherin/high Axl expression phenotype. Cultured normal melanocytes show an intermediate phenotype, expressing all markers.
The results agree with an earlier study reporting that Axl-positive melanoma cells do not express MITF (Sensi et al., 2011). They also support a previous study that used a series of NZM melanoma cell lines to identify a gene expression signature that distinguished two phenotypes differing in their in vitro invasive potential (Jeffs et al., 2009). Although the cell lines used in that study overlap only partially with the lines used in the present study it is evident that the six lines with the “non-invasive” signature (NZM3, NZM4, NZM7, NZM12, NZM15, and NZM20) expressed MITF but little or no Axl while four with the “invasive” signature (NZM9, NZM11, NZM22, and NZM40) expressed no MITF but often expressed Axl (Figure 3).
One of the important questions posed in this study is whether the pattern of expression of proteins in the EMT pathway is related to genetic mutation. A detailed analysis of the mutational status of the melanoma lines will be reported elsewhere in this issue (Stones et al., 2013) but with the available data shown in Table 1, we have been unable to detect any significant relationship between expression of proteins shown in Figures 1 and 3 and the mutational status of BRAF, NRAS, TP53, CDKN2A, or PIK3CA. These results echo those obtained from a study on the utilization of enzymes in the PI3K–PKB (phosphoinositide 3-kinase–protein kinase B), MEK–ERK (mitogen-activated protein kinase kinase–extracellular signal-regulated kinase), and mTOR–p70S6K (mammalian target of rapamycin–p70 ribosomal S6 kinase) signaling pathways. As determined by phosphorylation of signaling components, phosphorylation varied widely across a series of cell lines but did not directly reflect the PIK3CA, PTEN, NRAS, or BRAF mutational status of genes of these lines (Kim et al., 2012). A feature of the results is that individual melanoma lines vary enormously in their expression of particular proteins. This extends a previous study showing a large amount of heterogeneity in expression of MITF and the melanocyte lineage proteins PAX3 across a series of NZM lines, with cellular protein levels varying by 15-fold and more than 100-fold, respectively (He et al., 2011). Phenotypic switching has previously been suggested to explain differences in transcription signatures that correspond to different cellular phenotypes (Hoek et al., 2008; Hoek and Goding, 2010) and could account for the differences in protein expression.
Recently, MITF has been suggested to be crucial in determining whether melanoma cells proliferate (melanoma initiating cells) or change to accommodate a more invasive phenotype (Carreira et al., 2006; Hoek and Goding, 2010; Cheli et al., 2011); this has formed the basis for the hypothesis discussed separately in this issue (Eccles et al., unpublished). The mechanistic basis of such switching has not yet been elucidated but the concept is consistent with evidence that melanomas cells do not have a defined hierarchical organization with stem cells at one end and differentiated cells at the other (Quintana et al., 2008). Rather, each cell in a population may have a certain probability of switching to or from a phenotype with stem cell characteristics. There are speculations as to what could induce or decrease MITF activity (Strub et al., 2011) and determine the invasiveness or the stemness of the melanoma cells in response to hypoxia (Cheli et al., 2012) or to other factors in the tumor microenvironment (Li et al., 2003). One interesting observation is that even though NZM40 and NZM86 show low MITF expression by western blotting, we clearly see by microscopy that some cells highly express MITF (Figure 5), which is evidence of a heterogeneous population of cells (Quintana et al., 2010).
Histological studies on in vivo human melanoma tissue have shown considerable heterogeneity by individual cells in expression of markers associated with EMT (Shirley et al., 2012) and this is consistent with the in vitro histological data shown in Figure 5. It is possible that melanoma tissue in vivo shows even greater phenotypic diversity than the derived cell lines. Thus, as shown diagrammatically in Figure 6, the in vivo, population develops, by phenotypic switching, a diverse population with individual cells exhibiting a high E-cadherin/high MITF-M expression on one hand or a high N-cadherin/high Axl expression on the other. Melanomas in vivo generally have cell cycle times of approximately 1 week, while derived cell lines have cell cycle times of 1–2 days (Baguley, 2011). Development of cell lines thus exerts a strong selective pressure for outgrowth of more rapidly cycling cells and may tend to select one of these phenotypes. Thus, melanoma tissue may be characterized as a mixture of phenotypes, some expressing high MITF-M and E-cadherin with more differentiated non-invasive behavior, and others expressing high N-cadherin, Slug, and Axl and with a more invasive behavior.
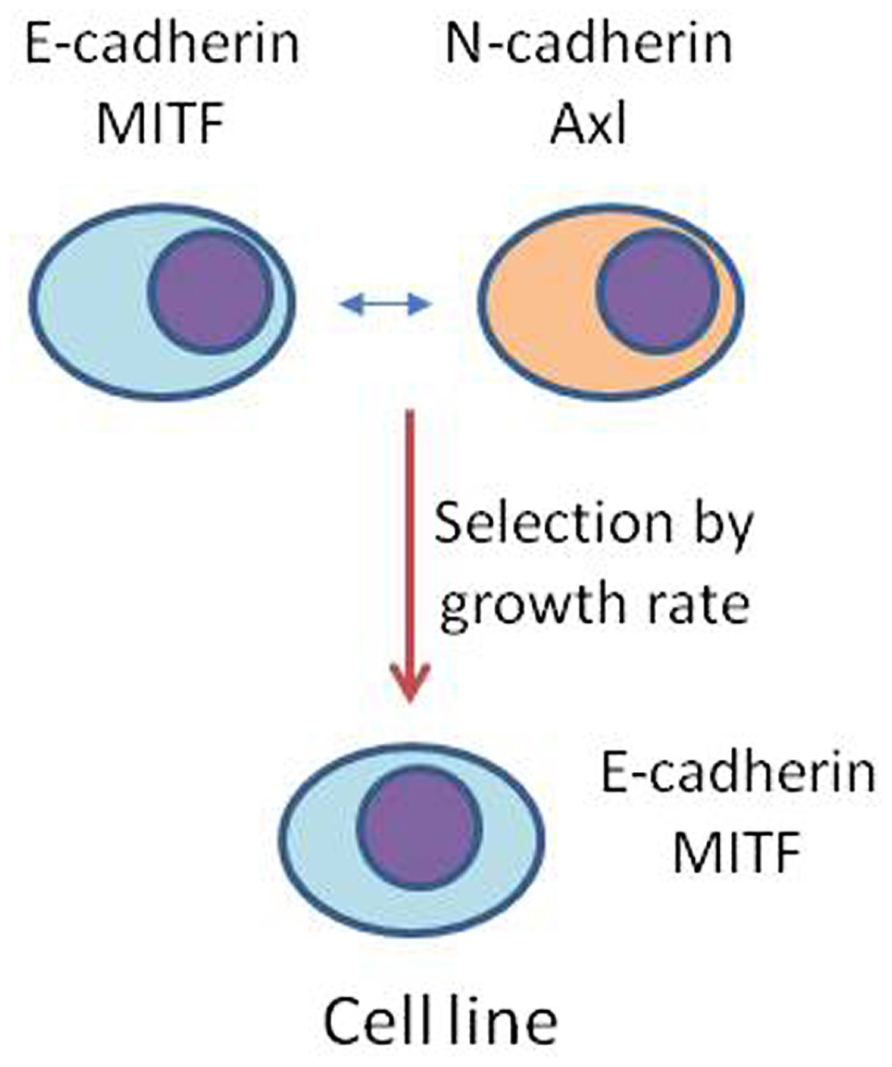
FIGURE 6. Possible model for the generation of melanoma cell lines. Phenotypic switching in vivo generates a highly heterogeneous population of cells that vary in expression of proteins such as E-cadherin, N-cadherin, Axl, and M-MITF. Derivation of a cell line, by selecting for rapid proliferation, may select for an individual phenotype.
Conflict of Interest Statement
The authors declare that the research was conducted in the absence of any commercial or financial relationships that could be construed as a potential conflict of interest.
Acknowledgments
This work was supported by a Faculty of Medical and Health Sciences Research Development Fund and by the Auckland Cancer Society. Imaging was carried out in the Biomedical Imaging Research Unit, University of Auckland.
References
Araki, S., Eitel, J. A., Batuello, C. N., Bijangi-Vishehsaraei, K., Xie, X. J., Danielpour, D., et al. (2010). TGF-beta1-induced expression of human Mdm2 correlates with late-stage metastatic breast cancer. J. Clin. Invest. 120, 290–302. doi: 10.1172/JCI39194
Baguley, B. C. (2011). The paradox of cancer cell apoptosis. Front. Biosci. 16, 1759–1767. doi: 10.2741/3819
Carreira, S., Goodall, J., Denat, L., Rodriguez, M., Nuciforo, P., Hoek, K. S., et al. (2006). Mitf regulation of Dia1 controls melanoma proliferation and invasiveness. Genes Dev. 20, 3426–3439. doi: 10.1101/gad.406406
Charters, G. A., Stones, C. J., Shelling, A. N., Baguley, B. C., and Finlay, G. J. (2011). Centrosomal dysregulation in human metastatic melanoma cell lines. Cancer Genet. 204, 477–485. doi: 10.1016/j.cancergen.2011.07.001
Cheli, Y., Giuliano, S., Botton, T., Rocchi, S., Hofman, V., Hofman, P., et al. (2011). Mitf is the key molecular switch between mouse or human melanoma initiating cells and their differentiated progeny. Oncogene 30, 2307–2318. doi: 10.1038/onc.2010.598
Cheli, Y., Giuliano, S., Fenouille, N., Allegra, M., Hofman, V., Hofman, P., et al. (2012). Hypoxia and MITF control metastatic behaviour in mouse and human melanoma cells. Oncogene 31, 2461–2470. doi: 10.1038/onc.2011.425
Gadea, G., de Toledo, M., Anguille, C., and Roux, P. (2007). Loss of p53 promotes RhoA-ROCK-dependent cell migration and invasion in 3D matrices. J. Cell Biol. 178, 23–30. doi: 10.1083/jcb.200701120
Gjerdrum, C., Tiron, C., Hoiby, T., Stefansson, I., Haugen, H., Sandal, T., et al. (2010). Axl is an essential epithelial-to-mesenchymal transition-induced regulator of breast cancer metastasis and patient survival. Proc. Natl. Acad. Sci. U.S.A. 107, 1124–1129. doi: 10.1073/pnas.0909333107
Goding, C. R. (2000). Mitf from neural crest to melanoma: signal transduction and transcription in the melanocyte lineage. Genes Dev. 14, 1712–1728. doi: 10.1101/gad.14.14.1712
He, S., Li, C. G., Slobbe, L., Glover, A., Marshall, E., Baguley, B. C., et al. (2011). PAX3 knockdown in metastatic melanoma cell lines does not reduce MITF expression. Melanoma Res. 21, 24–34. doi: 10.1097/CMR.0b013e328341c7e0
Hodgkinson, C. A., Moore, K. J., Nakayama, A., Steingrimsson, E., Copeland, N. G., Jenkins, N. A., et al. (1993). Mutations at the mouse microphthalmia locus are associated with defects in a gene encoding a novel basic-helix-loop-helix-zipper protein. Cell 74, 395–404. doi: 10.1016/0092-8674(93)90429-T
Hoek, K. S., Eichhoff, O. M., Schlegel, N. C., Dobbeling, U., Kobert, N., Schaerer, L., et al. (2008). In vivo switching of human melanoma cells between proliferative and invasive states. Cancer Res. 68, 650–656. doi: 10.1158/0008-5472.CAN-07-2491
Hoek, K. S., and Goding, C. R. (2010). Cancer stem cells versus phenotype-switching in melanoma. Pigment Cell Melanoma Res. 23, 746–759. doi: 10.1111/j.1755-148X.2010.00757.x
Ivaska, J. (2011). Vimentin: central hub in EMT induction?. Small GTPases 2, 51–53. doi: 10.4161/sgtp.2.1.15114
Jeffs, A. R., Glover, A. C., Slobbe, L. J., Wang, L., He, S., Hazlett, J. A., et al. (2009). A gene expression signature of invasive potential in metastatic melanoma cells. PLoS ONE 4:e8461. doi: 10.1371/journal.pone.0008461
Kim, J. E., Shepherd, P. R., and Chaussade, C. (2009). Investigating the role of class-IA PI 3-kinase isoforms in adipocyte differentiation. Biochem. Biophys. Res. Commun. 379, 830–834. doi: 10.1016/j.bbrc.2008.12.089
Kim, J. E., Stones, C., Joseph, W. R., Leung, E., Finlay, G. J., Shelling, A. N., et al. (2012). Comparison of growth factor signalling pathway utilisation in cultured normal melanocytes and melanoma cell lines. BMC Cancer 12:141. doi: 10.1186/1471-2407-12-141
Kuphal, S., and Bosserhoff, A. K. (2012). E-cadherin cell–cell communication in melanogenesis and during development of malignant melanoma. Arch. Biochem. Biophys. 524, 43–47. doi: 10.1016/j.abb.2011.10.020
Li, G., Satyamoorthy, K., Meier, F., Berking, C., Bogenrieder, T., and Herlyn, M. (2003). Function and regulation of melanoma–stromal fibroblast interactions: when seeds meet soil. Oncogene 22, 3162–3171. doi: 10.1038/sj.onc.1206455
Lim, J., and Thiery, J. P. (2012). Epithelial–mesenchymal transitions: insights from development. Development 139, 3471–3486. doi: 10.1242/dev.071209
Marshall, E. S., Finlay, G. J., Matthews, J. H., Shaw, J. H., Nixon, J., and Baguley, B. C. (1992). Microculture-based chemosensitivity testing: a feasibility study comparing freshly explanted human melanoma cells with human melanoma cell lines. J. Natl. Cancer Inst. 84, 340–345. doi: 10.1093/jnci/84.5.340
Marshall, E. S., Matthews, J. H. L., Shaw, J. H. F., Nixon, J., Tumewu, P., Finlay, G. J., et al. (1994). Radiosensitivity of new and established human melanoma cell lines: comparison of 3H-thymidine incorporation and soft agar clonogenic assays. Eur. J. Cancer 30A, 1370–1376. doi: 10.1016/0959-8049(94)90188-0
Orgaz, J. L., and Sanz-Moreno, V. (2013). Emerging molecular targets in melanoma invasion and metastasis. Pigment Cell Melanoma Res. 26, 39–57. doi: 10.1111/pcmr.12041
Parmar, J., Marshall, E. S., Charters, G. A., Holdaway, K. M., Shelling, A. N., and Baguley, B. C. (2000). Radiation-induced cell cycle delays and p53 status of early passage melanoma cell lines. Oncol. Res. 12, 149–155.
Quintana, E., Shackleton, M., Foster, H. R., Fullen, D. R., Sabel, M. S., Johnson, T. M., et al. (2010). Phenotypic heterogeneity among tumorigenic melanoma cells from patients that is reversible and not hierarchically organized. Cancer Cell 18, 510–523. doi: 10.1016/j.ccr.2010.10.012
Quintana, E., Shackleton, M., Sabel, M. S., Fullen, D. R., Johnson, T. M., and Morrison, S. J. A. (2008). Efficient tumour formation by single human melanoma cells. Nature 456, 593–598. doi: 10.1038/nature07567
Sanchez-Martin, M., Perez-Losada, J., Rodriguez-Garcia, A., Gonzalez-Sanchez, B., Korf, B. R., Kuster, W., et al. (2003). Deletion of the SLUG (SNAI2) gene results in human piebaldism. Am. J. Med. Genet. 122A, 125–132. doi: 10.1002/ajmg.a.20345
Sanchez-Martin, M., Rodriguez-Garcia, A., Perez-Losada, J., Sagrera, A., Read, A. P., and Sanchez-Garcia, I. (2002). SLUG (SNAI2) deletions in patients with Waardenburg disease. Hum. Mol. Genet. 11, 3231–3236. doi: 10.1093/hmg/11.25.3231
Selzer, E., Wacheck, V., Lucas, T., Heere-Ress, E., Wu, M., Weilbaecher, K. N., et al. (2002). The melanocyte-specific isoform of the microphthalmia transcription factor affects the phenotype of human melanoma. Cancer Res. 62, 2098–2103.
Sensi, M., Catani, M., Castellano, G., Nicolini, G., Alciato, F., Tragni, G., et al. (2011). Human cutaneous melanomas lacking MITF and melanocyte differentiation antigens express a functional Axl receptor kinase. J. Invest. Dermatol. 131, 2448–2457. doi: 10.1038/jid.2011.218
Shirley, S. H., Greene, V. R., Duncan, L. M., Torres Cabala, C. A., Grimm, E. A., and Kusewitt, D. F. (2012). Slug expression during melanoma progression. Am. J. Pathol. 180, 2479–2489. doi: 10.1016/j.ajpath.2012.02.014
Steingrimsson, E., Moore, K. J., Lamoreux, M. L., Ferré-D’Amaré, A. R., Burley, S. K., Zimring, D. C., et al. (1994). Molecular basis of mouse microphthalmia (mi) mutations helps explain their developmental and phenotypic consequences. Nat. Genet. 8, 256–263. doi: 10.1038/ng1194-256
Stones, C. S., Kim, J. E., Leung, E., Marshall, E. S., Joseph, W. R., Finlay, G. J., et al. (2013). Comparison of responses of melanoma cell lines to the MEK inhibitor CI-1040 and the BRAF inhibitor vemurafenib. Front. Genet. 4:66. doi: 10.3389/fgene.2013.00066
Strub, T., Giuliano, S., Ye, T., Bonet, C., Keime, C., Kobi, D., et al. (2011). Essential role of microphthalmia transcription factor for DNA replication, mitosis and genomic stability in melanoma. Oncogene 30, 2319–2332. doi: 10.1038/onc.2010.612
Keywords: E-cadherin, Axl, MITF, melanocyte, melanoma
Citation: Kim JE, Leung E, Baguley BC and Finlay GJ (2013) Heterogeneity of expression of epithelial–mesenchymal transition markers in melanocytes and melanoma cell lines. Front. Genet. 4:97. doi: 10.3389/fgene.2013.00097
Received: 30 January 2013; Accepted: 14 May 2013;
Published online: 31 May 2013.
Edited by:
Mike Eccles, University of Otago, New ZealandReviewed by:
Benjamin Bonavida, University of California at Los Angeles, USADonna F. Kusewitt, MD Anderson Cancer Center, USA
Copyright: © 2013 Kim, Leung, Baguley and Finlay. This is an open-access article distributed under the terms of the Creative Commons Attribution License, which permits use, distribution and reproduction in other forums, provided the original authors and source are credited and subject to any copyright notices concerning any third-party graphics etc.
*Correspondence: Graeme J. Finlay, Auckland Cancer Society Research Centre, Faculty of Medical and Health Sciences, The University of Auckland, Private Bag 92019, Auckland 1142, New Zealand e-mail: g.finlay@auckland.ac.nz
†Present address: Ji Eun Kim, Cancer Science Institute of Singapore, National University of Singapore, Singapore 117599.