 Venkata Saroja Voruganti1,2*†
 Jack W. Kent Jr.1†
 Subrata Debnath3
 Shelley A. Cole1
 Karin Haack1Harald H. H. Göring1
 Melanie A. Carless1
 Joanne E. Curran1
 Matthew P. Johnson1
 Laura Almasy1Thomas D. Dyer1Jean W. MacCluer1
 Eric K. Moses1,4Hanna E. Abboud3Michael C. Mahaney1John Blangero1
 Anthony G. Comuzzie1
- 1Department of Genetics, Texas Biomedical Research Institute, San Antonio, TX, USA
- 2Department of Nutrition, Nutrition Research Institute, University of North Carolina at Chapel Hill, Kannapolis, NC, USA
- 3Division of Nephrology, Department of Medicine, University of Texas Health Science Center at San Antonio, San Antonio, TX, USA
- 4Centre for Genetic Origins of Health and Disease, University of Western Australia, Perth, WA, Australia
Increased serum uric acid (SUA) is a risk factor for gout and renal and cardiovascular disease (CVD). The purpose of this study was to identify genetic factors that affect the variation in SUA in 632 Mexican Americans participants of the San Antonio Family Heart Study (SAFHS). A genome-wide association (GWA) analysis was performed using the Illumina Human Hap 550K single nucleotide polymorphism (SNP) microarray. We used a linear regression-based association test under an additive model of allelic effect, while accounting for non-independence among family members via a kinship variance component. All analyses were performed in the software package SOLAR. SNPs rs6832439, rs13131257, and rs737267 in solute carrier protein 2 family, member 9 (SLC2A9) were associated with SUA at genome-wide significance (p < 1.3 × 10⁻⁷). The minor alleles of these SNPs had frequencies of 36.2, 36.2, and 38.2%, respectively, and were associated with decreasing SUA levels. All of these SNPs were located in introns 3–7 of SLC2A9, the location of the previously reported associations in European populations. When analyzed for association with cardiovascular-renal disease risk factors, conditional on SLC2A9 SNPs strongly associated with SUA, significant associations were found for SLC2A9 SNPs with BMI, body weight, and waist circumference (p < 1.4 × 10⁻³) and suggestive associations with albumin-creatinine ratio and total antioxidant status (TAS). The SLC2A9 gene encodes an urate transporter that has considerable influence on variation in SUA. In addition to the primary association locus, suggestive evidence (p < 1.9 × 10⁻⁶) for joint linkage/association (JLA) was found at a previously-reported urate quantitative trait locus (Logarithm of odds score = 3.6) on 3p26.3. In summary, our GWAS extends and confirms the association of SLC2A9 with SUA for the first time in a Mexican American cohort and also shows for the first time its association with cardiovascular-renal disease risk factors.
Introduction
Hyperuricemia is a risk factor for gout, renal disease, and cardiovascular disease (CVD) (Cirillo et al., 2006; Nakagawa et al., 2006) and is known to aggregate in families (Dixon, 1960; Friedlander et al., 1988; Cameron and Simmonds, 2005). Variation in serum uric acid (SUA) levels is controlled by both genetic and environmental factors. Family-based studies have reported significant heritabilities for SUA levels with estimates ranging from 25 to 73% (Rao et al., 1982; Rice et al., 1990; Wilk et al., 2000; Tang et al., 2003; Yang et al., 2005; Nath et al., 2007; Voruganti et al., 2009a,b).
Genome-wide studies conducted to identify significant linkages for the variation in SUA have found quantitative trait loci (QTL) on several chromosomes for different populations; a QTL on chromosome 15 in Framingham Heart Study (Yang et al., 2005); on chromosome 8 in the Genetic Epidemiology Network of Arteriopathy (GENOA) (Rule et al., 2009); on chromosome 4p15 in an Australian Cohort (Cummings et al., 2010). However, none of them were in the same location as found previously in this Mexican American Cohort (Voruganti et al., 2009a). Similarly, genome-wide association (GWA) and candidate gene studies have found several genes to be associated with SUA, mainly solute carrier protein 2 family, member 9 (SLC2A9) (Li et al., 2007; Brandstätter et al., 2008; Caulfield et al., 2008; Dehghan et al., 2008; Döring et al., 2008; McArdle et al., 2008; Stark et al., 2008; Vitart et al., 2008; Wallace et al., 2008; Kolz et al., 2009; Charles et al., 2011; Karns et al., 2012), ATP-binding cassette, subfamily G, member 2 (ABCG2) (Kolz et al., 2009; Woodward et al., 2009; Nakayama et al., 2011; Karns et al., 2012; Zhang et al., 2013); solute carrier protein 22 family, members 11 and 12 (SLC22A11, SLC22A12) (Kolz et al., 2009; Tin et al., 2011), solute carrier protein 16 family, member 9 (SLC16A9), PDZ domain containing 1(PDZK1) (Kolz et al., 2009). A large GWAS in another European cohort, Köttgen et al. (2013), confirmed or replicated 28 previously reported associations for SUA. However, most of these studies were conducted in Caucasian, African American, or Asian populations. To date no GWAS of SUA levels have been conducted in Mexican Americans—a population affected with disproportionate burden of CVD and type 2 diabetes (Flegal et al., 1991; Go, 2013; http://www.diabetes.org/diabetes-basics/diabetes-statistics/).
SUA is a strong marker of risk for renal disease and is considered clinically relevant and of high significance. Its role as a major risk factor in the development of kidney stones or nephrolithiasis and gout is well-recognized. The relationship between uric acid and kidney function seems to be two-sided. On one hand, decline in glomerular filtration rate (GFR) (kidney function parameter) may lead to elevation of uric acid, on the other hand, increase in uric acid seems to alter glomerular function through renal vasoconstriction and increased rennin expression (Sánchez-Lozada et al., 2002). Hyperuricemia is also known to induce endothelial dysfunction and inflammation indicating a role in atherosclerosis as well as chronic kidney disease (Ejaz et al., 2012). Rodent Sánchez-Lozada et al., 2002; Ejaz et al., 2012 and human studies (Nakagawa et al., 2005; Liebman et al., 2007) have shown the role of hyperuricemia in hypertension, atherosclerosis, CVD, initiation and progression of renal disease, and metabolic syndrome. In fact, drugs that decrease SUA levels, mainly allopurinol, have been shown to improve survival in chronic heart failure patients (Gotsman et al., 2012), improve endothelial function in patients with chronic kidney disease (Yelken et al., 2012), and reduce oxidative stress and improve endothelial function in patients with coronary artery disease (Rajendra et al., 2011). Elaborating on the protective effects of reduced SUA levels on end-stage renal disease (ESRD), Doria and Krolewski (2011) point out that lowering of SUA may be a potential approach to treat ESRD in patients with diabetes.
Here we present results of the first GWAS in Mexican Americans of the San Antonio Family Heart Study (SAFHS) that attempts to identify genetic factors that affect the variation in SUA. We extend these findings to the analysis of association of SLC2A9 with cardiovascular and renal factors given the role of SLC2A9 in hypertension and renal urate transport.
Materials and Methods
Population characteristics: The San Antonio Family Heart Study (SAFHS) was initiated in 1991 to identify genes influencing the risk of CVD in Mexican Americans. Study subjects have been recalled up to three times to acquire longitudinal data; the analysis reported here is based on the second recall, 2002–2006. Individuals were recruited from large Mexican American families, residing in San Antonio, TX without regard to disease status. Participants in this study were recruited from 40 extended families, with probands between 40 and 60 years of age (MacCluer et al., 1999; Mitchell et al., 1999). Eligibility criteria required the proband to have at least six first-degree relatives (excluding their parents) 16 years or older and who resided in San Antonio, TX. At each recruitment phase, subjects were brought to a research clinic at the University of Texas Health Science Center—San Antonio (UTHSCSA) for interview and examination by trained recruiters and nurses. Anthropometrics including height, weight, and waist circumference; blood pressure; and self-reported information regarding medical history and socio-demographic status were obtained in all phases of SAFHS data collection. Blood samples were collected from all participants after an overnight fast and plasma and serum were prepared and stored at −80°C until analyzed. Blood samples were also drawn at 2 h after a standard oral glucose tolerance test; diabetes was diagnosed if the 2 h glucose level was 11.1 mmol/l or higher, or if the subject had been prescribed antidiabetic medication. The final analysis sample with complete phenotype and genotype data included 632 SAFHS participants. Written informed consent was obtained from all participants to participate in this study. All research and consenting protocols were approved by the Institutional Review Board of the UTHSCSA.
Phenotyping
Uric acid was measured in serum by a colorimetric assay using uricase and peroxidase (Domagk and Schlicke, 1968). Serum creatinine was estimated by the modified kinetic Jaffe reaction (Beckman Synchron LX System). GFR was estimated by the MDRD equation: eGFR (ml/min/1.73 m2 body surface area) = 186 × serum creatinine × age × (−0.203) × (0.742 if female) × (1.210 if black) (Arar et al., 2008). Cardiovascular risk factors included blood pressure, weight, waist circumference as well as fasting plasma levels of glucose, insulin, lipids, and cytokines measured by standardized reference procedures (Arar et al., 2008; Voruganti et al., 2009a). A single-void morning urine sample was collected from each participant for measuring albumin and creatinine and estimating albumin to creatinine ratio (UACR). Description of their measurement techniques are given in Arar et al. (2008). Indicator variables were coded for diabetes diagnosis and for data from self-report and medical history on current use of blood pressure medication, alcohol consumption, and smoking. Covariates of SUA were included in analysis models as described below and in the Results.
Genome-Wide Association (GWA) Analysis
GWA analysis was conducted in the SAFHS based on SNP genotypes obtained using the Illumina HumanHap550 BeadChip (Illumina, San Diego, CA). Our experimental error rate (based on duplicates) was 2 per 100,000 genotypes. The average call rate per individual sample was 97%. Approximately 1 per 1000 genotypes was blanked due to Mendelian errors. Specific SNPs were removed from analysis if they had call rates <95% (about 4000 SNPs) or deviated from Hardy–Weinberg equilibrium at 5% false discovery rate (FDR) (12 SNPs). Missing genotypes were imputed from pedigree data using MERLIN (Abecasis et al., 2002). SNP genotypes were checked for Mendelian consistency using the program SimWalk2(Sobel and Lange, 1996). The estimates of the allele frequencies and their standard errors were obtained using SOLAR (Almasy and Blangero, 1998).
Measured Genotype Analysis
Each SNP genotype was converted in MERLIN (Abecasis et al., 2002) to a covariate measure equal to 0, 1, or 2 copies of the minor allele (or, for missing genotypes, the weighted covariate based on imputation). These covariates were included in the variance-components mixed models for measured genotype analyses (MGA; Boerwinkle et al., 1986) vs. null models that incorporated the random effect of kinship. For the initial GWA screen, SUA levels were regressed on selected covariates (see Results) and the association of the inverse-normalized residuals with each SNP covariate was tested independently as a 1 degree of freedom likelihood ratio test. Empirical thresholds for genome-wide significant and suggestive evidence of association were based on the distribution of p-values from 10,000 simulated null GWAS (i.e., simulations of a heritable trait with no modeled SNP covariate effects using the SAFHS pedigree and genotypes). The threshold for significance (p < 1.3 × 10⁻⁷) was defined as the cutoff for the lower 5% tails of the empirical distribution, and the threshold for suggestive evidence (p < 1.6 × 10⁻⁶) was the minimum p-value obtained not more than once per genome scan.
Linkage and Joint Linkage/Association Analysis
Multipoint linkage analysis (Almasy and Blangero, 1998) was performed in SOLAR using estimates of locus-specific allele sharing based on genotypes for 461 STR markers. In addition, we employed a novel joint linkage/association (JLA) analysis for each SNP that tested each saturated model (including linkage and the fixed effect of the SNP) against a null model in which both effects were constrained to zero. Regression parameters for selected covariates (see Results) were estimated simultaneously with the linkage and association parameters. Because the linkage variance parameter was tested on its lower boundary, the distribution of the likelihood ratio test statistic is distributed as a 1:1 mixture of chi-square distributions with 1 and 2 degrees of freedom, respectively (Self and Liang, 1987).
Analysis of Cardiovascular and Renal Disease Risk Factors for Association with SLC2A9 SNPs
Cardiovascular and renal disease risk factors that were included in the analysis were anthropometric measures such as body weight, BMI, waist circumference, circulating levels of lipids such as triglycerides, high, low-density lipoprotein and total cholesterol, glucose, insulin, and kidney function phenotypes (serum creatinine, eGFR, and UACR). For these analyses, the appropriate significance level was determined to be 1.4 × 10⁻³ based on the number of SNPs investigated in SLC2A9. This significance value was computed taking into account the linkage disequilibrium (LD) pattern of these SNPs (Figure 1).
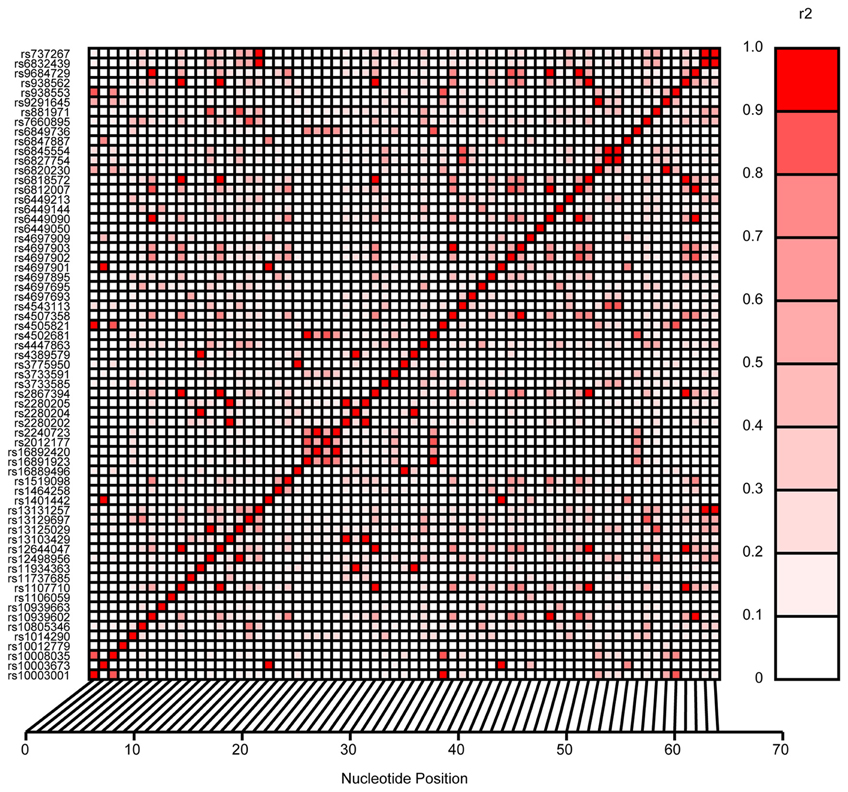
Figure 1. Linkage disequilibrium pattern of SLC2A9 SNPs investigated in this study.
Results
The mean ± SE age and SUA levels of participating individuals (n = 632) were 47.87 ± 14.8 yrs and 5.35 ± 1.38 mg/dl, respectively, with men having higher levels of SUA than women (6.1 ± 1.7 vs. 4.94 ± 1.6 mg/dl). Significant heritability was detected for SUA levels (h2 = 0.39, p = 2.3 × 10⁻⁸) with age, sex, age2, interaction between age and sex, waist circumference, systolic blood pressure, plasma triglyceride, plasma high-density lipoprotein, serum creatinine, and indicator variables for use of blood pressure medication, alcohol use, smoking status, and diabetic status as covariates.
Genome-Wide Linkage/Association Analysis
Association and JLA tests were performed using a custom script for SOLAR (Almasy and Blangero, 1998) as described in methods. All models included the random kinship as well as fixed effects of SNPs. Prior to analysis, SUA levels were regressed on age, sex, age2, interaction between age and sex, waist circumference, systolic blood pressure, plasma triglyceride, plasma high-density lipoprotein, serum creatinine, blood pressure medication, alcohol intake, smoking status and diabetic status, and the residuals were inverse-normal transformed. The distribution of p-values from GWAS of SUA showed no evidence of inflation due to population stratification (Figure 2).
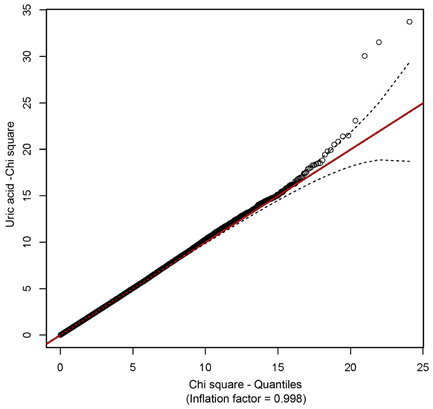
Figure 2. A Q-Q plot showing the absence of inflation due to population stratification.
SNPs rs6832439, rs13131257, and rs737267 in SLC2A9 were associated with SUA levels at genome-wide significance (p < 1.3 × 10⁻⁷) (Table 1, Figures 3, 4). The minor alleles of these SNPs had frequencies of 0.36, 0.36, and 0.38, respectively, and were associated with decreasing SUA levels. One additional SNP rs6449213 showed suggestive association (p < 1.6 × 10⁻⁶) with SUA levels. All these SNPs are located in introns 3–7 of SLC2A9. The allele frequencies of SNPs that had significant association with SUA are shown in Table 1. Minor alleles of the main four SNPs were associated with lower SUA levels (Table 2). We had previously reported significant evidence of linkage for SUA (LOD = 3.5) on chromosome 3p (Voruganti et al., 2009a). Using the JLA test, there was suggestive evidence of association of SUA with SNPs in CNTN4, a gene within the 1-LOD support interval of our peak linkage signal (Table 1, Figure 5).
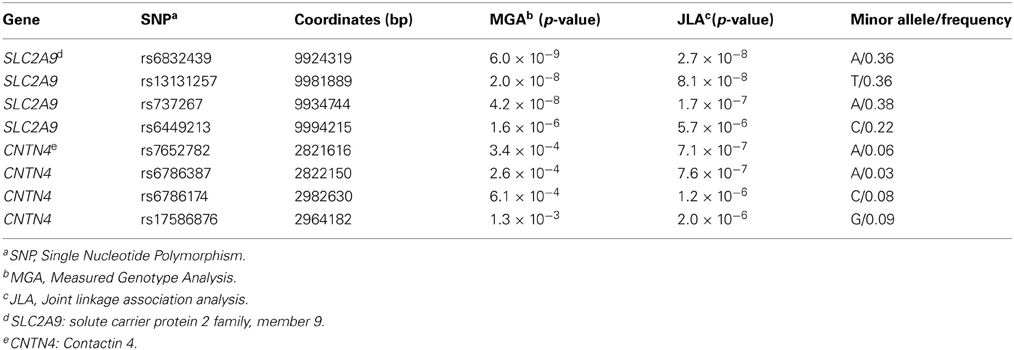
Table 1. Joint linkage-association analysis of serum uric acid (Empirical genome-wide significance: p < 1.3 × 10⁻⁷).
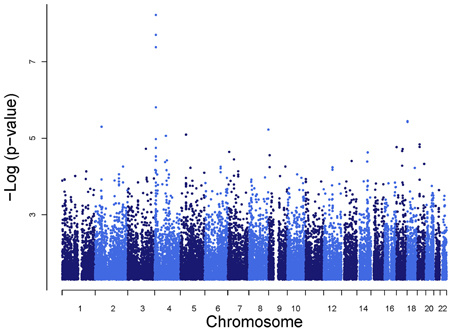
Figure 3. Genome-wide association analysis of serum uric acid.
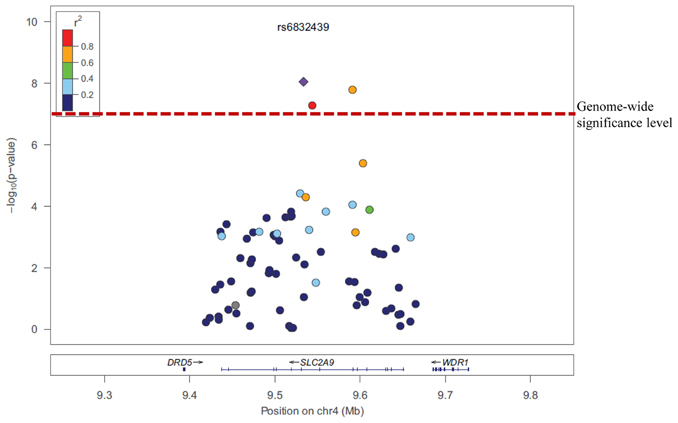
Figure 4. Association of serum uric acid with SLC2A9 SNPs.
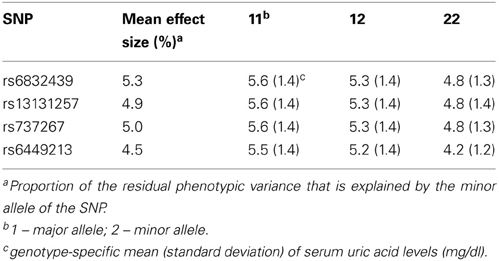
Table 2. Association of the most significant SNPs in solute carrier protein 2 family, member 9 (SLC2A9) gene with serum uric acid (mg/dl).
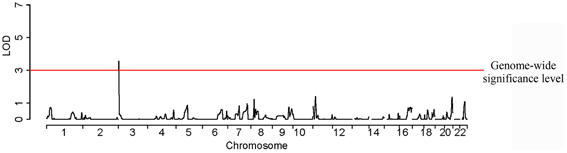
Figure 5. A joint linkage-association approach shows a significant LOD score for serum uric acid on chromosome 3.
Association of SLC2A9 SNPs with Cardiovascular and Renal Disease Risk Factors
In addition to SUA, we also tested the association of SLC2A9 SNPs with several renal and CVD-related risk factors such as anthropometrics, glucose, insulin, lipids, cytokines, and renal function phenotypes. Of these, SNPs in the SLC2A9 gene were significantly associated with body weight, BMI, waist circumference, total antioxidant status (TAS) and urinary albumin-creatinine ratio (UACR) (Table 3). However, the SNPs associated with SUA levels were not the same as those associated with body weight, BMI, waist circumference, or ACR. Interestingly, the two SNPs associated with TAS were also associated with SUA levels.
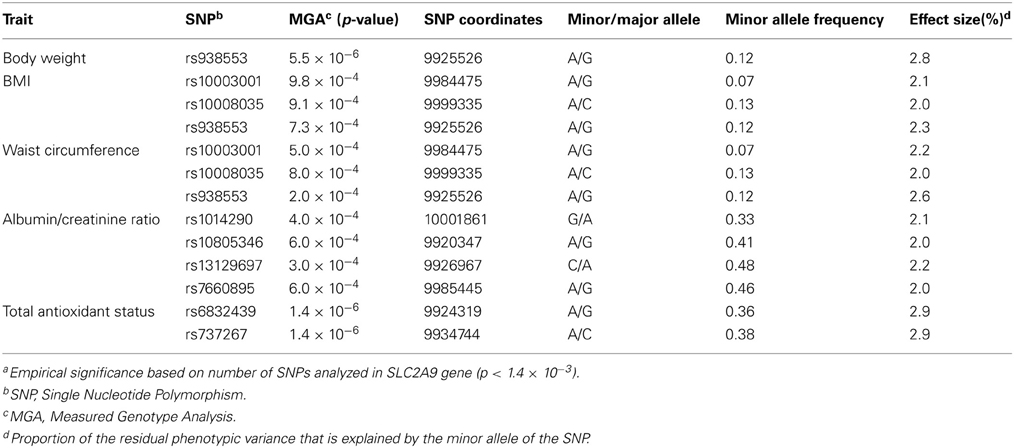
Table 3. Solute carrier protein 2 family, member 9 (SLC2A9) SNPs (chromosome 4) associated with cardiovascular or renal disease risk factors.
When association was conducted, conditional on SNPs associated with SUA, SLC2A9 SNPs showed evidence of significant association with BMI, waist circumference and body weight, and suggestive association with TAS and UACR (data not shown).
Discussion
Our GWAS found polymorphisms in SLC2A9 to be significantly associated with SUA levels in Mexican Americans. This is the first GWAS for SUA in Mexican Americans and replicates results from several studies conducted in European populations from the UK, Germany, Croatia and Sardinia. Recent GWAS have shown consistently that single nucleotide polymorphisms (SNPs) in the SLC2A9 gene are associated with SUA levels (Li et al., 2007; Döring et al., 2008; McArdle et al., 2008; Stark et al., 2008; Vitart et al., 2008; Zemunik et al., 2009; Yang et al., 2010). A study conducted in a Croatian sample found that SLC2A9 variants were associated with SUA with SNPs explaining 1.7–5.3% of the variance in SUA levels. In the same study, this association was replicated in a sample from the island of Orkney (Vitart et al., 2008). Two of the three SNPs associated with SUA in this study were the same as shown in our study (rs6449213 and rs737267). In addition, the effect sizes (proportion of residual phenotypic variance explained by the SNP) of our significant association are in the same range (4–5% of total phenotypic variance). Similarly, in a cohort from Germany, SUA levels were associated with SLC2A9 variants (19). Of the several SNPs that were associated only rs6449213 was common between our two studies. They also showed sex-specific effects of variants in SLC2A9 on SUA levels. This finding was replicated by Brandstätter et al. (2008). Other studies that showed association of polymorphisms in SLC2A9 with SUA were conducted in individuals from Sardinia (Li et al., 2007), Germany (Stark et al., 2008), and the United Kingdom (Wallace et al., 2008; Kolz et al., 2009) as well as in Asian (Matsuo et al., 2008; Cummings et al., 2010; Tabara et al., 2010; Tu et al., 2010; Guan et al., 2011) and African American populations (Dehghan et al., 2008; Rule et al., 2011). To investigate the functional aspects of the SLC2A9 gene, Caulfield et al. (2008) showed that SLC2A9 was a high-capacity urate transporter and can exchange glucose for urate in the process of secretion of urate into the urine. They also confirmed the previously reported association of SLC2A9 with SUA in six different cohorts of European ancestry. Several other loci have also been reported to be associated with serum uric acid levels in GWAS as well as candidate gene association studies (Table 4).
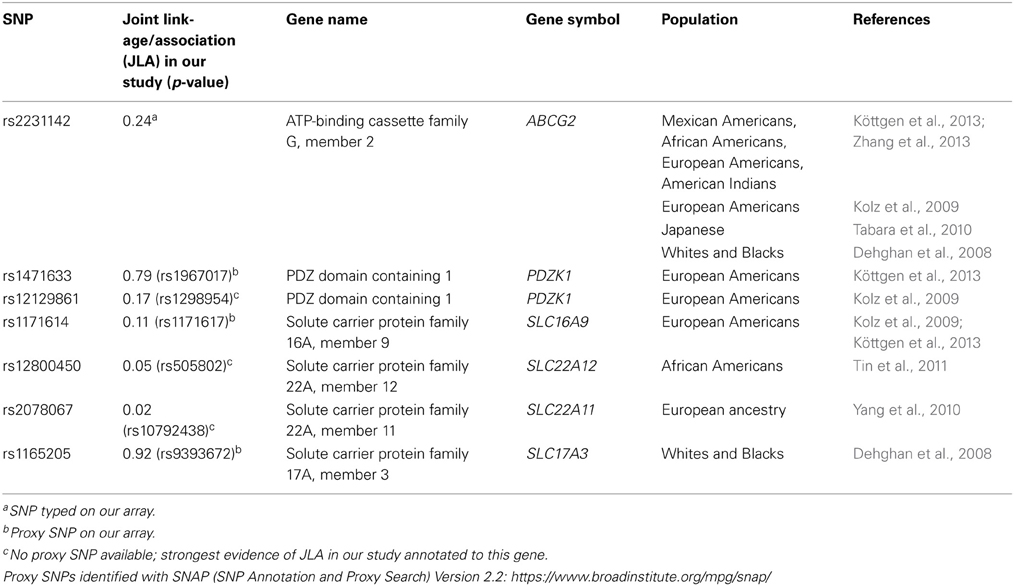
Table 4. Previously reported association of serum uric acid levels with genes other than SLC2A9.
The solute carrier protein 2 family, member 9 (SLC2A9) gene was recently cloned and identified as a member of the solute carrier protein 2 family (Le et al., 2008). Originally thought to be only a facilitated hexose transporter, it was found to be primarily involved in uric acid transport. Its two forms SLC2A9a and SLC2A9b are expressed in the basolateral and apical membranes of the kidney while SLC2A9a is also expressed in liver. Their amino acid sequences are identical, except that SLC2A9b has a shorter and modified N-terminus (Preitner et al., 2009). Both forms are involved in renal urate transport (Le et al., 2008; Cheeseman, 2009). Caulfield et al. (2008) proposed that extracellular glucose and intracellular urate are exchanged by the SLC2A9 transporter. In the kidney SLC2A9 maintains uric acid reabsorption independent of other uric acid transporters (Preitner et al., 2009). On one hand SLC2A9 mutations are associated with hypouricemia and hyperuricosuria, while on the other, mutations in SLC2A9 that alter the protein impair urate secretion into the urine resulting in hyperuricemia (Le et al., 2008; Cheeseman, 2009).
Given the ubiquity of evidence for association of SUA with SLC2A9 polymorphisms and the relatively large effect size of these associations reported in other studies, it is not surprising that we could identify this locus in our study despite its modest sample size. In addition, our joint-linkage association approach has the potential to maximize the information in a sample of related individuals, thus amplifying a signal taking into account fixed effects of marker genotypes (association) and the random effects of shared sequence identity (linkage). With this approach we found suggestive evidence of association on chromosome 3p25-p26 as we showed in our prior linkage analysis (Voruganti et al., 2009a). Associated SNPs were found within the contactin 4 (CNTN4) gene, which is located in the one-LOD support interval in our previous linkage scan for SUA levels. The CNTN4 gene codes for a member of the contactin subgroup of cell adhesion molecules of the immunoglobulin (Ig) superfamily. This family has an important role in the formation and functioning of the neuronal networks; specifically, CNTN4 is known to play a key role in development of the central nervous system. The possible functional relationship of this gene to SUA levels is unknown.
Our association and JLA results are especially interesting given the recent attention to the relative importance of common and rare genetic variants for risk of common complex diseases (Maher, 2008; Manolio et al., 2009). Common marker variants like those in SLC2A9 (minor allele frequency 36–38% in our cohort) should, in theory, be in LD with one or more common functional variants whose effect on the trait of interest should be similar in different lineages. On the other hand, low-frequency functional variants (and low-frequency marker alleles in LD with them) are expected to appear in only a subset of lineages; these pedigree-specific effects are more likely to be identified by linkage than by association. In this context, it is interesting that our replication of association at SLC2A9 is not matched by a linkage signal, while the SNPs identified by joint linkage and association within a strong linkage peak on chromosome 3 have low minor allele frequencies (3–9%)—both findings being consistent with theoretical expectation. These results may also explain why our chromosome 3 QTL has apparently not been reported by other studies, which are primarily population-based; however, the current upsurge in analysis of next-generation sequencing data and improved methods for rare variant detection may provide opportunities to test our findings in the near future.
Since SUA is associated with obesity, type 2 diabetes and CVD risk and is advocated by many to be included as a component of the metabolic syndrome, we conducted a measured genotype analysis for SLC2A9 SNPs and these risk factors. We found evidence of significant associations of SLC2A9 SNPs with body weight, BMI and waist circumference and suggestive associations with TAS. In the same study we also reported significant genetic correlations between SUA and waist circumference in the same study (Voruganti et al., 2009a). Variants in the uric acid transporter gene (SLC2A9) that have been associated with lower SUA were also associated with decreased blood pressure (Parsa et al., 2012). Similarly, another SLC2A9 variant (rs1014290), associated with lower SUA were also associated with decreased risk for diabetes mellitus (Liu et al., 2011) in Han Chinese. In a study by Brandstätter et al. (2008), the association between SLC2A9 SNPs and SUA was significantly modified by BMI. They showed stronger effect size in individuals with higher BMI. However, the precise mechanism that may explain this association is not clear. In contrast, Vitart et al. (2008) found no association between SLC2A9 SNPs and metabolic syndrome components. Caulfield et al. (2008) explored the association of SLC2A9 SNPs and blood pressure traits and found no significant association. We also observed that the SNPs associated with body weight, BMI, or waist circumference were different than those associated with SUA levels. However, the two SNPs associated with TAS were also associated with SUA levels. SUA is known to act as a free radical scavenger (Pasalic et al., 2012) and combat oxidative stress (Johnson et al., 2011). Therefore, the possible link between them may be the role of SUA as an “antioxidant.”
In addition, we found suggestive association between SLC2A9 SNPs and the renal disease development marker UACR. Knock out rodent studies have shown that SLC2A9 knockout mice develop urate nephropathy characterized by intra-tubular urate lithiasis, interstitial inflammation and fibrosis and tubular atrophy (Preitner et al., 2009). SUA levels in humans are primarily determined by renal uric acid clearance, with two-thirds of uric acid turnover being accounted for by its urinary excretion. Hyperuricemia is predictably associated with a decrease in GFR (Culleton, 2001; Johnson et al., 2003; Feig, 2009) and 90% of clinically-recognized hyperuricemia results from impaired renal excretion of uric acid (Le et al., 2008). Abnormal renal urate handling can promote both uric acid and calcium oxalate nephrolithiasis by distinct mechanisms; low urine pH favors uric acid crystallization while mixed uric acid- or sodium urate-calcium oxalate stones develop by epitaxy, “salting out” of calcium oxalate or adsorption of crystal growth inhibitors (Liebman et al., 2007). Hyperuricemia has also been implicated in the development of hypertension, a major risk factor for the development and progression of chronic kidney disease (Feig, 2009). Micropuncture studies have shown that elevated uric acid levels cause cortical vasoconstriction and increase glomerular capillary pressure leading to progressive glomerular injury (Sánchez-Lozada et al., 2002). Given the role of SLC2A9 in renal urate transport, the association between SLC2A9 SNPs and UACR assumes pathogenic significance.
To summarize, this is the first study to report the association of polymorphisms in the SLC2A9 gene with SUA levels in a genome-wide analyses in Mexican Americans. In addition, this is first time that any association between SLC2A9 SNPs and BMI, body weight, waist circumference, UACR, and TAS has been reported.
Author Contributions
Conceived and designed the experiments: Venkata Saroja Voruganti, Jack W. Kent Jr., John Blangero, Anthony G. Comuzzie; Performed or supervised all aspects of statistical analyses: Venkata Saroja Voruganti, Jack W. Kent Jr., John Blangero, Anthony G. Comuzzie; Helped with statistical analyses: Harald H. H.Göring, Laura Almasy, Thomas D. Dyer, Michael C. Mahaney, John Blangero, Anthony G. Comuzzie; Helped with preparation/editing of manuscript: Subrata Debnath, Shelley A. Cole, Karin Haack, Harald H. H.Göring, Melanie A. Carless, Joanne E. Curran, Matthew P. Johnson, Laura Almasy, Thomas D. Dyer, Jean W. MacCluer, Eric K. Moses, Hanna E. Abboud, Michael C. Mahaney, John Blangero, Anthony G. Comuzzie; Wrote the manuscript: Venkata Saroja Voruganti, Jack W. Kent Jr.
Conflict of Interest Statement
The authors declare that the research was conducted in the absence of any commercial or financial relationships that could be construed as a potential conflict of interest.
Acknowledgments
We wish to thank all participants of SAFHS for their cooperation and generous participation. Our work was supported by grant PO1 HL045522 from National Heart, Lung and Blood Institute (NHLBI) and grant MH059490 from National Institute of Mental Health (NIMH) of the National Institutes of Health. A donation from the Azar and Shepperd families in San Antonio paid for the SNP typing in the SAFHS. This investigation was conducted in part in facilities constructed with support from the Research Facilities Improvement Program under grant numbers C06 RR013556 and C06 RR017515. The AT&T Genomics computing center supercomputing facilities used for this work were supported in part by a gift from the AT&T Foundation and with support from the National Center for Research Resources Grant Number S10RR029392. The funders had no role in study design, data collection and analysis, decision to publish, or preparation of the manuscript.
References
Abecasis, G. R., Cherny, S. S., Cookson, W. O., and Cardon, L. R. (2002). Merlin-rapid analysis of dense genetic maps using sparse gene flow trees. Nat. Genet. 30, 97–101. doi: 10.1038/ng786
Almasy, L., and Blangero, J. (1998). Multipoint quantitative-trait linkage analysis in general pedigrees. Am. J. Hum. Genet. 62, 1198–1211. doi: 10.1086/301844
Arar, N. H., Voruganti, V. S., Nath, S. D., Thameem, F., Bauer, R., Cole, S. A., et al. (2008). A genome-wide search for linkage to chronic kidney disease in a community-based sample: the SAFHS. Nephrol. Dial. Transplant. 23, 3184–3191. doi: 10.1093/ndt/gfn215
Boerwinkle, E., Chakroborty, R., and Sing, C. F. (1986). The use of measured genotype information in the analysis of quantitative phenotypes in man. I. Models and analytical methods. Ann. Hum. Genet. 50, 181–194. doi: 10.1111/j.1469-1809.1986.tb01037.x
Brandstätter, A., Kiechl, S., Kollerits, B., Hunt, S. C., Heid, I. M., Coassin, S., et al. (2008). Sex-specific association of the putative fructose transporter SLC2A9 variants with uric acid levels is modified by BMI. Diabetes Care 31, 1662–1667. doi: 10.2337/dc08-0349
Cameron, J. S., and Simmonds, H. A. (2005). Hereditary hyperuricemia and renal disease. Semin. Nephrol. 25, 9–18. doi: 10.1016/j.semnephrol.2004.09.003
Caulfield, M. J., Munroe, P. B., O'Neill, D., Witkowska, K., Charchar, F. J., Doblado, M., et al. (2008). SLC2A9 is a high-capacity urate transporters in humans. PLoS Med. 5:e197. doi: 10.1371/journal.pmed.0050197
Charles, B. A., Shriner, D., Doumatey, A., Chen, G., Zhou, J., Huang, H., et al. (2011). A genome-wide association study of serum uric acid in African Americans. BMD Med. Genomics 4, 4–17. doi: 10.1186/1755-8794-4-17
Cheeseman, C. (2009). Solute carrier family 2, member 9 and uric acid homeostasis. Curr. Opin. Nephrol. Hypertens. 18, 428–432. doi: 10.1097/MNH.0b013e32832ee3de
Cirillo, P., Sato, W., Reungjui, S., Heinig, M., Gesch, M., Sautin, Y., et al. (2006). Uric acid, the metabolic syndrome, and renal disease. J. Am. Soc. Nephrol. 17, S165–S168. doi: 10.1681/ASN.2006080909
Culleton, B. F. (2001). Uric acid and cardiovascular disease: a renal-cardiac relationship? Curr. Opin. Nephrol. Hypertens. 10, 371–375. doi: 10.1097/00041552-200105000-00012
Cummings, N., Dyer, T. D., Kotea, N., Kowlessur, S., Chitson, P., Zimmet, P., et al. (2010). Genome-wide scan identifies a quantitative trait locus at 4p15.3 for serum urate. Eur. J. Hum. Genet. 18, 1243–1247. doi: 10.1038/ejhg.2010.97
Dehghan, A., Köttgen, A., Yang, Q., Hwang, S. J., Kao, W. L., Rivadeneira, F., et al. (2008). Association of three genetic loci with uric acid concentration and risk of gout: a genome-wide association study. Lancet 372, 1953–1961. doi: 10.1016/S0140-6736(08)61343-4
Domagk, G. F., and Schlicke, H. H. (1968). A colorimetric method using uricase and peroxidase for the determination of uric acid. Anal. Biochem. 22, 219–224. doi: 10.1016/0003-2697(68)90309-6
Doria, A., and Krolewski, A. S. (2011). Lowering' serum uric acid levels to prevent kidney failure. Nat. Rev. Nephrol. 7, 495–496.
Döring, A., Gieger, C., Mehta, D., Gohlke, H., Prokisch, H., Coassin, S., et al. (2008). SLC2A9 influences uric acid concentrations with pronounced sex-specific effects. Nat. Genet. 40, 430–436. doi: 10.1038/ng.107
Ejaz, A. A., Dass, B., Kambhampati, G., Ejaz, N. I., Maroz, N., Dhatt, G. S., et al. (2012). Lowering serum uric acid to prevent acute kidney injury. Med. Hypotheses 78, 796–799. doi: 10.1016/j.mehy.2012.03.011
Feig, D. I. (2009). Uric acid: a novel mediator and marker of risk in chronic kidney disease? Curr. Opin. Nephrol. Hypertens. 18, 526–530. doi: 10.1097/MNH.0b013e328330d9d0
Flegal, K. M., Ezzati, T. M., Harris, M. I., Haynes, S. G., Juarez, R. Z., Knowler, W. C., et al. (1991). Prevalence of diabetes in Mexican Americans, Cubans, and Puerto Ricans from the Hispanic Health and Nutrition Examination Survey, 1982-1984. Diabetes Care. 14, 628–638. doi: 10.2337/diacare.14.7.628
Friedlander, Y., Kark, J. D., and Stein, Y. (1988). Family resemblance for serum uric acid in a Jerusalem sample of families. Hum. Genet. 79, 58–63. doi: 10.1007/BF00291711
Go, A. S. (2013). Heart disease and stroke statistics-2013 update: a report from the American Heart Association. Circulation 127, e6. doi: 10.1161/CIR.0b013e31828124ad
Gotsman, I., Kereb, A., Lotan, C., and Zwas, D. R. (2012). Changes in uric acid levels and allopurinol use' in chronic heart failure: association with improved survival. J. Card. Fail. 18, 694–701. doi: 10.1016/j.cardfail.2012.06.528
Guan, M., Zhou, D., Ma, W., Chen, Y., Zhang, J., and Zou, H. (2011). Association of an intronic SNP of SLC2A9 gene with serum uric acid levels in the Chinese male Han population by high-resolution melting method. Clin. Rheumatol. 30, 29–35. doi: 10.1007/s10067-010-1597-x
Johnson, R. J., Kang, D. H., Feig, D., Kivlighn, S., Kanellis, J., Watanabe, S., et al. (2003). Is there a pathogenetic role for uric acid in hypertension and cardiovascular and renal disease? Hypertension 41, 1183–1190. doi: 10.1161/01.HYP.0000069700.62727.C5
Johnson, R. J., Lanaspa, M. A., and Gaucher, E. A. (2011). Uric acid: a danger signal from the RNA world that may have a role in the epidemic of obesity, metabolic syndrome, and cardiorenal disease: evolutionary considerations. Semin. Nephrol. 31, 394–399. doi: 10.1016/j.semnephrol.2011.08.002
Karns, R., Zhang, G., Sun, G., Rao Indugula, S., Cheng, H., Havas-Augustin, D., et al. (2012). Genome-wide association of serum uric acid concentration: replication of sequence variants in an island populations of the Adriatic coast of Croatia. Ann. Hum. Genet. 75, 121–127. doi: 10.1111/j.1469-1809.2011.00698.x
Kolz, M., Johnson, T., Sanna, S., Teumer, A., Vitart, V., Perola, M., et al. (2009). Meta-analysis of 28,141 individuals identifies common variants within five new loci that influence uric acid concentrations. PLoS Genet. 5:e1000504. doi: 10.1371/journal.pgen.1000504
Köttgen, A., Albrecht, E., Teumer, A., Vitart, V., Krumsiek, J., Hundertmark, C., et al. (2013). Genome-wide association analyses identify 18 new loci associated with serum urate concentrations. Nat. Genet. 45, 145–154. doi: 10.1038/ng.2500
Le, M. T., Shafiu, M., Mu, W., and Johnson, R. J. (2008). SLC2A9-a fructose transporter identified as a novel uric acid transporter. Nephrol. Dial. Transplant. 23, 2746–2749. doi: 10.1093/ndt/gfn349
Li, S., Sanna, S., Maschio, A., Busonero, F., Usala, G., Mulas, A., et al. (2007). The GLUT9 gene is associated with serum uric acid levels in Sardinia and Chianti cohorts. PLoS Genet. 3:e194. doi: 10.1371/journal.pgen.0030194
Liebman, S. E., Taylor, J. G., and Bushinsky, D. A. (2007). Uric acid nephrolithiasis. Curr. Rheumatol. Rep. 9, 251–257. doi: 10.1007/s11926-007-0040-z
Liu, W. C., Hung, C. C., Chen, S. C., Lin, M. Y., Chen, L. I., Hwang, D. Y., et al. (2011). The rs1014290 polymorphisms of the SLC2A9 gene is associated with type 2 diabetes mellitus in Han Chinese. Exp. Diabetes Res. 2011:527520. doi: 10.1155/2011/527520
MacCluer, J. W., Stern, M. P., Almasy, L., Atwood, L. A., Blangero, J., Comuzzie, A. G., et al. (1999). Genetics of atherosclerosis risk factors in Mexican Americans. Nutr. Rev. 57, S59–S65. doi: 10.1111/j.1753-4887.1999.tb01790.x
Maher, B. (2008). Personal genomes: the case of the missing heritability. Nature 456, 18–21. doi: 10.1038/456018a
Manolio, T. A., Collins, F. S., Cox, N. J., Goldstein, D. B., Hindorff, L. A., Hunter, D. J., et al. (2009). Finding the missing heritability of complex diseases. Nature 461, 747–753. doi: 10.1038/nature08494
Matsuo, H., Chiba, T., Nagamori, S., Nakayama, A., Domoto, H., Phetdee, K., et al. (2008). Mutations in glucose transporter 9 gene SLC2A9 cause renal hypouricemia. Am. J. Hum. Genet. 83, 744–751. doi: 10.1016/j.ajhg.2008.11.001
McArdle, P. F., Parsa, A., Chang, Y. P., Weir, M. R., O'Connell, J. R., Mitchell, B. D., et al. (2008). Association of a common nonsynonymous variant in GLUT9 with serum uric acid levels in old order amish. Arthritis Rheum. 58, 2874–2881. doi: 10.1002/art.23752
Mitchell, B. D., Almasy, L. A., Rainwater, D. L., Schneider, J. L., Blangero, J., Stern, M. P., et al. (1999). Diabetes and hypertension in Mexican American families: relation to cardiovascular risk. Am. J. Epidemiol. 149, 1047–1056. doi: 10.1093/oxfordjournals.aje.a009750
Nakagawa, T., Kang, D.-H., Feig, D., Sanchez-Lozada, L. G., Srinivas, T. R., Ejaz, A. A., et al. (2006). Unearthing uric acid: an ancient factor with recently found significance in renal and CVD. Kidney Int. 69, 1722–1725. doi: 10.1038/sj.ki.5000391
Nakagawa, T., Tuttle, K. R., Short, R. A., and Johnson, R. J. (2005). Hypothesis: fructoseinduced hyperuricemia as a causal mechanism for the epidemic of the metabolic syndrome. Nat. Clin. Pract. Nephrol. 1, 80–86. doi: 10.1038/ncpneph0019
Nakayama, A., Matsuo, H., Takada, T., Ichida, K., Nakamura, T., Ikebuchi, Y., et al. (2011). ABCG2 is a high-capacity urate transporter and its genetic impairment increases serum uric acid levels in humans. Nucleosides Nucleotides Nucleic Acids 30, 1091–1097. doi: 10.1080/15257770.2011.633953
Nath, S. D., Voruganti, V. S., Arar, N. H., Thameem, F., Lopez-Alvarenga, J. C., Bauer, R., et al. (2007). Genome scan for determinants of serum uric acid variability. J. Am. Soc. Nephrol. 18, 3156–3163. doi: 10.1681/ASN.2007040426
Parsa, A., Brown, E., Weir, M. R., Fink, J. C., Shuldiner, A. R., Mitchell, B. D., et al. (2012). Genotype-based changes in serum uric acid affect blood pressure. Kidney Int. 81, 502–507. doi: 10.1038/ki.2011.414
Pasalic, D., Marinkovic, N., and Feher-Turkovic, L. (2012). Uric acid as one of the important factors in multifactorial disorders: facts and controversies. Biochem. Med. (Zagrab) 22, 63–75. doi: 10.11613/BM.2012.007
Preitner, F., Bonny, O., Laverriere, A., Rotman, S., Firsov, D., Da Costa, A., et al. (2009). Glut9 is a major regulator of urate homeostasis and its genetic inactivation induces hyperuricosuria and urate nephropathy. Proc. Natl. Acad. Sci. U.S.A. 106, 15501–15506. doi: 10.1073/pnas.0904411106
Rajendra, N. S., Ireland, S., George, J., Beich, J. J., Lang, C. C., and Struthers, A. D. (2011). Mechanistic insights into the therapeutic use of high-dose allopurinol manqlna pectoris. J. Am. Coli. Cardiol. 58, 820–828. doi: 10.1016/j.jacc.2010.12.052
Rao, D. C., Laskarzewski, P. M., Morrison, J. A., Kelly, K., and Glueck, C. J. (1982). The clinical Lipid Research Clinic Family Study: familial determinants of plasma uric acid. Hum. Genet. 60, 257–261. doi: 10.1007/BF00303013
Rice, T., Vogler, G. P., Perry, T. S., Laskarzewski, P. M., Province, M. A., and Rao, D. C. (1990). Heterogenity in the familial aggregation of fasting uric acid levels in five North American populations: the Lipid Research Clinics Family Study. Am. J. Med. Genet. 36, 219–225. doi: 10.1002/ajmg.1320360216
Rule, A. D., de Andrade, M., Matsumoto, M., Mosley, T. H., Kardia, S., and Turner, S. T. (2011). Association between SLC2A9 transporter gene variants and uric acid phenotypes in African. American and white families. Rheumatology (Oxford) 50, 871–878. doi: 10.1093/rheumatology/keq425
Rule, A. D., Fridley, B. L., Hunt, S. C., Asmann, Y., Boerwinkle, E., Pankow, J. S., et al. (2009). Genome-wide linkage analysis for uric acid in families enriched for hypertension. Nephrol. Dial. Transplant. 24, 2414–2420. doi: 10.1093/ndt/gfp080
Sánchez-Lozada, L. G., Tapia, E., Avila-Casado, C., Soto, V., Franco, M., Santamaría, J., et al. (2002). Mild hyperuricemia induces glomerular hypertension in normal rats. Am. J. Physiol. Renal Physiol. 283, F1105–F1110. doi: 10.1152/ajprenal.00170.2002
Self, S. G., and Liang, K.-Y. (1987). Asymptotic properties of maximum likelihood estimators and likelihood ratio tests under nonstandard conditions. J. Am. Stat. Assoc. 82, 605–610. doi: 10.1080/01621459.1987.10478472
Sobel, E., and Lange, K. (1996). Descent graphs in pedigree analysis: Applications to haplotyping, location scores, and marker-sharing statistics. Ann. Hum. Genet. 58, 1323–1337.
Stark, K., Reinhard, W., Neureuther, K., Wiedmann, S., Sedlacek, K., Baessler, A., et al. (2008). Association of common polymorphisms in GLUT9 gene with gout but not with coronary artery disease in a large case-control study. PLoS ONE 3:e1948. doi: 10.1371/journal.pone.0001948
Tabara, Y., Kohara, K., Kawamoto, R., Hiura, Y., Nishimura, K., Morisaki, T., et al. (2010). Association of four genetic loci with uric acid levels and reduced renal function: the J-SHIPP Suita study. Am. J. Nephrol. 32, 279–286. doi: 10.1159/000318943
Tang, W., Miller, M. B., Rich, S. S., North, K. E., Pankow, J. S., Borecki, I. B., et al. (2003). Linkage analysis of a composite factor for the multiple metabolic syndrome. The National Heart, Lung and Blood Institute Family Heart Study. Diabetes 52, 2840–2847. doi: 10.2337/diabetes.52.11.2840
Tin, A., Woodward, O. M., Kao, W. H., Liu, C. T., Lu, X., Nalls, M. A., et al. (2011). Genome-wide association study for serum urate concentrations and gout among African Americans identifies genomic risk loci and a novel URAT 1 loss-of-function allele. Hum. Mol. Genet. 20, 4056–4068. doi: 10.1093/hmg/ddr307
Tu, H. P., Chen, C. J., Tovosia, S., Ko, A. M., Lee, C. H., Ou, T. T., et al. (2010). Associations of a non-synonymous variant in SLC2A9 with gouty arthritis and uric acid levels in Han Chinese subjects and Solomon Islanders. Ann. Rheum. Dis. 69, 887–890. doi: 10.1136/ard.2009.113357
Vitart, V., Rudan, I., Hayward, C., Gray, N. K., Floyd, J., Palmer, C. N., et al. (2008). SLC2A9 is a newly identified urate transporter influencing serum urate concentration, urate excretion and gout. Nat. Genet. 40, 437–442. doi: 10.1038/ng.106
Voruganti, V. S., Nath, S. D., Cole, S. A., Thameem, F., Jowett, J. B., Bauer, R., et al. (2009a). Genetics of variation in serum uric acid and cardiovascular risk factors in Mexican-Americans. J. Clin. Endocrinol. Metab. 94, 632–638. doi: 10.1210/jc.2008-0682
Voruganti, V. S., Goring, H. H. H., Mottl, A., Franceschini, N., Haack, K., Laston, S., et al. (2009b). Genetic influence on variation in serum uric acid in American Indians: the Strong Heart Family Study. Hum. Genet. 126, 667–676. doi: 10.1007/s00439-009-0716-8
Wallace, C., Newhouse, S. J., Braund, P., Zhang, F., Tobin, M., Falchi, M., et al. (2008). Genome-wide association study identifies genes for biomarkers of cardiovascular disease: serum urate and dyslipidemia. Am. J. Hum. Genet. 82, 139–149. doi: 10.1016/j.ajhg.2007.11.001
Wilk, J. B., Djousse, L., Borecki, I., Atwood, L. D., Hunt, S. C., Rich, S. S., et al. (2000). Segregation analysis of serum uric acid in the NHLBI Family Heart Study. Hum. Genet. 106, 355–359. doi: 10.1007/s004390051050
Woodward, O. M., Kottgen, A., Coresh, J., Boerwinkle, E., Guggino, W. B., and Kottgen, M. (2009). Identification of a urate transporter, ABCG2, with a common functional polymorphism causing gout. Proc. Natl. Acad. Sci. U.S.A. 106, 10338–10342. doi: 10.1073/pnas.0901249106
Yang, Q., Guo, C. Y., Cupples, A., Levy, D., Wilson, P. W., and Fox, C. S. (2005). Genome-wide search for genes affecting serum uric acid levels: the Framingham Heart Study. Metabolism 54, 1435–1441. doi: 10.1016/j.metabol.2005.05.007
Yang, Q., Köttgen, A., Dehghan, A., Smith, A. V., Glazer, N. L., Chen, M. H., et al. (2010). Multiple genetic loci influence serum urate levels and their relationship with gout and cardiovascular disease risk factors. Circ. Cardiovasc. Genet. 3, 523–530. doi: 10.1161/CIRCGENETICS.109.934455
Yelken, B., Caliskan, Y., Gorgulu, N., Altun, I., Yimaz, A., Yazici, H., et al. (2012). Reduction of uric acid levels with allopurinol treatment improves endothelial function in patients with chronic kidney disease. Clin. Nephrol. 77, 275–282. doi: 10.5414/CN107352
Zemunik, T., Boban, M., Lauc, G., Jankovi‘c, S., Rotim, K., Vatavuk, Z., et al. (2009). Genome-wide association study of biochemical traits in Korcula Island, Croatia. Croat. Med. J. 50, 23–33. doi: 10.3325/cmj.2009.50.23
Zhang, L., Spencer, K. L., Voruganti, V. S., Jorgensen, N. W., Fornage, M., Best, L. G., et al. (2013). Association of functional polymorphisms rs2231142 (Q141K) in the ABCG2 gene with serum uric acid and gout in 4 US populations: the PAGE study. Am. J. Epidemiol. doi: 10.1093/aje/kws330. [Epub ahead of print].
Keywords: variance components decomposition approach, joint linkage/association analysis, kinship, hyperuricemia
Citation: Voruganti VS, Kent JW Jr., Debnath S, Cole SA, Haack K, Göring HHH, Carless MA, Curran JE, Johnson MP, Almasy L, Dyer TD, MacCluer JW, Moses EK, Abboud HE, Mahaney MC, Blangero J and Comuzzie AG (2013) Genome-wide association analysis confirms and extends the association of SLC2A9 with serum uric acid levels to Mexican Americans. Front. Genet. 4:279. doi: 10.3389/fgene.2013.00279
Received: 26 August 2013; Paper pending published: 24 September 2013;
Accepted: 23 November 2013; Published online: 16 December 2013.
Edited by:
Struan F. A. Grant, Children's Hospital of Philadelphia Research Institute, USAReviewed by:
Cheryl L. Thompson, Case Western Reserve University, USALynette Phillips, Kent State University, USA
Copyright © 2013 Voruganti, Kent, Debnath, Cole, Haack, Göring, Carless, Curran, Johnson, Almasy, Dyer, MacCluer, Moses, Abboud, Mahaney, Blangero and Comuzzie. This is an open-access article distributed under the terms of the Creative Commons Attribution License (CC BY). The use, distribution or reproduction in other forums is permitted, provided the original author(s) or licensor are credited and that the original publication in this journal is cited, in accordance with accepted academic practice. No use, distribution or reproduction is permitted which does not comply with these terms.
*Correspondence: Venkata Saroja Voruganti, Department of Genetics, Texas Biomedical Research Institute, PO Box 760549, San Antonio, TX 78245-0549, USA;
Department of Nutrition, Nutrition Research Institute, University of North Carolina at Chapel Hill, 500 Laureate Way, Kannapolis, NC, USA e-mail: saroja@txbiomedgenetics.org
†These authors have contributed equally to this work.