 Hoang T. Nguyen
 Tony R. Merriman
 Michael A. Black
- 1Department of Biochemistry, University of Otago, Dunedin, New Zealand
- 2Department of Mathematics and Statistics, University of Otago, Dunedin, New Zealand
- 3Department of Biochemistry, Virtual Institute of Statistical Genetics, University of Otago, Dunedin, New Zealand
Recent advances in high-throughout sequencing technologies have made it possible to accurately assign copy number (CN) at CN variable loci. However, current analytic methods often perform poorly in regions in which complex CN variation is observed. Here we report the development of a read depth-based approach, CNVrd2, for investigation of CN variation using high-throughput sequencing data. This methodology was developed using data from the 1000 Genomes Project from the CCL3L1 locus, and tested using data from the DEFB103A locus. In both cases, samples were selected for which paralog ratio test data were also available for comparison. The CNVrd2 method first uses observed read-count ratios to refine segmentation results in one population. Then a linear regression model is applied to adjust the results across multiple populations, in combination with a Bayesian normal mixture model to cluster segmentation scores into groups for individual CN counts. The performance of CNVrd2 was compared to that of two other read depth-based methods (CNVnator, cn.mops) at the CCL3L1 and DEFB103A loci. The highest concordance with the paralog ratio test method was observed for CNVrd2 (77.8/90.4% for CNVrd2, 36.7/4.8% for cn.mops and 7.2/1% for CNVnator at CCL3L1 and DEF103A). CNVrd2 is available as an R package as part of the Bioconductor project: http://www.bioconductor.org/packages/release/bioc/html/CNVrd2.html.
Introduction
Copy number variation (CNV) encompassing genes is a common phenomenon in the human genome, and has been shown to be associated with variation in phenotype (Gonzalez et al., 2005; Freeman et al., 2006; McKinney et al., 2008, 2010, 2012; Bentley et al., 2010). Accurate CN assignment is required for studies associating CNV loci with phenotype. However, accurately measuring gene CN by direct molecular methods over large numbers of samples is challenging, and is often complicated by the existence of paralogous gene pairs. As a consequence, phenotypic association data, largely obtained by quantitative polymerase chain reaction (Q-PCR) based methods, should be regarded with caution (He et al., 2009; Marques et al., 2010; Carpenter et al., 2011; McKinney and Merriman, 2012). In response to the increasing utility of high-throughput sequencing (HTS) technologies, we previously developed the read depth based method CNVrd (Nguyen et al., 2013). We demonstrated its ability to accurately assign CN using genome-wide HTS data duplications and deletions at the FCGR locus, where CN ranges from zero to four. To date, however, the utility of this approach for genotyping loci at which a greater range of CN exists is untested.
One complex CN variable locus is CCL3L1. Copy number variation at CCL3L1 has been associated with susceptibility to HIV infection (Liu et al., 2010), autoimmune disease (Burns et al., 2005; Mamtani et al., 2008; McKinney et al., 2008) and asthma (Lee et al., 2011). The median CN of CCL3L1 is 2 in European populations and >2 in other populations (Gonzalez et al., 2005). Evaluation of the role of CCL3L1 CNV in common disease has been hampered by robustness of methodology, particularly that based on Q-PCR (He et al., 2009; Carpenter et al., 2011). Similarly, CNV within the beta-defensin locus on chromosome 8, which includes the DEFB4 and DEFB103A genes that vary in CN en bloc (a range of two to nine copies) (Groth et al., 2008), has been associated with various infectious and inflammatory phenotypes (Bentley et al., 2010; Mehlotra et al., 2012; Zhou et al., 2012). As is the case for CCL3L1, however, interpretation of these data, and further progress in studying the role of beta-defensin CN in medical phenotypes, is hampered by the difficulty in accurately measuring CN in large numbers of samples (Aldhous et al., 2010). Paralog ratio test (PRT) copy number data are available at both CCL3L1 and the beta-defensin locus (Armour et al., 2007; Walker et al., 2009), and thus provide an important resource for developing and validating new HTS read depth-based copy number assignment approaches. The PRT uses multiple probes to compare CN to an invariant paralog and is currently regarded as the gold-standard method for measuring CN at complex loci (McKinney and Merriman, 2012).
Here we describe the development of CNVrd2 as an extension of the CNVrd methodology, and demonstrate the application of this new approach by assigning copy number at the development locus CCL3L1, and test locus DEFB103A, both of which have previously had CN measured using the PRT.
Subjects and Methods
HTS and Microarray Data Used
The genomic coordinates (hg19) used in this research were derived from the NCBI (http://www.ncbi.nlm.nih.gov/) and were CCL3 (chr17:34415602-34417506), CCL3L1 (chr17:34623842-34625730), CCL3L3 (chr17:34623842-34625730), CCL4 (chr17:34431220-34433014), CCL4L1 (chr17:34538468-34540275), DEFB103A (chr8:7738726-7740105) and DEFB103B (chr8:7286410-7287682). Data were downloaded from the European Bioinformatics Institute (EBI) FTP server (ftp://ftp.1000genomes.ebi.ac.uk/vol1/ftp/data/ and ftp://ftp.1000genomes.ebi.ac.uk/vol1/ftp/phase1/data/). For CCL3L1, 2535 samples (Table 1) downloaded from 26 populations on February 10, 2014 were used. These had an average coverage of 2.8–40.6× over a 2 Mb region around the CCL3L1 locus. For DEFB103A, 2535 samples (Table 2) downloaded on August 13, 2013 were used. These had an average coverage of 2.8–30.9× (median 6.9×) over the 2 Mb region around the DEFB103A locus. Only samples sequenced on Illumina platforms were used, so as to avoid cross platform variability. BWA-aligned data were available in BAM format (Li et al., 2009).
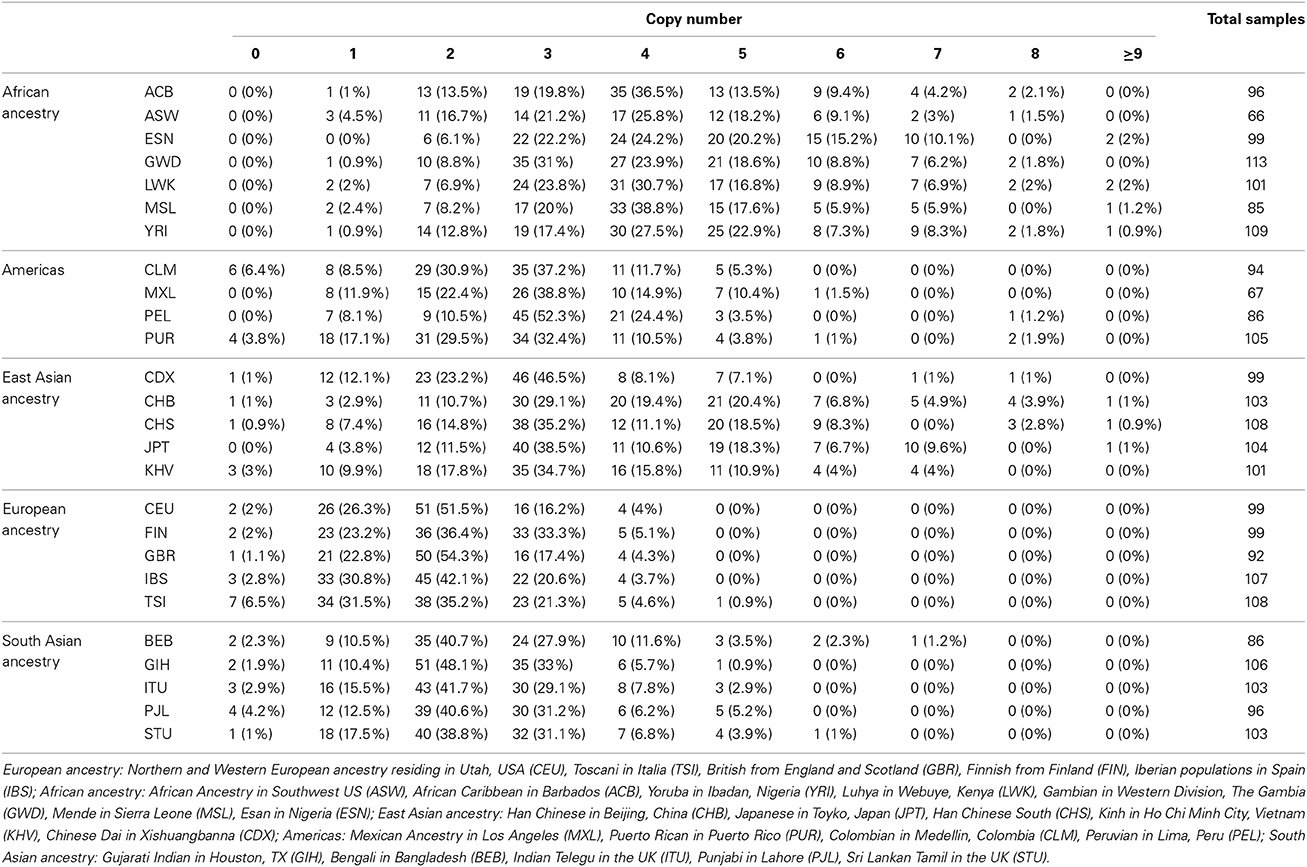
Table 1. CCL3L1 copy-number assignments by CNVrd2.
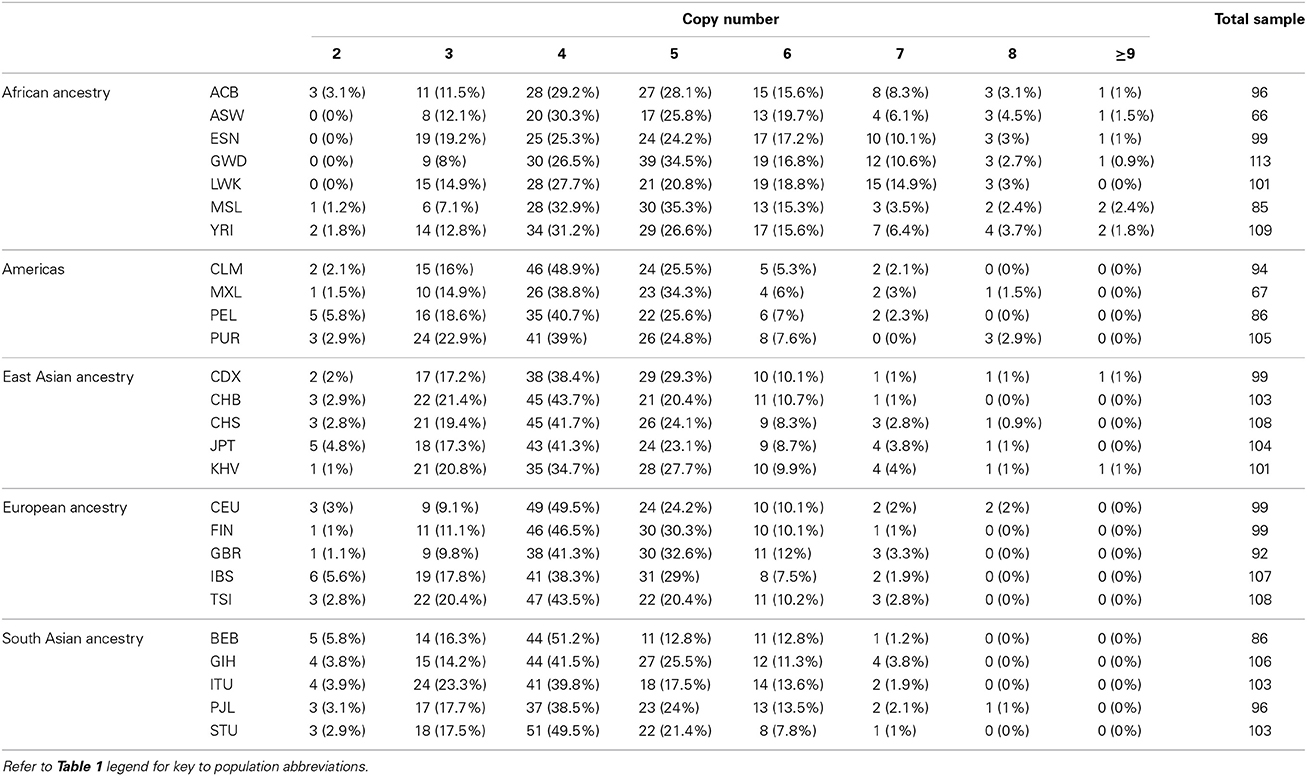
Table 2. DEFB103A copy-number assignments by CNVrd2.
The Workflow of the Pipeline
The entire pipeline is represented in Figure 1. The pipeline is used to measure CN for a specific gene or locus. Four main steps are described below.
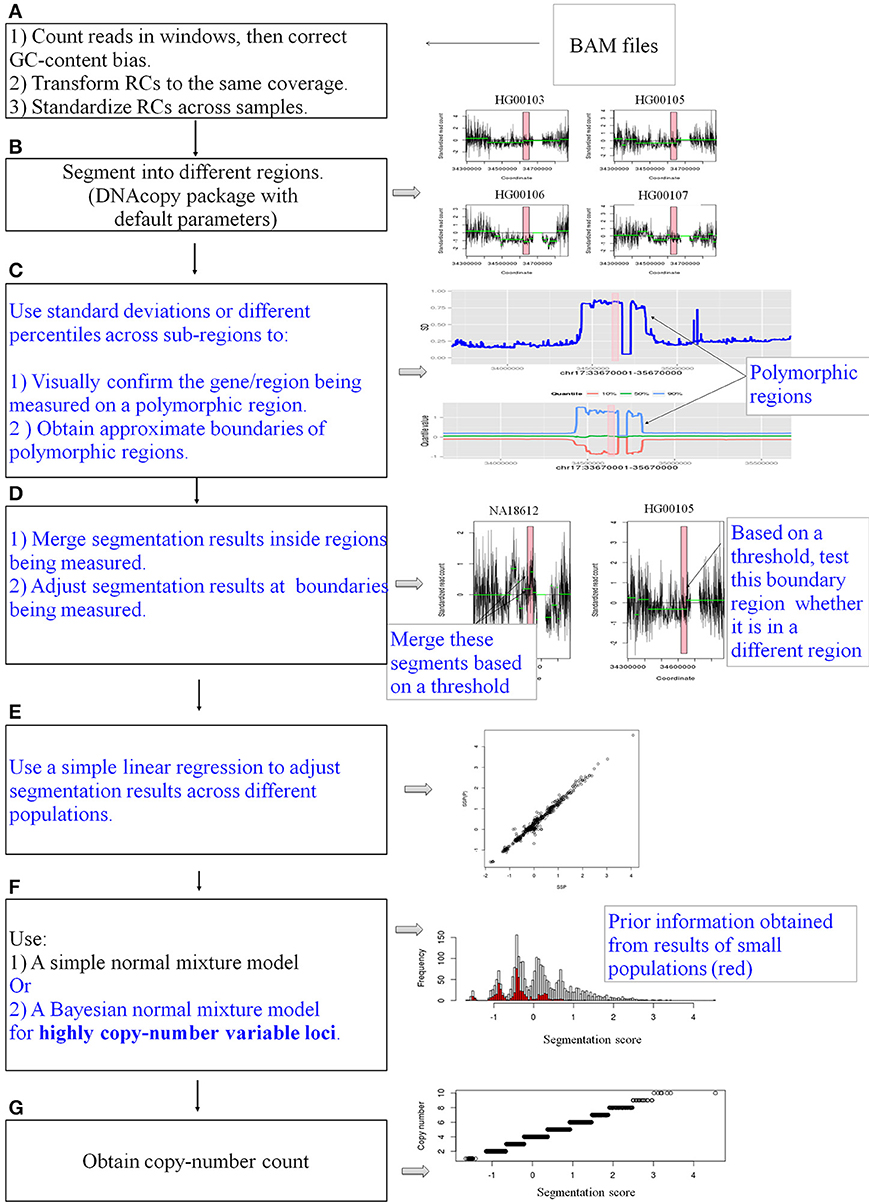
Figure 1. A schematic diagram of the pipeline. CNVrd2 is a modified version of CNVrd. CNVrd2 is identical to CNVrd at the counting, transforming, standardizing and segmenting steps (A,B,G: black text). However, CNVrd2 has additional steps: identification of polymorphic regions (C), merging sub-regions inside genes/regions being measured and testing boundary regions (D), using a simple linear regression model to adjust segmentation scores between populations (E) and a Bayesian normal mixture to cluster segmentation scores of highly CN variable regions into different groups (F). These new steps are in blue text.
Pipeline Workflow: Identification of Approximate Boundaries of Measured Regions
Samples were segmented as previously described for the CNVrd procedure (Nguyen et al., 2013). The results of the segmentation process were used to obtain approximate boundaries of copy-number variable regions encompassing the gene being measured. CNVrd2 used different percentiles and standard deviations of segmentation results to visually obtain information of CNVs at loci. Then, standard deviations were used to obtain approximate boundaries as follows (Step C, Figure 1).
To identify approximate boundaries of putative polymorphic regions (Step C, Figure 1), the coordinates of regions having similar segmentation results for each sample were obtained from the segmentation process applied to the large 1-2 Mb regions across all samples. Next, all these coordinates were combined to generate sub-regions, and segmentation results generated by the original segmentation analysis for each sample were obtained. Finally, the standard deviations and various percentiles of segmentation results of each sub-region across the 2535 samples were calculated and plotted to visually confirm CNV. Windows exhibiting large standard deviations were used to identify approximate positions of putative regions being assigned CN.
Pipeline Workflow: Obtaining Segmentation Scores for Individual Samples at the Measured Locus
This step was similar to our previous pipeline (CNVrd) but with some modifications (Step D, Figure 1) added to obtain more reliable segmentation scores. If the entirety of the gene of interest was placed in a single segment then the segmentation score for the gene was the segmentation score for that region. If the gene was split into multiple segments, each having the same sign then the segmentation score for the gene was calculated as the length-weighted average across the segments (NA18612 for example in Step D, Figure 1). Otherwise, if a segment at the boundary of the gene had a different sign from other sub-regions of the gene (HG00254 for example) and the boundary segment's length was less than a specific threshold (here the threshold was set to half the window size) then the z-score for the boundary segment was calculated, where the z-score is defined as the value of the standardized observed read-count ratio (Nguyen et al., 2013). If the z-score had the same sign as the segmentation scores from other sub-regions of the gene, then the segmentation score for the gene was again calculated as the length-weighted average across the other segments. For all other situations the gene of interest was assigned a segmentation score of zero, reflecting the population average at that locus.
Pipeline Workflow: Adjustment of the Segmentation Process for Multiple Populations
The pipeline was applied to each of the five major populations (European, East Asian, West African, South Asian, and Americas) to obtain segmentation scores (SSP: the segmentation scores for a single major population). This identified the scores in each of the large populations, but did not allow comparisons between the populations. Therefore, we ran the segmentation process for all samples and obtained segmentation scores for samples in all populations [SSP(P): the segmentation scores for pooled populations]. When we pooled samples and ran the pipeline, if the gene being analyzed was not segmented into a single region for a particular sample, then that sample was assigned a segmentation score of zero. For example, the median CCL3L1 CN for European-ancestry sample sets was less than other populations, therefore the majority of segmentation results and z-scores (where needed—see above) were less than zero. If the CCL3L1 gene region of a European-ancestry sample was segmented into two sub-regions, both having negative signs in the all-population analysis, then this could either be recapitulated in the single-population analysis (implying they were within the same CN region) or they could be sub-regions that could span the population average. Thus, they could have one negative and one positive sign (implying they were within two distinct CN regions). In this case, however, the pipeline only recognized that sub-regions shared the same sign, and the two regions would therefore be considered as one region and would be merged. To improve this, for each of the five major populations, we fitted a linear regression line with SSP and SSP(P) as independent and dependent variables respectively (data for CCL3L1 are shown in Figure 2). This step aimed to reduce errors when performing segmentation within single major populations or pooled populations. The fitted mean values of the five single linear regression models were used as the final per sample segmentation scores for these five populations. Segmentation scores were transformed and standardized, and a normal mixture model was used to cluster the scores into CN genotype groups.
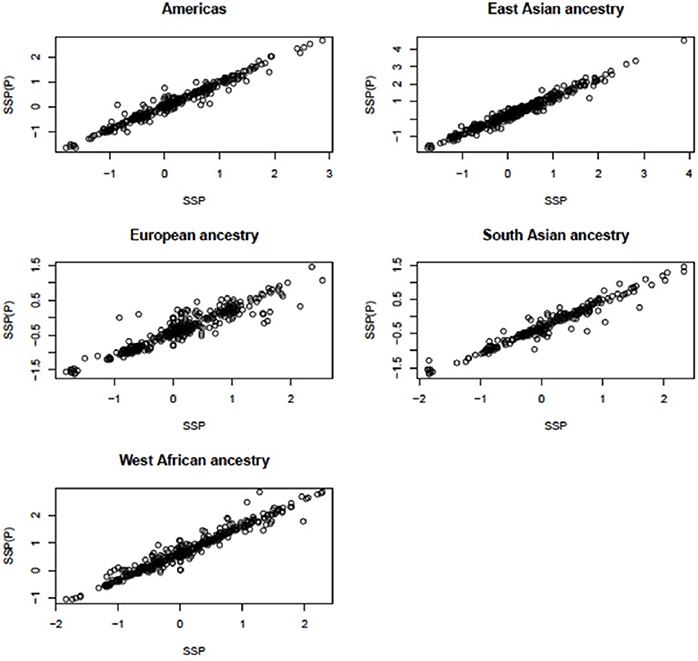
Figure 2. Linear relationship between the segmentation scores called for single populations and for all populations at CCL3L1. SSP, the segmentation scores of a single large population; SSP(P), the segmentation score of pooled populations.
Pipeline Workflow: Assigning Copy-Number Counts
A normal mixture model was used to cluster final segmentation scores into different groups. If clear clusters were observed then the Expectation Maximization (EM) algorithm (Dempster et al., 1977) was used in the clustering process. If data were complicated (e.g., loci with high copy-number variants such as CCL3L1 and DEFB103A) then a Bayesian clustering approach was used (Step F, Figure 1; details of the analysis process for CCL3L1 and DEFB103A are described below).
Identification of Window Size Parameters for CNVrd2 Using Test Loci
One of the new innovations in CNVrd2 was the merging of segmentation results inside regions being measured if these regions were divided into different parts (Step D, Figure 1). We merged these parts if their signal values were above (below) a threshold (namely “testThreshold2Merge” in the CNVrd2 package) for duplicated events (deleted events). Another parameter was the length of a boundary region, the default for which was set to “half window size.” Real data sets were used for investigation of the parameters of CNVrd2. In order to make reliable data sets we intersected the CNV results of two sets of data (Conrad et al., 2010; Campbell et al., 2011). From these intersecting data we chose eight loci whose copy-number assignments were ≥45% identical and whose lengths were in different ranges (~3, ~5, ~8, ~20, ~24, ~45, ~60, ~100 kb). The coordinates and CN status of the 8 loci are described in Table 3. We only retained samples having identical results between the methods. We downloaded BAM files of the 1 Mb regions around these loci and let CNVrd2 automatically assign CN for the loci (CN groups of these loci were known in advance from the micro-array based results, Table 3).
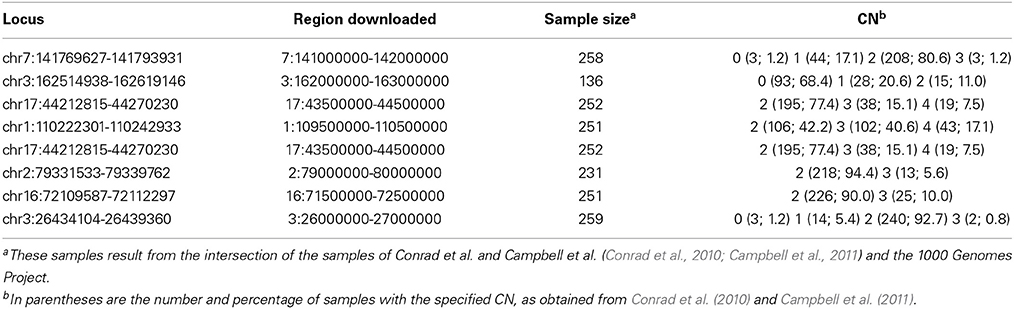
Table 3. Eight loci which were obtained from the intersection of results of Conrad et al. (2010) and Campbell et al. (2011) were used to obtain parameters for CNVrd2 and to compare between CNVrd2 and CNVrd.
Comparison with CNVrd
We compared the new pipeline with our previous pipeline at the eight loci mentioned above (Table 3) and the eleven loci previously measured in Nguyen et al. (2013). For the eight loci, both pipelines were run and the percent concordances were calculated. For CNVrd2, we used different window sizes (0.1, 0.2, 0.5, 1, 2, 5, 10, 20, and 50 kb) and different values (0.15, 0.25, 0.35, and 0.45) of testThreshold2Merge. For CNVrd, we only used different windows (0.1, 0.2, 0.5, 1, 2, 5, 10, 20, and 50 kb) because the merging process was not implemented in CNVrd. For the eleven loci, we used a “testThreshold2Merge” value of 0.35 and the same window size as CNVrd [FCGR3A and FCBR3B (1000 bp), RHD (2000 bp), UGT2B17 (500 bp), GSTT1 (1000 bp), IGLL3P (1000 bp), SMN2 (1000 bp), GSTM1 (200 bp), CFHR1 (500 bp), CNTNAP3 (2000 bp) and IGLL5 (1000 bp)].
Application of CNVrd2 to Two Complex Loci: CCL3L1 and DEFB103A
Windows of 500 and 1000 bp were used to analyze CCL3L1 and DEFB103A, respectively. Steps described above were used to obtain putative boundaries of CCL3L1/DEFB103A gene-containing regions and final segmentation scores for the two loci. For each locus, one population having clear clusters of segmentation scores was used to obtain prior information for all populations: the European and South Asian population for CCL3L1 and DEFB103A, respectively. This approach was implemented using the EM algorithm (Dempster et al., 1977). The results for the European and South Asian populations (means and variances of groups and the distances between the means of the groups) were used to provide prior information for a Bayesian normal mixture model that was applied to the other populations. This was done to improve model stability and fit for populations exhibiting high levels of CN polymorphism. The Markov chain Monte Carlo sampling method implemented in the rjags package (Plummer, 2011) was used to obtain posterior estimates for each normal mixture model parameter—this allows control of parameters using prior information. An adaptive phase of 100 iterations was run, followed by a burn-in period of 1000 iterations. Next, we ran 20,000 iterations and calculated the means, standard deviations, and proportions of the mixture components from 20% of the iterations. Convergence was assessed by using Heidelberger and Welch's stationarity and half-width test implemented in the coda package (Plummer et al., 2006).
Comparison with Other Methods: CCL3L1
Copy number assignments at CCL3L1 by cn.Mops (Klambauer et al., 2012), CNVnator (Abyzov et al., 2011) and Sudmant et al. (2010) were compared to assignments of CNVrd2 on the 180 samples measured by the modified PRT. To run CNVnator, we downloaded all of the chromosome 17 data for the 180 samples. CNVnator was applied as previously described (Nguyen et al., 2013). cn.Mops uses read-count information of single samples and multiple samples to detect CN variable regions and uses a Poisson mixture model to automatically infer CN. We used CNVrd2 to obtain matrices of read counts in the 2 Mb region (chr17:33670000-34670000) in eight different scenarios: constant windows of 25000, 20000, 10000, 5000, 2000, 1000, 500, and 200 bp with default values for other parameters. The 5000 bp window for cn.Mops had the highest proportion of samples having CN > 3 and the highest concordance with other methods and was used in the Figure 3 comparison. The Sudmant et al. (2010) read count-based method utilized all possible mapping locations of a read combined with singly unique nucleotide positions to measure CN for 169 samples from the 1000 Genomes Project at different loci, including the CCL3L1 gene. The CCL3L1 gene results were validated by using Q-PCR based assays with high correlation being observed (r = 0.95) (Sudmant et al., 2010). 111 of the 169 samples overlapped with the samples analyzed here using CNVrd2, and by Carpenter et al. (2011) using the PRT-based methods. The coordinates of CCL3L1 in the Sudmant et al. (2010) data were chr17:34623842-34625730 (hg19).
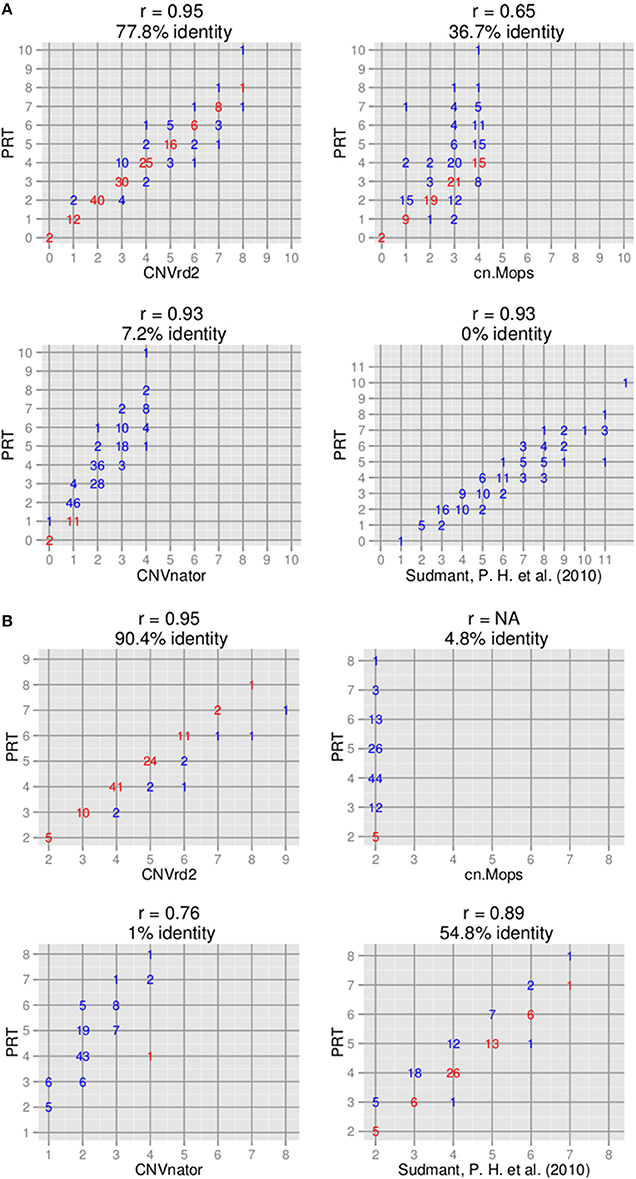
Figure 3. Comparison of copy number assignments of high-throughput sequencing-based with PRT-based methods. (A) CCL3L1 on 180 samples [only 111 samples measured by Sudmant et al. (2010) overlapped]. (B) DEFB103A on 104 samples.
Comparison with Other Methods: DEFB103A
The data sets of Sudmant et al. (2010) and Hardwick et al. (2011) were intersected and 104 samples were obtained that overlapped with the 2535 1000 Genomes samples we analyzed using CNVrd2. The coordinates of the DEFB103A gene in the Sudmant et al. (2010) data were chr8:7738913-7740180 (hg19). For CNVnator, we downloaded all of the chromosome 8 data for the 104 samples and used a similar approach as for CCL3L1. For cn.Mops, we used CNVrd2 to obtain matrices of read counts in the 2 Mb region (chr8:6500000-8500000) for 2535 samples in eight different scenarios: constant windows of 25000, 20000, 10000, 5000, 2000, 1000, 500, and 200 bp with default values for other parameters. The 10000 bp window was the only window length to call CN (six samples assigned CN = 3, the remainder assigned CN = 2) and was used in the Figure 3 comparison.
LiftOver (Meyer et al., 2013) on the UCSC Genome browser was used to convert coordinates of microarray data and the Sudmant et al. (2010) data from Human Reference Genome hg18 to Human Reference Genome hg19.
Results
Data
Alignment results are presented in Figure 4. At CCL3L1 a total of 395,078,047 reads across all samples were aligned to a 2 Mb region around the gene (Chr17:33670000-35670000). These reads had lengths ranging from 36 to 160 bp (median of 91.5 bp and the highest frequency, 44.9%, was 100 bp), and mapping qualities from 0 to 70 (median of 33.5 and the highest frequency, 73.4%, was 60). The majority of reads (73.5% and 72.5%) aligning to the CCL3L1-containing region (chr17:34617501-3465201) and CCL3L1 gene (Chr17:34623842-34625730) had a mapping quality of 0, presumably reflecting multiple alignments to the paralogs within the locus.
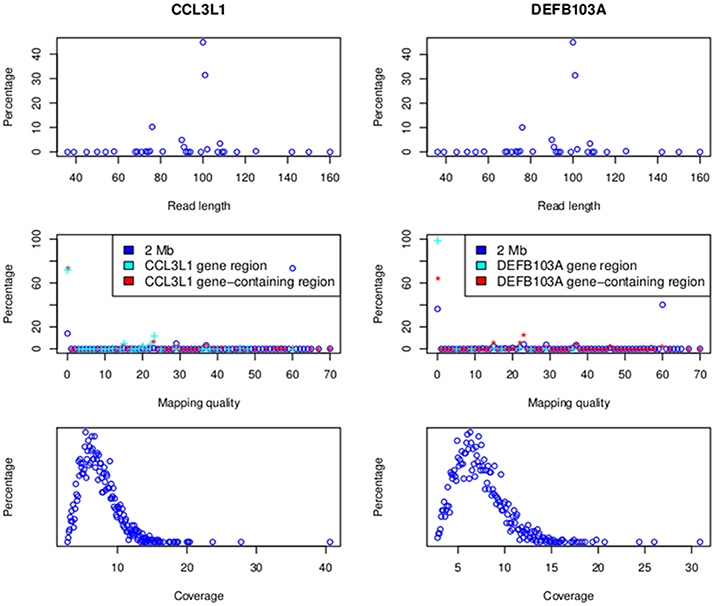
Figure 4. Read lengths and mapping qualities (top), mapping qualities (middle) and average read depth (bottom). Data for the 2 MB CCL3L1 region are on the left and the 2 Mb DEFB103A region on the right.
A total of 386,195,488 reads across all samples were aligned to the 2 Mb region on Chr 8 (Chr8:6500000-8500000) around the defensin genes (Figure 4). These reads had lengths ranging from 36 to 160 bp (median of 91.5 bp and the highest frequency, 45%, was 100 bp), and mapping qualities from 0 to 70 (median of 33.5 and the highest frequency, 40.2%, was 60). The majority of reads (64.1 and 99%, respectively) aligning to the DEFB103A-containing gene (chr8:7641001-7742001) and DEFB103A region (Chr8:7738726-7740105) had a mapping quality of 0. The average coverage of 2535 samples on the 2 Mb region was between 2.8 and 30.9× with a median of 6.9× (Figure 4).
CNVrd2: Inferring Reliable Values for Parameters
We used eight loci derived from the data sets of two microarray approaches (Conrad et al., 2010; Campbell et al., 2011) to obtain parameters of CNVrd2. CNVrd2 had good performance when the window size was 200 or 500 bp and a testThreshold2Merge value of 0.35 was used (Figure 5). A small window size (e.g., 100 bp) was not stable at all loci, possibly because there were multiple low-coverage samples in the 1000 Genomes Project data (e.g., 464/2535 = 18.2% samples having coverage in the CCL3L1 gene-containing 2 Mb region < 5×, Figure 4). This could lead to some windows having very low read counts, and thus being segmented incorrectly. For example, some windows in normal regions (i.e., CN = 2) would be segmented into deleted regions or some windows in duplicated regions would be segmented into normal regions. Similarly, large windows (e.g., 5000 bp) also generated unreliable results (Figure 5).
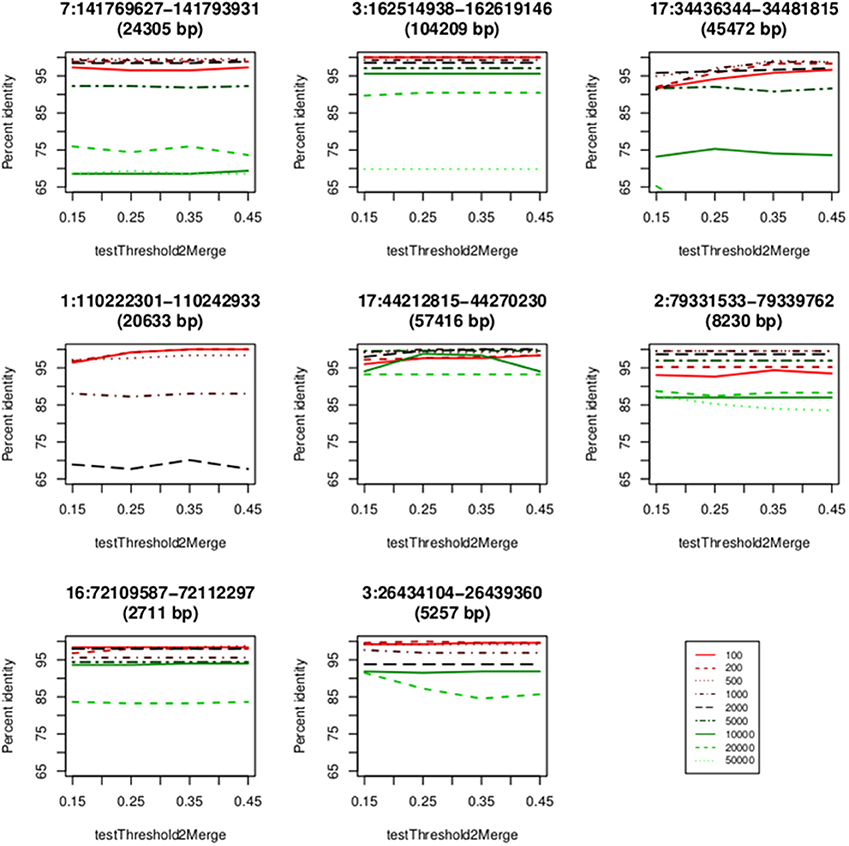
Figure 5. Concordance between the CNVrd2 and microarray based results. The x-axis contains the values of testThreshold2Merge (0.15, 0.25, 0.35, 0.45). The y-axis is the percentage of identical results.
CNVrd2: Comparison with CNVrd at Eight Test Loci
Our previous work was focused on loci having low copy-number ranges. Even though this present study is concentrated on loci with CN range from zero to >5 CN, we also compared with CNVrd (Nguyen et al., 2013) to assess the performance of the modified pipeline, especially in the steps requiring obtaining and adjusting segmentation scores for each sample. Loci used in this comparison had copy number ranging from 0 to 5, and their boundaries were known (Table 3 and Nguyen et al., 2013). Therefore, a simple normal mixture model was used in CNVrd2 to cluster segmentation scores into different groups. CNVrd2 had more stable results than those of CNVrd at almost all window sizes (Figures 5, 6). Merging sub-regions and adjusting boundaries (Step D and E, Figure 1) produced more reliable results for CNVrd2 at two complex regions (chr17:34436344-34481815 and chr1:110222301-110242933). At these two regions, CNVrd showed very low concordance with microarray-based approaches (Figure 6).
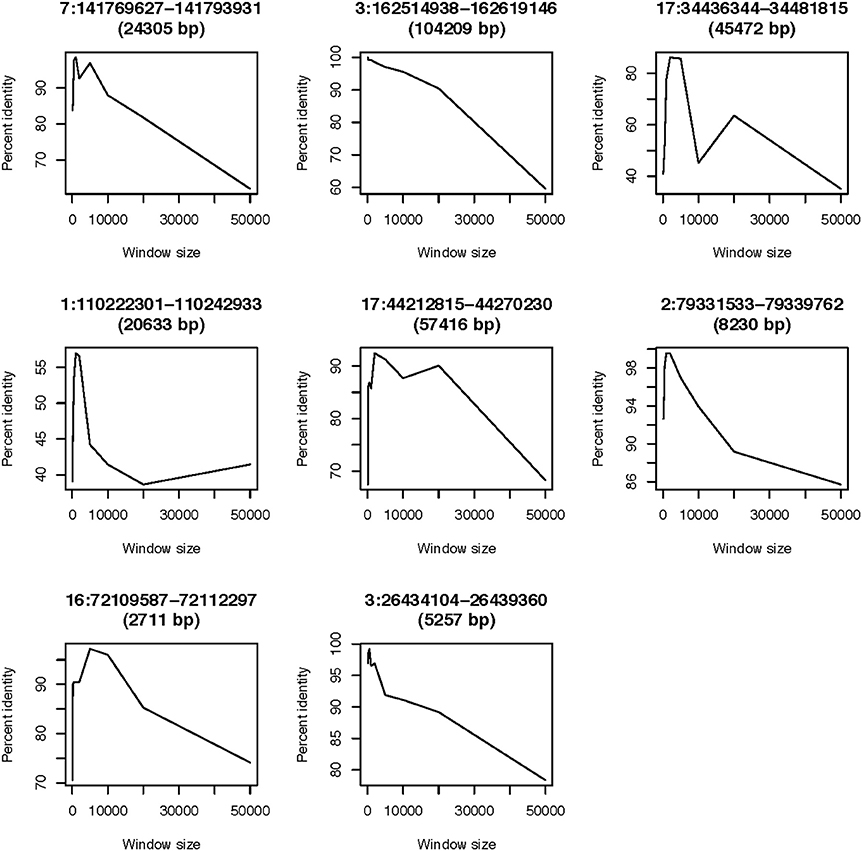
Figure 6. Concordance between the CNVrd and microarray based results. Window sizes are shown on the x-axis, while the y-axis shows the percentage of identical results.
CNVrd2: Comparison with the Eleven Loci used in CNVrd
We also applied CNVrd2 to eleven CNV regions (including FCGR3A/3B) to which CN was assigned using CNVrd in our previous work (Nguyen et al., 2013). Better concordances were seen at five loci for CNVrd2 (CFHR1: 94.29/91.9%, RHD: 99.05/98.57%, GSTM1: 95.24/93.81%, SMN2: 90.95/88.1%, UGT2B17: 99.05/97.14%) and the same concordances were seen at the other four loci (GSTT1: 94.76%, IGLL5: 95.24%, CNTNAP3: 81.43%, IGLL3P: 99.52%). For FCGR3A and FCGR3B, applying CNVrd2 to the same set of 952 samples in our previous work produced slightly higher concordances than for CNVrd when compared with PRT-based CN assignments (Hollox et al., 2009) (FCGR3A: 84.2/82% and FCGR3B:83.5/82.7% for CNVrd2 and CNVrd, respectively).
Application of CNVrd2 to Two Complex Loci; CCL3L1 and DEFB103A
Information on read length, mapping quality, read depth and read count ratios is presented in Subjects and Methods (“HTS and microarray data used”) and in Figure 4.
Based on the results of the eight test loci (above, Figures 5, 6), the BAM files were processed using 500 bp windows for CCL3L1 and 1000 bp windows for DEFB103A, and a testThreshold2Merge = 0.35. 1000 bp windows were chosen for DEFB103A because there was higher correlation between segmentation scores of DEFB103A and DEFB103B than for 500 bp windows (r = 0.80 and 0.78, respectively). Owing to the small length of each gene (1888 bp for CCL3L1 and 1379 bp for DEFB103A) larger window sizes were not investigated as this could result in not detecting breakpoints nearby or inside the genes.
Polymorphism of the CCL3L1 Locus
Using a 2 Mb region it took approximately 3 h to assign copy number at CCL3L1 on 2535 samples using a 4-core computer with 8 Gb memory. Standard deviations and different percentiles of the segmentation results of sub-regions on the 2-Mb region were calculated to visually detect this region. Using a standard deviation threshold of 0.5, we identified CCL3L1 within a large polymorphic CN variable region of approximately 329 kb (chr17:34436001-34815000, which included a 50 kb gap) (Figure 7). This region included small CNV blocks of clearly defined increased standard deviation (SD) which suggested that there would be multiple recombination events inside the CNV region. CCL3 was outside this region, CCL4 was at the boundary, while CCL3L1 was in a second block with CCL3L3 and CCL4L1. The CCL3L1 gene was located in a sub-region which had SDs fluctuating around 0.84 and 0.85. CCL3L3 and CCL4L1 were also in a sub-region with SDs fluctuating around 0.83 and 0.86, but these sub-regions were separated from the CCL3L1 gene-containing sub-regions by a decrease (0.8) in SDs between two blocks (Figure 7). We merged these sub-regions and the boundaries of the CCL3L1-containing region were chr17:34617501-34652500. Using CNVrd2, we obtained segmentation scores for both the CCL3L1 gene-containing region and the larger CCL3L1 region. The segmentation scores of the two regions were strongly correlated (r = 0.98, Figure 8).
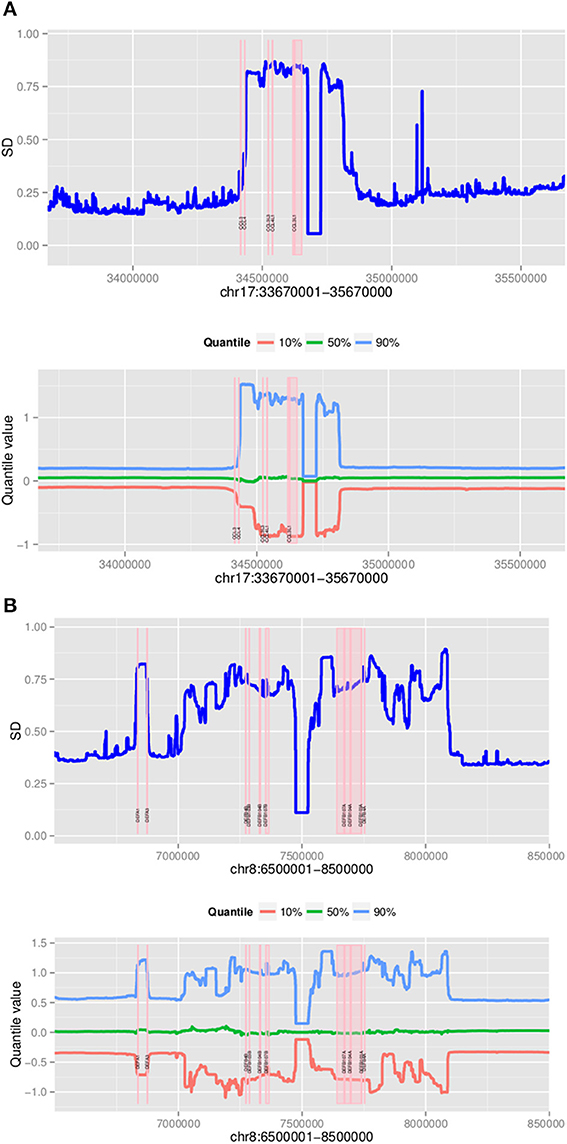
Figure 7. Plots of polymorphic regions encompassing CCL3L1 (A) and DEFB103A (B). The plots show standard deviation (top) and different percentiles (bottom) across 2 Mb sub-regions (for all 2535 samples).
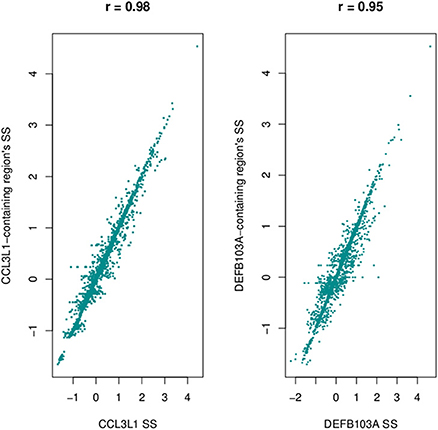
Figure 8. Correlation between segmentation scores of CCL3L1/DEFB103A and polymorphic regions encompassing the genes.
Assigning CCL3L1 Copy Number
The European CCL3L1 segmentation results from the smaller 35kb gene-containing region were assigned by CNVrd2 to five groups (Figure 9). All clusters were clearly delineated, although the highest group exhibited some scatter. The results obtained from the EM algorithm applied to the European samples were used as prior information to obtain CCL3L1 CN estimates for the 2535 samples from the 1000 Genomes Project. The final segmentation scores across all samples ranged from −1.66 to 4.53 (Figure 9), with only one score being larger than 3.42. This value was considered to be an outlier, and the associated sample (HG00620 in the CHS population) was assigned to the largest copy number group with a probability of 1. Thus, the segmentation score range used to determine the number of groups was between −1.66 and 3.42. The distances between the groups in the European population ranged between 0.39 and 0.62. As a result, 10 groups were chosen to encompass the range of CN values for the full collection of samples. The Markov Chain Monte Carlo chain was convergent after 10,000 iterations and the segmentation scores were clustered into 10 groups corresponding to CN from 0 to ≥9 (Figure 9).
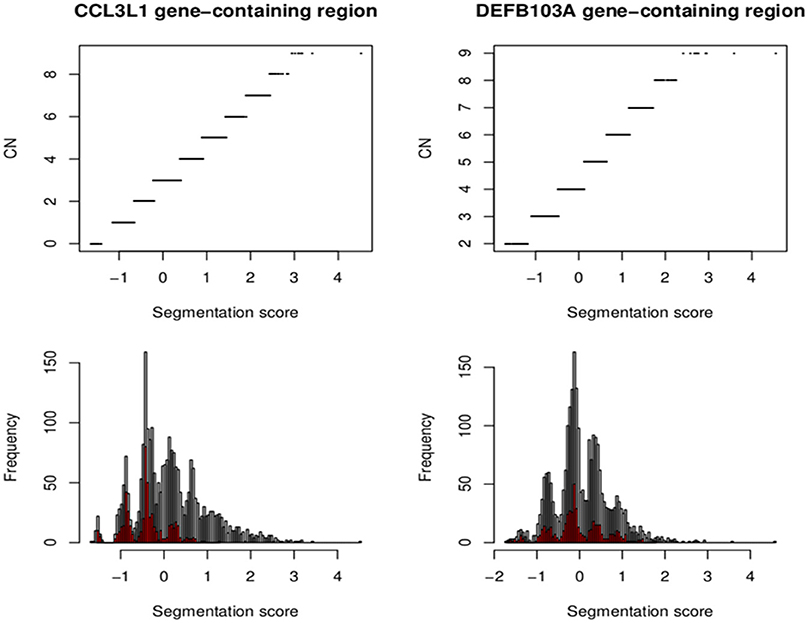
Figure 9. Segmentation scores and CN groups at the CCL3L1 and DEFB103A loci. Segmentation scores of all populations (bottom). Small populations (European for CCL3L1 and South Asian for DEFB103A) are in red. The top pictures show segmentation scores and their CN groups.
The CN assignments for European-ancestry populations ranged between 0 and 5, with the highest frequency (43.6%, 220/505) being 2 copies (Table 1). Similar to the European-ancestry populations, CN = 2 was the most common (42.1%; 208/494 samples) in the South Asian sample set. The East Asian sample set had CN between 0 and ≥9, with the most common being CN = 3 (36.7%, 189/515). CN = 3 was also the most frequent in the Americas sample set, with the highest CN = 8. The African sample sets had no individuals having 0 copies and just 10 samples (1.5%) having 1 copy, with 3–5 copies being the most common (Table 1).
Validation of CCL3L1 CN Assignments with Paralog Ratio Test (PRT) Data
The CNVrd2 results on 180 of the samples were compared to data where CCL3L1 CN had previously been determined using PRT—45 European samples measured by Carpenter et al. (2011) and 135 African and Asian samples measured by Janyakhantikul et al. (2010). There was 77.8% (140/180) identity between the two methods (Figure 3A). The majority of discordant results were for high CN samples and differences were of one CN.
Comparison of CNVrd2 with Other Read Depth-Based Methods at CCL3L1
The packages CNVnator (Abyzov et al., 2011) and cn.Mops (Klambauer et al., 2012) were compared to CNVrd2 (refer also to Subjects and Methods). In addition, we also used the 159 genome data set of Sudmant et al. (2010). Copy number for samples in this data set were measured using a read depth-based method, but the authors used the mrsFAST aligner (Hach et al., 2010) which obtains all possible positions of a read. The concordance rates for CNVnator, cn.Mops, and the approach of Sudmant et al. (2010) with CCL3L1 PRT-based results were 7.2% (13/180, r = 0.95), 36.7% (66/180, r = 0.65), and 0% (0/111, r = 0.93) respectively (Figure 3). The highest CNs called by CNVnator and cn.Mops were only 5 and 4 respectively. CN assignments of Sudmant et al. (2010) were significantly higher than the modified PRT results, although assignments of the two methods were highly correlated (r = 0.93) (Figure 3).
To investigate the discordant results of the other packages with the PRT-based method at CCL3L1, observed read-count ratios of European sample sets and all 2535 samples were calculated for both the CCL3L1 gene region and CCL3L1-containing region (Figure 10). The two medians of these ratios were considerably less than 1 (0.7 and 0.8, respectively), while the expected median was 1. For the larger CCL3L1-containing region, 74.7% (1893/2535) of samples had ratio <1, 76.4% (1938/2535) for the 35kb CCL3L1 region. Reads of samples having zero copies which were aligned to CCL3L1 gene region were very close to zero (Table 4), and thus the density of reads at CCL3L1 was not as high as expected. Approaches based solely on read depth with no cross-sample standardization would therefore have difficulty in accurately assigning CCL3L1 CN, especially for high-CN samples, which would be assigned to lower-CN groups.
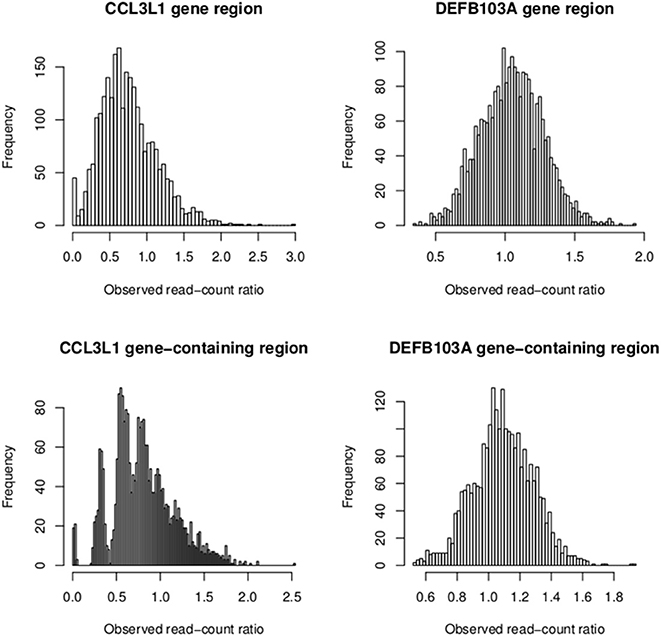
Figure 10. Observed read-count ratios of samples at the CCL3L1/DEFB103A gene (medians: 0.7 and 1 respectively) and the CCL3L1/DEFB103A-containing region (medians: 0.8 and 1 respectively).
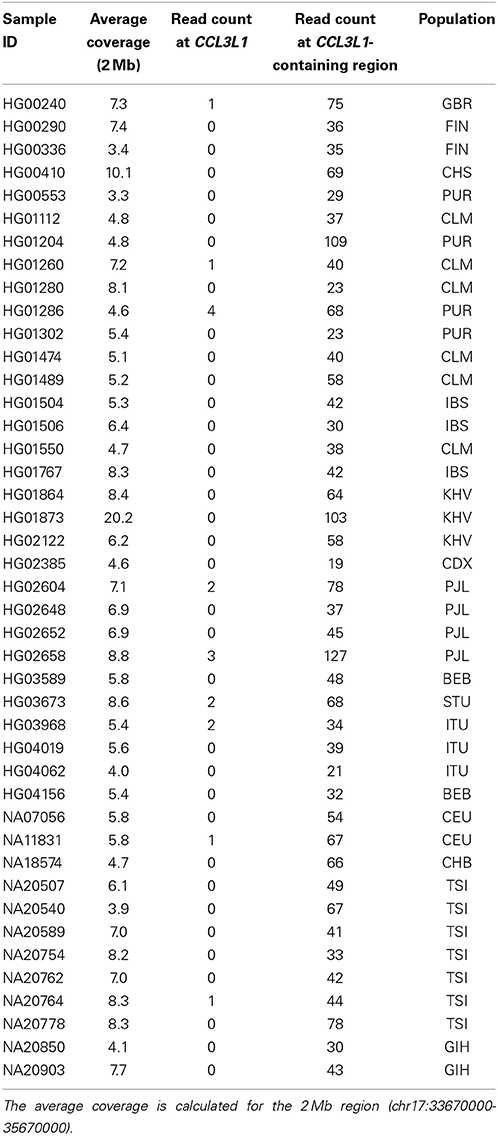
Table 4. Read counts at the CCL3L1 gene (chr17:34623842-34625730) (1.9 kb) of samples called 0 copies by CNVrd2.
Polymorphism of the DEFB103A Locus
The DEFB103A region lies within a polymorphic inversion with complex structure (Sugawara et al., 2003). We used quantile values and standard deviations across sub-regions to visually identify the boundaries of the polymorphism encompassing the gene. Using a standard deviation threshold of 0.5, DEFB103A was identified within a large CN polymorphic region (consistent with Groth et al., 2008) of 1078 kb (chr8:70200000-7474000 7532001-8098000 including a 58 kb gap) (Figure 7). This CNV region also included small polymorphic blocks which suggested that there would be multiple recombination events inside the CNV region. DEFB103A was in the same block as DEFB104A and DEFB107A. The standard deviations of this block fluctuated around 0.70 and 0.74. We merged these sub-regions and the boundaries of the DEFB103A gene-containing region were chr8:7641001-7742000. The segmentation scores of this region and the larger DEFB103A gene region were strongly correlated (r = 0.95, Figure 8). We used this region to calculate CN for DEFB103A. The DEFB4A gene was outside this block owing to a relatively high peak (SD was 0.81 whilst the maximum SD of the DEFB103A gene-containing region was only 0.74) between DEFB4A and the DEFB103A block (Figure 7).
We also calculated segmentation scores of DEFB103B (paralog of DEFB103A) to compare segmentation scores of this gene and those of the DEFB103A gene-containing region. The segmentation scores of the two regions were not as highly correlated (r = 0.83), but they made clear clusters of distinct groups (Figure 11).
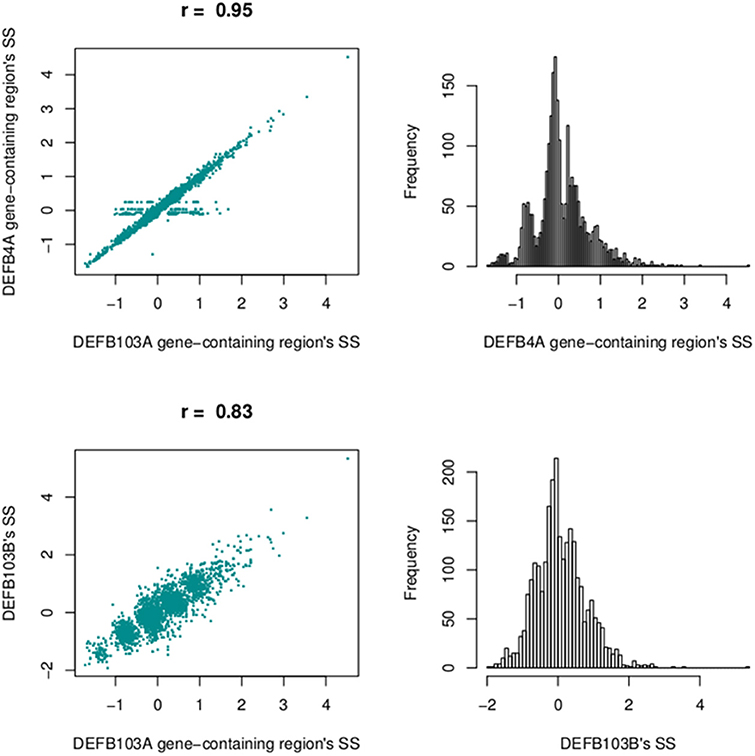
Figure 11. Correlation between segmentation scores of the DEFB103A gene-containing region and the enlarged region encompassing DEFB4A (top left) and the DEFB103B gene region (bottom left). On the right are histograms of segmentation scores of the enlarged region (top) and DEFB103B region (bottom).
Assignment of DEFB103A CN
The segmentation scores of the gene had clear clusters (Figure 9) with some scattered values >3, therefore these values were allocated into the largest (>3) group. The South Asian population had the clearest clusters therefore we used this population to obtain prior information and ran the EM algorithm upon the segmentation score with six groups. The distances between the groups were 0.50–0.69 therefore 0.57 was set as the prior distance. Eight groups were defined for all segmentation scores and CNVrd2 was used to assign DEFB103A copy-number using similar parameters as for CCL3L1 in the Bayesian clustering process (Table 2). Because the observed read count ratio range was reasonable (0.53–1.93) (Figure 11), this suggested that the lowest CN was greater than zero, with the scattering of values on the left (Figure 9) assigned to the smallest group (CN = 2) during the clustering process. A CN of 4 was the most common in all populations (Table 2; 26.3–47.9%), consistent with previous reports (Armour et al., 2007; Hardwick et al., 2011).
CNVrd2 obtained high concordance with PRT-based methods (90.4%, r = 0.95, 94/104) (Figure 3). PRT CN assignments for 104 samples were available (Hardwick et al., 2011) that also overlapped with the samples analyzed by Sudmant et al. (2010). The concordances between Sudmant et al. (2010), CNVnator (Abyzov et al., 2011) and cn.mops (Klambauer et al., 2012) (using 10 kb windows for cn.mops) with PRT-based methods were 54.8% (57/104), 1% (1/104) and 4.8% (5/104) respectively. The majority of differences between CNVrd2, Sudmant et al. (2010) and the PRT-based methods were one copy.
Discussion
The CNVrd2 package, depicted in Figure 1, is an improved version of CNVrd previously used to assign CN at the FCGR locus (Nguyen et al., 2013). CNVrd2 was designed to correct issues that can occur during the segmentation process which can result in CNVrd assigning a segmentation score of zero, resulting in some samples being assigned to unreasonable CN groups. In addition, in CNVrd2, a linear regression model was used to adjust the differentiation in CN between populations. Clustering data into different groups is challenging at complex loci with high ranges of CN. Therefore, a Bayesian clustering strategy was integrated into CNVrd2 in order to obtain more reliable results at CCL3L1 and DEFB103A. Finally, plots of percentiles and standard deviations of segmentation results were also added to CNVrd2. These can be used as visual tools to identify copy-number variable regions encompassing loci being measured (Figure 7). In evaluating our results, it should be noted that CNVrd2 was developed on the FCGR and CCL3L1 loci. Therefore, the concordance comparisons are biased toward CNVrd2. However DEFB103A can be regarded as a genuine test locus, on which CNVrd2 performed well (Figure 3). There is a paucity of loci for which published PRT gold-standard data are available on complex CN loci.
CNVrd2 obtains higher concordance with PRT-based methods than other CN-assigning approaches. However the concordance was not 100% (Figure 3; 77.8% at CCL3L1 and 90.4% at DEFB103A), which would limit its use in case-control analysis of complex CN loci in common disease. We used BWA alignments from the 1000 Genomes Project, where the majority of mapping qualities were zero owing to reads having multiple hits within segmental duplications. Further improvement of CNVrd2 could come from the use of alignments better optimized to detect CNV, such as mrsFAST (Hach et al., 2010) which allows diverged paralogs (1–2% difference) to be differentiated. It is important also to stress that CNVrd2 was developed to measure CN at specified loci, while other comparison packages are more automated approaches that both detect CNV and assign CN. CNVrd2 is automated to produce individual segmentation scores at a locus and assign CN using the Bayesian Information Criterion (Schwarz, 1978). However it is better to manually undertake the clustering process as we did in this study. The reason is that clear clusters were not seen at complex loci CCL3L1 and DEFB103A. Note that CNVrd2 is enhanced by some prior knowledge of CN.
From the observed read count ratio analysis (Figure 10), it can be seen that if only the read-count information from one sample is used to assign CN (as is done by CNVnator) the majority of samples at the CCL3L1 locus would likely be called as deletions because of the inherently low number of reads in that region, possibly resulting from CCL3L1 reads mapping to paralogs nearby. The majority of populations had observed read-count ratios of less than 1. This could also be the reason that the cn.Mops package did not call high CN for multiple samples (Figure 3). Complete discordance was seen between the Sudmant et al. (2010) CCL3L1 results obtained using multiple hits of a read and all other methods (Figure 3). The results of Sudmant et al. (2010) had been validated by PCR-based methods with good correlation. It is important to note that PCR-based methods are unreliable in measuring complex gene CN (Walker et al., 2009; McKinney and Merriman, 2012)—any differences in amplification efficiency that alters the ratio between the test and reference genes will alter the apparent CN (Armour et al., 2007). One possible reason for the Sudmant et al. (2010) discordance could be the use of different clustering strategies, but it could also be due to using different alignment methods when there are >1 read-mapping possibilities: choosing a random position (CNVrd2) vs. using all possible positions for a read (Sudmant et al., 2010). We checked the only sample (NA11831) called CN = 1 by Sudmant et al. (2010) and zero by CNVrd2, cn.Mops, CNVnator, and PRT-based methods. There was only one read aligned to CCL3L1 (Table 4), while the average coverage for this sample on the 2 Mb region was adequate (5.8×). Similarly, checking all samples called as 0 copies by CNVrd2, we also saw that the number of reads aligned to the CCL3L1 gene region were extremely low (Table 4). This suggests that the sample NA11831 was correctly assigned CN = 0 for CCL3L1 by the PRT methods and the BWA aligner based next-generation sequencing methods (CNVrd2, CNVnator, cn.Mops).
At the beta-defensin locus, we identified a CNV region which had nearly equal standard deviations of sub-regions. This CNV region encompassed DEFB103A. The segmentation scores of this and the DEFB103B region (Figure 7; on the polymorphic section before the gap) were moderately correlated (r = 0.83) but they made clear clusters of different groups (Figure 11). This suggested that individual CNs of the two regions would be nearly identical. However, the identified region did not include the DEFB4A gene because we saw a high peak between the region and DEFB4A gene (Figure 7). We retested with different windows (500 and 2000 bp) and still observed this peak (data not shown). An enlarged region that included the peak and DEFB4A was strongly correlated with the smaller region (r = 0.95) but had multiple samples with a score of zero, because in CNVrd2 if a region was segmented into different sub-regions having different signs then the segmentation score of the region was assigned to zero. This suggested that there was not full duplication of the enlarged region (Figure 11). This situation could occur because of an error in the alignment process, or because there were heterogenous breakpoints within the enlarged region.
At the complex CCL3L1 and DEFB103A loci CNVrd2 assigned CN with greater accuracy than the other read depth-based CN assignment methods CNVnator and cn.Mops. The CNVrd2 package is implemented in R (as of version 3.0.1) and is available from Bioconductor (as of version 2.14) at http://www.bioconductor.org/packages/release/bioc/html/CNVrd2.html, where installation and usage instructions can be found.
Author Contributions
All authors made substantial contributions to the conception or design of the work and the acquisition, analysis, or interpretation of data for the work, drafting of the work and critical revision. All authors approved the final version and agree to be accountable for all aspects of the work.
Conflict of Interest Statement
The authors declare that the research was conducted in the absence of any commercial or financial relationships that could be construed as a potential conflict of interest.
Acknowledgments
We are grateful to Danielle Carpenter, Ed Hollox, and John Armour for kindly supplying us with CN results measured using the multiplex PRT-based methods, and Peter Sudmant and Evan Eichler for kindly supplying us with CN results measured by read-depth. The Virtual Institute of Statistical Genetics (www.visg.co.nz) is thanked for funding this research, including the Ph.D. stipend of HTN.
References
Abyzov, A., Urban, A. E., Snyder, M., and Gerstein, M. (2011). CNVnator: an approach to discover, genotype, and characterize typical and atypical CNVs from family and population genome sequencing. Genome Res. 21, 974–984. doi: 10.1101/gr.114876.110
Aldhous, M. C., Bakar, S. A., Prescott, N. J., Palla, R., Soo, K., Mansfield, J. C., et al. (2010). Measurement methods and accuracy in copy number variation: failure to replicate associations of beta-defensin copy number with Crohn's disease. Hum. Mol. Genet. 19, 4930–4938. doi: 10.1093/hmg/ddq411
Armour, J. A., Palla, R., Zeeuwen, P. L., Den Heijer, M., Schalkwijk, J., and Hollox, E. J. (2007). Accurate, high-throughput typing of copy number variation using paralogue ratios from dispersed repeats. Nucleic Acids Res. 35, e19. doi: 10.1093/nar/gkl1089
Bentley, R. W., Pearson, J., Gearry, R. B., Barclay, M. L., McKinney, C., Merriman, T. R., et al. (2010). Association of higher DEFB4 genomic copy number with Crohn's disease. Am. J. Gastroenterol. 105, 354–359. doi: 10.1038/ajg.2009.582
Burns, J. C., Shimizu, C., Gonzalez, E., Kulkarni, H., Patel, S., Shike, H., et al. (2005). Genetic variations in the receptor-ligand pair CCR5 and CCL3L1 are important determinants of susceptibility to Kawasaki disease. J. Infect. Dis. 192, 344–349. doi: 10.1086/430953
Campbell, C. D., Sampas, N., Tsalenko, A., Sudmant, P. H., Kidd, J. M., Malig, M., et al. (2011). Population-genetic properties of differentiated human copy-number polymorphisms. Am. J. Hum. Genet. 88, 317–332. doi: 10.1016/j.ajhg.2011.02.004
Carpenter, D., Walker, S., Prescott, N., Schalkwijk, J., and Armour, J. (2011). Accuracy and differential bias in copy number measurement of CCL3L1 in association studies with three auto-immune disorders. BMC Genomics 12:418. doi: 10.1186/1471-2164-12-418
Conrad, D. F., Pinto, D., Redon, R., Feuk, L., Gokcumen, O., Zhang, Y., et al. (2010). Origins and functional impact of copy number variation in the human genome. Nature 464, 704–712. doi: 10.1038/nature08516
Dempster, A. P., Laird, N. M., and Rubin, D. B. (1977). Maximum likelihood from incomplete data via the EM algorithm. J. R. Stat. Soc. B (Methodological) 39, 1–38.
Freeman, J. L., Perry, G. H., Feuk, L., Redon, R., McCarroll, S. A., Altshuler, D. M., et al. (2006). Copy number variation: new insights in genome diversity. Genome Res. 16, 949–961. doi: 10.1101/gr.3677206
Gonzalez, E., Kulkarni, H., Bolivar, H., Mangano, A., Sanchez, R., Catano, G., et al. (2005). The influence of CCL3L1 gene-containing segmental duplications on HIV-1/AIDS susceptibility. Science 307, 1434–1440. doi: 10.1126/science.1101160
Groth, M., Szafranski, K., Taudien, S., Huse, K., Mueller, O., Rosenstiel, P., et al. (2008). High−resolution mapping of the 8p23. 1 beta−defensin cluster reveals strictly concordant copy number variation of all genes. Hum. Mutat. 29, 1247–1254. doi: 10.1002/humu.20751
Hach, F., Hormozdiari, F., Alkan, C., Hormozdiari, F., Birol, I., Eichler, E. E., et al. (2010). mrsFAST: a cache-oblivious algorithm for short-read mapping. Nat. Methods 7, 576–577. doi: 10.1038/nmeth0810-576
Hardwick, R. J., Machado, L. R., Zuccherato, L. W., Antolinos, S., Xue, Y., Shawa, N., et al. (2011). A worldwide analysis of beta−defensin copy number variation suggests recent selection of a high−expressing DEFB103 gene copy in East Asia. Hum. Mutat. 32, 743–750. doi: 10.1002/humu.21491
He, W., Kulkarni, H., Castiblanco, J., Shimizu, C., Aluyen, U., Maldonado, R., et al. (2009). Reply to:“CCL3L1 and HIV/AIDS susceptibility” and “Experimental aspects of copy number variant assays at CCL3L1.” Nat. Med. 15, 1117–1120. doi: 10.1038/nm1009-1117
Hollox, E. J., Detering, J. C., and Dehnugara, T. (2009). An integrated approach for measuring copy number variation at the FCGR3 (CD16) locus. Hum. Mutat. 30, 477–484. doi: 10.1002/humu.20911
Janyakhantikul, S., Carpenter, D., and Armour, J. A. (2010). Evolution of haplotypes at CCL3L1/CCL4L1. Genome Biol. 11:P20. doi: 10.1186/gb-2010-11-s1-p20
Klambauer, G., Schwarzbauer, K., Mayr, A., Clevert, D. A., Mitterecker, A., Bodenhofer, U., et al. (2012). cn.MOPS: mixture of Poissons for discovering copy number variations in next-generation sequencing data with a low false discovery rate. Nucleic Acids Res. 40, e69. doi: 10.1093/nar/gks003
Lee, H., Bae, S., Choi, B. W., Choi, J. C., and Yoon, Y. (2011). Copy number variation of CCL3L1 influences asthma risk by modulating IL-10 expression. Clin. Chim. Acta 412, 2100–2104. doi: 10.1016/j.cca.2011.07.017
Li, H., Handsaker, B., Wysoker, A., Fennell, T., Ruan, J., Homer, N., et al. (2009). The sequence alignment/map format and SAMtools. Bioinformatics 25, 2078–2079. doi: 10.1093/bioinformatics/btp352
Liu, S., Yao, L., Ding, D., and Zhu, H. (2010). CCL3L1 copy number variation and susceptibility to HIV-1 infection: a meta-analysis. PLoS ONE 5:e15778. doi: 10.1371/journal.pone.0015778
Mamtani, M., Rovin, B., Brey, R., Camargo, J. F., Kulkarni, H., Herrera, M., et al. (2008). CCL3L1 gene-containing segmental duplications and polymorphisms in CCR5 affect risk of systemic lupus erythaematosus. Ann. Rheum. Dis. 67, 1076–1083. doi: 10.1136/ard.2007.078048
Marques, R. B., Thabet, M. M., White, S. J., Houwing-Duistermaat, J. J., Bakker, A. M., Hendriks, G. J., et al. (2010). Genetic variation of the Fc gamma receptor 3B gene and association with rheumatoid arthritis. PLoS ONE 5:e13173. doi: 10.1371/journal.pone.0013173
McKinney, C., Broen, J., Vonk, M., Beretta, L., Hesselstrand, R., Hunzelmann, N., et al. (2012). Evidence that deletion at FCGR3B is a risk factor for systemic sclerosis. Genes Immun. 13, 458–460. doi: 10.1038/gene.2012.15
McKinney, C., Fanciulli, M., Merriman, M. E., Phipps-Green, A., Alizadeh, B. Z., Koeleman, B. P., et al. (2010). Association of variation in Fcγ receptor 3B gene copy number with rheumatoid arthritis in Caucasian samples. Ann. Rheum. Dis. 69, 1711–1716. doi: 10.1136/ard.2009.123588
McKinney, C., Merriman, M. E., Chapman, P. T., Gow, P. J., Harrison, A. A., Highton, J., et al. (2008). Evidence for an influence of chemokine ligand 3-like 1 (CCL3L1) gene copy number on susceptibility to rheumatoid arthritis. Ann. Rheum. Dis. 67, 409–413. doi: 10.1136/ard.2007.075028
McKinney, C., and Merriman, T. R. (2012). Meta-analysis confirms a role for deletion in FCGR3B in autoimmune phenotypes. Hum. Mol. Genet. 21, 2370-2376. doi: 10.1093/hmg/dds039
Mehlotra, R. K., Dazard, J.-E., John, B., Zimmerman, P. A., Weinberg, A., and Jurevic, R. J. (2012). Copy number variation within human β-defensin gene cluster influences progression to AIDS in the multicenter AIDS cohort study. J. AIDS Clin. Res. 3:1000184. doi: 10.4172/2155-6113.1000184
Meyer, L. R., Zweig, A. S., Hinrichs, A. S., Karolchik, D., Kuhn, R. M., Wong, M., et al. (2013). The UCSC Genome Browser database: extensions and updates 2013. Nucleic Acids Res. 41, D64–D69. doi: 10.1093/nar/gks1048
Nguyen, H. T., Merriman, T. R., and Black, M. A. (2013). CNVrd, a read-depth algorithm for assigning copy-number at the FCGR locus: population-specific tagging of copy number variation at FCGR3B. PLoS ONE 8:e63219. doi: 10.1371/journal.pone.0063219
Plummer, M. (2011). Rjags: Bayesian Graphical Models using MCMC. R package version 2.2. Available online at: http://cran.r-project.org/web/packages/rjags/index.html
Plummer, M., Best, N., Cowles, K., and Vines, K. (2006). CODA: convergence diagnosis and output analysis for MCMC. R News 6, 7–11. Available online at: http://cran.r-project.org/doc/Rnews/Rnews_2006-1.pdf#page=7
Schwarz, G. (1978). Estimating the dimension of a model. Ann. Stat. 6, 461–464. doi: 10.1214/aos/1176344136
Sudmant, P. H., Kitzman, J. O., Antonacci, F., Alkan, C., Malig, M., Tsalenko, A., et al. (2010). Diversity of human copy number variation and multicopy genes. Science 330, 641–646. doi: 10.1126/science.1197005
Sugawara, H., Harada, N., Ida, T., Ishida, T., Ledbetter, D. H., Yoshiura, K.-I., et al. (2003). Complex low-copy repeats associated with a common polymorphic inversion at human chromosome 8p23. Genomics 82, 238–244. doi: 10.1016/S0888-7543(03)00108-3
Walker, S., Janyakhantikul, S., and Armour, J. A. (2009). Multiplex paralogue ratio tests for accurate measurement of multiallelic CNVs. Genomics 93, 98–103. doi: 10.1016/j.ygeno.2008.09.004
Keywords: copy number variation, read depth, 1000 Genomes, CCL3L1, DEFB4
Citation: Nguyen HT, Merriman TR and Black MA (2014) The CNVrd2 package: measurement of copy number at complex loci using high-throughput sequencing data. Front. Genet. 5:248. doi: 10.3389/fgene.2014.00248
Received: 24 May 2014; Accepted: 09 July 2014;
Published online: 01 August 2014.
Edited by:
Alexandre V. Morozov, Rutgers University, USAReviewed by:
David John Studholme, University of Exeter, UKMikhail P. Ponomarenko, Institute of Cytology and Genetics of Siberian Branch of Russian Academy of Sciences, Russia
Copyright © 2014 Nguyen, Merriman and Black. This is an open-access article distributed under the terms of the Creative Commons Attribution License (CC BY). The use, distribution or reproduction in other forums is permitted, provided the original author(s) or licensor are credited and that the original publication in this journal is cited, in accordance with accepted academic practice. No use, distribution or reproduction is permitted which does not comply with these terms.
*Correspondence: Tony R. Merriman, Department of Biochemistry, University of Otago, 710 Cumberland Street, Dunedin 9054, New Zealand e-mail: tony.merriman@otago.ac.nz