 Lexiang Ji1,2
 Xiaoxiao Sun
 Ping Ma
 Robert J. Schmitz
- 1Department of Genetics, University of Georgia, Athens, GA, USA
- 2Institute of Bioinformatics, University of Georgia, Athens, GA, USA
- 3Department of Microbiology, University of Georgia, Athens, GA, USA
- 4Department of Statistics, University of Georgia, Athens, GA, USA
The development of whole-genome bisulfite sequencing (WGBS) has resulted in a number of exciting discoveries about the role of DNA methylation leading to a plethora of novel testable hypotheses. Methods for constructing sodium bisulfite-converted and amplified libraries have recently advanced to the point that the bottleneck for experiments that use WGBS has shifted to data analysis and interpretation. Here we present empirical evidence for an over-representation of reads from methylated DNA in WGBS. This enrichment for methylated DNA is exacerbated by higher cycles of PCR and is influenced by the type of uracil-insensitive DNA polymerase used for amplifying the sequencing library. Future efforts to computationally correct for this enrichment bias will be essential to increasing the accuracy of determining methylation levels for individual cytosines. It is especially critical for studies that seek to accurately quantify DNA methylation levels in populations that may segregate for allelic DNA methylation states.
Introduction
The ability to produce genome-wide data sets has radically changed during the last decade. With the advent of high-throughput sequencing, billions of short read data can be generated within days. Currently, one of the primary uses of these short reads is to explore genetic variation within the human population with the goal of linking variants to diseases. Identifying these causal associations is the first major step to understanding how diseases arise, how they manifest and how they can be treated. Additionally, these short reads are used to study a wide range of model systems and an ever-growing list of non-model systems. Although much of the energy in the scientific community focuses on genetic variants there are a growing number of scientists that are fascinated by the epigenome. The NIH Roadmap Epigenomics Mapping Consortium defines the epigenome as a map of features distributed throughout and on top of the genome (Bernstein et al., 2010). These features can include RNAs such as mRNAs, long non-coding RNAs and small RNAs, DNA-protein interactions, chromatin accessibility, nucleosome positioning, covalent modifications to histone tails and DNA methylation, to name a few. Understandably, refinement of epigenomic techniques lagged behind development of genomic DNA library preparation due to their demand for use and due to the difficulty in execution. Part of the reason for this sudden increase and interest in epigenomics is due to the standardization of protocols and analysis pipelines used to produce and interpret data. No longer is data generation the rate-limiting step. Instead, the ability to accurately analyze and interpret these data sets has become the major bottleneck in the daily workflow.
One of the most exciting technical advances in field of epigenomics was the development of methods to analyze DNA methylation at single-base resolution (Cokus et al., 2008; Lister et al., 2008). Generally referred to as whole-genome bisulfite sequencing (WGBS), these methods combine sodium bisulfite conversion (Hayatsu et al., 1970; Shapiro et al., 1973, 1974; Hayatsu, 1976; Frommer et al., 1992; Clark et al., 1994, 2006), the gold standard for determining DNA methylation states at individual cytosines, with high-throughput DNA sequencing. Using this technique, unmethylated cytosines are converted into uracils and then into thymines after PCR. The observation of cytosines in sequencing reads typically indicates that the cytosine was methylated, as methylcytosines are protected from conversion by treatment with sodium bisulfite. These methods are capable of testing approximately 90% of all cytosines in genomes studied to date. They also generate quantitative measurements of DNA methylation at each cytosine due to the multiple independent reads that align to a particular sequence. These methods were originally tested on Arabidopsis thaliana genomic DNA (Cokus et al., 2008; Lister et al., 2008) as this species has a relatively small genome size (∼150 Mb) compared to human genomes (∼3 Gb per haploid genome), which made testing and troubleshooting cost efficient. Since the first single base resolution DNA methylomes for A. thaliana surfaced, larger DNA methylomes have been sequenced such as humans (Lister et al., 2009), mice (Stadler et al., 2011), corn (Gent et al., 2013), and soybean (Schmitz et al., 2013a), but in general it is cost prohibitive to sequence large numbers of individual samples using this technique. As a result, reduced representation bisulfite sequencing (RRBS) was developed in which ∼1% of the genome is studied making it possible to investigate large numbers of individuals at the cost of surveying the entire genome (Meissner et al., 2005). Most recently, additional modifications to cytosines have been identified such as 5-hydroxymethylation, 5-formylcytosine, and 5-carboxylcytosine and methodologies have been developed to study the presence of some of these base modifications genome-wide (Booth et al., 2012, 2014; Yu et al., 2012).
The initial genome-wide maps of DNA methylation were invaluable for defining previously unexpected epigenomic signatures in a variety of systems, such as partially methylated domains and non-CG methylation in animals (Lister et al., 2009) and CHH islands in maize (Gent et al., 2013). Since these initial maps, WGBS has been used to study epigenome reprogramming of induced pluripotent stem cells (Lister et al., 2011), genomic imprinting in both plants (Gehring et al., 2009; Hsieh et al., 2009; Zemach et al., 2010; Calarco et al., 2012) and animals (Xie et al., 2012; Kobayashi et al., 2013; Shirane et al., 2013), germ line epigenome reprogramming in plants (Slotkin et al., 2009; Calarco et al., 2012; Ibarra et al., 2012; Creasey et al., 2014) and animals (Seisenberger et al., 2012; Jiang et al., 2013) and also to study the impact of genetic variation on DNA methylation (Schmitz et al., 2013a,b; Orozco et al., 2014). Clearly, mapping and analyses of DNA methylomes is a relatively young field with great potential for exciting discoveries in the next decade.
It is well established that there is a GC content bias in amplification of fragments of DNA used for high-throughput sequencing applications (Aird et al., 2011; Benjamini and Speed, 2012). As a result, methods were developed to avoid PCR amplification all together in the construction of DNA sequencing libraries (Kozarewa et al., 2009). However, this approach is not applicable to bisulfite-treated DNA as the uracils in the fragments would inhibit cluster formation on the instrument unless reagents could be customized to include a uracil-insensitive DNA polymerase. As a result, bisulfite-treated DNA is amplified for varying cycles of PCR to replace uracils in the DNA sequence and to amplify libraries as treatment with sodium bisulfite degrades DNA. The degradation of DNA by sodium bisulfite also creates limitations with regards to the types of samples that can be sequenced, as higher input amounts are often required for most protocols. Moreover, after bisulfite conversion, previously complementary strands are single stranded and will no longer anneal together. In fact, previous observations of bisulfite-conversion and PCR have uncovered strand biases that severely affects estimates of DNA methylation levels (Warnecke et al., 1997). Correction methods have been developed for targeted bisulfite PCR experiments, but these methods are not feasible for WGBS (Komori et al., 2011; Moskalev et al., 2011). Given that methylated DNA will retain higher GC content after bisulfite conversion and PCR compared to unmethylated DNA, over-representation of methylated DNA may occur in the construction of sequencing libraries. Although libraries can be constructed from lower input DNA samples such as those prepared from FFPE (formalin-fixed paraffin-embedded), sequence-capture or single cell approaches, there usually is a cost of increasing the total PCR cycles. This cost likely comes in the form of increasing any bias in read enrichment between methylated and unmethylated sequences at the same locus.
In this study, we explore the presence of an amplification bias created in fragments that retain higher GC content after sodium-bisulfite treatment with unmethylated sequences and with genomic DNA sequences. A strong positive correlation between DNA methylation levels and normalized read counts are observed in the WGBS data. Investigation of three different commercially available uracil-insensitive enzymes reveal differences in amplification bias of highly methylated and high GC content DNA sequences.
Materials and Methods
Plant and Fungal Material
The A. thaliana Col-0 accession was used for all. Plants were grown in 16 h day lengths and tissue was harvested from above ground rosette leaves 3 weeks after planting. DNA was isolated using the Qiagen (Valencia, CA, cat-69106, USA) DNeasy Plant Kit according to the manufacturer’s protocol. All Neurospora experiments were performed with the wild-type “Oak Ridge” strain (FGSC# 2489) obtained from the Fungal Genetics Stock Center (McCluskey et al., 2010). ∼1 × 10⁶ conidia/ml were germinated in 50ml of Vogel’s Minimal Medium with 1.5% sucrose and grown for 5 h.
Methylc-Sequencing Library Preparation
MethylC-seq libraries were prepared according to the following protocol (Urich et al., 2014), with the some modifications. Three different enzyme mixtures were used to amplify bisulfite-converted adapter ligated DNA: Kapa HiFi Uracil+ (cat-KK2802, Kapa Biosystems), Pfu Turbo Cx Hotstart DNA polymerase (Agilent Technologies, Santa Clara, CA, cat-600410, USA), and EpiMark (New England Biolabs., Ipswich, MA, cat-M0490S, USA). PCR cycle number varied from 4, 8, or 15 cycles as described in the main text.
Preparation and Sequencing of Neurospora DNA
Chromatin immunoprecipitation (ChIP) and DNA isolation were performed as described previously (Sasaki et al., 2014). For Illumina sequencing, libraries were prepared from 10 ng of ChIP input DNA using an Illumina TruSeq kit (Illumina cat-FC-121-2002). Libraries were prepared according to manufacturer instructions except for the following modifications. DNA adaptors were diluted 1:100 prior to ligation. PCR was performed for 4, 8, or 15 cycles, as indicated in the text. In some experiments, a PCR reaction mixture containing Kapa HiFi polymerase (Kapa Biosystems, cat-KK2502), 1X Kapa HiFi buffer, 200 nM dNTPs, 1X TruSeq primer cocktail, and 60 mM tetramethylammonium chloride (TMAC; Sigma-Aldrich, catalog # T3411) was used in place of the TruSeq PCR master mix [as described in (Oyola et al., 2012)]. Illumina sequencing was performed using an Illumina Next-Seq500 instrument at the University of Georgia genomics facility.
Methylc-Seq Data Analysis
FASTQ files were trimmed for adapters, preprocessed to remove low quality reads and aligned to the TAIR10 reference genome as previously described in (Schmitz et al., 2013b). Inefficiencies in the sodium bisulfite conversion reaction are calculated by measuring the fraction of methylated basecalls detected in the chloroplast genome (which is unmethylated). This non-conversion rate is used as the null hypothesis for a binomial test to determine if a cytosine is methylated and the resulting p-values are corrected for multiple testing using Benjamini–Hochberg with an FDR cut off of 5%.
Calculation of Methylation Levels
Weighted methylation levels were performed as described in (Schultz et al., 2012).
Calculation of Correlation Coefficients
Pearson correlation was calculated. In Figure 2B, the outliers were identified using Bonferroni test (Cook and Weisberg, 1982) and then Pearson correlation was calculated after the outliers were removed.
Calculation of Normalized Read Coverage
For Figures 1D–F normalized read coverage was calculated by the total number of reads in the DMR (Differentially Methylated Region) divided by the total number of reads sequenced from the library. This value was then multiplied by 105. For Figure 1G, normalized read coverage was calculated as follows: genome sequencing reads from previously published A. thaliana Col-0 data (Becker et al., 2011) were used to determine a baseline level of mappability by the DNA that had not undergone sodium bisulfite treatment. In this case, all cytosines were converted to thymines in the FASTQ files and then the genome sequencing data set was used in the same analysis pipeline as the one used to map and determine methylation levels for sodium bisulfite-treated libraries. A. thaliana mutation accumulation line 1 replicate 2 was selected as bisulfite sequencing sample (Schmitz et al., 2011). In each 10 kb window, read numbers were counted and then divided by the number of mapped reads in the first tile to normalize them to the same scale. Normalized read coverage was then computed by subtracting the normalized number of reads present in the genomic DNA sample from the normalized number of reads in the bisulfite sequencing sample. 5% outliers were identified, as described in the Calculation of correlation coefficients section, and removed before computing linear regression (Cook and Weisberg, 1982). For Figure 2B, the window size was set to 100 kb, the enrichment of mapped reads for each tile was computed using the same method as described for 1 G. For Figures 3–5, the methylation levels from Figure 1G were used to set a fixed horizontal axis. Therefore, data points were only able to move in a vertical direction depending on normalized read coverage. This method was used because higher read coverage resulted in higher methylation levels, which made it challenging to accurately reveal and compare the trends in each figure. For Figure 6, to calculate normalized read coverage for Neurospora, the genome was divided into 1 kb windows using bedtools, and a gtf annotation file was constructed using custom scripts. Cuffdiff software (Trapnell et al., 2013) and the custom annotation file were used to calculate the enrichment ratios at each 1 kb window. %GC was determined using a custom script.
Data Access
The data generated for this study have been deposited in the Gene Expression Omnibus1 and are accessible through accession number GSE58217. For WGBS data in Figures 1 and 2 data were downloaded from the National Center for Biotechnology Information (NCBI) – Sequence Read Archive (SRA)2 and for genomic DNA sequence used in Figure 2 data were downloaded from (http://www.ncbi.nlm.nih.gov/sra/?term==ERX386705).
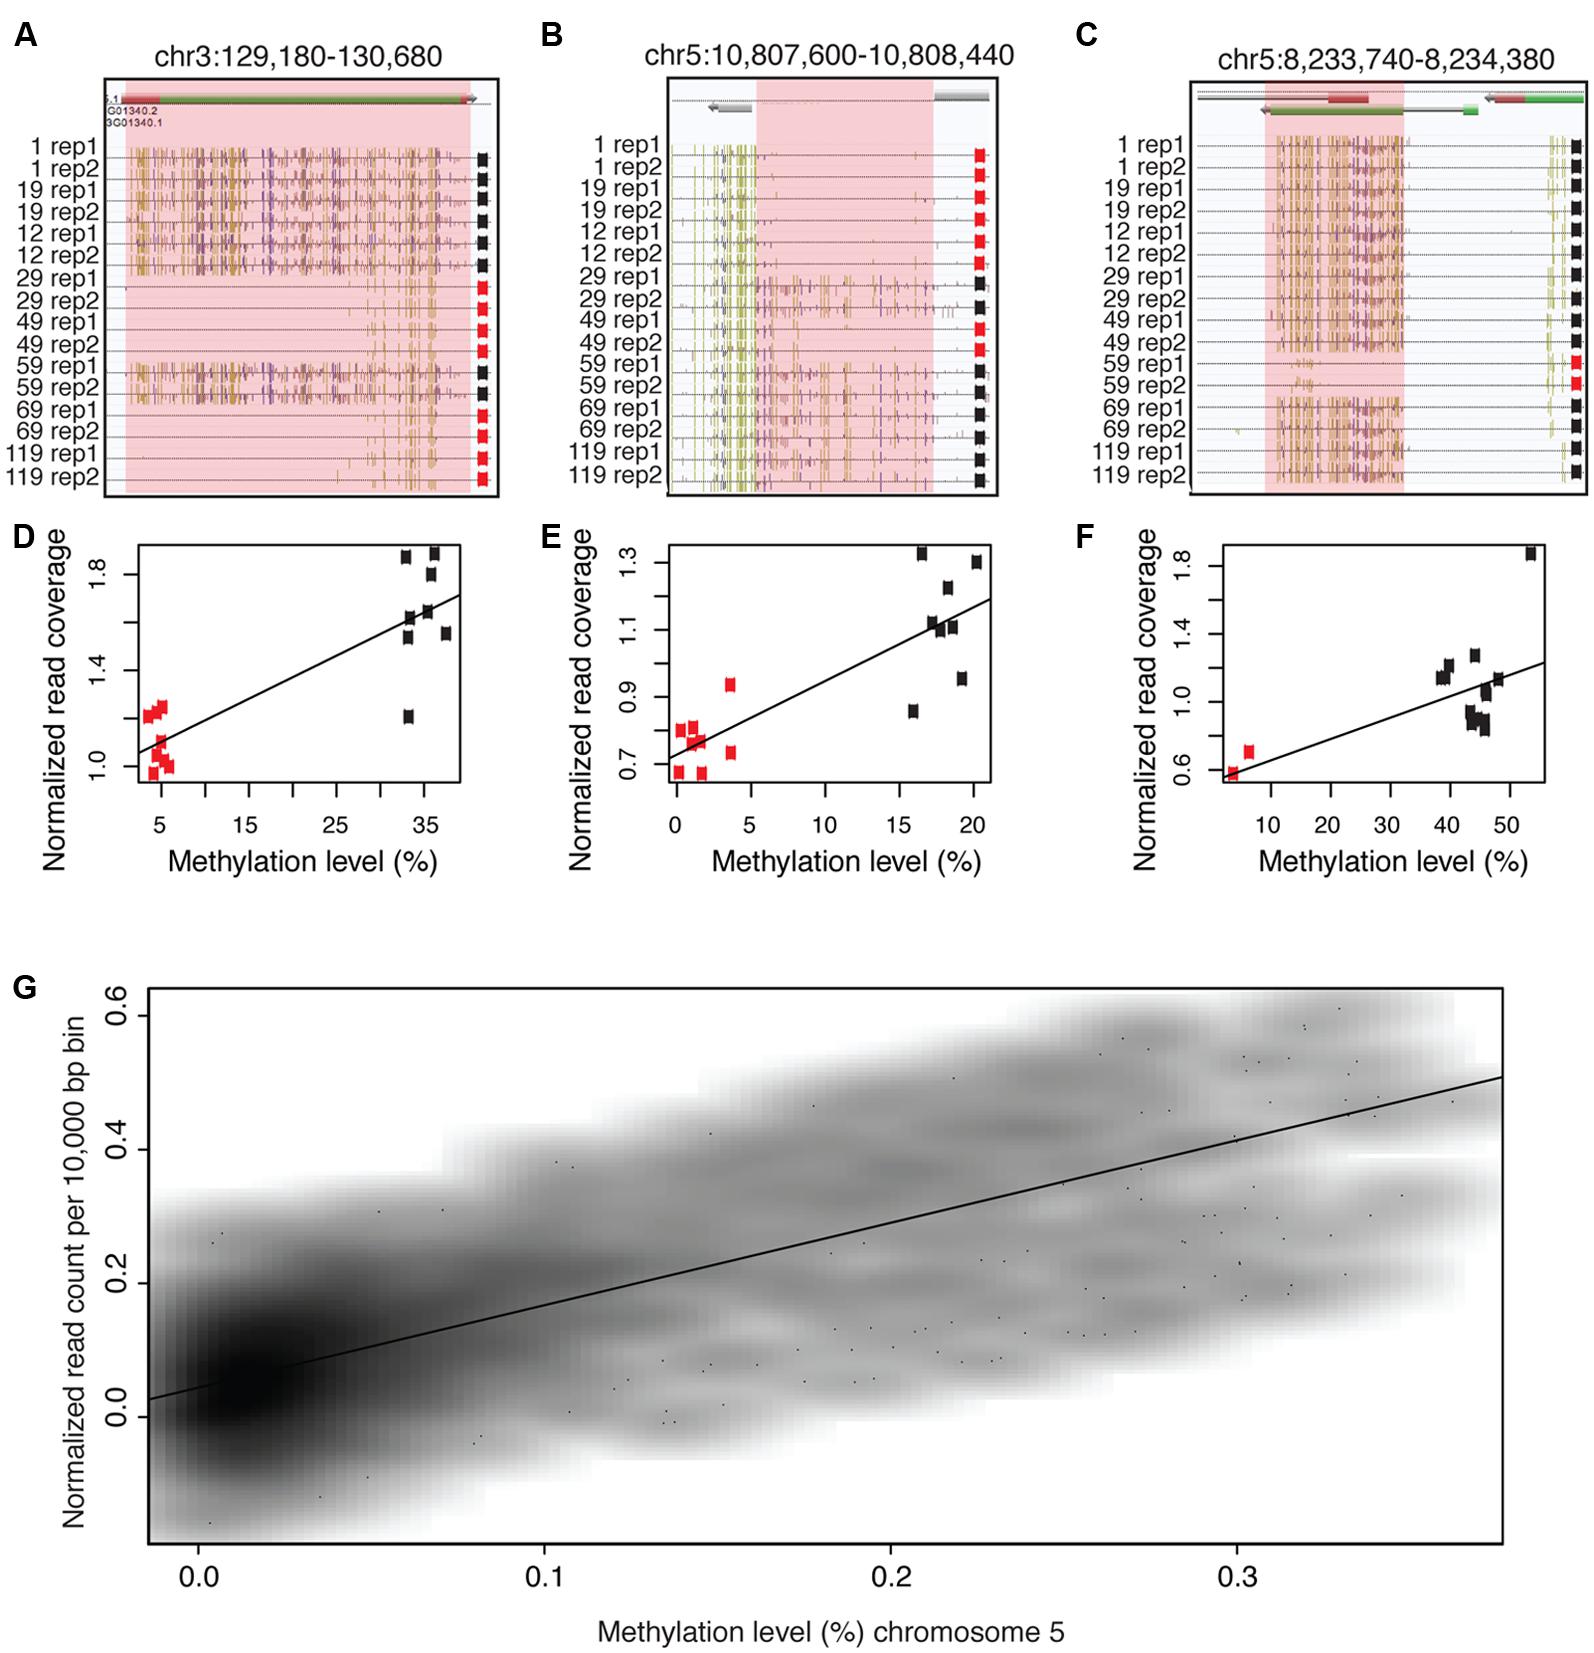
FIGURE 1. Methylated DNA is enriched in whole-genome bisulfite sequencing data (WGBS). (A–C) Examples of differentially methylated regions (DMRs) that contain identical DNA sequences. (D–F) Highly methylated regions contain an abundance of bisulfite sequencing reads compared to lowly methylated sequences. (G) Highly methylated DNA is positively correlated with bisulfite sequencing read counts. The names of the samples in (A–C) indicate lineage numbers as previously reported Shaw et al. (2000). Pink shaded regions indicate DMRs in (A–C) and the location of data used to produce (D–F). In (A–C), gold lines = methylated CGs, blue lines = methylated CHGs (where H = A, C, or T) and pink lines = methylated CHHs. In (D–F), black dots = highly methylated alleles, red dots = lowly methylated alleles. Data used to produce Figure 1G were obtained from line 1 replicate 2 from (Schmitz et al., 2011).
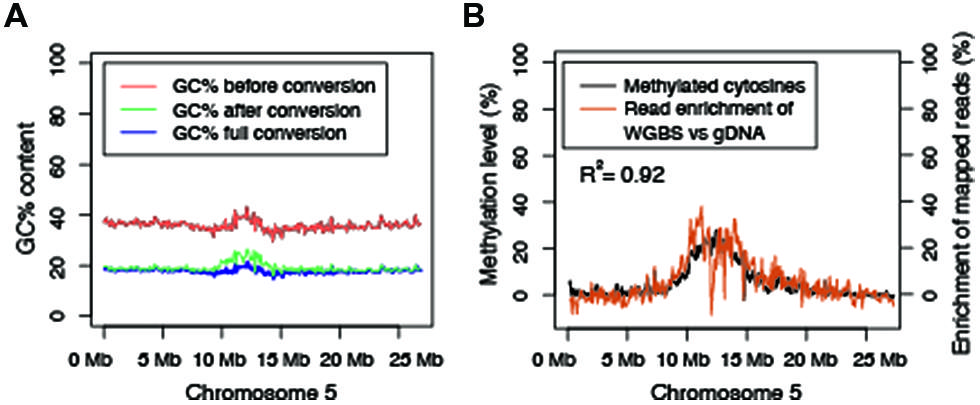
FIGURE 2. Methylated DNA has a skewed GC content after sodium bisulfite conversion of DNA and this leads to an enrichment of methylated reads in bisulfite sequencing. (A) GC content before bisulfite conversion, after bisulfite conversion, computed full conversion and the absolute difference in GC content between unconverted and bisulfite-treated DNA. (B) WGBS reads are positively correlated and enriched with highly methylated regions of the chromosome compared to alignment of sequencing reads from genomic DNA libraries. The black line and the corresponding y-axis on the left depict the total level of cytosine methylation in all combined contexts (CG, CHG, or CHH). The orange line and the corresponding y-axis on the right depict normalized read coverage. WGBS data used to produce this figure were obtained from line 1 replicate 2 from (Schmitz et al., 2011). Genomic DNA sequencing data used to produce this figure were obtained from sample 119 in (Becker et al., 2011).
Results and Discussions
Methylated DNA is Over-Represented in Bisulfite Sequencing Data
Our previous studies that applied MethylC-seq (a WBGS method) on a population of A. thaliana MA lines (Shaw et al., 2000) revealed the existence of spontaneous epialleles (Schmitz et al., 2011; Figures 1A–C). These differentially methylated regions (DMRs) of the population have identical underlying DNA sequences as revealed by whole genome sequencing (Ossowski et al., 2010), but vary significantly in DNA methylation levels (Figures 1A–C). Further examination of the underlying data revealed that reads from highly methylated DMRs were over-represented compared to unmethylated regions after bisulfite conversion and DNA sequencing (Figures 1D–F). In total, eight different MA lines were sequenced in duplicate for a total of 16 samples. In every case, there was a positive correlation between the methylation level of the DMR and the normalized number of aligned sequenced reads (Figures 1D–F). Similarly, a chromosome-wide test revealed a strong positive correlation between DNA methylation levels and normalized (aligned) read counts from WGBS data (Figure 1G; R2 = 0.55).
GC Content Influences Enrichment of Highly Methylated DNA
Although the sequences within DMRs are identical, GC contents were significantly different after sodium bisulfite conversion. Therefore, the possibility exists that the underlying GC content likely influences the enrichment bias of methylated DNA. To further explore this question, the GC content throughout chromosome five was determined prior to and post sodium bisulfite conversion (Figure 2A). Post bisulfite treatment, the GC content is significantly reduced by approximately 50%, which is expected as most of the cytosines are unmethylated and are converted to uracils and ultimately thymines after PCR. The lowest percentage reduction in GC content is observed in the pericentromeric region of the chromosome (Figure 2A) where the highest density of methylation has been observed (Figure 2B; Cokus et al., 2008; Lister et al., 2008). To empirically test if sodium bisulfite-treated and amplified DNA is preferentially biased toward highly methylated reads, both WBGS and genomic DNA sequencing data from wild-type Col-0 were aligned using the same parameters. The read enrichment was calculated and plotted along chromosome five, which revealed an enrichment of WGBS reads compared to genomic DNA sequencing reads that paralleled DNA methylation levels along the chromosome (Figure 2B). Collectively, these data suggest that highly methylated sequences, which retain high GC content after bisulfite conversion and PCR amplification, are preferentially enriched in WGBS data compared to unmethylated sequences.
Number of PCR Cycles Influences Enrichment of Highly Methylated DNA
The introduction of altered GC content occurs during bisulfite treatment and subsequent PCR amplification. Bisulfite-converted DNA is rich with uracils, which impairs the ability of most DNA polymerases to efficiently amplify these fragments. The B-type DNA polymerase from Pyrococcus furiosus is able to polymerize uracil-rich DNA because it binds to deaminated bases (Horvath and Vertessy, 2010). This enzyme was engineered to polymerize uracil-rich DNA by mutating a single amino acid that blocks recognition of the deaminated bases (Horvath and Vertessy, 2010). These types of engineered uracil-tolerant enzymes are critical for single-base resolution studies of DNA methylation and as a result, a number of commercially available enzymes have been engineered to amplify uracil-containing templates. We performed a test on the Pfu Turbo Cx enzyme with biological replicates (Supplementary Table 1) using three different cycles (4, 8, and 15 cycles) of PCR (Figure 3A) to assess the degree to which a uracil-insensitive enzyme is prone to an amplification bias of methylated DNA. A comparison between 4, 8, and 15 PCR cycles revealed that 15 cycles results in an exacerbation in the preferential enrichment of methylated DNA (Figures 3B–G).
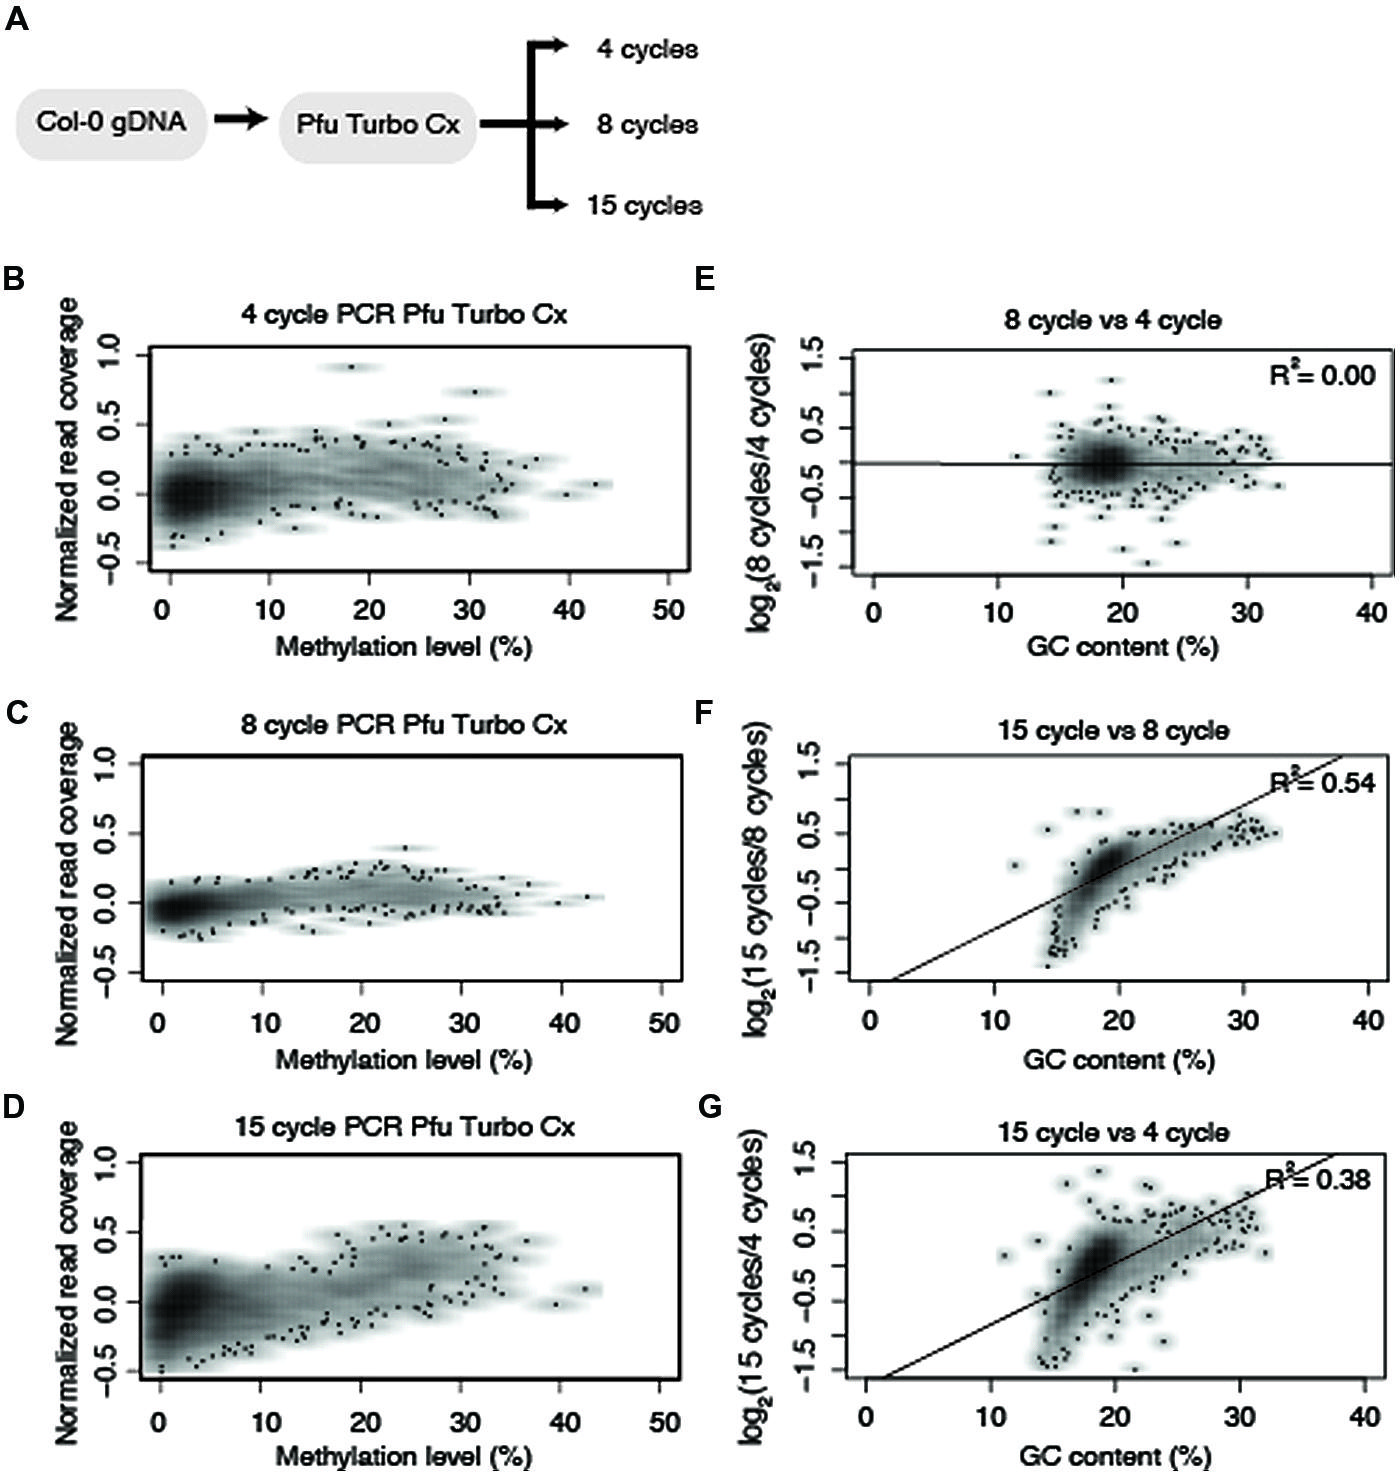
FIGURE 3. Polymerase chain reaction (PCR) cycle number influences enrichment bias. (A) Diagram of the experimental design for testing the effect PCR cycle number on representation of methylated DNA. Normalized read counts versus methylation levels of 10 kb fragments from chromosome five for (B) 4 cycles, (C) 8 cycles, and (D) 15 cycles of PCR amplification using Pfu Turbo Cx. (E–G) Normalized read numbers for each 10 kb window were compared between different PCR cycle numbers and correlation scores were determined as indicated in the upper right hand of the plot. All R2 values reported reflect Pearson correlation coefficients.
Comparative Analysis of Commercially Available Uracil-Insensitive Enzymes
Based on the results from Figure 3, an experiment was designed to test two additional commonly used commercially available enzymes in biological replicates (Supplementary Table 1) for their ability to amplify bisulfite-converted DNA (Kapa HiFi Uracil + and EpiMark). Upon constructing the MethylC-seq libraries the concentration of the samples were determined using a Qubit. This revealed that the total library yield for the 4-cycle/8-cycle PCR was similar between the three enzymes tested, but for the 15-cycle PCR, the KAPA HiFi Uracil + enzyme yielded significantly more total library (Table 1). Regardless, the total amount of library yielded in all experiments is more than adequate to sequence to sufficient depth. Next, the methylation levels were plotted against normalized read counts and as observed with the Pfu Turbo Cx enzyme in Figures 1 and 2, the other two tested enzymes also preferentially enrich methylated DNA, although to a lesser extent (Figures 4 and 5). However, both of these enzymes are sensitive to highly methylated sequences as the normalized read numbers started to decrease with higher methylation levels compared to intermediate methylation levels (Figures 4 and 5). Interestingly, between the 4, 8, and 15 cycle experiments for the Kapa HiFi Uracil + enzyme, extremely high GC content regions did not result in an increase in amplification bias of DNA like it does with both the Pfu Turbo Cx and EpiMark enzymes (Figures 3–5), which would indicate this enzyme is likely preferred for most WGBS applications. Interestingly, the EpiMark enzyme revealed that at 15 PCR cycles a strong bias was associated with increasing GC content, but not with increasing levels of DNA methylation compared to the 4- and 8-cycle reactions (Figures 5A–F). Therefore, both PCR cycles and enzymes selected for amplification can influence enrichment of highly methylated DNA in sequencing data.
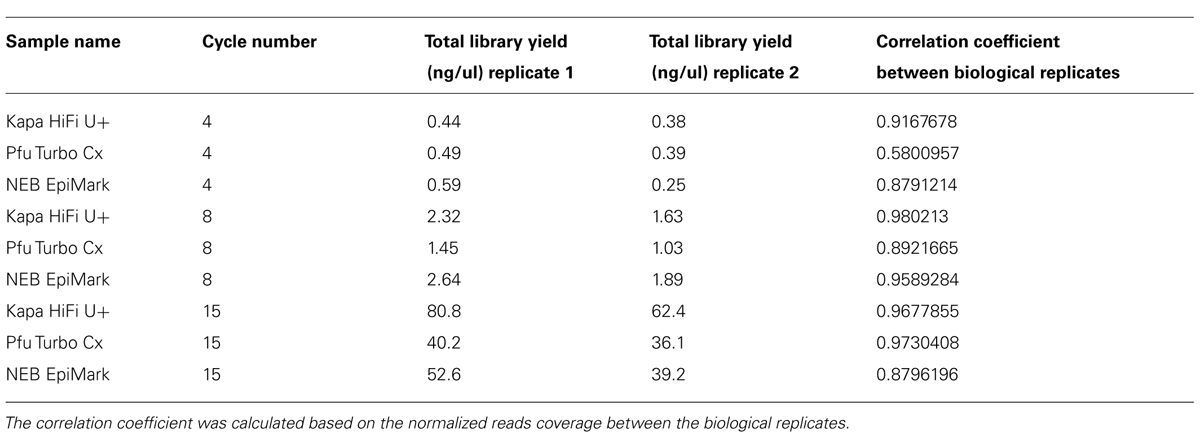
TABLE 1. Sample name, cycle number and total library yield for each WGBS library are reported.
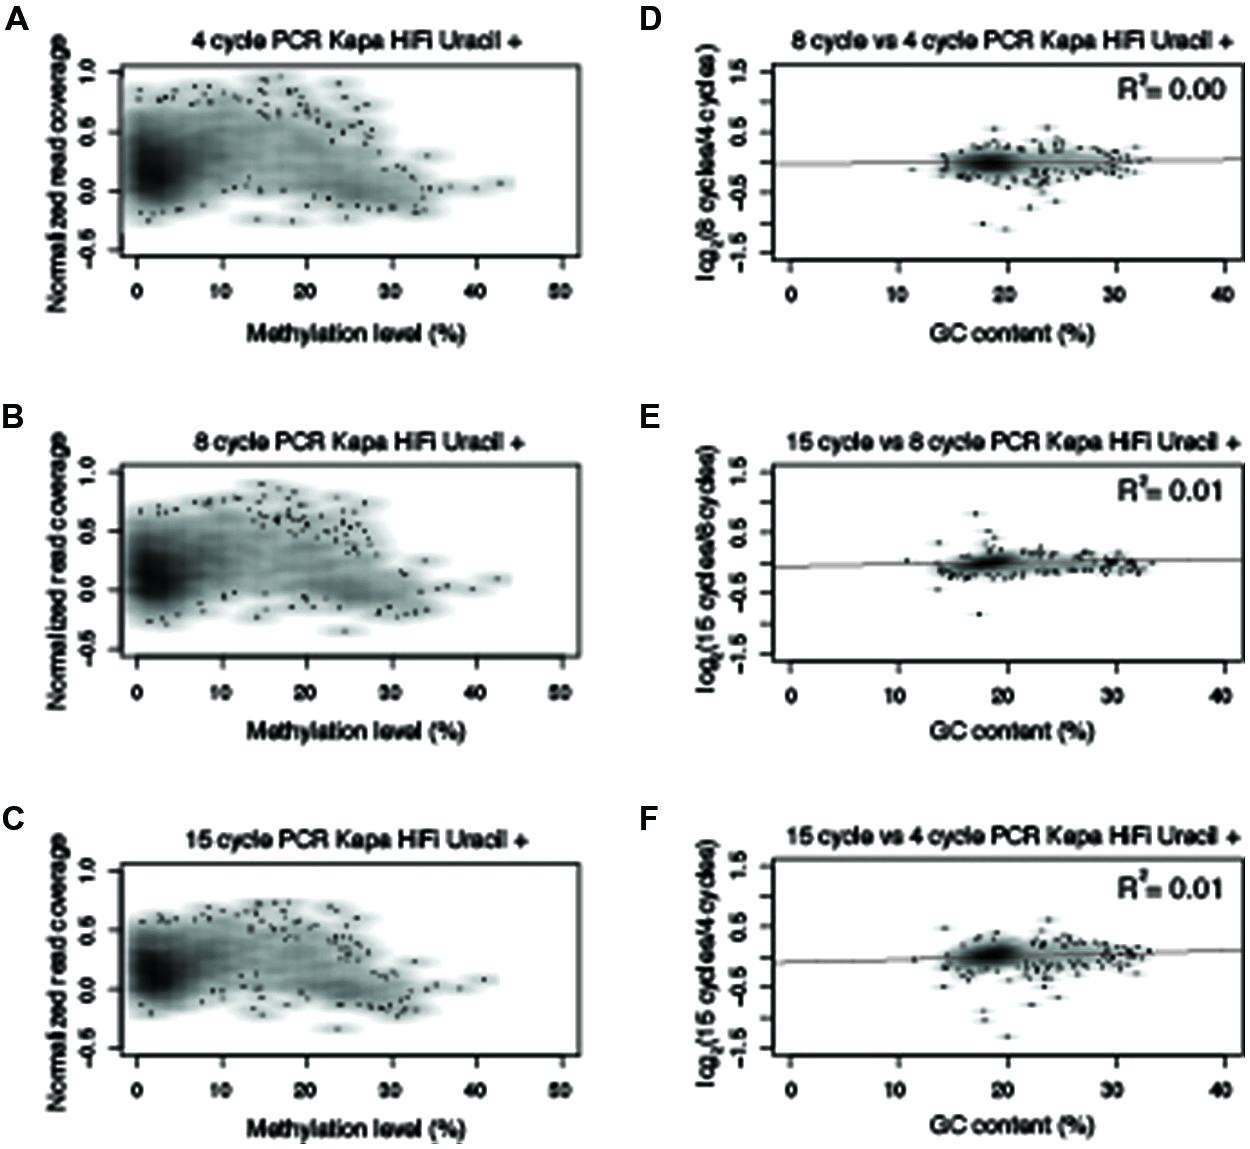
FIGURE 4. Polymerase chain reaction amplification bias observed with Kapa HiFi Uracil +. Normalized read counts versus methylation levels for 10 kb windows from chromosome five for (A–C) Kapa HiFi Uracil + from 4-, 8-, and 15-cycles of PCR. (D–F) Normalized read numbers for each 10 kb window were compared between different PCR cycle numbers and correlation scores were determined as indicated in the upper right hand of the plot. All R2 values reported reflect Pearson correlation coefficients.
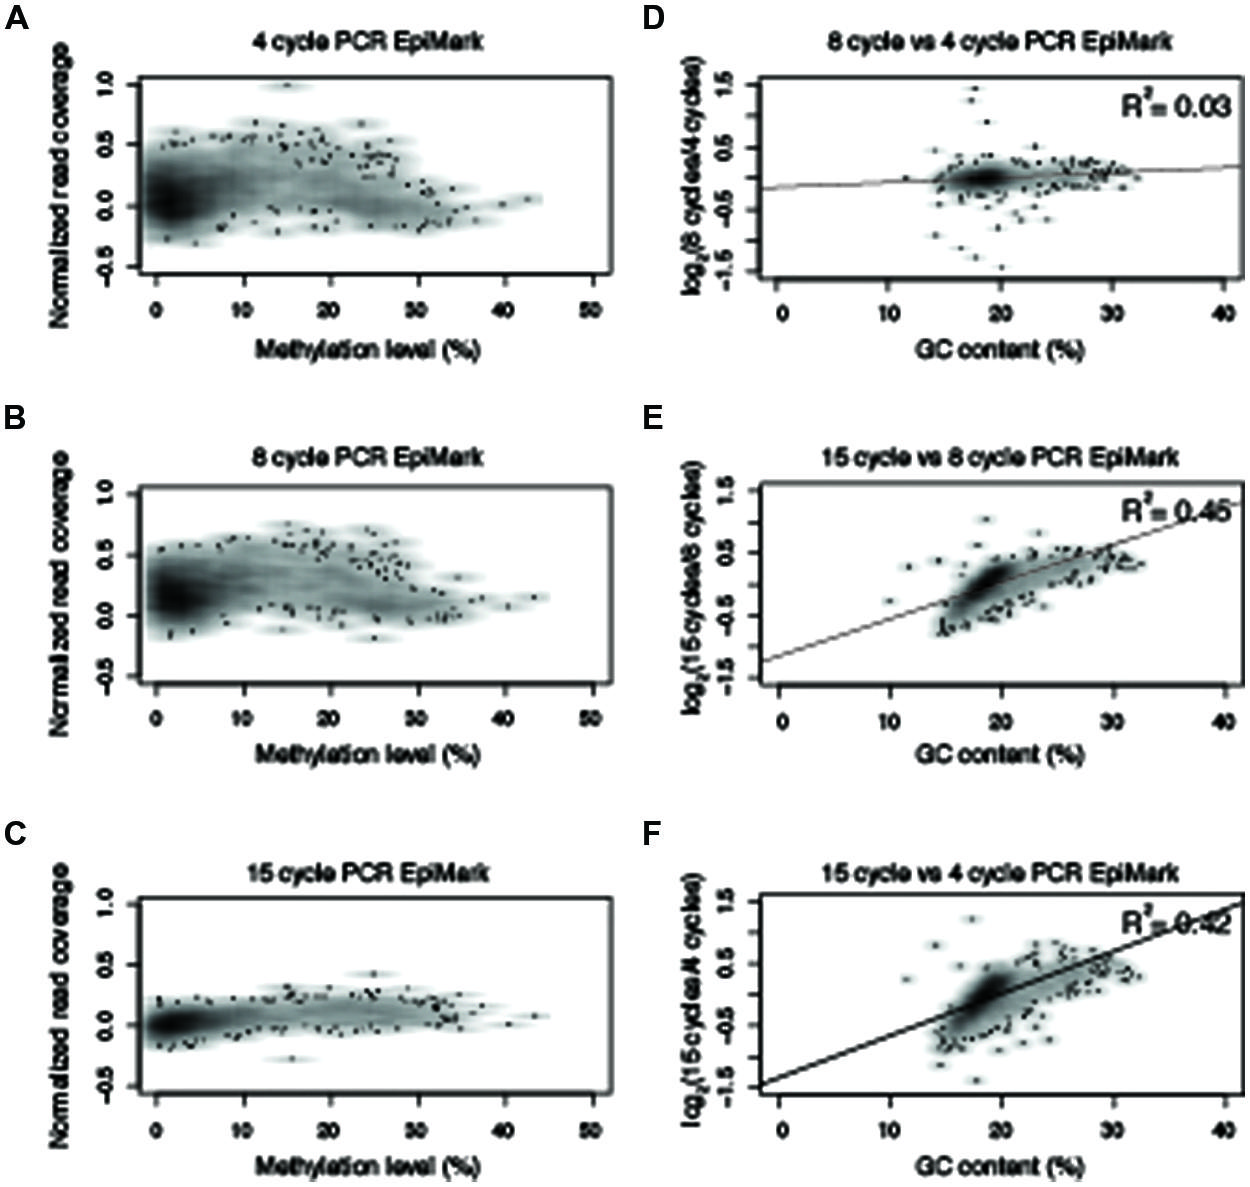
FIGURE 5. Polymerase chain reaction amplification bias observed with NEB EpiMark. Normalized read counts versus methylation levels for 10 kb windows from chromosome five for (A–C) NEB EpiMark from 4-, 8-, and 15-cycles of PCR. (D–F) Normalized read numbers for each 10 kb window were compared between different PCR cycle numbers and correlation scores were determined as indicated in the upper right hand of the plot. All R2 values reported reflect Pearson correlation coefficients.
AT-Rich Sequences are Depleted from DNA Sequencing Libraries
ChIP-seq experiments carried out with the filamentous fungus Neurospora crassa also revealed a bias against AT-rich DNA sequences, demonstrating reduced coverage at AT-rich DNA is not restricted to uracil-tolerant polymerases. Neurospora heterochromatin domains have an average GC content of 30% compared to an average GC content of 51.5% for genes (Figure 6). ChIP input DNA was used to prepare Illumina sequencing libraries using two different polymerases and PCR was performed for 4, 8, and 15 cycles. Libraries prepared using a TruSeq PCR master-mix revealed equal representation of GC-rich and AT-rich regions after 4 and 8 cycles of PCR, but a clear amplification bias was observed after 15 cycles of PCR (Figures 6A,C). It was reported previously that the Kapa HiFi polymerase, a distinct enzyme from the Kapa HiFi Uracil + polymerase used throughout the rest of the manuscript, efficiently amplified AT-rich DNA when supplemented with 60 mM TMAC (Oyola et al., 2012). However, our experiments with Neurospora DNA revealed a significant underrepresentation of AT-rich DNA after only 8 cycles of PCR using the KAPA HiFi DNA polymerase + TMAC (Figures 6B,D). Therefore, the DNA polymerase used for PCR amplification and the number of PCR cycles selected can affect amplification of genomic DNA that contains large disparities in GC content.
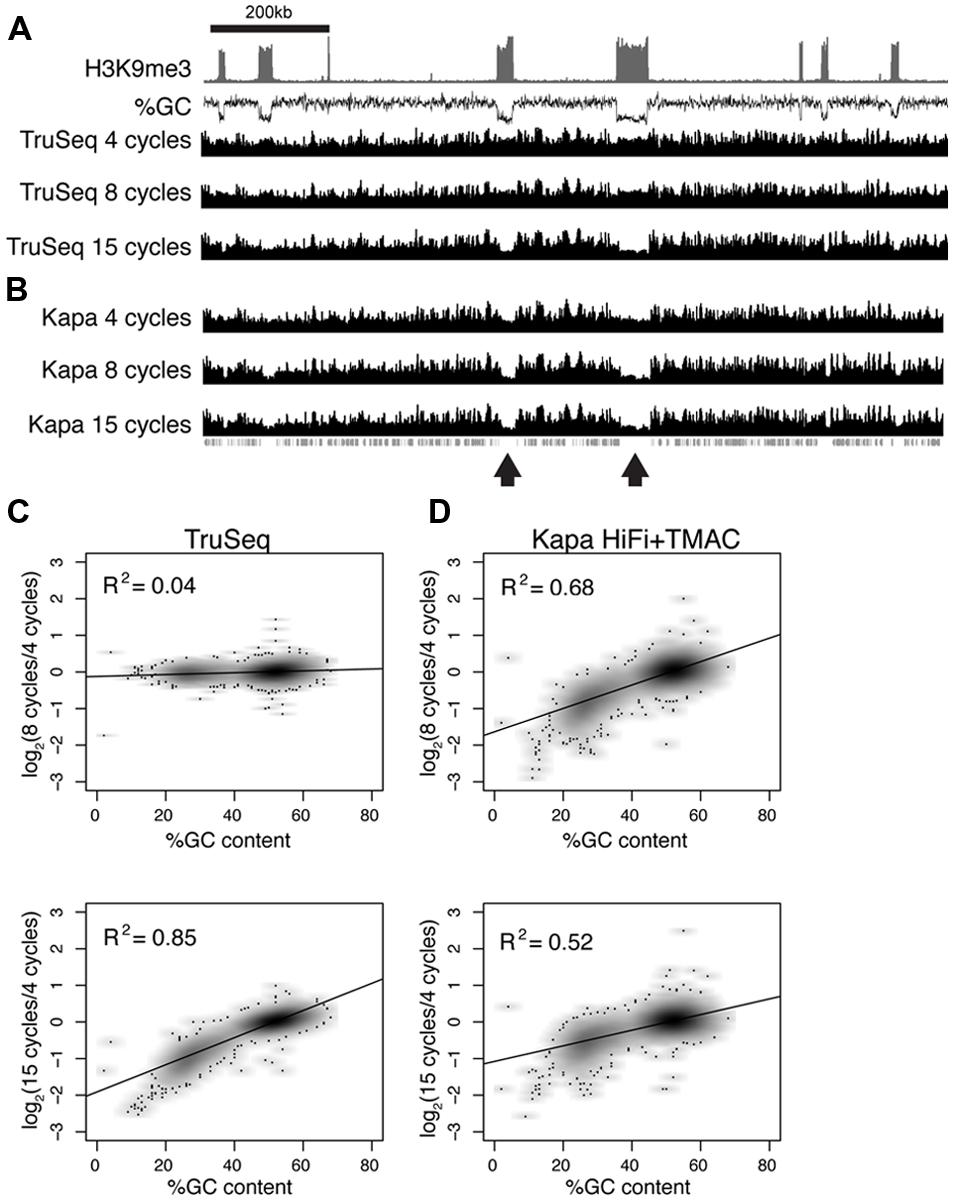
FIGURE 6. Polymerase chain reaction amplification bias in Neurospora crassa heterochromatin domains (A–B) Sequence coverage is shown across a 1.2 Mb domain of the Neurospora genome (chromosome 1: 200–1400 kb). Enrichment of tri-methyl H3 K9 (H3K9me3; Sasaki et al., 2014) and GC-content (%GC) are plotted to indicate the position of AT-rich heterochromatin domains. Data are shown for libraries prepared with Illumina PCR master mix (A) or Kapa HiFi polymerase + TMAC (B) and amplified for 4, 8, and 15 cycles, as indicated. The positions of genes are plotted beneath the coverage tracks. (C–D) Normalized read coverage and GC-content was calculated for 1 kb windows across the entire Neurospora genome for libraries prepared using different conditions. Log2 values obtained by comparing normalized read coverage after 4 and 8 cycles (top) or 4 and 15 cycles (bottom) are plotted on the y-axis. %GC is plotted on the x-axis. Results for TruSeq master mix and Kapa HiFi polymerase are shown in panels (C,D), respectively.
Conclusion
Whole-genome bisulfite sequencing is an excellent method for determining base resolution DNA methylomes and although in most genomes studied to date, it has been able to determine methylation levels for >90% of cytosines, it does have some limitations. In this study, we show that there exists a strong amplification bias of methylated DNA compared to unmethylated sequences and that this bias can be affected by PCR cycle number and the enzyme used for PCR amplification. Interestingly, this change in amplification bias is not observed with the Kapa HiFi Uracil + enzyme in comparison to the others tested. This observation suggests that the high PCR cycle number that is necessary to construct a sequenceable library for low input samples such as RRBS (Gu et al., 2011), single cells, sequence-capture or FFPE samples can be achieved without introducing major artifacts from the number of PCR cycles selected. Therefore, although an amplification bias will occur at these highly methylated sequences, in these types of libraries, it will not grow in strength to the point that it depletes lower methylated sequences from produced sequencing data. This effect is not true for all enzymes used in amplification of bisulfite converted DNA as the Pfu Turbo Cx enzyme resulted in a significant over-enrichment of reads associated with methylated DNA with increasing cycle number. Furthermore, even tests on genomic DNA from Neurospora revealed significant variation between different commercially available enzymes and selected PCR cycle number. To improve the quality and to reduce to bias associated with WGBS data it is recommended to start higher concentrations of genomic DNA when possible, limit the number of PCR cycles and optimize the polymerase used for amplification of the library.
In general, it is difficult to precisely quantify the effect of this observed bias in WGBS data on percent methylation calculations. As we show here, bias depends on polymerase choice and PCR cycle number. We expect that other factors can also affect bias, not only the methylation level, which itself can be affected by biological and technical variation, but also factors like raw sequence read length, sequencing errors, efficiency of sodium bisulfite conversion, sequence structure itself, etc. In order to develop computational tools that correct for bias, additional experiments are needed to define how these factors contribute to the observed bias in WGBS data. We note that the bias introduced using current protocols is likely to influence DMR analysis. In particular, loci that are heterozygous for methylation state could be underrepresented by DMR finding algorithms.
The sodium bisulfite conversion and PCR amplification steps are impossible to remove from WGBS library preparation and these are the steps where a bias is introduced. In fact, efforts to correct for amplification bias in targeted bisulfite sequencing of genomic regions have been successfully performed by using a calibration method that requires a parallel analysis of input samples with known methylation levels (Moskalev et al., 2011). Additionally, RainDance Technology has also proved useful for correction of amplification bias in targeted bisulfite PCR (Komori et al., 2011), but it is unknown if this correction will be observed on WGBS libraries. Regardless, both of these methods are not feasible alternatives for routine correction of the observed amplification bias in WGBS, as they are technically cumbersome compared to current methods and they are cost prohibitive. This bias will be most pronounced in the study of allele-specific methylation. The results of this study make it clear that PCR enzyme and the PCR amplification cycle used can influence determined methylation levels, which undoubtedly could affect results of previously published studies that were not aware of these biases. Fortunately, most experiments that use this approach can be corrected for this bias by using SNP data in the bisulfite-sequencing reads. Caution should be taken when calculating methylation levels at loci with heterozygous methylation states, especially when experiments study regions that do not have SNPs or do not take into consideration SNPs linked to bisulfite-sequencing reads. Caution should also be taken when using platforms that do not detect SNPs. For example, many microarray platforms have been designed to detect DNA methylation states and although PCR is not generally used to amplify bisulfite-converted DNA, the use of Whole Genome Amplification (WGA) methods will still introduce a bias based on the GC content of DNA sequences (Bredel et al., 2005; Arriola et al., 2007). Because WGBS is primarily used on species with published reference genomes, it may be possible to predict this amplification bias based on GC content and the range of potential methylation levels at these regions. Therefore, future efforts to computationally model and predict expected read coverage for regions will be advantageous for studies where SNP information is not available or present at specific regions of interest.
Conflict of Interest Statement
The authors declare that the research was conducted in the absence of any commercial or financial relationships that could be construed as a potential conflict of interest.
Acknowledgments
We are grateful to Nathan Springer for original discussions related to this study and Chad Niederhuth for critical reading of this manuscript. This study was supported by start-up funds from the University of Georgia and by research grants to Robert J. Schmitz from the National Science Foundation (IOS-1339194) and the National Institutes of Health (R00GM100000) and from the March of Dimes Foundation (#5-FY14-89) to Zachary A. Lewis. Xiaoxiao Sun and Ping Ma were partially supported by research grants from the National Science Foundation (DMS-1222718, DMS-1438957).
Supplementary Material
The Supplementary Material for this article can be found online at: http://www.frontiersin.org/journal/10.3389/fgene.2014.00341/abstract
Footnotes
References
Aird, D., Ross, M. G., Chen, W. S., Danielsson, M., Fennell, T., Russ, C.,et al. (2011). Analyzing and minimizing PCR amplification bias in Illumina sequencing libraries. Genome Biol. 12, R18. doi: 10.1186/gb-2011-12-2-r18
Pubmed Abstract | Pubmed Full Text | CrossRef Full Text | Google Scholar
Arriola, E., Lambros, M. B., Jones, C., Dexter, T., Mackay, A., Tan, D. S.,et al. (2007). Evaluation of Phi29-based whole-genome amplification for microarray-based comparative genomic hybridisation. Lab. Invest. 87, 75–83. doi: 10.1038/labinvest.3700495
Pubmed Abstract | Pubmed Full Text | CrossRef Full Text | Google Scholar
Becker, C., Hagmann, J., Muller, J., Koenig, D., Stegle, O., Borgwardt, K.,et al. (2011). Spontaneous epigenetic variation in the Arabidopsis thaliana methylome. Nature 480, 245–249. doi: 10.1038/nature10555
Pubmed Abstract | Pubmed Full Text | CrossRef Full Text | Google Scholar
Benjamini, Y., and Speed, T. P. (2012). Summarizing and correcting the GC content bias in high-throughput sequencing. Nucleic Acids Res. 40, e72. doi: 10.1093/nar/gks001
Pubmed Abstract | Pubmed Full Text | CrossRef Full Text | Google Scholar
Bernstein, B. E., Stamatoyannopoulos, J. A., Costello, J. F., Ren, B., Milosavljevic, A., Meissner, A.,et al. (2010). The NIH roadmap epigenomics mapping consortium. Nat. Biotechnol. 28, 1045–1048. doi: 10.1038/nbt1010-1045
Pubmed Abstract | Pubmed Full Text | CrossRef Full Text | Google Scholar
Booth, M. J., Branco, M. R., Ficz, G., Oxley, D., Krueger, F., Reik, W.,et al. (2012). Quantitative sequencing of 5-methylcytosine and 5-hydroxymethylcytosine at single-base resolution. Science 336, 934–937. doi: 10.1126/science.1220671
Pubmed Abstract | Pubmed Full Text | CrossRef Full Text | Google Scholar
Booth, M. J., Marsico, G., Bachman, M., and Beraldi, D. (2014). Quantitative sequencing of 5-formylcytosine in DNA at single-base resolution. Nat. Chem. 6, 435–440. doi: 10.1038/NCHEM.1893
Pubmed Abstract | Pubmed Full Text | CrossRef Full Text | Google Scholar
Bredel, M., Bredel, C., Juric, D., Kim, Y., Vogel, H., Harsh, G. R.,et al. (2005). Amplification of whole tumor genomes and gene-by-gene mapping of genomic aberrations from limited sources of fresh-frozen and paraffin-embedded DNA. J. Mol. Diagn. 7, 171–182. doi: 10.1016/S1525-1578(10)60543-0
Pubmed Abstract | Pubmed Full Text | CrossRef Full Text | Google Scholar
Calarco, J. P., Borges, F., Donoghue, M. T., Van Ex, F., Jullien, P. E., Lopes, T.,et al. (2012). Reprogramming of DNA methylation in pollen guides epigenetic inheritance via small RNA. Cell 151, 194–205. doi: 10.1016/j.cell.2012.09.001
Pubmed Abstract | Pubmed Full Text | CrossRef Full Text | Google Scholar
Clark, S. J., Harrison, J., Paul, C. L., and Frommer, M. (1994). High sensitivity mapping of methylated cytosines. Nucleic Acids Res. 22, 2990–2997. doi: 10.1093/nar/22.15.2990
Clark, S. J., Statham, A., Stirzaker, C., Molloy, P. L., and Frommer, M. (2006). DNA methylation: bisulphite modification and analysis. Nat. Protoc. 1, 2353–2364.
Cokus, S. J., Feng, S., Zhang, X., Chen, Z., Merriman, B., Haudenschild, C. D.,et al. (2008). Shotgun bisulphite sequencing of the Arabidopsis genome reveals DNA methylation patterning. Nature 452, 215–219. doi: 10.1038/nature06745
Pubmed Abstract | Pubmed Full Text | CrossRef Full Text | Google Scholar
Cook, R. D., and Weisberg, S. (1982). Residuals and Influence in Regression. New York: Chapman and Hall.
Creasey, K. M., Zhai, J., Borges, F., Van Ex, F., Regulski, M., Meyers, B. C.,et al. (2014). miRNAs trigger widespread epigenetically activated siRNAs from transposons in Arabidopsis. Nature 508, 411–415. doi: 10.1038/nature13069
Pubmed Abstract | Pubmed Full Text | CrossRef Full Text | Google Scholar
Frommer, M., Mcdonald, L. E., Millar, D. S., Collis, C. M., Watt, F., Grigg, G. W.,et al. (1992). A genomic sequencing protocol that yields a positive display of 5-methylcytosine residues in individual DNA strands. Proc. Natl. Acad. Sci. U.S.A. 89, 1827–1831. doi: 10.1073/pnas.89.5.1827
Pubmed Abstract | Pubmed Full Text | CrossRef Full Text | Google Scholar
Gehring, M., Bubb, K. L., and Henikoff, S. (2009). Extensive demethylation of repetitive elements during seed development underlies gene imprinting. Science 324, 1447–1451. doi: 10.1126/science.1171609
Pubmed Abstract | Pubmed Full Text | CrossRef Full Text | Google Scholar
Gent, J. I., Ellis, N. A., Guo, L., Harkess, A. E., Yao, Y., Zhang, X.,et al. (2013). CHH islands: de novo DNA methylation in near-gene chromatin regulation in maize. Genome Res. 23, 628–637. doi: 10.1101/gr.146985.112
Pubmed Abstract | Pubmed Full Text | CrossRef Full Text | Google Scholar
Gu, H., Smith, Z. D., Bock, C., Boyle, P., Gnirke, A., and Meissner, A. (2011). Preparation of reduced representation bisulfite sequencing libraries for genome-scale DNA methylation profiling. Nat. Protoc. 6, 468–481. doi: 10.1038/nprot.2010.190
Pubmed Abstract | Pubmed Full Text | CrossRef Full Text | Google Scholar
Hayatsu, H. (1976). Bisulfite modification of nucleic acids and their constituents. Prog. Nucleic Acid Res. Mol. Biol. 16, 75–124.
Hayatsu, H., Wataya, Y., Kai, K., and Iida, S. (1970). Reaction of sodium bisulfite with uracil, cytosine, and their derivatives. Biochemistry 9, 2858–2865. doi: 10.1021/bi00816a016
Horvath, A., and Vertessy, B. G. (2010). A one-step method for quantitative determination of uracil in DNA by real-time PCR. Nucleic Acids Res. 38, e196. doi: 10.1093/nar/gkq815
Pubmed Abstract | Pubmed Full Text | CrossRef Full Text | Google Scholar
Hsieh, T. F., Ibarra, C. A., Silva, P., Zemach, A., Eshed-Williams, L., Fischer, R. L.,et al. (2009). Genome-wide demethylation of Arabidopsis endosperm. Science 324, 1451–1454. doi: 10.1126/science.1172417
Pubmed Abstract | Pubmed Full Text | CrossRef Full Text | Google Scholar
Ibarra, C. A., Feng, X., Schoft, V. K., Hsieh, T. F., Uzawa, R., Rodrigues, J. A.,et al. (2012). Active DNA demethylation in plant companion cells reinforces transposon methylation in gametes. Science 337, 1360–1364. doi: 10.1126/science.1224839
Pubmed Abstract | Pubmed Full Text | CrossRef Full Text | Google Scholar
Jiang, L., Zhang, J., Wang, J. J., Wang, L., Zhang, L., Li, G.,et al. (2013). Sperm, but not oocyte, DNA methylome is inherited by zebrafish early embryos. Cell 153, 773–784. doi: 10.1016/j.cell.2013.04.041
Pubmed Abstract | Pubmed Full Text | CrossRef Full Text | Google Scholar
Kobayashi, H., Sakurai, T., Miura, F., Imai, M., Mochiduki, K., Yanagisawa, E.,et al. (2013). High-resolution DNA methylome analysis of primordial germ cells identifies gender-specific reprogramming in mice. Genome Res. 23, 616–627. doi: 10.1101/gr.148023.112
Pubmed Abstract | Pubmed Full Text | CrossRef Full Text | Google Scholar
Komori, H. K., Lamere, S. A., Torkamani, A., Hart, G. T., Kotsopoulos, S., Warner, J.,et al. (2011). Application of microdroplet PCR for large-scale targeted bisulfite sequencing. Genome Res. 21, 1738–1745. doi: 10.1101/gr.116863.110
Pubmed Abstract | Pubmed Full Text | CrossRef Full Text | Google Scholar
Kozarewa, I., Ning, Z., Quail, M. A., Sanders, M. J., Berriman, M., and Turner, D. J. (2009). Amplification-free Illumina sequencing-library preparation facilitates improved mapping and assembly of (G+C)-biased genomes. Nat. Methods 6, 291–295. doi: 10.1038/nmeth.1311
Pubmed Abstract | Pubmed Full Text | CrossRef Full Text | Google Scholar
Lister, R., O’malley, R. C., Tonti-Filippini, J., Gregory, B. D., Berry, C. C., Millar, A. H.,et al. (2008). Highly integrated single-base resolution maps of the epigenome in Arabidopsis. Cell 133, 523–536. doi: 10.1016/j.cell.2008.03.029.
Pubmed Abstract | Pubmed Full Text | CrossRef Full Text | Google Scholar
Lister, R., Pelizzola, M., Dowen, R. H., Hawkins, R. D., Hon, G., Tonti-Filippini, J.,et al. (2009). Human DNA methylomes at base resolution show widespread epigenomic differences. Nature 462, 315–322. doi: 10.1038/nature08514
Pubmed Abstract | Pubmed Full Text | CrossRef Full Text | Google Scholar
Lister, R., Pelizzola, M., Kida, Y. S., Hawkins, R. D., Nery, J. R., Hon, G.,et al. (2011). Hotspots of aberrant epigenomic reprogramming in human induced pluripotent stem cells. Nature 471, 68–73. doi: 10.1038/nature09798
Pubmed Abstract | Pubmed Full Text | CrossRef Full Text | Google Scholar
McCluskey, K., Wiest, A., and Plamann, M. (2010). The Fungal Genetics Stock Center: a repository for 50 years of fungal genetics research. J. Biosci. 35, 119–126.
Meissner, A., Gnirke, A., Bell, G. W., Ramsahoye, B., Lander, E. S., and Jaenisch, R. (2005). Reduced representation bisulfite sequencing for comparative high-resolution DNA methylation analysis. Nucleic Acids Res. 33, 5868–5877. doi: 10.1093/nar/gki901
Pubmed Abstract | Pubmed Full Text | CrossRef Full Text | Google Scholar
Moskalev, E. A., Zavgorodnij, M. G., Majorova, S. P., Vorobjev, I. A., Jandaghi, P., Bure, I. V.,et al. (2011). Correction of PCR-bias in quantitative DNA methylation studies by means of cubic polynomial regression. Nucleic Acids Res. 39, e77. doi: 10.1093/nar/gkr213
Pubmed Abstract | Pubmed Full Text | CrossRef Full Text | Google Scholar
Orozco, L. D., Rubbi, L., Martin, L. J., Fang, F., Hormozdiari, F., Che, N.,et al. (2014). Intergenerational genomic DNA methylation patterns in mouse hybrid strains. Genome Biol. 15, R68. doi: 10.1186/gb-2014-15-5-r68
Pubmed Abstract | Pubmed Full Text | CrossRef Full Text | Google Scholar
Ossowski, S., Schneeberger, K., Lucas-Lledo, J. I., Warthmann, N., Clark, R. M., Shaw, R. G.,et al. (2010). The rate and molecular spectrum of spontaneous mutations in Arabidopsis thaliana. Science 327, 92–94. doi: 10.1126/science.1180677
Pubmed Abstract | Pubmed Full Text | CrossRef Full Text | Google Scholar
Oyola, S. O., Otto, T. D., Gu, Y., Maslen, G., Manske, M., Campino, S.,et al. (2012). Optimizing Illumina next-generation sequencing library preparation for extremely AT-biased genomes. BMC Genomics 13:1. doi: 10.1186/1471-2164-13–11
Pubmed Abstract | Pubmed Full Text | CrossRef Full Text | Google Scholar
Sasaki, T., Lynch, K. L., Mueller, C. V., Friedman, S., Freitag, M., and Lewis, Z. A. (2014). Heterochromatin controls gammaH2A localization in Neurospora crassa. Eukaryot. Cell 1 3, 990–1000. doi: 10.1128/EC.00117–114
Schmitz, R. J., He, Y., Valdes-Lopez, O., Khan, S. M., Joshi, T., Urich, M. A.,et al. (2013a). Epigenome-wide inheritance of cytosine methylation variants in a recombinant inbred population. Genome Res. 23, 1663–1674. doi: 10.1101/gr.152538.112
Pubmed Abstract | Pubmed Full Text | CrossRef Full Text | Google Scholar
Schmitz, R. J., Schultz, M. D., Urich, M. A., Nery, J. R., Pelizzola, M., Libiger, O.,et al. (2013b). Patterns of population epigenomic diversity. Nature 495, 193–198. doi: 10.1038/nature11968
Pubmed Abstract | Pubmed Full Text | CrossRef Full Text | Google Scholar
Schmitz, R. J., Schultz, M. D., Lewsey, M. G., O’malley, R. C., Urich, M. A., Libiger, O.,et al. (2011). Transgenerational epigenetic instability is a source of novel methylation variants. Science 334, 369–373. doi: 10.1126/science.1212959
Pubmed Abstract | Pubmed Full Text | CrossRef Full Text | Google Scholar
Schultz, M. D., Schmitz, R. J., and Ecker, J. R. (2012). “Leveling” the playing field for analyses of single-base resolution DNA methylomes. Trends Genet. 28, 583–585. doi: 10.1016/j.tig.2012.10.012
Pubmed Abstract | Pubmed Full Text | CrossRef Full Text | Google Scholar
Seisenberger, S., Andrews, S., Krueger, F., Arand, J., Walter, J., Santos, F.,et al. (2012). The dynamics of genome-wide DNA methylation reprogramming in mouse primordial germ cells. Mol. Cell 48, 849–862. doi: 10.1016/j.molcel.2012.11.001
Pubmed Abstract | Pubmed Full Text | CrossRef Full Text | Google Scholar
Shapiro, R., Braverman, B., Louis, J. B., and Servis, R. E. (1973). Nucleic acid reactivity and conformation. II. Reaction of cytosine and uracil with sodium bisulfite. J. Biol. Chem. 248, 4060–4064.
Shapiro, R., Difate, V., and Welcher, M. (1974). Deamination of cytosine derivatives by bisulfite. Mechanism of the reaction. J. Am. Chem. Soc. 96, 906–912.
Shaw, R. G., Byers, D. L., and Darmo, E. (2000). Spontaneous mutational effects on reproductive traits of Arabidopsis thaliana. Genetics 155, 369–378.
Shirane, K., Toh, H., Kobayashi, H., Miura, F., Chiba, H., Ito, T.,et al. (2013). Mouse oocyte methylomes at base resolution reveal genome-wide accumulation of non-CpG methylation and role of DNA methyltransferases. PLoS Genet. 9:e1003439. doi: 10.1371/journal.pgen.1003439
Pubmed Abstract | Pubmed Full Text | CrossRef Full Text | Google Scholar
Slotkin, R. K., Vaughn, M., Borges, F., Tanurdzic, M., Becker, J. D., Feijo, J. A.,et al. (2009). Epigenetic reprogramming and small RNA silencing of transposable elements in pollen. Cell 136, 461–472. doi: 10.1016/j.cell.2008.12.038.
Pubmed Abstract | Pubmed Full Text | CrossRef Full Text | Google Scholar
Stadler, M. B., Murr, R., Burger, L., Ivanek, R., Lienert, F., Scholer, A.,et al. (2011). DNA-binding factors shape the mouse methylome at distal regulatory regions. Nature 480, 490–495. doi: 10.1038/nature10716
Pubmed Abstract | Pubmed Full Text | CrossRef Full Text | Google Scholar
Trapnell, C., Hendrickson, D. G., Sauvageau, M., Goff, L., Rinn, J. L., and Pachter, L. (2013). Differential analysis of gene regulation at transcript resolution with RNA-seq. Nat. Biotechnol. 31, 46–53. doi: 10.1038/nbt.2450
Pubmed Abstract | Pubmed Full Text | CrossRef Full Text | Google Scholar
Urich, M. A., Nery, J. R., Lister, R., Schmitz, R. J., and Ecker, J. R. (2014). MethylC-seq: base resolution whole genome bisulfite sequencing library preparation. Nat. Protoc. (in press).
Warnecke, P. M., Stirzaker, C., Melki, J. R., Millar, D. S., Paul, C. L., and Clark, S. J. (1997). Detection and measurement of PCR bias in quantitative methylation analysis of bisulphite-treated DNA. Nucleic Acids Res. 25, 4422–4426.
Xie, W., Barr, C. L., Kim, A., Yue, F., Lee, A. Y., Eubanks, J.,et al. (2012). Base-resolution analyses of sequence and parent-of-origin dependent DNA methylation in the mouse genome. Cell 148, 816–831. doi: 10.1016/j.cell.2011.12.035
Pubmed Abstract | Pubmed Full Text | CrossRef Full Text | Google Scholar
Yu, M., Hon, G. C., Szulwach, K. E., Song, C. X., Zhang, L., Kim, A.,et al. (2012). Base-resolution analysis of 5-hydroxymethylcytosine in the mammalian genome. Cell 149, 1368–1380. doi: 10.1016/j.cell.2012.04.027
Pubmed Abstract | Pubmed Full Text | CrossRef Full Text | Google Scholar
Zemach, A., Kim, M. Y., Silva, P., Rodrigues, J. A., Dotson, B., Brooks, M. D.,et al. (2010). Local DNA hypomethylation activates genes in rice endosperm. Proc. Natl. Acad. Sci. U.S.A. 107, 18729–18734. doi: 10.1073/pnas.1009695107
Pubmed Abstract | Pubmed Full Text | CrossRef Full Text | Google Scholar
Keywords: DNA methylation, whole genome bisulfite sequencing, Epigenomics, epigenetics, PCR bias
Citation: Ji L, Sasaki T, Sun X, Ma P, Lewis ZA and Schmitz RJ (2014) Methylated DNA is over-represented in whole-genome bisulfite sequencing data. Front. Genet. 5:341. doi: 10.3389/fgene.2014.00341
Received: 08 June 2014; Accepted: 11 September 2014;
Published online: 21 October 2014.
Edited by:
Mark D. Robinson, University of Zurich, SwitzerlandReviewed by:
Anne Parle-McDermott, Dublin City University, IrelandCuncong Zhong, J. Craig Venter Institute, USA
Michael B. Stadler, Friedrich Miescher Institute, Switzerland
Copyright © 2014 Ji, Sasaki, Sun, Ma, Lewis and Schmitz. This is an open-access article distributed under the terms of the Creative Commons Attribution License (CC BY). The use, distribution or reproduction in other forums is permitted, provided the original author(s) or licensor are credited and that the original publication in this journal is cited, in accordance with accepted academic practice. No use, distribution or reproduction is permitted which does not comply with these terms.
*Correspondence: Robert J. Schmitz, Department of Genetics, University of Georgia, 120 East Green Street, Davison Life Sciences, B416 Athens, GA 30602, USA e-mail: schmitz@uga.edu