Wear is your mobile? Investigating phone carrying and use habits with a wearable device
 Kristof Van Laerhoven
 Marko Borazio2
  Jan Hendrik Burdinski
- 1Embedded Systems, Department of Computer Science, University of Freiburg, Freiburg, Germany
- 2Embedded Sensing Systems, Department of Computer Science, TU Darmstadt, Darmstadt, Germany
This article explores properties and suitability of mobile and wearable platforms for continuous activity recognition and monitoring. Mobile phones have become generic computing platforms, and even though they might not always be with the user, they are increasingly easy to develop for and have an unmatched variety of on-board sensors. Wearable units in contrast tend to be purpose-built, and require a certain degree of user adaptation, but they are increasingly used to do continuous sensing. We explore the trade-offs for both device types in a study that compares their sensor data and that explicitly examines how often these devices are being worn by the user. To this end, we have recorded a dataset from 51 participants, who were given a wrist-worn sensor and an app to be used on their smartphone for 2 weeks continuously, totaling 638 days (or over 15,300 h) of wearable and mobile data. Results confirm findings of previous studies from North-America and show that smartphones are on average being on their user <23% of the time, mostly during working hours. Just as noteworthy is the high variance in smartphone use (in carrying, interacting with, and charging the phone) among participants.
1. Introduction
Mobile phones have become increasingly general purpose and personal computers that fit in the user’s pocket, being used by a growing number of people around the world. The usage of these general-purpose platforms is experiencing an unprecedented uptake: in 2013, almost 1 billion devices have been sold worldwide1; in the year before, a recent publication by the United Nations Organization claimed that more people worldwide had access to a mobile phone than to a clean toilet. Additionally, approximately 6 billion people in the world have access to a mobile phone. Statistics show a steady increase in the number of smartphone owners all over the world, indicating also that user behavior has been gradually changing over the past years, with smartphone usage topping that of desktop computers. At the same time, smartphones are being used more frequently by the user. We tend to use them to manage our schedules and appointments, as navigation systems to find our way in unknown environments, as flashlights, music players, or to obtain updates on the daily news. Along with their variety of uses, their computing capacity is rising steadily, enabling current generations of smartphones to be used for various application scenarios, as, for instance, in Farrahi and Gatica-Perez (2008), Berchtold et al. (2010), Kwapisz et al. (2011), and Sahami Shirazi et al. (2013). Mobile devices have as such been deployed for capturing and tracking the user’s immediate surroundings and to recognize physical activities of the owner in early research by Ashbrook and Starner (2002) and Brezmes et al. (2009).
Since the acceptance of these mobile devices has reached such a high number, they have been targeted increasingly to be used as devices for self-monitoring and activity capture in more recent research such as Altakouri et al. (2010), Oresko et al. (2010), Bardram et al. (2012), and Bielik et al. (2012). These devices not only sense the user’s frequent whereabouts as described in Mazilu et al. (2013) but also what the user is doing in terms of physical activities as in Sun et al. (2010), be it as part of the quantified-self movement (Swan, 2013), in health care scenarios (Mosa et al., 2012) or to track fitness trends (Seeger et al., 2011). These trends caused researchers to study to what degree these mobiles have become suitable for activity recognition in several studies over the past years, most notably Dey et al. (2011) and Patel et al. (2006). The results of these studies suggest that the phone is within the user’s arms reach about half of the time during the day, indicating that the use of a mobile platform may not be suitable for all user monitoring applications.
We present in this article a novel approach to estimate how frequently the mobile phone is being carried by the user. For this purpose, we use a wrist-worn unit, which registers the user’s physical movements through a 3D accelerometer sensor. The data are compared to those from a custom-built Android application that enables us to log the inertial sensing modalities that almost every smartphone has embedded. Both recording methods, the wrist-worn device and the android App, were designed so that they would minimally impact their user’s phone use and maintenance behavior (e.g., recharging or otherwise interacting with both devices), and this for continuous deployments with the user over up to 2 weeks. The aim is to study smartphone carrying behavior by asking users to continuously wear the wristwatch unit and installing the App on their personal smartphones.
With this system, we carried out a study in which 51 participants were recruited. We installed our Android app on the participants’ personal phones and asked them to continuously (day and night) wear a wrist-worn accelerometer logger over the course of the study, typically up to 2 weeks. This resulted in a total of 638 days or 15,300 h worth of mobile and wearable accelerometer data, which can be used to analyze how often the phone and the wrist-worn unit were actively worn by the 51 users. The results are studied in this paper for the amount of time the two device types were worn, but our investigations also show more in-depth analysis on how different users manage their mobile and wearable devices, and how consistent (or variable) these different behaviors are between users.
The remainder of this article is structured as followed: first, in Related Work, we will highlight research related to this study. Then, in When is the Phone on the User? we will describe the sensing modality we used in this paper, showing in the Study Methodology how we proceed with the data. In Evaluation of Study Results, we depict the results of the study. Following that, a discussion about the limitations and benefits from our approach is given. We conclude with the main study results in the last section, giving also an outlook into future work.
2. Related Work
The current trend for mobile phones is not to produce smaller and lighter models, even though technical advancements might support this, but rather to have more built-in features, especially embedded sensors (Oyvann, 2013). Newer generations of smartphones can manage a growing variety of tasks, and these devices are more and more replacing the typical functionalities of desktop or laptop computers, while being expected to be with the user most of the time. 3D MEMS (microelectromechanical systems) accelerometers, in particular, have become one of the most widespread sensor modules that are embedded in the mobile phone. Recent research has investigated the possibility of using these sensors within mobile phones to detect common and basic physical activities such as walking, jogging, or climbing (Kwapisz et al., 2011), where data gathered from 29 participants indicate that most activities can be recognized with over 90% accuracy.
Brezmes et al. (2009) describe their approach to classify activities of a mobile phone user based on accelerometer data recorded by the phone itself in real-time. For a Nokia N95 phone, they used the Python API aXYZ1 to obtain the accelerometer data and a socket-connected Java program to classify activities. While their attempt to identify activities proved difficult in practice, the authors did manage to get more than 70% accuracy in pattern recognition using a set of training records for each activity and a k-nearest neighbors algorithm on the Euclidean distance between a current record and the previously classified records.
Similar results had already been published in a 2006 paper by Iso and Yamazaki. In Iso and Yamazaki (2006), they report an accuracy of around 80% for walking, running, and walking stairs using wavelets. To be able to cope with the computational effort of their approach, all the classification work has been done on a dedicated server, while the phone was primarily used to collect the data. A recent approach described in Nam et al. (2013) combines the accelerometer with a video capturing device. In combination with optical flow techniques, they were able to increase the accuracy for the respective gaits to an overall average of 96%.
Researchers in Reinebold et al. (2011) investigated which features can be used to detect inactivity in a mobile phone. For this purpose, they collected accelerometer and gyroscope data from six different participants who were asked to follow a script to obtain movement and non-movement data over a short period of time (5 min). Different features were extracted and the data were used in different classification techniques (e.g., k-Nearest-Neighbor – kNN), which yield and accuracy for detecting the aforementioned states of approximately 95%. Whether the approach shown in Reinebold et al. (2011) holds true for most of the phone users has still to be evaluated, as only six participants were included in the experiment. Nevertheless, detecting motion or non-motion is important, especially if the goal is to determine if a mobile phone is a suitable platform for activity recognition.
A different study in Hausmann et al. (2012) depicts how accelerometer data can be used to track physical activities on a mobile phone. By annotating the recorded data directly on the phone, a self-tracking mechanism is presented for walking activities (according to the environment, e.g., walking on a treadmill or flat surface, etc.) that accurately shows how much the user is moving during the day.
As all these studies illustrate, it is feasible to use the mobile phone as a device to detect and log the user’s activities, provided the users carry their phones along throughout the day. Whether such a device is suitable as a continuous sensing platform, and whether it stays in the user’s proximity, has been investigated before by Patel et al. (2006) and followed up by Dey et al. (2011). Both studies conclude that users are farther away from their phones as one might expect, by making use of the received signal strength of a neck-worn Bluetooth token to record its distance to the mobile phone as within arms length, within room or no signal, based on calibration data. The study’s findings suggest that the phone is within arms length <50% of the day, within the room for about 65% of the time and switched off for most of the remaining time. Interestingly, the portion of the day for which the phone is within arms length seems to decrease from 2006 to 2011 while the amount of time the phone is in the same room has increased. In addition, both studies indicate that the proximity of smartphones to their users has not changed significantly in the meantime. Since both of these studies had a relatively small user base focused on North-America, these findings may vary elsewhere and may have changed in the past years. Additionally to the proximity evaluation, both studies recorded a vast amount of sensor data from the phones and users were interviewed in order to produce a journal about their activities during the experiment. With such a journal, the user behavior was structured into 15–20 classes of activities each related to one of the three smartphone distances. Using a decision tree, the recorded data were matched to one of these classes. An accurate prediction was reached by ranking the different features based on the ground truth data using the Bluetooth tokens. Interestingly, the study did not find a “one-fits-all” decision tree: the ranking of the single features for an accurate decision differed from participant to participant.
This paper presents (1) an alternative method to those presented in Dey et al. (2011) and Patel et al. (2006) to research user proximity to their phone, by requiring study participants to wear an accelerometer-based logger on the wrist and install an accelerometer-logging app on their Android phones. As a second contribution, we present (2) a study that uses this system with 51 participants [almost double the size of Dey et al. (2011) and Patel et al. (2006)]. By correlating the amount of motion present in the data from their wearable unit and their mobile phone, we estimate when the phone is being carried by the user (in the front pocket, in the hand, in a bag, etc.). This effectively means that the proximity measure for our method will be restricted to on the user or elsewhere, yet we argue that this measure in itself is already interesting for research, and that our method does have significant advantages over the wearing of Bluetooth transceivers.
3. When is the Phone Carried by the User?
Our method depends on two sources of information that are synchronized and matched: (1) a miniature wrist-worn sensor that records the user’s motions, and (2) a sensor data recording app for Android. In this approach, the data measured by the wrist-worn unit serve as an indication on when the user was physically active, while the data recorded by the mobile phone characterize when the mobile phone was experiencing acceleration. A comparison of both could therefore result in estimating when the phone is experiencing the same acceleration as its user, and therefore when the mobile phone was on the user. After the description of the respective information sources, we will outline assumptions and limitations of this method.
3.1. Wearable Sensor
The wrist-worn device used in this study has been designed to record inertial data for long-term experiments. It uses an Analog Devices ADXL345 accelerometer sensor has a battery lifetime of up to 2 weeks for continuous (day and night) 100 Hz logging, and stores the collected data to a micro-SD memory card. Optionally, the device can be equipped with an additional OLED screen (see Figure 1) and a Bluetooth module. The sensor unit was configured for our experiments to record at a sensitivity of ±4g and a frequency of 100 Hz (i.e., a 3D acceleration vector every 10 ms). Once the data are uploaded after the study period (via USB) and converted to acceleration values in g, the raw values can be plotted over time to obtain an impression on when participants have been moving or not. An example of such data is depicted in Figures 1 and 2 for a time period of 24 h. While sleeping, for instance (here between 03:00 and 12:00), the inertial data exhibit significantly less movement, with the data changing only whenever the user is transitioning between sleep poses. On the other hand, it is important to note that with these settings, inertial data when the unit is worn on the wrist, even when sleeping or resting, exhibits significantly more variation, compared to when the unit has been taken off.
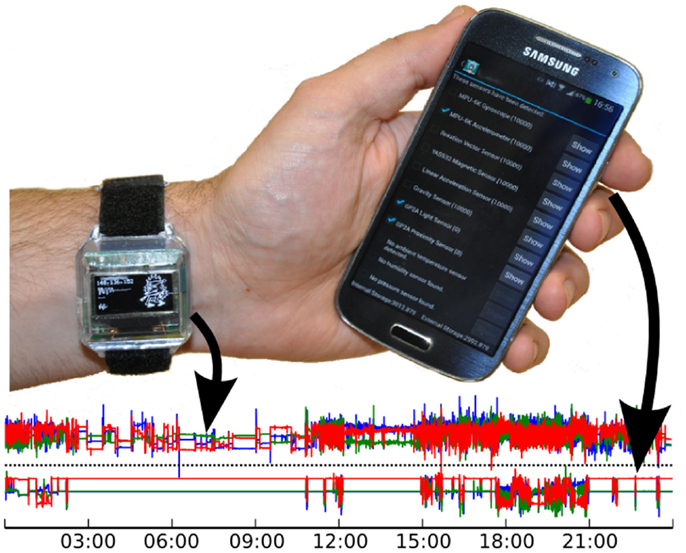
Figure 1. Our study uses a continuously worn and watch-like unit (left, top plot) and an Android App running on the user’s smartphone (right, bottom plot), that both record 3D inertial data. Our method compares these two sources to estimate when the phone was carried on the user, over the course of several weeks.
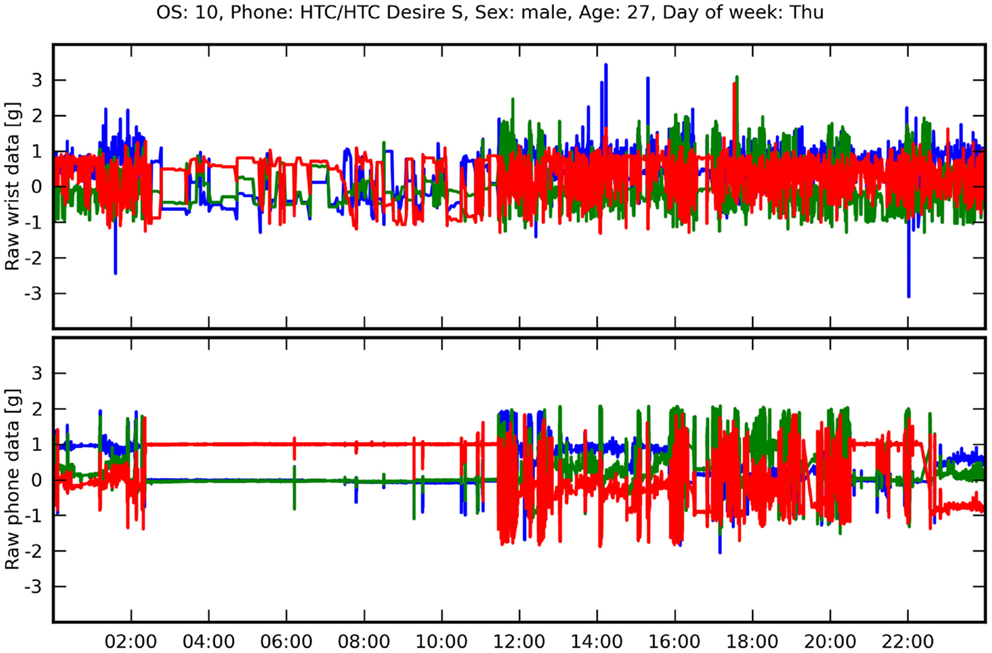
Figure 2. Raw 3D acceleration over a day from a wrist-worn sensor and the phone of a participant (male, age 27). The phone was put on the mattress while sleeping: the bottom plot exhibits peaks in the phone data (6:00–11:45) that correlate with some sleep pose transitions in the wrist-worn’s data (top plot).
3.2. Android Sensor Recording App
The Android app has been developed based on the Android framework to compare the inertial data from the wrist to those from a phone, therefore recording similar data with a mobile phone, using its built-in sensors. The app is compatible with phones running Android 2.3.3 or higher (covering a majority of Android phones, and smartphones in general) and can record from all sensors available within the Android sensor framework. The sensor data are directly put into an SQLite database as provided by the Android framework.
The first challenge when developing an Android app is that it has to support various Android versions and should operate robustly. A first obstacle in the Android framework for this follows from its policy for management of resources, having different priorities for processes and their threads that will influence scheduling. Additionally, Android distinguishes between processes in the foreground and processes in the background, which is important to consider for our app: in resource critical situations, the processes will be handled differently by the framework, such as being shut-down automatically. For this reason, we implemented our recording software as a background service, so that it does not impact the recording software according to the user’s phone behavior by using a partial wake lock, which requires only the CPU to stay awake.
When recording data in the background it is possible that periods of time exist when the app is not recording any data. This was especially the case with older phone models with limited processing resources (like single-core processors) and while users were talking on the phone. Therefore, we implemented our Android app to automatically restart itself after an unexpected shut-down. This impacted only slightly the selection of participants in our study, as most participants owned newer Android phone models.
The Android sensor framework uses the International System of Units instead of g for the inertial data, which is stored directly in the database to ensure that no accuracy is lost. Preliminary tests showed that a reliable sampling rate, like the one of the wrist-worn sensor, is difficult to obtain in the Android framework (100 Hz being unobtainable). Some exemplary data recorded with the Android app are shown in Figure 1 bottom, along with the previously discussed wrist data. The comparison of both plots in Figure 1 already allows to make a coarse-grained inspection about when the phone might have been with the user or not. Immediately noticeable is that the phone data exhibit far more “flat,” motionless segments than the wrist data. This particular user was carrying the phone in the front pocket [as approximately 57% of males tend to do (Ichikawa et al., 2005; Steinhoff and Schiele, 2010)] during the day and on the mattress while sleeping, but this is certainly not representative for most phone users.
3.3. Data Comparison
For this study, we rely on motion from the smartphone and the participant’s wrist. However, the data recorded by both platforms cannot be compared directly for the following reasons: (1) both devices are carried in different positions and will therefore experience different motion patterns and force of acceleration. (2) With such, the axes of the sensor coordinate systems will unlikely be aligned to each other most of the time. (3) Data are recorded by both systems independently, since intervals between smartphone sensor readings (readings were time-stamped on the phone as they were obtained) tend to vary substantially, with the most robust rates obtained for 10 Hz, while the wrist-worn sensor records accurate equidistant 3D acceleration samples.
In order to compare the two datasets from both wearable and phone over longer stretches of time, we calculate the variance of the magnitude of the 3D acceleration vector over a 1-min time interval. Using the magnitude of the 3D acceleration, we have to consider only one rotation-invariant scalar value. The variance has the advantage that it does not require calibration with respect to gravity, as the mean would have to. To estimate whether the wearable and mobile devices moved in conjunction, we defined different thresholds on the variances to detect movement segments.
4. Study Methodology and Setup
In order to illustrate our method, a study was held with 51 volunteers, in which these were asked to install our logging App on their Android phone and wear the wrist-worn sensor during a period of 2 weeks. This section will describe further details of the setup for our experiment and will give an overview of the collected data.
4.1. Participants Recruitment
The 51 participants were recruited through a local poster advertisement campaign. As this was done in a university town, about half of them were in some way affiliated with the university (being staff or students), though of various ages. The authors declare that the user study of this article was conducted with knowledge, guidance, and approval of the university’s Ethics board and confirm that all experiments conform to the relevant regulatory standards. The number of 51 persons was initially much larger but only 1 out of 5 persons that responded to the advertisement participated in the study and delivered a full dataset. Reasons mentioned for not being part of the experiment were either because people did not respond after a first contact or they decided not to participate after a detailed explanation of it. Although the data in our method were stored locally on the device, especially students with an engineering background cited privacy concerns as a main reason for not participating. Interestingly, comfort concerns for wearing the wrist sensor 24/7 were rarely mentioned as a reason not to take part: during the study, five participants had to take off the sensor for a few nights due to being uncomfortable sleeping with it.
The participants’ ages range from 14 to 62 years. In total, 10 female and 41 male participants participated in the study. All participants were asked to partake in this study with their personal Android phone. The study was advertised with the purpose of obtaining inertial data to detect daily activities afterwards, the participants were not told that we investigated the user’s phone carrying habits to avoid bias. We met with the participants three times during the study: an initial meeting explained the purpose of this study, showing the participants our privacy policy ensuring anonymization of the data after the trial would be completed. Additionally, the wrist-sensor functionality was explained and the sensor handed out to the participants. In addition to wearing the sensor, we asked the participants to keep a journal of their sleeping times. A second meeting was held after 1 week to ensure that data had been properly recorded, followed a week later by a third meeting for returning the sensor, downloading all data from the smartphone. The participants’ data were evaluated directly to show and explain the real purpose of the study. In addition, we conducted a post-study interview concerning wearing comfort of the sensor and their perception of how often participants estimate to carry their phone on the body, as well as the perceived power consumption of the Android app.
Table 1 summarizes the demographic information on all the 51 participants that took part throughout the study, additionally showing the amount of data obtained from the wrist-worn sensor and the smartphone, as well as how often the user charged the smartphone during the study, plus the total number of days recorded. As expected, we gathered almost a continuous recording of smartphone data for all the participants. A few outliers (users 2, 7, 12, 19, 38, and 46) are visible, because either the app stopped recording due to the power saving mode of the phone (which is always switched on when battery power is low enough) or the phone running out of battery power. In these cases, participants switched off the app by themselves, unfortunately sometimes also forgetting to switch it back on again. Participant 46 represents an exceptional case: during the study, she was cleaning up her phone storage and by accident deinstalled our Android app, which resulted in deletion of the database entries. Nevertheless, we could obtain the wrist-sensor data, as shown in the table. Due to a hardware problem with his smartphone, participant 38 had problems using his smartphone which is why it was regularly switched off during the study (almost 50% of the time). This probably also explains why for this individual the charging status could not be logged by the app.
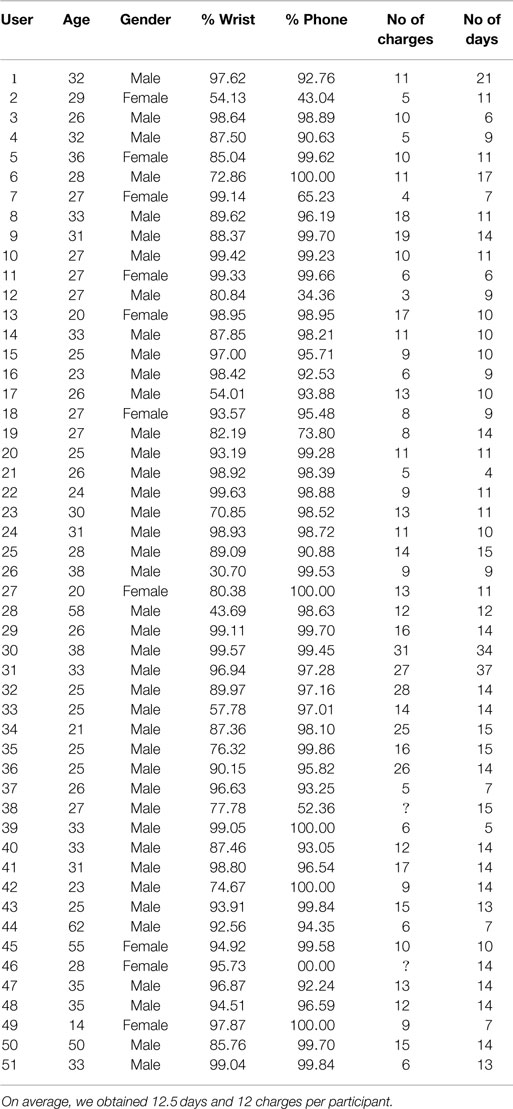
Table 1. Study participant details: information coverage from wrist-worn sensor and smartphone, number of phone charges during the study (the wearable sensor did not need charging), and days recorded.
Recording data with the wrist-worn sensor suffered set-backs for other reasons: obtaining almost 100% of the data over the recording time is almost impossible, since whenever the sensor is taken off long enough, mostly for showering or swimming, the recording is interrupted and data for these times is missing. For 27 participants, we nevertheless obtained almost 100% of recording over the study period. Five participants (users 2, 17, 26, 28, and 33) found it uncomfortable to wear the wrist sensor during most nights, which is why we obtained such a significantly smaller portion of inertial data from their wrist-worn sensors. Additionally, most of the participants tended to take off the sensor on weekends for leisure activities or family celebrations (wearing the sensor with a shirt seemed too uncomfortable). Participant 26 was also on holidays while wearing the sensor, which resulted in data from the wrist-sensor of 30.7% for the whole recording period of 9 days, showing again that wearing devices on the body is hard to accomplish when traveling for private reasons. Two of the study participants were willing to wear the wrist-sensor and log phone data for over 5 weeks, resulting in a recording time of 34 and 37 days for users 30 and 31, respectively. The coverage of obtained data from both modalities for these two participants was also remarkably high: for participant 30, we gathered over 99% of wrist and smartphone data, and for participant 31, around 97% from both recording platforms. On average, we obtained 87.31% of wrist data and 91.22% of smartphone data from all participants. Figure 3 shows examples of the raw acceleration data from two participants (left: female, age 20 and right: male, age 33). The top plots depict the wrist-sensor data and the bottom plots represent the smartphone’s inertial data. We observe here two different phone carrying behaviors: the average female participant carries her phone mostly during the day from approximately 7–19 O’clock while the male participants carried it mostly from the morning until the early afternoon and in the evening. Note here that the smartphone was used shortly before going to bed and again immediately after waking up by both participants: many participants used their phones regularly as an alarm clock.
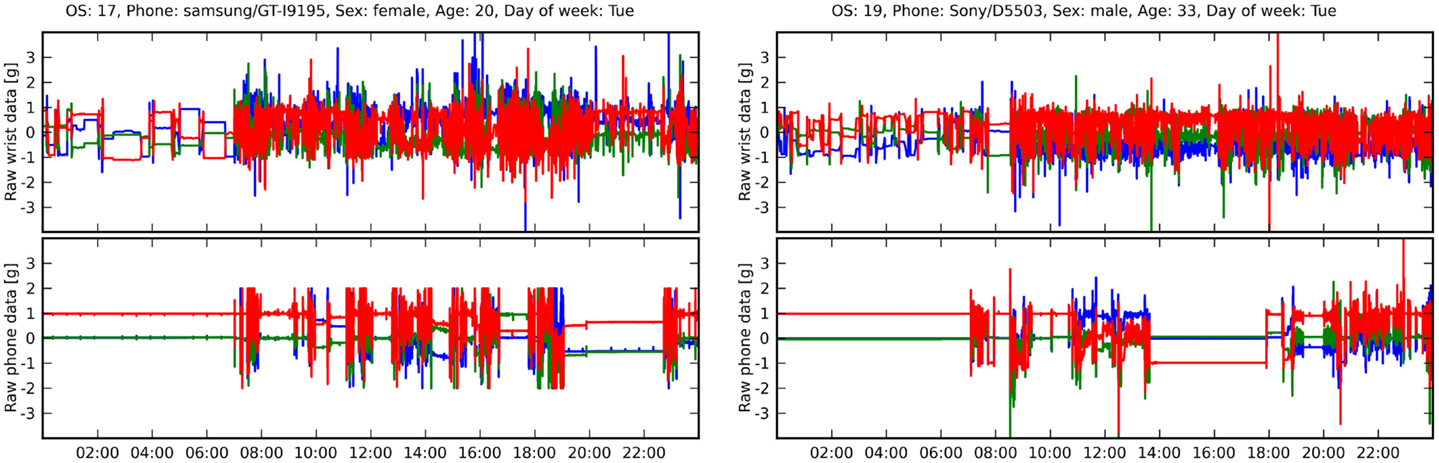
Figure 3. Raw acceleration data from a female (age 20, left plot) and male (age 33, right plot) participant for both wrist-sensor data (top) and smartphone data (bottom). Both plots show the diversity in behaviors: the female participant carries her phone intermittently throughout the working day but less in the morning and evening; the male participant carries his phone mostly throughout the morning and in the evening.
4.2. Variety in Mobile Phones
The fact that participants were using their own phones throughout the study led to a high variety of different models, for which not all of the built-in accelerometer modules were previously known. Additionally, it was not guaranteed that the Android app would be running properly on all devices, since manufacturers tend to modify the Android OS according to their needs, leading to possible problems for recording continuously without interruption. Fortunately, we obtained most of the data with the Android app, as indicated in Table 1 by the amount of data recorded by the smartphone. The majority of the phones were from Samsung (23), followed by HTC (11), Sony (8), LG (6), Motorola (2), and Huawei (1). The Android OS installed on the smartphones varied from 10 to 19, with platform version 10 corresponding to Android OS 2.3.x (9 participants), platform versions 14 and above to Android 4.x.x (OS 15 = 5, OS 16 = 9, OS 17 = 8, OS 18 = 7, and OS 19 = 13 participants). Note here that Android OS versions 11–13 are only installed on Android Tablet models and therefore are not present in this study. None of the above mentioned Android phones or OS versions caused problems in the app, which is why recording data over at least 2 weeks was feasible.
5. Evaluation of Study Results
To estimate whether the phone is carried by the user, our method compares each of the detected motion segments from the wrist sensor to the motion segments present in the phone data. For this purpose, we first needed to obtain a proper threshold for both datasets to detect these motion segments. We first discuss the chosen parameters and their effect, and then present the correlations between the wearable platform and the mobile phone as obtained in the inertial data.
5.1. Threshold Selection
Key to our method is the choice of a proper variance threshold for the detection of motion in the 1-min windows. We believe that there should be one best threshold that detects accurately all motion segments over all devices and OS Android versions. Therefore, we aimed to set a threshold that applies for all models, with which we primarily filter out noise and artifacts due to the unstable logging frequency which the Android framework delivers2.
Essentially, we made the following assumptions to determine the thresholds for the entire study: (1) A phone never moves without its user. We assume this to be true most of the time when using large and long-term datasets. Nevertheless, a user might lend his phone to someone else or leave the phone where it experiences motion (e.g., a stationary phone that vibrates due to a received message or email might generate phone motion without the user moving). This might, however, lead to a bias in small studies, though we have not found such occurrences in our dataset. (2) The phone does not move while charging or during the user’s sleep. Although users could sleep in means of transport (e.g., bus or plane) and could be charging their phone in transit (e.g., in the car or in a train), none of our study participants was found to have done so. We found by experiment that a threshold of 0.000012 g delivered the best results among all participating devices: higher thresholds do not increase the precision but lead to a further drop in recall, meaning that motion of the phone might have been missed. Additionally, lower thresholds tend to detect phone motion where there is assumed to be no motion (e.g., when sleeping).
5.2. Mobile Phone vs. Wearable Data
We applied the threshold on the variances of the inertial data using a window size of 1 min. A first glimpse at estimated movements on both the wrist and the phone data is given in Figure 4. It shows for two male participants in each plot from top to bottom: the battery charging status, the sleep segments as annotated by the participant, the raw inertial data from the wrist sensor, the detected movement segments from this sensor, and the detected movement intervals of the smartphone data for 1 day. In the left plot, several motion segments are immediately visible during the night, although one might expect that the phone should not be moving. During the study, this participant put the phone on the mattress while sleeping, which is why we observe motion during sleep in the smartphone data. Additionally, we see for both participants that the wrist-sensor recorded far more motion segments during the day in contrast to while sleeping, which makes sense since we move mostly during the night when we change postures. Note here that two different charging behaviors can be observed: on the left, the participant was charging his phone during the night, while on the right the participant charged only during the day while at home. In total, over 46% of the charging events from all 50 participants happened during the night. Thirty-one percent of the charging occurred during the day between 9:00 and 18:00, mostly while people are at work or in the university. The other 23% happen in the morning or when people are at home in the evening.
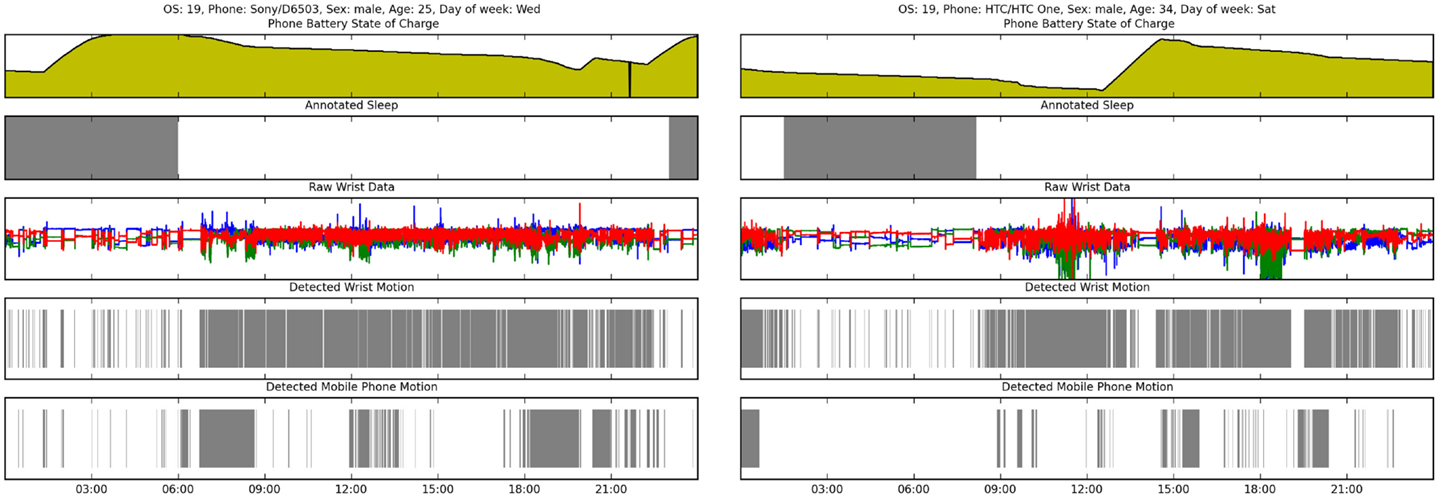
Figure 4. Results for two male subjects for 1 day showing from top to bottom: battery charge status, sleep as annotated by the participant, raw acceleration data from the wrist-worn sensor, motion as detected by the wrist-worn sensor, and the thresholded detection of movement according to the smartphone’s acceleration data. The left plot shows a participant who put his phone on the mattress while sleeping as depicted by the black bars that represent the movement per minute.
On average, participants carried their phone with them for 22.19% of the time throughout the whole study (note: this figure holds for day-and-night monitoring, as opposed to previous studies investigating phone usage during the day). Per participant the results vary a lot, however, from 3.87% up to 52.91%, highlighting also that the results depend on the individual user’s habits. The dataset includes participants who excessively used their phone, most noticeably for playing Ingress3 (3 users: 13, 21, and 22), an augmented-reality game, which correlates with high smartphone usage. For these users, the carrying phone results are substantially higher than the average (up to 52%). Some participants forgot to charge their phone on a few occasions during the study, which led to a shut-down of the recording application and therefore to data loss. Five participants found it uncomfortable to wear the wrist-worn sensor during the night, which is why they took off the sensor on most nights.
Smartphones are on the user at different times of the day. The results listed in Table 2 depict when the users had the smartphone on them at defined times of the day [using the divisions as in Dey et al. (2011)]: in the morning (7:00–9:00), during the day (9:00–18:00), in the evening (18:00–23:00), and during the night (23:00–7:00). Additionally, we calculated the amount of wearing time during the whole day (from 9:00 to 23:00, last column). As expected, users carried their phone mostly during the day. In contrast to the overall results of 22%, participants, on average, carry their phone for 35.59% of the time from 9:00 to 23:00. Depending on the participants time schedule (especially between students and office employees), the individual results vary highly. Participant 1, for example, uses his smartphone almost only while being at the office (9:00–18:00), while user 49 seems to be carrying his phone almost all day long. These findings suggest that not only the type of user monitoring application but also the habits on phone usage of the targeted user need to be known in advance. Note here that user 46 was excluded from the evaluation step, since the phone data were deleted by accident. In the following paragraphs, we will discuss the benefits and drawbacks of this study and especially the results.
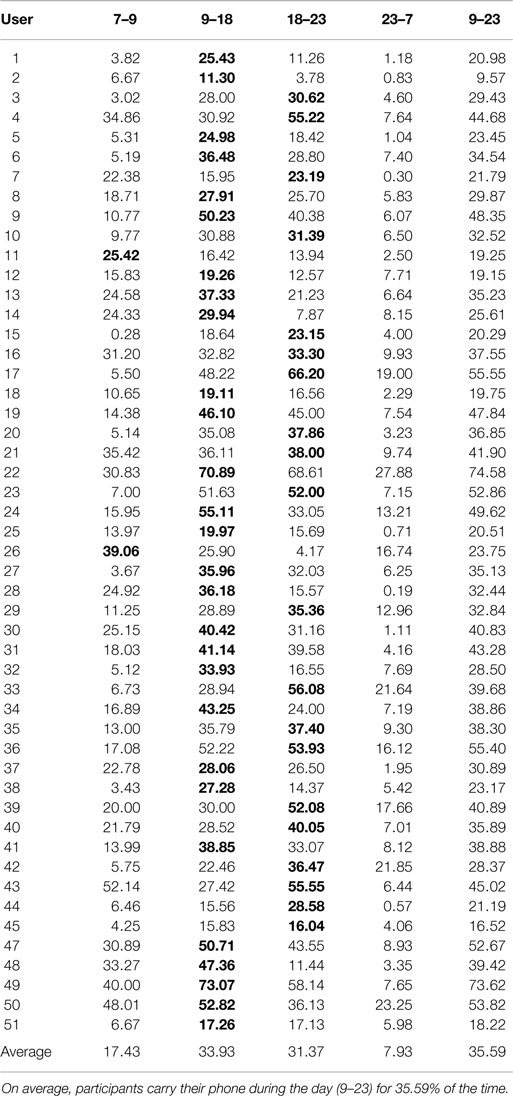
Table 2. Results for all users showing in percent if they were wearing their smartphone at specific segments of the day with maximum values highlighted.
5.2.1. Demographic Specificity
In contrast to the work of Dey et al. (2011) and Patel et al. (2006), which evaluated the proximity to the phone in the North-American region, we investigated the carrying behavior in a European country. We believe that cultural differences exist, which is being reflected in the behavior of a countries’ population as well. To the best of our knowledge, such an experiment as presented in this section has not been conducted yet outside North-America.
5.2.2. Acceptance of the Wrist-Worn Unit
The wrist sensor used for this study was perceived as comfortable to use by most of the participants and most reported that they quickly forgot about it while wearing it. The fact that the device’s battery charge lasts more than 14 days, meant that participants did not have to charge or manage the device themselves. Although for five participants the device was not always comfortable enough to wear during their sleep, these users did remember to wear their unit again after waking up and the data were reliably recorded for the day-time periods. Nevertheless, the fact that 10% of participants had chosen not to wear the wrist-worn unit during night-time, is a limitation of our method.
5.2.3. Platform Differences
We encountered a difficulty in the evaluation process that has to be considered in future studies that make use of the accelerometer on the smartphone: due to the vast number of different mobile phones that participated in this study, the algorithm for detecting motion segments had to be insusceptible to noise, jitter, or other sources of disturbance. Additionally, different OS versions led to an unbalanced priority for our application to obtain sensor data, since it is handled differently by the OS. Such scenarios should not occur, especially if continuous data are needed to detect, for example, activities with a smartphone. A benefit of using the accelerometer though, is the fact that it does not require any security permissions, which is why most of the applications available in the Google Play store use it.
5.2.4. Power Consumption of the Android App
According to the participants, their phone-charging routine did not change significantly, since most of the users charge their phone overnight (almost 47%), as depicted in Table 1. The smartphone’s battery lasts for typically a minimum of 24 h under normal usage while having the app running. This was an early design constraint for the application since an application that drains too much power will quickly be deinstalled by the user. An exception was the two elderly participants in our study: since both of them are using their smartphones primarily to make phone calls, our application forced them to charge the phone every day instead of every three days. In total, two users contacted us during the trial to discuss the higher power consumption. Power consumption also depends highly on the CPU-type and the Android OS version.
5.2.5. Proximity to the Phone
Participants have their phone on them for 36% during the day time on average, and 22% over the whole study on average. This is over a half of the time reported by Dey et al. (2011) and Patel et al. (2006) that the phone is within arm’s length of the user (58 and 53%, respectively). Interviews showed that indeed many participants put their phone on the desk or at a table nearby, especially while working and during the night. Additionally, some participants put their phone on the mattress while sleeping, either because they used it before falling asleep or to have it immediately on hand when waking up. An exception was, for instance, a 14-year-old participant that was supposed to switch off the smartphone while attending class, but rather muted it during the whole day. During that time, the phone was always in the front pocket and therefore being carried on the body most of the time. We argue that the on the user proximity information could give extra insight in future studies, especially those that explore the use of smartphones as wearable devices.
5.2.6. The User’s Perception
Especially when we interviewed the participants after the study, we asked them about their perceived smartphone behavior. Interestingly, many participants underestimated their smartphone usage. The most common answer was “I almost never use the phone while being at work.” This was proved wrong for most of the participants. Even though the smartphone is lying on the table while the user is at his desk, whenever the user leaves his desk the smartphone is put in the pocket. Many participants became aware of that fact after the study. For context-based systems such knowledge is crucial, since it shows that the smartphone is a suitable platform for sensing the environment. In their conclusion, Dey et al. (2011) and Patel et al. (2006) stated that the mobile phone is farther away from its user than expected. In contrast to that, we conclude that the mobile phone is being carried on the body more often than assumed by the users.
5.2.7. Long-Term Dataset and Future Uses
The recorded dataset consists of almost 638 days of sensor data from two modalities that can be used in future studies: (1) the smartphone data imply not only acceleration data and battery status information but also light intensity values and the proximity sensor values. (2) The wrist-worn sensor logged the inertial data and, at the same time, the light intensity. Additionally, the dataset contains a sleep diary from almost every participant. Such information enables future studies that aim at detecting, for example, sleep segments with a mobile phone only.
6. Conclusion
We presented an approach that estimates how often the user’s smartphone is carried by the user, by relying on an additional wrist-worn sensor that can be continuously worn for several weeks and a smartphone App. By exploiting the fact that inertial sensors are present in almost all smartphones, the data from both devices can be matched to estimate carrying behavior. This approach can be combined with the previously suggested methods by Dey et al. (2011) and Patel et al. (2006), and allows for a characterization of when the phone’s built-in sensors could be expected to monitor the user, most notably to detect the user’s physical activities (such as being sedentary, walking, and running).
We performed a 51 participants study using this method over 2 weeks per users, resulting in a dataset of over 638 days (or more than 15,300 h) of recorded data from both modalities used. The analysis of these data indicates that the users’ smartphones are on the user on average 23% of the time (day and night). This figure is considerably higher for some users (up to 52%) and considerably less for others (4%). During day time (9:00–23:00), our results show that users have their phone on them on average 36% of the time. The study also suggests that users have very different habits in phone-charging behavior and usage, stressing the importance of knowing the target users when designing activity monitoring apps for smartphones that require the user to be carrying their phone.
We argue that the method of investigating phone use through the comparison of inertial data from phone with a wrist-worn sensor is particularly interesting for long-term activity studies. Future work includes the deployment of the app and wrist-worn sensors on a larger scale and for a time-span of several months, and additionally seeks to use the inertial data taken during the study for activity recognition.
Both the anonymized dataset and the Android app are publicly available at http://www.ess.tu-darmstadt.de to encourage others to perform similar studies.
Conflict of Interest Statement
The authors declare that the research was conducted in the absence of any commercial or financial relationships that could be construed as a potential conflict of interest.
Acknowledgments
We thank all study participants for their commitment in wearing the wrist-worn activity logger and using the Android app for at least 2 weeks. Funding: This work was sponsored by the Emmy-Noether project Long-Term Activity Recognition with Wearable Sensors (LA 2758/1-1) from the German Research Foundation (DFG).
Footnotes
- ^Statistica: Global Smartphone Sales to End Users 2007–2013. http://goo.gl/WEkCJO
- ^Android only takes a desired delay between sensor readings as a configuration parameter.
- ^https://www.ingress.com/, [lastaccess, 11/2014]
References
Altakouri, B., Kortuem, G., Grunerbl, A., Kunze, K., and Lukowicz, P. (2010). “The benefit of activity recognition for mobile phone based nursing documentation: a wizard-of-oz study,” in International Symposium on Wearable Computers (ISWC), 2010 (South Korea: IEEE), 1–4.
Ashbrook, D., and Starner, T. (2002). “Learning significant locations and predicting user movement with GPS,” in International Symposium on Wearable Computers (ISWC) (White PLains: IEEE), 101–108.
Bardram, J. E., Frost, M., Szántó, K., and Marcu, G. (2012). “The MONARCA self-assessment system: a persuasive personal monitoring system for bipolar patients,” in 2nd ACM SIGHIT International Health Informatics Symposium (New York: ACM), 21–30.
Berchtold, M., Budde, M., Gordon, D., Schmidtke, H. R., and Beigl, M. (2010). “Actiserv: activity recognition service for mobile phones,” in International Symposium on Wearable Computers (ISWC) (South Korea: IEEE), 1–8.
Bielik, P., Tomlein, M., Krátky, P., Mitrík, Š, Barla, M., and Bieliková, M. (2012). “Move2Play: an innovative approach to encouraging people to be more physically active,” in 2nd ACM SIGHIT International Health Informatics Symposium (New York: ACM), 61–70.
Brezmes, T., Gorricho, J.-L., and Cotrina, J. (2009). “Activity recognition from accelerometer data on a mobile phone,” in Distributed Computing, Artificial Intelligence, Bioinformatics, Soft Computing and Ambient Assisted Living, eds S. Omatu, M. P. Rocha, J. Bravo, et al. (Heidelberg: Springer), 796–799. Available at: http://dl.acm.org/citation.cfm?id=2030135
Dey, A. K., Wac, K., Ferreira, D., Tassini, K., Hong, J.-H., and Ramos, J. (2011). “Getting closer: an empirical investigation of the proximity of user to their smart phones,” in Ubiquitous Computing (ACM), 163–172. doi:10.1145/2030112.2030135
Farrahi, K., and Gatica-Perez, D. (2008). “What did you do today?: discovering daily routines from large-scale mobile data,” in International Conference on Multimedia (Pittsburgh: ACM).
Hausmann, J., Wac, K., and Bonjour, J. (2012). “Phone in the pocket: pervasive self-tracking of physical activity levels,” in AAAI Spring Symposium: Self-Tracking and Collective Intelligence for Personal Wellness, Stanford, CA.
Ichikawa, F., Chipchase, J., and Grignani, R. (2005). “Where’s the phone? A study of mobile phone location in public space,” in Mobile Technology, Applications and Systems. (Guangzhou: IEEE), 1–8. doi:10.1109/MTAS.2005.243793
Iso, T., and Yamazaki, K. (2006). “Gait analyzer based on a cell phone with a single three-axis accelerometer,” in 8th Conference on Human-Computer Interaction with Mobile Devices and Services (Espoo: ACM), 141–144.
Kwapisz, J. R., Weiss, G. M., and Moore, S. A. (2011). Activity recognition using cell phone accelerometers. ACM SIGKDD Explor. Newsl. 12, 74–82. doi:10.1145/1964897.1964918
Mazilu, S., Blanke, U., Calatroni, A., and Tröster, G. (2013). “Low-power ambient sensing in smartphones for continuous semantic localization,” in Ambient Intelligence, eds J. C. Augusto, R. Wichert, R. Collier, (Heidelberg: Springer), 166–181.
Mosa, A. S. M., Yoo, I., and Sheets, L. (2012). A systematic review of healthcare applications for smartphones. BMC Med. Inform. Decis. Mak. 12:67. doi:10.1186/1472-6947-12-67
Nam, Y., Rho, S., and Lee, C. (2013). Physical activity recognition using multiple sensors embedded in a wearable device. ACM Trans. Embedded Comput. Syst. 12, 26. doi:10.1145/2423636.2423644
Oresko, J. J., Jin, Z., Cheng, J., Huang, S., Sun, Y., Duschl, H., et al. (2010). A wearable smartphone-based platform for real-time cardiovascular disease detection via electrocardiogram processing. IEEE Trans. Inf. Technol. Biomed. 14, 734–740. doi:10.1109/TITB.2010.2047865
Oyvann, S. (2013). The Huge Rise in Huge Phones: Bigger Screens Really are Getting More Popular. Available at: http://goo.gl/Xb7k6Q
Patel, S. N., Kientz, J. A., Hayes, G. R., Bhat, S., and Abowd, G. D. (2006). “Farther than you may think: an empirical investigation of the proximity of users to their mobile phones,” in Ubiquitous Computing, eds P. Dourish, A. Friday (Orange County: Springer), 123–140.
Reinebold, J., Vathsangam, H., and Sukhatme, G. (2011). Inactivity Recognition: Separating Moving Phones from Stationary Users. Seattle: ACM.
Sahami Shirazi, A., Henze, N., Dingler, T., Kunze, K., and Schmidt, A. (2013). “Upright or sideways?: analysis of smartphone postures in the wild,” in Human-Computer Interaction with Mobile Devices and Services, eds M. Rohs, A. Schmidt, D. Ashbrook, E. Rukzio (Munich: ACM), 362–371.
Seeger, C., Buchmann, A., and Van Laerhoven, K. (2011). “myHealthAssistant: a phone-based body sensor network that captures the wearer’s exercises throughout the day,” in Body Area Networks, 1–7.
Steinhoff, U., and Schiele, B. (2010). “Dead reckoning from the pocket – an experimental study,” in Pervasive Computing and Communications. (Mannheim: IEEE), 162–170. doi:10.1109/PERCOM.2010.5466978
Sun, L., Zhang, D., Li, B., Guo, B., and Li, S. (2010). “Activity recognition on an accelerometer embedded mobile phone with varying positions and orientations,” in Ubiquitous Intelligence and Computing (Springer), 548–562. doi:10.1007/978-3-642-16355-5_42
Keywords: wearable computing, mobile computing, smartphone use, activity sensing, wrist-worn inertial sensing
Citation: Van Laerhoven K, Borazio M and Burdinski JH (2015) Wear is your mobile? Investigating phone carrying and use habits with a wearable device. Front. ICT 2:10. doi: 10.3389/fict.2015.00010
Received: 12 March 2015; Accepted: 02 May 2015;
Published: 19 May 2015
Edited by:
Bruce Hunter Thomas, University of South Australia, AustraliaReviewed by:
Maki Sugimoto, Keio University, JapanThuong Hoang, The University of Melbourne, Australia
Copyright: © 2015 Van Laerhoven, Borazio and Burdinski. This is an open-access article distributed under the terms of the Creative Commons Attribution License (CC BY). The use, distribution or reproduction in other forums is permitted, provided the original author(s) or licensor are credited and that the original publication in this journal is cited, in accordance with accepted academic practice. No use, distribution or reproduction is permitted which does not comply with these terms.
*Correspondence: Kristof Van Laerhoven, Embedded Systems, Department of Computer Science, University of Freiburg, Georges-Koehler-Allee 10, Freiburg 79110, Germany, kristof@ese.uni-freiburg.de