Mobile video-to-audio transducer and motion detection for sensory substitution
 Maxime Ambard
 Yannick Benezeth
 Philippe Pfister
- 1Laboratoire d’Etude de l’Apprentissage et du Développement (LEAD), CNRS UMR 5022, Université de Bourgogne Franche-Comté, Dijon, France
- 2Laboratoire d’Electronique, Informatique et Image (LE2I), CNRS UMR 6306, Université de Bourgogne Franche-Comté, Dijon, France
Visuo-auditory sensory substitution systems are augmented reality devices that translate a video stream into an audio stream in order to help the blind in daily tasks requiring visuo-spatial information. In this work, we present both a new mobile device and a transcoding method specifically designed to sonify moving objects. Frame differencing is used to extract spatial features from the video stream and two-dimensional spatial information is converted into audio cues using pitch, interaural time difference, and interaural level difference. Using numerical methods, we attempt to reconstruct visuo-spatial information based on audio signals generated from various video stimuli. We show that despite a contrasted visual background and a highly lossy encoding method, the information in the audio signal is sufficient to allow object localization, object trajectory evaluation, object approach detection, and spatial separation of multiple objects. We also show that this type of audio signal can be interpreted by human users by asking 10 subjects to discriminate trajectories based on generated audio signals.
1. Introduction
Sensory substitution devices translate the information that would normally be received by a specific sensory modality into a distinct physical signal that can stimulate another sensory modality. Vision to Audition (or visuo-auditory) Sensory Substitution Devices (VASSDs) translate visual information (electromagnetic fluctuations) into audio signals (air compression fluctuations) stimulating the eardrums. VASSDs mainly aim to help visually impaired people in daily tasks requiring spatial localization capabilities, such as moving within an unknown environment.
VASSDs form a specific branch of navigation systems for the blind that directly transduce basic visual features into audio cues, letting the brain associate meanings to the transduced signal. By transmitting information concerning the direct visual surroundings, this method is designed for micro-navigation (i.e., near-field navigation). These specifications are in contrast to other navigation systems (for an inventory see Roentgen et al., 2008) that interpret the input signal or use Global Positioning System data before generating semantic audio signals, such as spatialized synthesized speech (Loomis et al., 1998, 2005; Katz et al., 2012).
The modus operandi for VASSDs is generally the following: 1 – acquisition of the visual information using a camera; 2 – extraction of visual features of interest; 3 – sonification of extracted visual features; 4 – stereophonic transmission of the generated audio signal.
Thus, the bi-dimensional position of visual features in the camera’s field of view (FOV) has to be transmitted via audio output. Horizontal position is generally encoded using stereo panning, for example, by associating a right side position in the FOV to a stereophonic sound with larger amplitude on the right channel. Vertical position is generally transmitted using pitch variation associating a more elevated position to a higher tone. This general configuration allows a wide range of choices both for the extracted visual features and for the audio cues used to render spatial information.
The system the vOICe has evolved since the nineties in line with computer hardware and software and is still one of the current major projects in VASSD development (Meijer, 1992; Ward and Meijer, 2010). Nowadays, this system proposes a large choice of configurations. The standard sonification procedure uses gray level images where pixel luminosity is encoded by sound amplitudes. Pitch encoding is used for elevation and stereo panning is used for azimuth. Pictures are acquired at a fixed rate and each of them is progressively sonified from left-to-right during a horizontal scan. Thus, time is used in association with stereo panning to encode horizontal information.
Another system that started slightly later is called Prosthesis Substituting Vision with Audition (PSVA) (Capelle et al., 1998; Arno et al., 1999, 2001). The main differences with this project compared to the previous one are an on-line sonification without left-to-right scans, and frequency encoding depending on both horizontal and vertical positions of the pixels. Edges are detected from images in gray scale and the amplitude of each sound is modulated by the gray level of the corresponding pixel in the image. A better resolution is given to the center of images during the conversion.
More recently, a third project called TheVibe has been developed (Auvray et al., 2005; Durette et al., 2008; Hanneton et al., 2010). With its default configuration, this system associates a specific tone to each region of the acquired image. However, the conceptual sonification scheme, based on the coupling of sensors and receptors, allows for a much more complex sonification. As in PSVA, sounds are generated on-line from whole gray-scale images, without horizontal scans.
Cognitive Aid System for BLInd People (CASBLIP) is a project that was funded by the European commission from 2006 to 2009 (Fajarnes et al., 2010). The system uses stereo-vision to allow real time video processing algorithms to determine the location and velocity of moving objects in the scene, in tandem with depth maps.
The following three other systems attempt to provide a “colorful” experience for the blind by converting pixel colors into sound textures.
EyeMusic (Levy-Tzedek et al., 2012, 2014; Abboud et al., 2014; Maidenbaum et al., 2014a) is based on periodic left-to-right horizontal scans of images in which the sounds of musical instruments are produced depending on the colors of the pixels. The vertical dimension is mapped into a musical pentatonic pitch scale. The system has been slightly modified in a recent version (Maidenbaum et al., 2014b) and it now uses an increased image resolution of 50 × 30 and a hexatonic scale.
SeeColOr (Bologna et al., 2009a,b, 2010; Deville et al., 2009) applies image filters to a stereoscopic colored video acquisition with a Hue-Saturation-Luminance (HSL) color format. A method, based on the combination of several conspicuity maps coming from the extraction of different features, generates a simplified video stream that is afterwards sonified. Pre-defined hue ranges are used to associate musical instruments depending on the color of the pixels. The pitch encodes the saturation and a second musical sound is added depending on the luminance. Spatial information in the FOV is rendered using Head-Related Transfer Function (HRTF).
As presented in Capalbo and Glenney (2010), The KromoPhone proposes three modes of color sonification (RGB, HSL, and RGBYW) associating the amplitude of pre-selected pure tones to the level of each color channel. The KromoPhone partially sonifies an image by extracting the color of a region that surrounds the position of a cursor controlled by the user. The spatial information is not encoded by sounds since the user controls the scan by moving the cursor position and is thus already aware of the spatial localization that is sonified. In other words, the passive left-to-right horizontal scans used in the project thevOICe and EyeMusic is transformed in an active scan controlled by the user. Thus, spatial information concerning the part of the image that is currently sonified is implicitly transmitted by dynamical proprioceptive information.
All these transcoding methods have proven useful for specific tasks. The ability to localize static objects has already been demonstrated (Proulx et al., 2008). Other works have shown that participants are capable of grabbing a distant object (Levy-Tzedek et al., 2012). Visual shapes can be differentiated (Proulx et al., 2008; Brown et al., 2014) and reconstructed (Capelle et al., 1998; Arno et al., 2001), and orientation of letters can be recognized, allowing VASSDs users to exceed the threshold for the World Health Organization definition of blindness on an adapted Snellen’s acuity test (Striem-Amit et al., 2012). Moreover, it has been shown that these systems can be used for walking (Durette et al., 2008; Bologna et al., 2009a), that they allow for the development of distal attribution (Auvray et al., 2005), and that visual phenomenology can be developed within months of immersive use (Ward and Meijer, 2010).
However, the use of such systems by the blind in daily life is still missing both an ergonomic device and transcoding algorithms specially designed for urban locomotion. VASSDs could be especially useful in situations where users voluntarily switch on the system to temporarily check if a silent object is coming from a particular location and to gather information concerning its trajectory. In this paper, we introduce a new project called “LibreAudioView,” which is a powerful, low cost, and portable video-to-audio transducer that can be used to sonify moving objects in complex visual scenes, such as city streets. For this purpose:
• We present new hardware that can be used as an experimental platform for the scientific community, as well as a cheap and miniature assistive device for the blind in daily life.
• We propose to use motion detection in the signal transduction of VASSDs.
• Based on numerical analysis of the transmitted audio signal, we show that spatial information can theoretically be extracted to partly reconstruct objects motions.
• We show that such an audio signal can also be interpreted by human users to retrieve the motion information of visual objects.
The device is an assembly of a miniature camera module integrated into a 3D-printed plastic glasses frame. The camera is connected to a battery-powered mini-computer that performs the video to auditory transcoding using classic pitch encoding and stereo panning encoding for, respectively, vertical and horizontal coordinates. The audio signal is then transmitted to the user using running headphones.
The specificity of this method comes from the video processing that performs frame differencing to extract spatial features. This method has two operating modes. With the first mode, when the camera is static, only the edges of moving objects are detected in the scene. In the second mode, when the camera is moving, edges of both static and moving objects are extracted. Thus, the video stream is simplified by extracting only the edges of objects that can become dangerous obstacles: moving objects when the user is static, and both moving and static objects when the user is moving.
In this work, we exclusively focused on the first operating mode. We recorded and analyzed the output signal generated by the sensory substitution device with a static camera when confronted with various visual stimuli. The encoding scheme used is a high lossy compression method, resulting in numerous interferences and mixing multiple short sounds that partly overlap. Spatial information could be degraded in such a proportion that motion information would not be recoverable. In particular, we explored whether the transcoded auditory signal:
• transmits enough information to precisely localize an object?
• allows for the evaluation of the trajectory of a moving object?
• makes it possible to detect an object approaching the user?
• allows a spatial separation between multiple moving objects?
Section 2 details the technical aspects of both the transcoding device and the experimental setups used. Section 3 shows results obtained by numerical methods and human users concerning the four above mentioned questions. Section 4 discusses advantages and limitations of the system as well as improvements that remain to be implemented.
2. Materials and Methods
In this section, we describe two systems. The first one is the sensory substitution device itself, converting the video stream into an audio signal. The second one is the experimental setup composed of several modules used to display visual stimuli, analyze the generated audio signal, and reconstruct the spatial information.
2.1. Sensory Substitution Device
2.1.1. Hardware Description
The video acquisition is performed by a USB video device class (UVC) camera module featuring a 24-bit color depth and a video resolution of 640 × 480 pixels at 30 frames per second (fps) with a diagonal FOV of 67° (53.6° horizontal, 40.2° vertical). This miniature printed circuit board is integrated into a 3D-printed polylactic acid (PLA) eyeglass frame. The cable runs inside the frame and is connected to the mini-PC by a type-A USB connector.
The components of the mini-computer are placed inside a 3D-printed PLA rectangular box of size 90 mm × 80 mm × 21 mm with several ports: a USB-A port to plug the camera (a USB hub can also be used in order to multiply the connected USB devices such as keyboard and mouse), a micro-USB to directly power the mini-PC and to upload binaries during development process, a HDMI port to connect a screen; a 3.5 mm mini-jack to connect earphones, a mini-SD slot to increase the ROM memory, and a mini-USB port to charge the battery. A strap can be used to wear the box containing the PC around the neck, preventing the camera and earphone cable from hindering the movements of the user.
The computer chip is based on a RocKship3188 featuring a quad-core 1.6 GHz CPU, 2Go DDR3 RAM, Mali-400 MP4 GPU, Wi-Fi 802.11b/g/n and Bluetooth. The battery is a Li-ion rechargeable 1S2P with 4500 mAh capacity providing an autonomy of more than 3 h. A charger–booster module regulates the system power. These specifications make the system well adapted to applications requiring multimedia manipulation in desktop, robotic, and embedded environments. The Android 4.2 Jelly Bean operating system allows downloads of many applications especially designed for the blind. The three main parts of the system (eyeglass, mini battery-powered computer, and earphones) are shown in Figure 1.
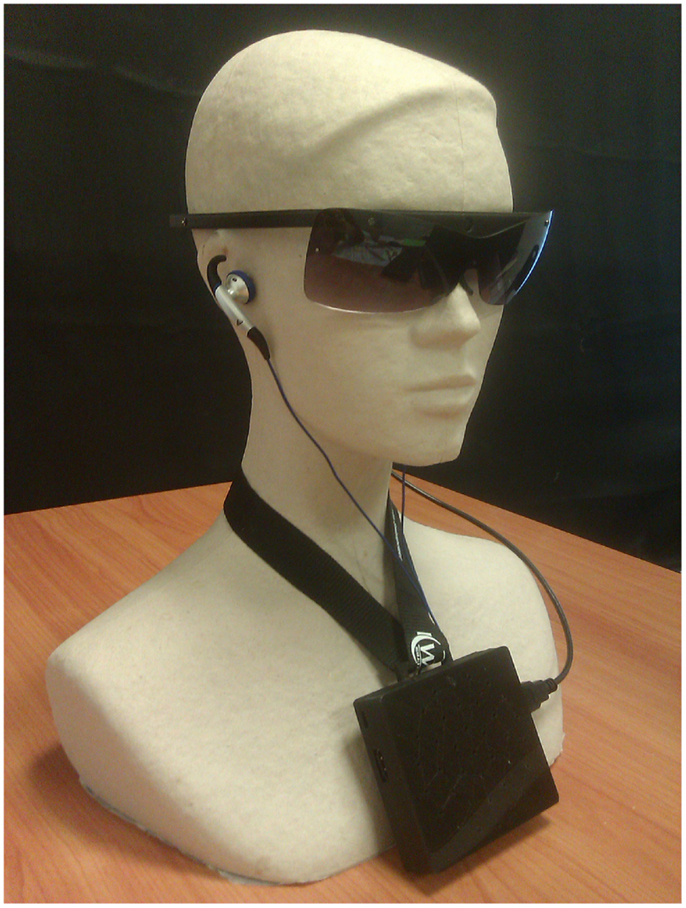
Figure 1. Picture showing main parts of the sensory substitution device. An electronic eyeglass is connected to a battery-powered mini-computer that can be carried around the neck. This computer performs the signal transduction and generates sounds that are transmitted through running earphones.
The audio output is sent using headphones specially designed for urban jogging (such as Sennheiser MX680) with integrated volume control, and earbuds that do not completely block the auditory canal, allowing surrounding sounds to be heard.
2.1.2. Software Description and Transcoding Algorithm Implementation
Although we think that the following transcoding algorithm is suitable for motion detection sonification, the method itself and its associated parameters can be easily changed in the software. The LibreAudioView software is open-source and we encourage other people interested in this field to explore their own method by modifying the software. The LibreAudioView software and samples of sonified video can be dowloaded from our project page1.
The software is developed based on the Java android framework. Video acquisition and video processing is done using “OpenCV for android.” Video acquisition is performed at 30 fps. Images are acquired with a resolution of 640 × 480, converted in gray scale and slightly blurred with a Gaussian filter using a 3 × 3 window with σx = σy = 0.6 to decrease camera noise. For each image, frame differencing processing is performed by computing a pixel by pixel absolute difference of gray levels between the current frame and the previous one. We decided to work with gray-scaled images since using RGB images would only slightly improve motion detection results (Benezeth et al., 2010) while increasing computational load and battery consumption. The result is then thresholded, setting to 255 all pixels with a difference level above a threshold, and setting all other pixels to 0. Resultant images are then rescaled to a resolution of W × H = 160 × 120 (width × height) and transmitted to the sonification algorithm. Figure 2B shows the output of the video processing for two consecutive frames during a target displacement shown in Figure 2A.
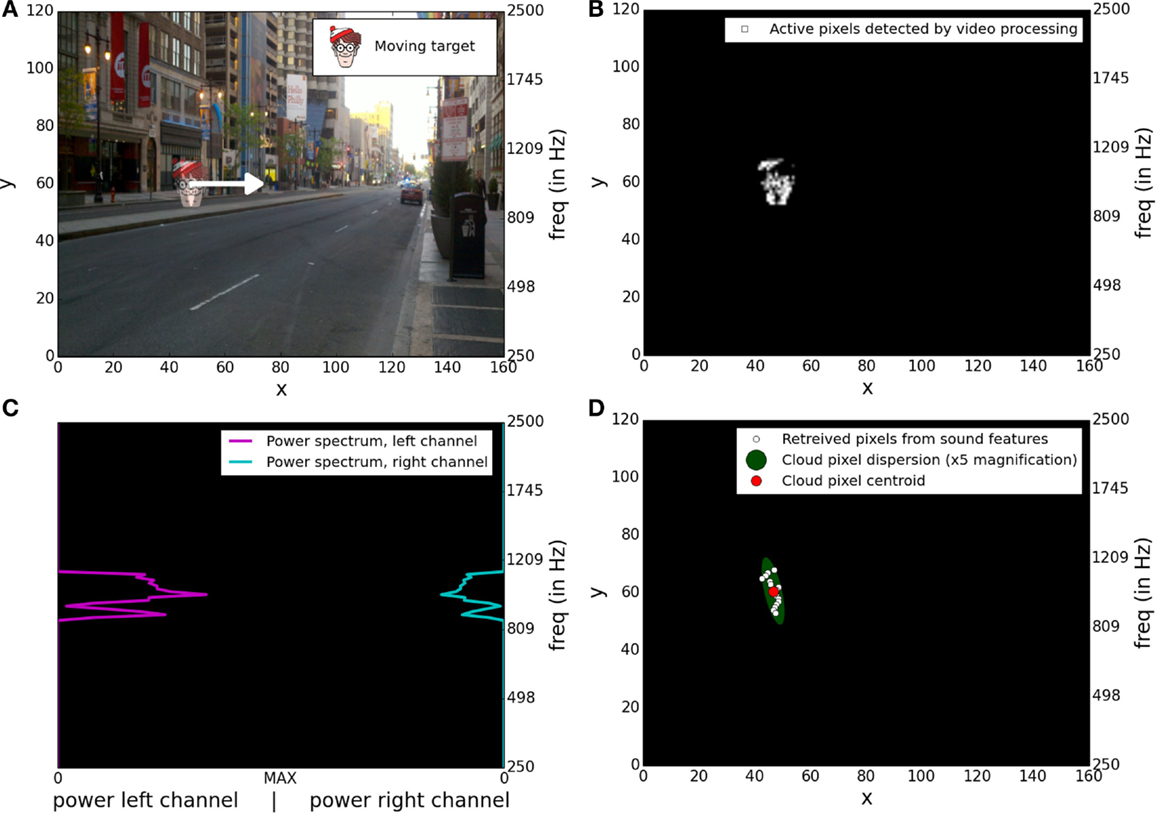
Figure 2. Illustrations of the four main steps of the signal transduction. (A) Superposition of two consecutive frames of the stimulation video where the target is moving from one position to an adjacent one, more on the right. (B) Output of the video processing based on frame differencing applied on the two consecutive frames shown in (A). (C) Stereo power spectrum generated by the sonification method applied on the output of the video processing presented in (B). (D) Spatial information extracted from the stereo power spectrum presented in (C).
The sonification algorithm associates a pre-computed stereophonic pure tone to each white pixel (denoted in the rest of the document as “active pixels”) within the processed frame. The audio signal is played using the standard android AudioTrack API and sampled at 8 kHz to limit the computational load. Each active pixel is characterized by its position [x,y] in pixel coordinates ([0,0] being the bottom left of the frame and [W –1, H–1] the top right, W and H denoting, respectively, the width and the height of the visual scene), and is encoded by a sound characterized by a triplet descriptor [ILD(x), ITD(x), f (x,y)] defined as follows:
where ILD(x) is the interaural level difference in dB, Ar (respectively, Al) is the amplitude of the sound on the right (respectively, left) channel, A is the general sound amplitude, x is the horizontal coordinate, k is a constant equal to 2.6 chosen to produce an ILD linearly related to x, going from −12 to 12 dB as reported by Blauert (1997).
where equation (2) is the classical Woodworth’s interaural time difference formula (Woodworth, 1938). We used r = 8.75 cm as the radius of the typical human head (Algazi et al., 2001) and S = 343 m s−1 is the speed of sound in the atmosphere. The frequency of a sinusoid signal f (x,y) is associated to each pixel position. We used the bark scale in equation (3) in order to follow the tonotopic sensory scale (Traunmuller, 1990):
The bark scale is used in linear relation with the variable l(x,y) [equation (4)]. For pleasantness considerations (Abboud et al., 2014), we chose zmax ≈ 14.5 to get a maximal frequency equal to 2500 Hz and zmin ≈ 2.5 to get a minimal frequency equal to 250 Hz. Equation (5) designs the variable l(x,y) in such a manner that a larger gap of frequencies occurs for each horizontal line increment (f (W, y) < f (0, y + 1)). This method prevents an extreme right pixel from being associated to a frequency that would be very close to the frequency associated to the pixel at the extreme left of the upper horizontal line.
Taken together, these formulas synthesize a stereo audio signal for each active pixel as follows:
where sr (respectively, sl) stands for the signal on the right (respectively, left) channel, and φ(y) is a randomly chosen phase of generated sinusoids added to limit sinusoids interferences. The output signal is the sum of all sounds corresponding to all active pixels:
where [xi, yi] is the position of ith active pixel in the image.
Sounds are synthesized for periods of 34 ms (corresponding to 30 frames per second and approximately 272 samples per channel at 8 kHz sampling rate) extended by a period of 50 samples. This extension is used to linearly merge two consecutive generated sounds using a fade out of the previous sound with a fade in of the first 50 samples of the next sound. The generated signal is then transmitted via the audio output of the device.
The measured latency between a visual event (a switch off of a light) and its corresponding generated audio event is approximately 0.23 ± 0.014 s. This latency is not only due to a delay introduced by the irreducible minimum size of the audio buffer on Android (≈140 ms) but also to delays generated by video acquisition (≈30 ms), video processing (≈5 ms), sonification (≈20 ms), and threads synchronization.
2.2. Experimental Setup
The experimental setup was composed of a collection of data processing modules used to display stimuli, record the audio signal, analyze it, and extract spatial information. These modules were running on a laptop with Ubuntu 14.04.
2.2.1. Stimuli Presentation and Audio Recording
Stimuli were generated by displaying video on a 61 cm screen placed ≈55 cm in front of the transducer camera. Stimuli videos were displayed on a region of the screen tightly corresponding to the camera’s FOV. Each video was a sequence of a uniform gray image lasting for 1 s (gray level = 100/255) followed for 1 s by a static image showing a city street superimposed by one cartoon head placed at its starting position. This cartoon head will be denoted by “target” in the rest of the document. Afterwards, the target was animated for 4 s. Then, the target remained static in its last position for another 1 s and, again, a uniform gray screen was displayed for 1 s before the video stopped. Videos were made using OpenCV in python and encoded on a DIVX format with a 960 × 600 resolution. A custom movie player was programed using OpenCV to control the display of the video. A script was used to simultaneously start the video display and the audio recording for each experimental condition. Figure 2A shows an example of the superposition of two consecutive frames during the target displacement of a video stimulus. Output of the stereo signal generated by the transcoding device was directly plugged into the microphone input of the laptop and automatically recorded at 44.1 kHz using the application arecord.
2.2.2. Numerical Signal Processing and Spatial Features Extraction
We used a Discrete Fourier Transform to compute on 25 ms time bins the power spectrum for each of the 160 × 120 frequencies associated to pixel positions. Figure 2C shows an example of the stereo power spectrum corresponding to a moving target. Amplitudes on both channels for each selected frequency were computed from the signal power using the following equations:
where Ãr(f) (respectively, Ãl(f)) is the signal amplitude of the right (respectively, left) channel for frequency f and Pr(f) (respectively, Pl(f)) is the value of the power spectrum of the right (respectively, left) channel for the frequency f.
To prevent noise detection, frequency bands were selected for further analysis solely if signal powers Pr or Pl, were above a given threshold. In this case, each selected frequency f was associated with one triplet descriptor denoted in the rest of the document as a “retrieved pixel” and computed using the following formulas:
where Ã(f) is the signal amplitude, is the corresponding horizontal position, and the vertical position. Equations (13) and (14) are designed to compute the inverse transformations of equations (1) and (3).
White circles in Figure 2D are markers for retrieved pixels extracted from the audio signal analysis shown in Figure 2C.
Each visual object displacement generates an audio signature that can be represented as a changing group of retrieved pixels denoted in the rest of the document by “pixel cloud.” We computed for each image the weighted centroid of the pixel cloud, based on the pixels positions and amplitudes using the following formulas:
where [Xc, Yc] is the position of the centroid of the pixel cloud, is the position of a retrieved pixel, and its amplitude.
The spatial dispersion of the pixel cloud was computed based on the square roots of the two eigenvalues of the weighted covariance matrix. These two values were considered as the two radiuses of an ellipse whose surface was used to quantify the spatial dispersion of the pixel cloud. Example of centroid position and spatial dispersion of a pixel cloud is shown in Figure 2D.
2.3. Experimental Setup for the Psychoacoustic Experiment
Except for very brief vocal introductions, the whole experiment with its associated instructions was automatically conducted by a home-developed application in C++ using Qt and OpenCV. This experiment consisted of four exercises similar to the four tests performed by numerical methods (see section 3.1). For each exercise, participants were sitting in front of a computer screen with headphones. In a first learning period, videos were presented simultaneously with their associated sonification (see section 2.1.2). In a second period, participants were asked to discriminate between stimuli that were presented (in a pre-defined randomly permuted sequence, identical for all the participants). For this, several visual markers were presented on the screen and the task consisted of choosing the most appropriate one (i.e., the one that best matches the audio stimulus heard) by selecting it with the mouse cursor. No indication was given to notify whether the reply was correct or not and no instruction was given whether the same stimulus could be proposed, zero, once, or multiple times. The whole experiment lasted approximately 30 min.
For their replies, participants may have used two different strategies:
• Independent replies: with this strategy, each choice of a marker is done among the complete set of possibilities. A participant can thus reply several times on the same marker during the exercise. The replies are thus independent. With this scenario, the p-value (i.e., the probability of having k correct replies with pure random responses) can be computed using binomial cumulative distribution functions with parameter N being the number of attempts and k the probability of choosing the correct answer at each attempt. p-value is thus the probability of having k or more correct replies from an independent random reply sequence, where k is the average number of the obtained correct replies.
• Dependent replies: with this second strategy, the participant avoids multiple responses on the same response marker. The participant replies only once to each marker during the exercise. The replies become thus dependent. To compute the p-value with this scenario, we used the counting of partial derangements with k fixed points on a sequence of N different elements. In this case, k is the number of correct replies and N is the number of stimuli. For illustration, imagine that nine stimuli are presented in the following random order [4, 5, 3, 2, 1, 8, 7, 9, 6] and that the participant randomly choose a marker for each displayed stimulus, with the constraint of never choosing twice the same marker in the whole exercise. The participant may end up with the following response sequence [2, 1, 3, 4, 5, 7, 9, 8, 6]. This would then produce by chance two correct replies (two fixed points in the permutation), the 3 and the 6. p-value is thus the probability of having k or more correct replies from such dependent reply sequence, where k is the average number of the obtained correct replies.
3. Results
3.1. Numerical Signal Processing
3.1.1. Object Localization Evaluation
In this experiment, we explored the possibility of localizing a deforming object in a static but highly contrasted visual background. Objects that are changing their visual aspects without changing their position, such as somebody gesturing away, a TV screen, a flashing light or objects that deform, are quite common in daily life. Moreover, associating a position to an object is a capability required for more sophisticated analysis, such as displacement evaluations.
The visual target was a cartoon face with a surface corresponding to approximately 2% of the whole FOV. Several trials were done with a target successively placed over a grid of 3 × 3 positions starting at the position [0.1W, 0.1H] and ending at [0.9W, 0.9H] with x and y position spacing of 0.4. The target appearance was changed by completely rotating it once each second. The background of Figure 3 is the first image of such a stimulus with a target position at coordinate [0.1W, 0.9H].
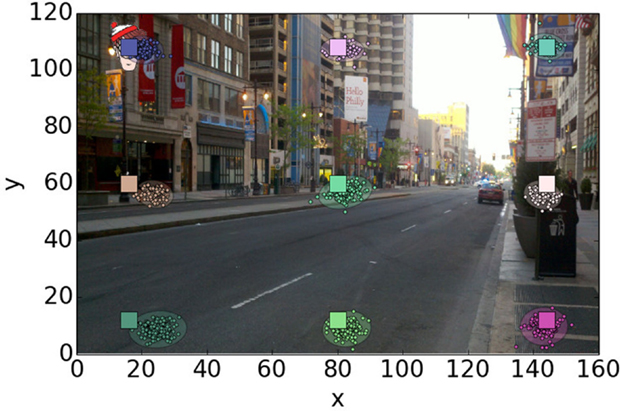
Figure 3. Retrieved positions for various target positions in the screen. Squares are markers for true target positions. Small circles indicate retrieved centroid positions of pixel clouds detected on successive frames. Ovals represent the spatial dispersion of centroid positions. Targets positions are color coded to ease the reading of the figure.
The acquired video stream was translated by the substitution system into an audio signal (see section 2.1.2 for details). This signal was recorded and analyzed in order to extract spatial information and the target position was estimated for each frame as the centroid of the retrieved pixel cloud (see section 2.2.2 for more details).
Figure 3 shows both retrieved and true target positions. The retrieved positions are closely situated in the proximity of their corresponding true target position. Figures 4A,B show in detail the horizontal and vertical distance (mean ± SD) between true target coordinates and retrieved centroid coordinates of the pixel cloud in each reconstructed frame. For convenience, a second y-scale on the right side of the figures expresses the results as an error on azimuth and elevation in the FOV. These errors are computed based on horizontal (53.6°) and vertical (40.2°) FOV. For example, an horizontal resolution of 160 pixels for an angle of 53.6° approximately results in an angle resolution of 0.33° per pixel. Mean values for horizontal and vertical errors are mainly caused by a non-perfect matching between the camera’s FOV and the video display surface. The SD of both dimensions is close to 2 pixels, which represents <2% of the visual scene for both the horizontal and vertical axes.
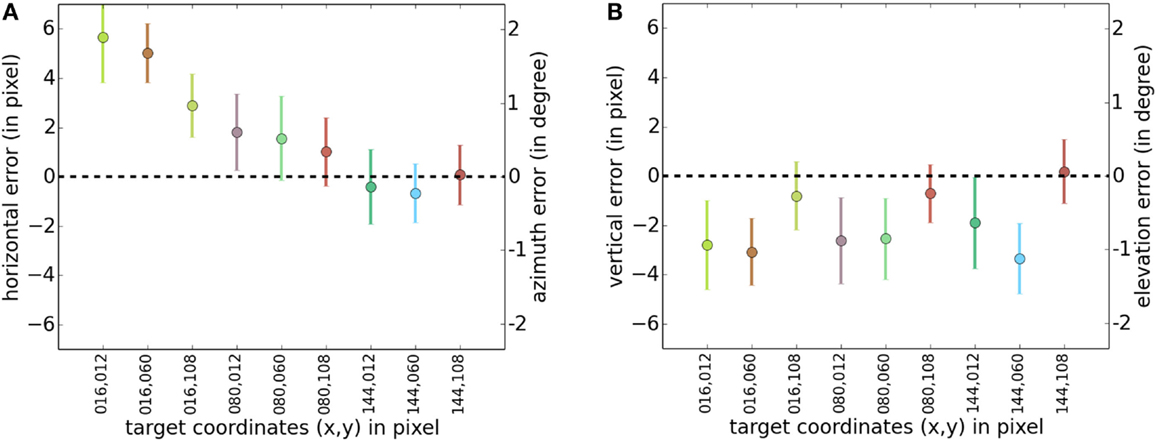
Figure 4. Mean and SD of the distance between the true target position and corresponding retrieved pixel cloud centroids. Deviations are expressed in pixels (respectively, angle) on the left (respectively, right) y-scale. (A) Mean and SD of the distance on the horizontal axis. (B) Mean and SD of the distance on the vertical axis.
Thus, the device generates an auditory signal that transmits enough information to precisely localize an object within the 2-dimensional FOV. This allows for more complex analysis, such as trajectory estimation as shown in the next experiment.
3.1.2. Object Trajectory Evaluation
Silent moving objects, such as bicycles or walkers, are potential dangers for the blind. Evaluating velocities and trajectories of surrounding moving objects is thus one of the major requirements that must be fulfilled by a device that aims to assist the blind walking in the street.
In this experiment, we tested whether trajectories of moving objects can be retrieved from the audio signal. We used targets moving along trajectories defined by the radiuses of a circle centered with the FOV. The length of the radius was set to D = 0.4H, H being the height of the FOV. The distance of the target from its starting point is defined by the formula:
where d is the distance, t is time, and T = 4 s is the duration of the displacement. We tested for 12 angles equally spaced over the whole [0:2π] circle. The retrieved target position was computed as the centroid of the retrieved pixels for each frame [c.f. equations (15) and (16)].
Figure 5 shows retrieved trajectories for different displacement orientations. Despite a noisy detection, the global orientation of the target displacement is easily distinguishable. Although their velocity profiles decrease along their trajectories, targets are still detected in the vicinity of their final positions. This is more precisely shown in Figure 6A where differences of trajectory orientation between true targets and retrieved ones are presented.
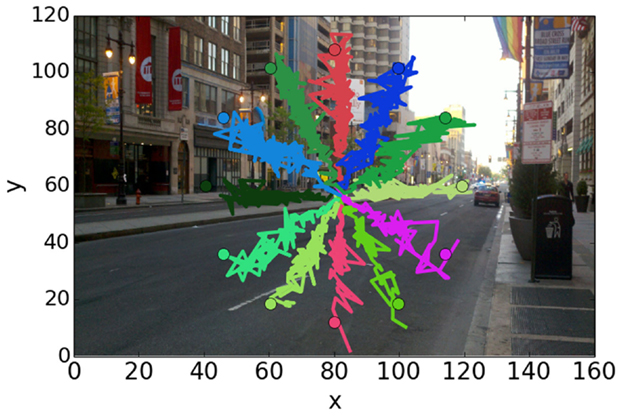
Figure 5. Target trajectories retrieved from reconstructed frames. True ending positions are indicated by circles.
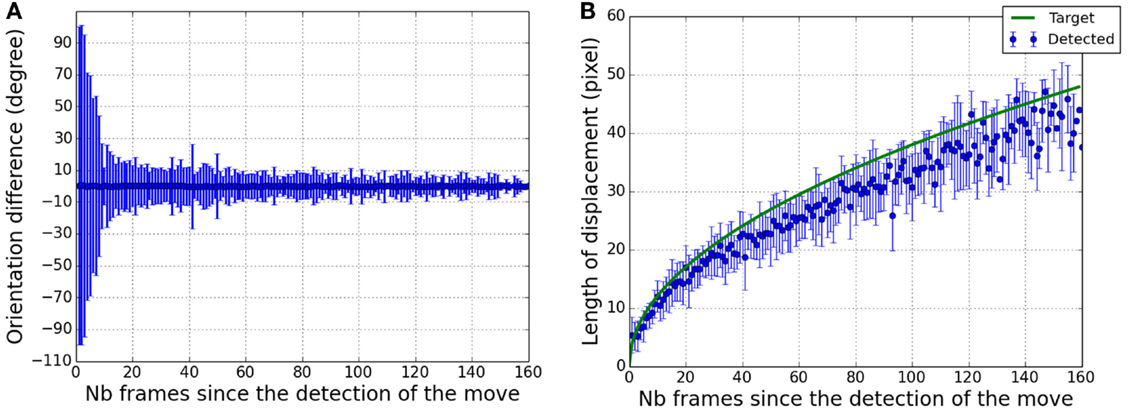
Figure 6. Angle precision and distance of the target displacement within the field of view. (A) Mean and SD of the angle between real target trajectories and retrieved trajectories as a function of the number of frames since the first detected displacement. (B) In blue, distribution (mean ± SD) of the measured length between the first detected pixel centroid and following ones as a function of the number of frames since the first detected displacement. In green, the true length of the target displacement.
After 0.5 s (20 frames) the mean error is ±15°, decreasing to ±10° one second and a half after the beginning of the displacement. At the end, the precision is around ±5°. It shows that at the end of the trajectory, enough information has been transmitted to theoretically allow a precise orientation estimation.
As presented in Figure 6B, the distance covered by the target from its starting point can also be estimated based on the audio signal. Since motion detection is less efficient for slow displacements, errors in distance estimations increase as the velocity of the target decreases. From a precision of ±5 pixels after 1 s of displacement, the precision decreases below ±10 pixels after 3 s.
Taken together, these results show that the information transmitted by the system can precisely encode both the orientation and the distance of a moving object. When an object moves, its audio signature moves both within the frequency spectrum and the stereo panning, allowing for a 2-dimensional evaluation of its trajectory.
3.1.3. Approaching Object Detection
Detecting an approaching object is another key to prevent potential collision. Such an object approaching the user can be visually detected within a 2-dimensional FOV by perceiving its visual growth. In this experiment, we explored whether a visual growth or a visual reduction of an object is precisely reflected in its transduced audio signature. For this purpose, a visual target was placed on nine positions in the FOV and its surface was changed for 4 s as defined by the following equations:
with Tmax = 4 s the total duration of the target animation and Lmax = 0.3H the maximal length of one side of the target, H being the height of the FOV. Note that the two equations above lead to a linear change of the surface of the target. Thus, the motion detection detects the same amount of active pixels during a given time lapse. Audio signatures of growing objects are then only represented by their spread in the auditory space cues but not by the change of their audio volumes.
We quantified the dispersion of the pixel cloud by the surface of the corresponding dispersion ellipse (see section 2.2.2 for more details) and we measured it as a function of time. We compared it with the true surface of the target.
Figure 7A (respectively, Figure 7B) shows the spatial dispersion of pixel clouds for growing (respectively, reducing) targets as a function of time. The true target surface divided by 3 has been superimposed to stay in the same value range. Results are less accurate when the target is large. In this state, the lengths of target borders change very slowly and motion detection does not work well due to the low resolution of the video. We used a Pearson’s test to measure the correlation between true target sizes and means of the pixel clouds dispersion. Pearson’s test gives a significant (p < 0.0001) correlation coefficient with an approximate value of 0.8 showing that the retrieved pixel dispersion is a good indicator of the target size.
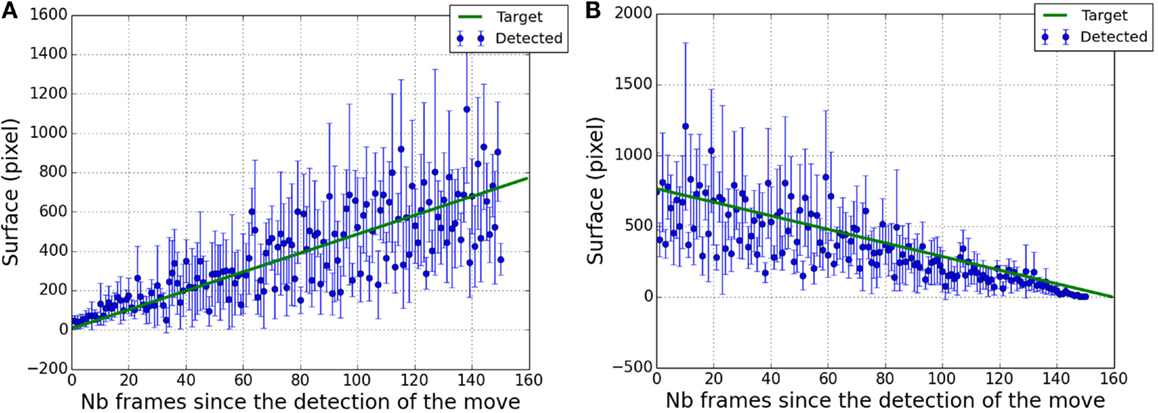
Figure 7. Estimation of the surface of the retrieved pixel cloud (in blue) as a function of the number of frames since the detection of the target displacement. Solid line (in green) represents the true surface of the target divided by a factor of 3. (A) in case of target growing. (B) in case of target reduction.
As an object is approaching, its associated audio signature gets broader both in the frequency spectrum and in the stereo panning allowing an estimation of its size variation.
3.1.4. Moving Objects Separation
In this experiment, we explored the capability for separating two visual objects simultaneously present in the visual scene. We reused the experimental paradigm of the first experiment (cf. section 3.1.1), but we added a second rotating target as a distractor. These targets were placed at each different pairwise combination of non-identical positions over a 3 × 3 grid, generating a set of 36 stimuli (9 × 8/2). In this set, several stimuli are of special interest since the target and the distractor are both situated on the same vertical level in the FOV (for example, [xt, yt] = [0.1, 0.1] and [xd, yd] = [0.5, 0.1]). These particular cases are indicated by stars in Figure 8 and by blue stars in Figures 9A,B.
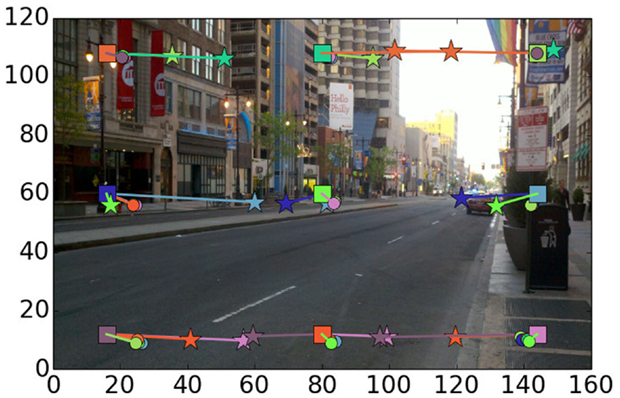
Figure 8. Presentation of the true target positions together with the means of the retrieved target positions depending on the used distractor. Each one of the nine true target positions is identified by the color of its corresponding square. Lines originating from each square indicate the difference between the true target position (the center of the square) and the retrieved target positions (the end of the line). The color of the line is the same as the color of the true target position that was used as a distractor. An additional marker is added at the end of each line to indicate whether the position of the used distractor was on the same vertical level (stars) as the true target position or not (circles).
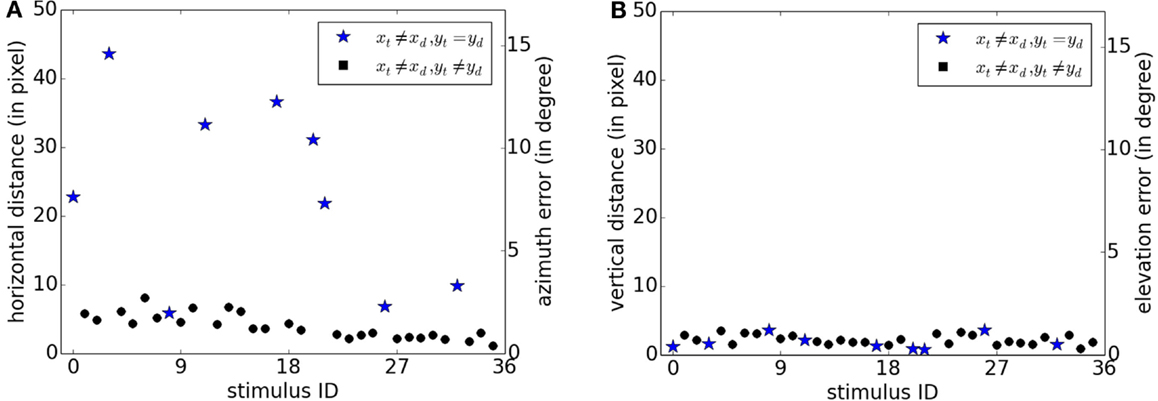
Figure 9. Localization error of the target on the x-axis [subfigure (A)] and y-axis [subfigure (B)] for each stimulus. Errors are expressed in pixels (respectively, angle) on the left (respectively, right) y-scale. xl and yt are the coordinates of the target and xd and yd are the coordinates of the distractor. Blue stars indicate results for stimuli in which the target and the distractor are situated on the same vertical level in the FOV.
Retrieved pixels in each frame were first clustered in 2 groups using a k-means algorithm. The two identified pixel clouds were then analyzed by the same techniques as before in order to compute pixel cloud centroids (cf. section 2.2.2).
Figure 8 shows the differences between the true target positions (squares) and the retrieved ones (stars and circles). The same behavior as in Figure 3 can be observed when the target and the distractor are not on the same vertical level (circle): there is a small x-axis and y-axis error that can be due to a shift during the adjustment between the region of the stimuli display on the screen and the region cover by the camera’s FOV. Retrieved positions when the two moving objects are on the same vertical level present another profile. X-axis error is more important whereas y-axis error remains at the same level.
For each stimulus and for all frames, we measured the mean distance between the true target position and the most proximate retrieved target. Figure 9A shows the measured errors on the horizontal axis for each of the 36 stimuli. For the large majority of stimuli, x-error was less than 10 pixels. Stimuli for which x-error was above this range corresponded to cases where the target and the distractor had different x-coordinates but the same y-coordinates (blue stars). On the contrary as shown in Figure 9B, errors on the y-axis remains below 10 pixels for all stimuli. In the same way as for Figure 4, a second y-scale on the right side of the figures expresses the results as an error on azimuth and elevation in the FOV.
Thus, special cases occurred when the target and the distractor have various x-coordinates but the same y-coordinate (i.e., xt ≠ xd and yt = yd). Active pixels on the same horizontal lines have very close associated frequencies (c.f. section 2.1.2). Thus, sounds generated by two targets situated on the same horizontal level interfere with one another. In this situation, retrieved pixels generated by multiple objects tend to be mixed together and the output becomes a unique pixel cloud with a broader horizontal dispersion. Apart from these cases, the results are precise enough to retrieve and separate the target localization from the distractor.
3.2. User Performances
We asked 10 participants to perform tasks similar to those resolved by the numerical methods in section 3.1. Obtained performances are summarized in Table 1.
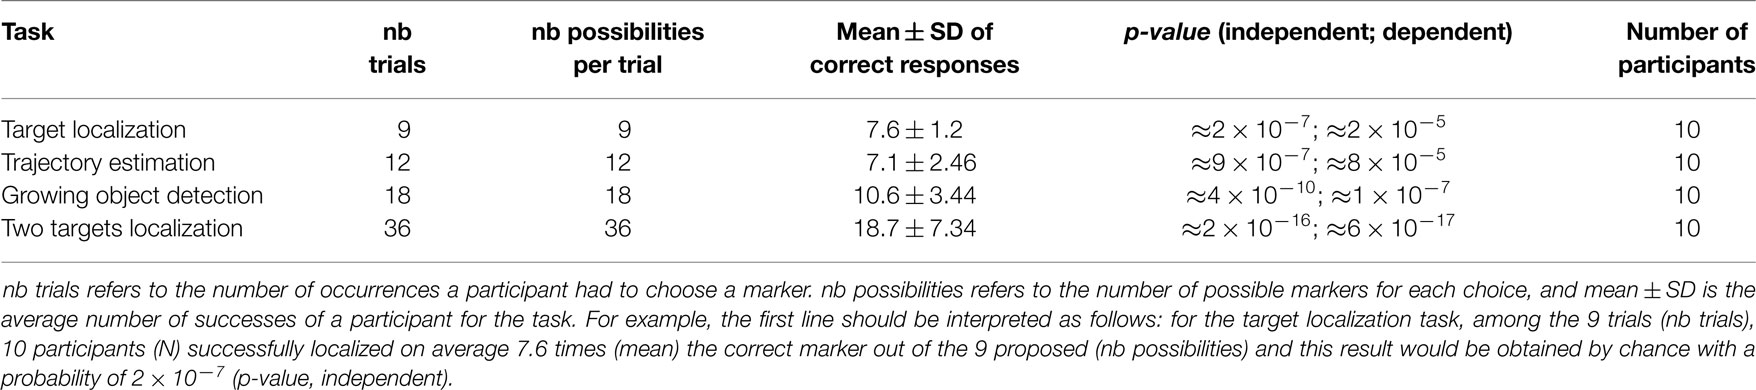
Table 1. Table summarizing results obtained by participants.
The first exercise corresponds to the analysis presented in section 3.1.1. During the training period, the nine video stimuli were presented once to the user simultaneously with their sonified transduction. In a second period, audio stimuli were randomly played and participants had to choose one target position among the nine proposed. We measured an average number of 7.6 ± 1.2 successes for the nine trials. This result would be obtained by chance with a probability of 2 × 10⁻⁷ (p-value, independent). It clearly shows that despite very brief training, the nine audio stimuli were different enough to be easily discriminated.
In order to explore whether localization capabilities presented in the previous paragraph allow a discrimination between orientations of target displacements, we tested with sonifications corresponding to the trajectories used in experiment 3.1.2. We measured an average number of 7.1 successes of selecting the correct trajectory among the twelve proposed. This result would be obtained by chance with a probability of 9 × 10⁻⁷ (p-value, independent).
We conducted the same tests for growing or reducing target estimations (section 3.1.3). 18 stimuli were randomly proposed, possibly corresponding to nine different positions. Nine stimuli corresponded to target growth, and nine to target reduction. This task was an 18 alternative forced choice: on each of the nine possible positions of the target, two easily distinguishable signs were presented: one corresponding to the growth of the target, the other one corresponding to its reduction. A success corresponded to the identification of the correct position among the nine proposed ones as well as the correct growth-versus-reduction classification. On average, for the 18 trials, we measured a number of 10.6 ± 3.44 successes. We measured an average of 14.8 successes when only taking into account good classifications between target growth versus target reduction.
Finally, we explored whether users can interpret the audio signal coming from the sonification of two simultaneously animated targets. We reused the stimuli of the experiment 3.1.4 and the task was to select the two markers that best matched the heard audio stimulus. In this task, a success is recorded when both markers have been correctly selected. Out of the 36 trials, we measured a success of approximately 18.7 ± 8, corresponding to a p-value around 2 × 10⁻¹⁶.
These results clearly show that, despite very brief training, spatial information present in the generated audio signal can at least be partially extracted by a human user.
Figure 10 shows the mean errors obtained by the participants in the four tasks on both horizontal and vertical axes. Absolute values have to be interpreted cautiously since user replies were chosen among limited sets of markers displayed on the screen and not within the whole screen area. In other words, errors are based on missed discreet locations. For the first three tasks (target localization, trajectory estimation, and growing object detection), the horizontal error is lower than the vertical error. It is probably due to an azimuth (horizontal) encoding based on natural sound modulations using ITD and ILD. On the contrary, elevation (vertical) encoding is rendered using an artificial pitch scale. Thus, users have first to learn to discriminate between pitches during the training session in order to determine the correct vertical position.
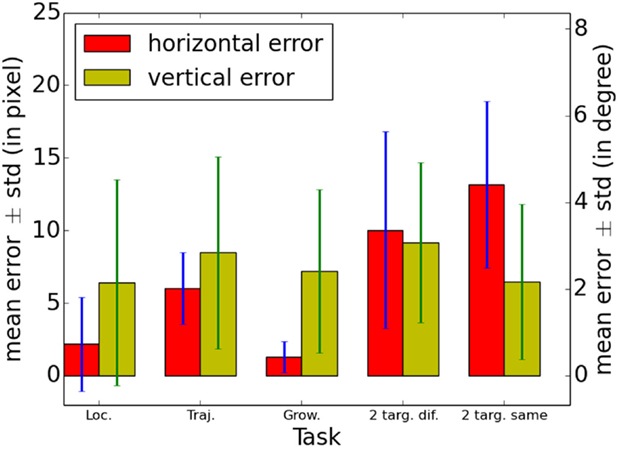
Figure 10. Mean errors and SD obtained by the 10 participants in the four tasks on both horizontal and vertical axes. Errors are based on distances between markers corresponding to the true locations of the target and markers pointed by the user. Thus, these errors are based on missed discreet locations. Errors are expressed in pixels (respectively, angle) on the left (respectively, right) y-scale. Loc. stands for Target localization, Traj. for trajectory estimation, Grow. for Growing object detection, 2 targ. dif. for 2 targets separation with different vertical levels, and 2 targ. same for 2 targets separation with the same vertical level.
Results obtained in the fourth task were separated depending on the relative vertical positions of the two moving objects. In the Figure 10, 2 targ. dif. stands for 2 targets on different vertical levels and 2 targ. same for 2 targets on the same vertical level. Thus, 2 targ. dif. data are results for two audio signatures with different pitches and 2 targ. same data are results for two audio signatures with similar pitches. Compared to the other tasks, the horizontal error is larger and become similar to the vertical error in the 2 targ. dif. condition. Thus, it appears that despite different pitches in their audio signatures, azimuths corresponding to two objects that are simultaneously sonified by the system are more difficult to discriminate. The horizontal error increases further and become larger than the vertical error in the 2 targ. same condition. As presented in section 3.1.4, this is probably due to audio signatures of moving objects that interfere with each other when objects are placed on the same vertical level.
4. Discussion
In this work, we presented a new augmented reality system transforming video information into audio signals. We applied a transcoding method that is specifically designed for the perception of moving objects. By extracting spatial information from the audio signal using numerical methods, we have shown that the combination of this hardware and our method theoretically permits: object localization, orientation and length estimation of trajectories, object growth quantification, and, in some circumstances, moving object separation.
As presented in section 3.2, within a simplified and controlled environment, our system allows human users to estimate object trajectories with a very short training period. The interpretation of more complex stimuli, such as those encountered in an ecological environment, would certainly require a longer learning period and more efficient training methods. Thus, limits to performance with this system in more complex ecological environments remain to be further explored.
Compared to other sonification methods, which use left-to-right scans (thevOICe, EyeMusic), our method offers a constantly updated information stream allowing the user to track the trajectory of moving objects. By extracting moving objects from a static visual background, the audio signal is easier to interpret compared to other systems that would simultaneously transmit the information concerning the moving object and the background (PSVA, TheVibe). As far as we know, this system is the first miniature device easily available, allowing the tracking of a moving object in a complex visual background.
4.1. Software
The selection of visual features extracted by video processing is very important since human visual and auditory perception do not have the same bandwidth [respectively, ≈106 (Jacobson, 1951) and ≈104 bits per second (Jacobson, 1950)]. This auditory bandwidth theoretically corresponds to the transmission of ≈20 pixels per frame, with 30 black and white frames per second and a spatial resolution of 128 × 128 (14 bits of spatial resolution). The transmission of this information through the audio channel would at least require the use of the whole audible frequency range (20–20 kHz) with a 44.1-kHz sampling rate, and masking effects attenuated by sound frequencies that would be spread all over the critical bands (Zwicker, 1961).
Although natural sounds are usually localized using HRTF in addition to ITL and ILD, this cue can not be used with pure tones. By interpolating results reported by Mills (1972), the minimum audible azimuthal angle for a 500 Hz tone allows an azimuthal resolution of ≈80 positions around the semi-circular azimuthal plane. As mentioned by Kollmeier et al. (2008), the frequency just-noticeable difference is about 3 Hz for frequencies below 500 Hz and about 0.6% for frequencies above. This leads to a theoretical pitch resolution of about 350 scales in the frequency range used by the system (250–2500 Hz). These considerations suggest that the horizontal resolution of the system (160 pixels) probably up-samples the human capabilities of azimuthal discrimination, whereas the vertical resolution (120 pixels) down-samples the capabilities of frequency discrimination.
Background noise is probably one of the most challenging problems. Natural extrinsic background noise, such as the noise of cars, has to be differentiated from intrinsic background noise due to irrelevant pixels sonified by the system. The first type of background sounds should be conserved as much as possible, whereas the second type should be avoided. This second type of sounds could arise, for example, when the ground is not visually homogeneous, such as an asphalt sidewalk with inlaid small white pebbles that could be detected and sonified. Removing these pixels is one of the main goals of the slight blur performed at the first steps of the video processing (c.f. section 2.1.2).
Results presented in this work were obtained with a static camera condition, allowing the motion detection method to drastically simplify the video stream. This mimics situations in which the VASSDs user stops, paying attention to potentially colliding moving objects coming from a specific position. On the contrary, the frame differencing method also extracts contrasts of static objects when the camera is moving. In this condition, static objects become sonified and the video scene that is rendered is much more complex. Many visual features on the same vertical level in the FOV might be extracted and sonified. Since they are situated on the same vertical level, their associated frequencies are close and their audio signatures might interfere each other. X-axis information might then be more difficult to analyze as in the problematic scenarios indicated by blue stars on Figure 9A.
Sonifying simultaneously all the pixels coming from the processed video stream increases the difficulty for shape recognition due to both energetic and informational masking effects (Durlach et al., 2003). The first type of masking is related to interferences that occur in the received signal, whereas the second one is more related to the cognitive limits to interpret the signal. To circumvent this limitation, an option is to use periodic left-to-right scan sonification, as in thevOICe and EyeMusic projects, but this is problematic for fast movement sonification.
This points out to the fact that a unique method of information transduction from visual to auditory signals might only be optimal in a particular context. Optimizing a system for one particular task could be at the cost of performance deterioration in other tasks. In this view, an optimal transduction would be either offering a good compromise for most daily life situations or offering a variety of methods that could be manually or automatically selected depending on the context. Building hybrid systems mixing sensory substitution and object recognition could be especially interesting since each method may partially compensate the limitation of the other: a lack of genericity in object recognition and a lack of clarity in sensory substitution.
4.2. Hardware
The hardware presented in this work is generic and powerful enough to be used as a device for implementing various signal transcoding methods, such as those used in ThevOICe, TheVibe, EyeMusic, PSVA, and many others. Moreover, since it is based on standard components, it is both powerful and cheap (the complete system can be built for a few hundred dollars).
The main issue with this type of system is that constant auditive stimulation can mask natural sounds, whereas these constitute one of the major sources of information used by the blind. For this reason, it is important that the user be able to adjust the volume or even completely switch off the system when the user prefers to receive natural auditory information without any interference. Despite their design to limit the distortion of surrounding sounds, running earphones still partly block the auditory canal. Using bonephones instead of these earphones could resolve this issue since it has been demonstrated that such devices can be used to transmit spatial information through stereophonic sounds, even with spatialization routines that were not optimized for them (Walker and Lindsay, 2005). This suggests that, with our system, the replacement of running earphones by bonephones could be straightforward.
A large FOV might seem preferable to the limited FOV of the miniature camera used (67°). But it has to be considered that the bandwidth of the transmitted spatial information only depends on the used auditory cue ranges. Thus, extending the FOV while using the same sonification method theoretically results in a decrease in the precision of the absolute spatial information.
Miniaturization is an important aspect of such devices. A video-to-audio mobile transducer requires high computational power, large battery capacities, but no embedded screen. With current technologies, it is possible to decrease the size of the hardware but this would be at the cost of the battery capacity.
Despite their demonstrated capabilities, VASSDs are still not used in daily life by the blind. By presenting this transcoding method and this new open-source and versatile device, we hope to contribute to the spread of this cheap and non-invasive visual rehabilitation solution. Our system also aims to facilitate the research in visuo-auditory sensory substitution by providing a standard and convenient experimental device.
Author Contributions
MA conceived and designed the sensory substitution device and the recording system. He wrote the paper and did the final analysis and the Figures. YB performed the spatial information extraction and contributed to the English editing. PP helped in the design of the electronic systems.
Conflict of Interest Statement
The authors declare that the research was conducted in the absence of any commercial or financial relationships that could be construed as a potential conflict of interest.
Funding
This study was carried out in part with the support of the Burgundy region (contract 9201AAo052S04590), the University of Bourgogne Franche-Comté and the CNRS (Centre national de la recherche scientifique).
Footnote
References
Abboud, S., Hanassy, S., Levy-Tzedek, S., Maidenbaum, S., and Amedi, A. (2014). Eyemusic: introducing a “visual” colorful experience for the blind using auditory sensory substitution. Restor. Neurol. Neurosci. 32, 247–257. doi: 10.3233/RNN-130338
Algazi, V. R., Avendano, C., and Duda, R. O. (2001). Estimation of a spherical head model from anthropometry. J. Audio Eng. Soc. 49, 472–479.
Arno, P., Capelle, C., Wanet-Defalque, M. C., Catalan-Ahumada, M., and Veraart, C. (1999). Auditory coding of visual patterns for the blind. Perception 28, 1013–1029. doi:10.1068/p2607
Arno, P., Vanlierde, A., Streel, E., Wanet-Defalque, C., Sanabria-Bohorquez, S., and Veraart, C. (2001). Auditory substitution of vision: pattern recognition by the blind. Appl. Cogn. Psychol. 15, 509–519. doi:10.1002/acp.720
Auvray, M., Hanneton, S., Lenay, C., and O’Regan, K. (2005). There is something out there: distal attribution in sensory substitution, twenty years later. J. Integr. Neurosci. 4, 505–521. doi:10.1142/S0219635205001002
Benezeth, Y., Jodoin, P. M., Emile, B., Laurent, H., and Rosenberger, C. (2010). Comparative study of background subtraction algorithms. J. Electron. Imaging 19, 033003. doi:10.1117/1.3456695
Blauert, J. (1997). Spatial Hearing: The Psychophysics of Human Sound Localization (Revised Edition) (Cambridge, MA: The MIT Press), 158.
Bologna, G., Deville, B., and Pun, T. (2009a). Blind navigation along a sinuous path by means of the see color interface. Bioinspired Appl. Artif. Nat. Comput. 5602, 235–243. doi:10.1007/978-3-642-02267-8_26
Bologna, G., Deville, B., and Pun, T. (2009b). On the use of the auditory pathway to represent image scenes in real-time. Neurocomputing 72, 839–849. doi:10.1016/j.neucom.2008.06.020
Bologna, G., Deville, B., and Pun, T. (2010). “Sonification of color and depth in a mobility aid for blind people,” in Proceedings of the 16th International Conference on Auditory Display (ICAD2010) (Washington, DC).
Brown, J. D., Simpson, A. J. R., and Proulx, M. J. (2014). Visual objects in the auditory system in sensory substitution: how much information do we need? Multisens. Res. 27, 337–357. doi:10.1163/22134808-00002462
Capalbo, Z., and Glenney, B. (2010). “Hearing color: radical pluralistic realism and SSDs,” in Proceedings of the Fifth Asia-Pacific Computing and Philosophy Conference (AP-CAP2009) (Tokyo).
Capelle, C., Trullemans, C., Arno, P., and Veraart, C. (1998). A real-time experimental prototype for enhancement of vision rehabilitation using auditory substitution. IEEE Trans. Biomed. Eng. 45, 1279–1293. doi:10.1109/10.720206
Deville, B., Bologna, G., Vinckenbosch, M., and Pun, T. (2009). See ColOr: Seeing Colours with an Orchestra. Hum. Mach. Interact. 5440, 235–243. doi:10.1007/978-3-642-00437-7_10
Durette, B., Louveton, N., Alleysson, D., and Hérault, J. (2008). “Visuo-auditory sensory substitution for mobility assistance: testing thevibe,” in Workshop on Computer Vision Applications for the Visually Impaired (Marseille).
Durlach, N. I., Mason, C. R., Kidd, G. Jr., Arbogast, T. L., Colburn, H. S., and Shinn-Cunningham, B. (2003). Note on informational masking. J. Acoust. Soc. Am. 113, 2984–2987. doi:10.1121/1.1570435
Fajarnes, G. P. P., Dunai, L., Praderas, V. S., and Dunai, I. (2010). “Casblip – a new cognitive object detection and orientation system for impaired people,” in 4th International Conference on Cognitive Systems (CogSys2010) (Zurich).
Hanneton, S., Auvray, M., and Durette, B. (2010). The vibe: a versatile vision-to-audition sensory substitution device. Appl. Bionics Biomech. 7, 269–276. doi:10.1155/2010/282341
Jacobson, H. (1950). The informational capacity of the human ear. Science 112, 143–144. doi:10.1126/science.112.2901.143
Jacobson, H. (1951). The informational capacity of the human eye. Science 113, 292–293. doi:10.1126/science.113.2933.292
Katz, B. F. G., Klammoun, S., Parseihian, G., Gutierrez, O., Brilhault, A., Auvray, M., et al. (2012). Navig: augmented reality guidance system for the visually impaired. Virtual Real. 16, 253–269. doi:10.1007/s10055-012-0213-6
Kollmeier, B., Brand, T., and Meyer, B. (2008). Springer Handbook of Speech Processing. Berlin: Springer.
Levy-Tzedek, S., Hanassy, S., Abboud, S., Maidenbaum, S., and Amedi, A. (2012). Fast, accurate reaching movements with a visual-to-auditory sensory substitution device. Restor. Neurol. Neurosci. 30, 313–323. doi:10.3233/RNN-2012-110219
Levy-Tzedek, S., Riemer, D., and Amedi, A. (2014). Color improves ‘visual’ acuity via sound. Front. Neurosci. 8:358. doi:10.3389/fnins.2014.00358
Loomis, J. M., Golledge, R. G., and Klatzky, R. L. (1998). Navigation system for the blind: auditory display modes and guidance. Presence 7, 193–203. doi:10.1162/105474698565677
Loomis, J. M., Marston, J. R., Golledge, R. G., and Klatzky, R. L. (2005). Personal guidance system for people with visual impairment: a comparison of spatial displays for route guidance. J. Vis. Impair. Blind. 99, 219–232.
Maidenbaum, S., Abboud, S., and Amedi, A. (2014a). Sensory substitution: closing the gap between basic research and widespread practical visual rehabilitation. Neurosci. Biobehav. Rev. 41, 3–15. doi:10.1016/j.neubiorev.2013.11.007
Maidenbaum, S., Arbel, A., Shapira, S., Buchs, G., and Amedi, A. (2014b). Vision Through Other Senses: Practical Use of Sensory Substitution Devices as Assistive Technology for Visual Rehabilitation. Palermo: IEEE.
Meijer, P. B. L. (1992). An experimental system for auditory image representations. IEEE Trans. Biomed. Eng. 39, 112–121. doi:10.1109/10.121642
Proulx, M. J., Stoerig, P., Ludowig, E., and Knoll, I. (2008). Seeing ‘where’ through the ears: effect of learning-by-doing and long-term sensory deprivation on localization based on image-to-sound substitution. PLoS ONE 3:e1840. doi:10.1371/journal.pone.0001840
Roentgen, U. R., Gelderblom, G. J., Soede, M., and de Witte, L. P. (2008). Inventory of electronic mobility aids for persons with visual impairments: a literature review. J. Vis. Impair. Blind. 45, 702–724.
Striem-Amit, E., Guendelman, M., and Amedi, A. (2012). ‘Visual’ acuity of the congenitally blind using visual-to-auditory sensory substitution. PLoS ONE 7:e33136. doi:10.1371/journal.pone.0033136
Traunmuller, H. (1990). Analytical expressions for the tonotopic sensory scale. J. Acoust. Soc. Am. 88, 97–100. doi:10.1121/1.399849
Walker, B. N., and Lindsay, J. (2005). “Navigation performance in a virtual environment with bonephones,” in Proceedings of the Eleventh Meeting of the International Conference on Auditory Display (ICAD2005) (Limerick).
Ward, J., and Meijer, P. B. L. (2010). Visual experiences in the blind induced by an auditory sensory substitution device. Conscious. Cogn. 19, 492–500. doi:10.1016/j.concog.2009.10.006
Keywords: sensory substitution, blind, mobile device, video processing, audio synthesis, motion detection, sonification
Citation: Ambard M, Benezeth Y and Pfister P (2015) Mobile video-to-audio transducer and motion detection for sensory substitution. Front. ICT 2:20. doi: 10.3389/fict.2015.00020
Received: 01 June 2015; Accepted: 07 September 2015;
Published: 06 October 2015
Edited by:
Ming C. Lin, University of North Carolina at Chapel Hill, USAReviewed by:
Julie Wall, Queen Mary University of London, UKAleksander Väljamäe, Tallinn University, Estonia
Copyright: © 2015 Ambard, Benezeth and Pfister. This is an open-access article distributed under the terms of the Creative Commons Attribution License (CC BY). The use, distribution or reproduction in other forums is permitted, provided the original author(s) or licensor are credited and that the original publication in this journal is cited, in accordance with accepted academic practice. No use, distribution or reproduction is permitted which does not comply with these terms.
*Correspondence: Maxime Ambard, Université de Bourgogne Franche-Comté, LEAD – CNRS UMR 5022, Institut Marey, I3M, 64 rue de Sully, Dijon 21000, France, maxime.ambard@u-bourgogne.fr