
- 1 Medical Research Council Laboratory of Molecular Biology, Cambridge, UK
- 2 Department of Organismic and Evolutionary Biology, FAS Center for Systems Biology, Harvard University, Cambridge, MA, USA
The immune system has the ability to suppress undesirable responses, such as those against commensal bacteria, food, and paternal antigens in placenta pregnancy. The lineage-specific transcription factor Foxp3 orchestrates the development and function of regulatory T cells underlying this immunological tolerance. Despite the crucial role of Foxp3 in supporting immune homeostasis, little is known about its origin, evolution, and species conservation. We explore these questions using comparative genomics, structural modeling, and functional analyses. Our data reveal that key gain-of-function events occurred during the evolution of Foxp3 in higher vertebrates. We identify key conserved residues in its forkhead domain and show a detailed analysis of the N-terminal region of Foxp3, which is only conserved in mammals. These components are under purifying selection, and our mutational analyses demonstrate that they are essential for Foxp3 function. Our study points to critical functional adaptations in immune tolerance among higher vertebrates, and suggests that Foxp3-mediated transcriptional mechanisms emerged during mammalian evolution as a stepwise gain of functional domains that enabled Foxp3 to interact with a multitude of interaction partners.
Introduction
Most multi-cellular organisms evolved cell-based immune mechanisms protecting themselves from invading pathogens. In higher vertebrates, the adaptive immune system maximizes its ability to recognize pathogen-derived antigens by generating a diverse repertoire of B cell and T cell receptors through the random rearrangement of gene segments (Pancer and Cooper, 2006). This recombinatorial diversification intrinsically harbors the risk of generating self-reactive specificities and thus the development of autoimmunity. The deletion of self-reactive T cells during their development in the thymus (central tolerance) has for a long time been considered the key mechanism of self-tolerance (Mathis and Benoist, 2007). However, there are non-self antigens, such as food and commensal bacteria that the immune system must tolerate (Macdonald and Monteleone, 2005). Placental pregnancy represents an even more dramatic challenge, since the maternal immune system is continually exposed to paternal antigens expressed by the fetus.
In order to tolerate the immunogenic challenges of non-self antigens, new mechanisms had to evolve and regulatory T cells (TR cells) are critical components in this type of peripheral tolerance (Fontenot et al., 2003, 2005; Hori et al., 2003; Khattri et al., 2003). These cells suppress a wide variety of undesirable immune responses (Sakaguchi, 2004) and play a crucial role in maternal–fetal tolerance (Aluvihare et al., 2004; Rowe et al., 2011). The master-regulator of TR cell development and function is the lineage-specific transcription factor Foxp3 (Fontenot et al., 2003, 2005; Hori et al., 2003; Khattri et al., 2003). This protein belongs to a large family of forkhead box winged helix (Fox) transcription factors (Hannenhalli and Kaestner, 2009). Together with Foxp1, Foxp2, and Foxp4 it forms the Foxp subfamily, which is defined based on similarities in their domain architecture (Hannenhalli and Kaestner, 2009). These proteins contain several domains that are known to be of functional importance (Ziegler, 2006). The forkhead domain (FKH) is responsible for nuclear localization and DNA binding and in Foxp3 it is also responsible for interaction with the transcription factor NFAT (Lopes et al., 2006; Wu et al., 2006; Bandukwala et al., 2011). The coiled-coil (CC) is required for homotypic and heterotypic dimerization (Lopes et al., 2006) while the function of the C2H2-type zinc finger (ZnF) remains unclear.
The preponderance of evidence suggests that Foxp3 acts on multiple levels and is critical for multiple regulatory processes (Josefowicz and Rudensky, 2009). In some cases, it mediates a switch from gene activation to repression while in others it leads to enhanced transcription. Whether acting as an activator or as a repressor, it appears that Foxp3 hijacks and redirects already established transcriptional networks.
To better understand the role of Foxp3 in controlling TR cells and immune tolerance, we studied its function in an evolutionary context. We show that Foxp3 was acquired during early vertebrate evolution, but lacked key components important for its function. While the gene was retained in the lineage leading to mammals, it appears to have been lost from the genomes of birds. Our analyses suggest that Foxp3 evolved in a modular fashion and indicate a stepwise gain of functional domains. We found that the “first” Foxp3 ortholog that contained all of the domains required to confer TR cell phenotype can also be found in the genome of egg-laying mammals, with a further stretch of conservation gained in placentals. Our findings suggest that during its evolutionary diversification in the mammalian lineage, Foxp3 acquired several domains that allowed it to interact with a multitude of partners required for its function, making it a master-regulator of TR cell development and function.
Materials and Methods
Protein and DNA Sequences
All sequences were retrieved from the NCBI, UCSC, and Ensembl databases before January 2012. For BLAST analyses, mouse Foxp proteins were used for NCBI or Ensembl BLASTP and NCBI TBLASTN (databases: nr/nt and est_others). Specifically for Foxp3 proteins the following accession numbers were used: mouse (NP_473380), lizard (ENSACAP00000013243; partial sequence), opossum (XP_001372400), platypus (XP_001507281/ENSOANP00000021424), frogs (BAG12188.1 and NP_001121199.1), zebrafish (ACQ44666), salmon (NP_001185776), rainbow trout (CAT65091), stickleback (ENSGACP00000016881), and tetraodon (ENSTNIP00000007498).
Syntenic Analysis
The UCSC genome browser was used for comparing chromosome X from mouse (9 mm; Chr. X: 7,100,000–7,500,000) to chromosomes from several other species using BLASTZ alignment (Miller et al., 2007). For the construction of dotplots of genomic alignments, PipMaker (Schwartz et al., 2000) was used with default settings. For zebrafish analyses (danRer6), two loci were found containing putative Foxp3 orthologs at Chr. 8: 21.9 mb and Chr. 8: 24.1 mb, with the latter being the currently annotated entry in the NCBI database (GeneID: 571165). For sequence comparison in birds, the currently available chicken (galGal3) and zebra finch (taeGut1) assemblies were used. As few annotated genes can be found in the proximity of mouse Foxp3 on the centromeric side, a larger stretch of the telomeric side was used in all cases.
Protein Alignment and Tree Building
Protein sequences were aligned using Muscle (Edgar, 2004) and visualized in Geneious (Drummond et al., 2010). For alignments used in phylogenetic analyses, full-length protein sequences were manually curated to remove regions with poor alignment properties. Bootstrapped trees (1000 repetitions) were constructed using Neighbor joining (substitution models: Jukes–Cantor). Dotblot protein alignments were constructed using EMBOSS dotmatcher (Rice et al., 2000) with a window size of 10 and the Blossum50 matrix. A threshold of 40 was chosen for the final output. For the conservation plot in Figure 5A, a placental consensus sequence (at least 75% identity) was created by aligning Foxp3 from mouse, rat, human, rhesus macaque, crab-eating macaque, cow, dog, and cat. A mammalian alignment was created by aligning opossum and platypus to the placental consensus and a vertebrate alignment was created by aligning frog and zebrafish. Finally, a Foxp subfamily alignment was created by aligning mouse Foxp1, Foxp2, and Foxp4 to the placental consensus. For all alignments, mouse Foxp3 was used as a reference and all alignments were trimmed so this sequence was without any gaps. For the conservation plot in Figure 5B the same mammalian alignment was used and for the non-mammalian vertebrates an alignment was created from X. tropicalis, X. laevis, rainbow trout, stickleback, tetraodon, salmon, and zebrafish. The latter alignment was manually curated to remove regions with large indels. EMBOSS plotcon was then used to plot a similarity score across the two alignments using a window size of 20.
Homology Modeling
SWISS-MODEL (Schwede et al., 2003) was used to build homology models of Foxp3 mutated sequences, using the complex of Foxp3FKH:DNA:NFAT as a template (PDB ID: 3QRF; Bandukwala et al., 2011). The resulting structures were visualized using PyMOL (DeLano, 2002). For IPEX and signature residues, the accessible surface area was calculated with GetArea using default settings (Fraczkiewicz and Braun, 1998).
Prediction of Functional Domains
The coiled-coil, zinc finger and forkhead were predicted using the SMART and COILS2 programs (Lupas et al., 1991; Schultz et al., 1998). The N-terminal proline-rich (∼15% proline content) and glutamine-rich regions were determined manually. The nuclear localization signal within the FKH was determined based on the presence or absence of a RKKR motif in the FKH domain (Lopes et al., 2006).
Domain Selection Analysis
The random effects likelihood (REL) test implemented on the Datamonkey website (Pond and Frost, 2005) was used with codon-aligned Foxp3 sequences from mouse, cat, cow, macaque, dog, horse, human, pig, rat, rhesus macaque, and sheep. Prior to running the REL test, a model selection tool was executed to find the best nucleotide substitution model. All codons showing evidence of purifying selection with the REL test also replicated when we performed an independent SLAC and FEL test (Pond and Frost, 2005). All three tests agreed when using a Bayes factor cutoff value of >40.
Antibodies and Flow Cytometric Analysis
The following antibodies were used in the study (all from BD Biosciences, unless otherwise mentioned): CD3ε, CD4, CD8a, CD11b, CD11c, CD19, CD25, Ly6G, CD45RB, ratCD8a, CTLA-4, LAG-3, CD62L, I-A/I-E, and IL-2. All antibodies were used according to the manufacturer’s instructions and subsequent flow cytometric analysis was performed using a FACSCalibur system (BD Biosciences).
Construction of Retroviral Plasmids
A bicistronic MLV-based retroviral plasmid m6p8 (Bloor et al., 2008) co-expressing a GPI-linked extra-cellular part of ratCD8a (rCD8a) or m6pg co-expressing GFP, was used for all experiments. The domain-deletion mutants were created by the deletion of the following amino acids from mouse Foxp3: ΔProR: aa1–150; ΔZnF: aa197–221; ΔCC: aa232–261; ΔFKH: aa335–429. The various Foxp3 mutations and deletions were amplified from RNA preparations using SuperScript II (Invitrogen) and KOD polymerase (Novagen) and cloned into m6p8 and m6pg. An irrelevant gene, blasticidin-S-deaminase was used as a control in all experiments. The resulting constructs were sequenced and expression of the transgenes were confirmed by flow cytometry or western-blot.
Animals and Cell Preparations
All animal care was performed by expert animal technicians in compliance with the relevant laws and institutional guidelines. All animals were age- and gender-matched Balb/c or C57/BL6 mice, 2–4 months old and maintained under specific pathogen-free conditions. CD4+CD25− T cells were isolated by negatively depleting lymphocytes stained with a combination of FITC-conjugated antibodies specific to CD8, CD19, CD11b, CD11c, Ly6G, and CD25 using an AutoMACS (Miltenyi Biotec) as previously described (Andersen et al., 2008). For the preparation of antigen-presenting cells (APCs) used in suppression assays, staining with αI-A/I-E-specific antibody was followed by positive selection using magnetic beads on the autoMACS. Subsequently the cells were irradiated (3000 rads), washed, and used directly.
Retroviral Transduction
Viral supernatant was produced by transient co-transfection of 293ET cells with an equal amount of the packaging plasmid pCl-Eco and the respective m6p8 or m6pg constructs using standard calcium-phosphate protocols. After 48 h the supernatant was collected, filtered, and used immediately. Purified CD4+CD25− T cells were activated using plate-bound CD3ε-specific antibody (0.6 μg/ml) and recombinant mIL-2 (PeproTech; 10 U/ml). After 36 h, the cells were transduced using a 1:3 dilution of supernatant supplemented with protamine-sulfate (Sigma; 6 μg/ml), followed by centrifugation at 600 × g for 2 h at 32°C. The transduced cells were left in complete medium (RPMI/10%FCS/10 μM β-mercaptoethanol/50 μg/ml gentamicin) supplemented with recombinant mIL-2 for 48–72 h before analysis. For IL-2 intracellular staining, the cells were rested an additional 48 h and then reactivated with PMA and ionomycin in the presence of Golgi-stop (BD Bioscience) for 6 h, where after they were fixed and permeabilized using the Cytofix/Cytoperm (BD Bioscience) according to the manufacture’s instructions.
Suppression and Anergy Assays
Transduced T cells were sorted based on their co-expression of rCD8a using an AutoMACS, washed, and counted using a Vi-cell XR (Beckman Coulter) followed by flow cytometric analysis using CaliBRITE beads (BD Bioscience) as an internal standard. The purity of the sorted cells was always >95%. Target CD4+CD25− T cells were labeled with 5 μM CFSE (Molecular Probes) for 15 min, washed and counted. APCs were prepared as described above. Suppression or anergy assays were set up in U-bottom 96 well plates coated with CD3ε-specific antibody (0.6 μg/ml). About 5 × 10⁴ transduced cells were incubated together with 5 × 10⁴ CFSE-labeled target T cells and 2.5 × 10⁴ irradiated APCs. After 72 h of co-culture the cells were subjected to flow cytometric analysis. The relative proliferation of transduced T cells (anergy) and target T cells (suppression) were measured by calculating the ratio of cells:beads. For other experiments suppression by the transduced T cells was assessed by the percentage of divided target T cells calculated based on CFSE dilution.
In vivo Weight-Loss Assays
Mouse CD4+CD25−CD45RBhi T cells were isolated from spleens of female Balb/c. Cells were enriched for CD4+ cells by MACS depletion followed by staining with PE conjugated anti-CD45RB antibody and the CD45RBhi (25% brightest) cells were purified (>99%) by FACS (MoFlo). Seven week old weight-matched female CB.17.SCID mice received an intraperitoneal (i.p.) injection of 3 × 10⁵ CD4+CD25−CD45RBhi cells along with 2 × 10⁵ CD4+CD25− cells transduced with either a control gene, wildtype Foxp3 or a mutant version of Foxp3 and the mice were daily monitored for weight loss.
Statistical Analysis
All the experiments were repeated at least twice with representative results shown in some cases. Statistical analyses were performed using Prism. Student’s t tests and one-way ANOVAs were performed with p values <0.05 considered statistically significant.
Results
Gain of Foxp3 in Jawed Vertebrates
To investigate the evolutionary conservation of Foxp3 as compared to other Foxp subfamily members, we performed BLAST searches (Table 1) and detailed analyses of syntenic regions around the putative foxp3 loci (Figures 1A–C). We found that the presence of Foxp subfamily members is restricted to jawed vertebrates and foxp3-like genes (Foxp3L; 30% protein identity to mouse Foxp3) can be found in bony fish, amphibians, and reptiles, but not in birds (chicken and zebra finch). However, they are retained in the mammalian lineage, where foxp3 (>50% protein identity) is present in all members including marsupials and monotremes (egg-laying mammals). We found that the gene order surrounding foxp3 was highly conserved in all mammals, strongly suggesting an orthologous relationship (Figures 1A–C). The gene order surrounding the two foxp3-like genes in zebrafish was not conserved (Figures 1B and 2), but syntenic regions could be identified on chromosome 8 (Figures 1A and 2A). While most genes found in the vicinity of foxp3 in mammals could also be identified in birds, no foxp-like genes could be found in their proximity (Figure 1C). In addition, phylogenetic analyses showed Foxp3 to be the most diverse member of the Foxp subfamily, especially in non-placental vertebrates (Figure 3).
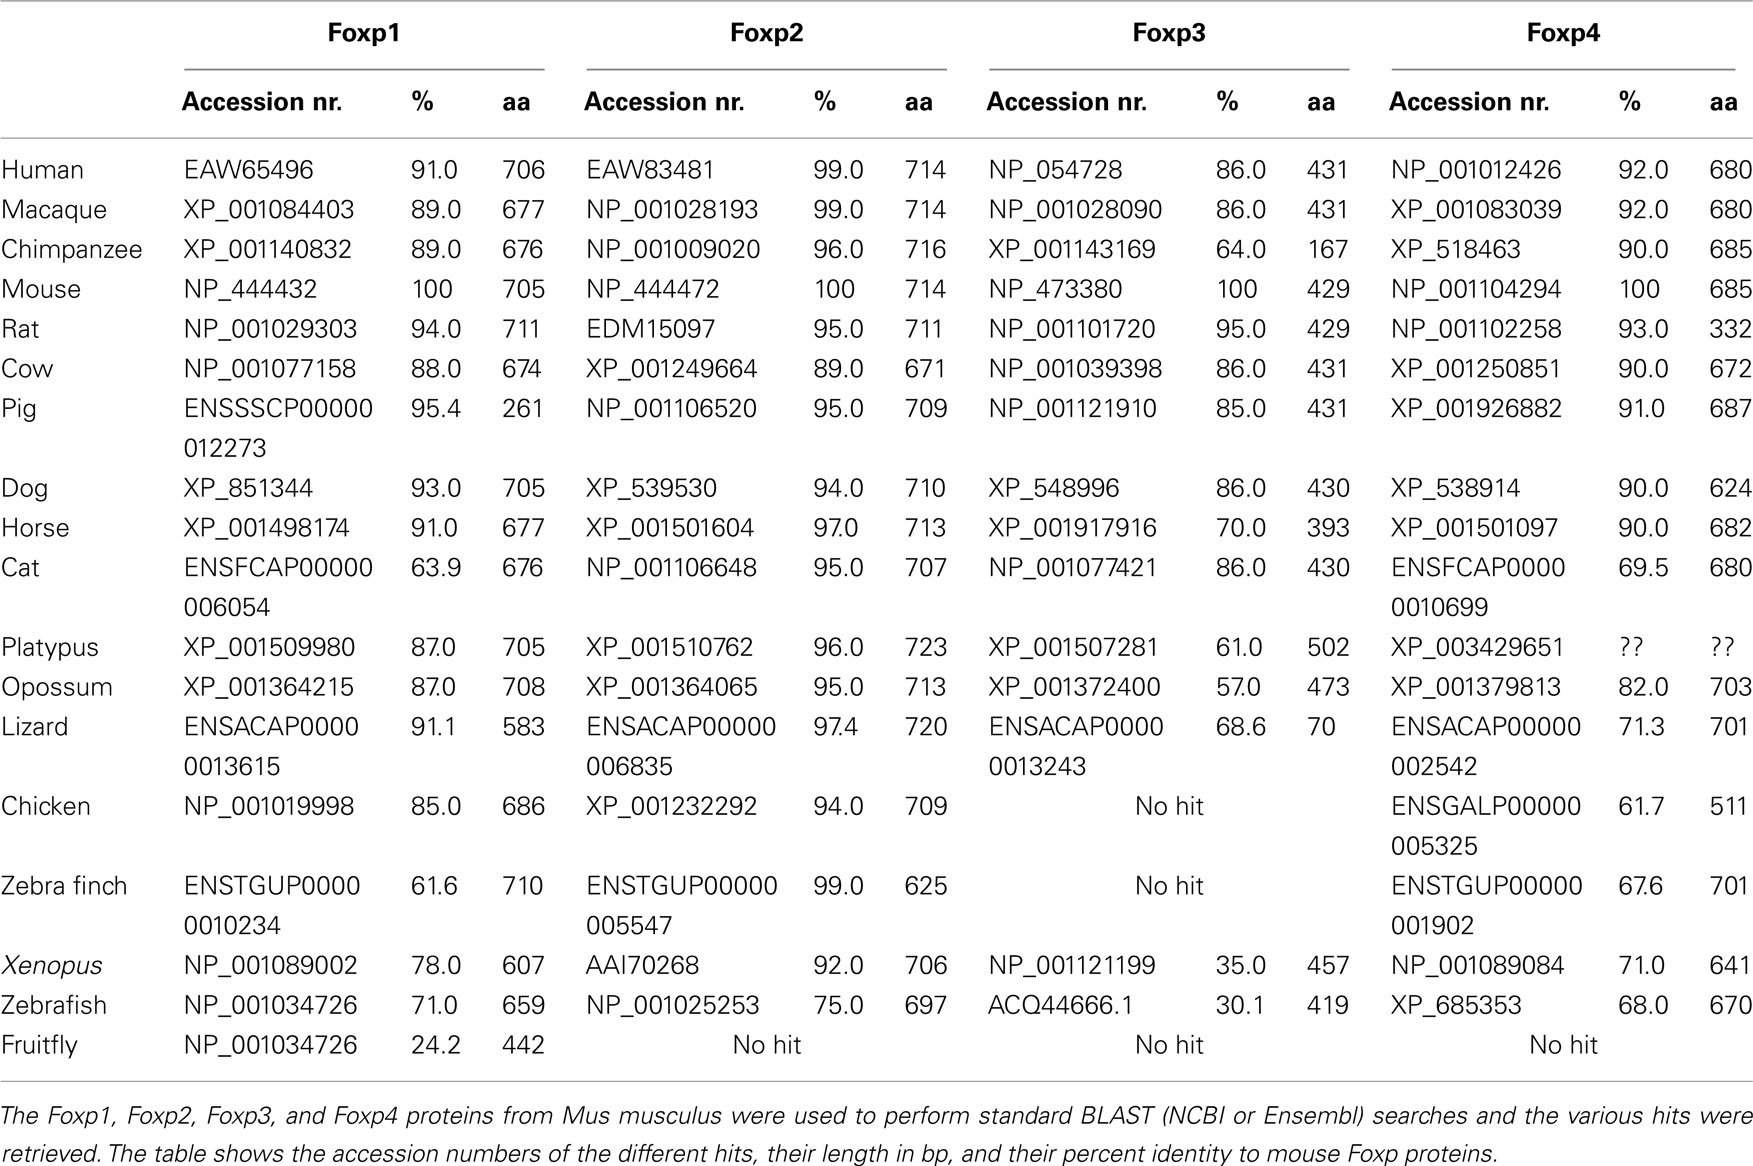
Table 1. Foxp Subfamily BLAST Hits.
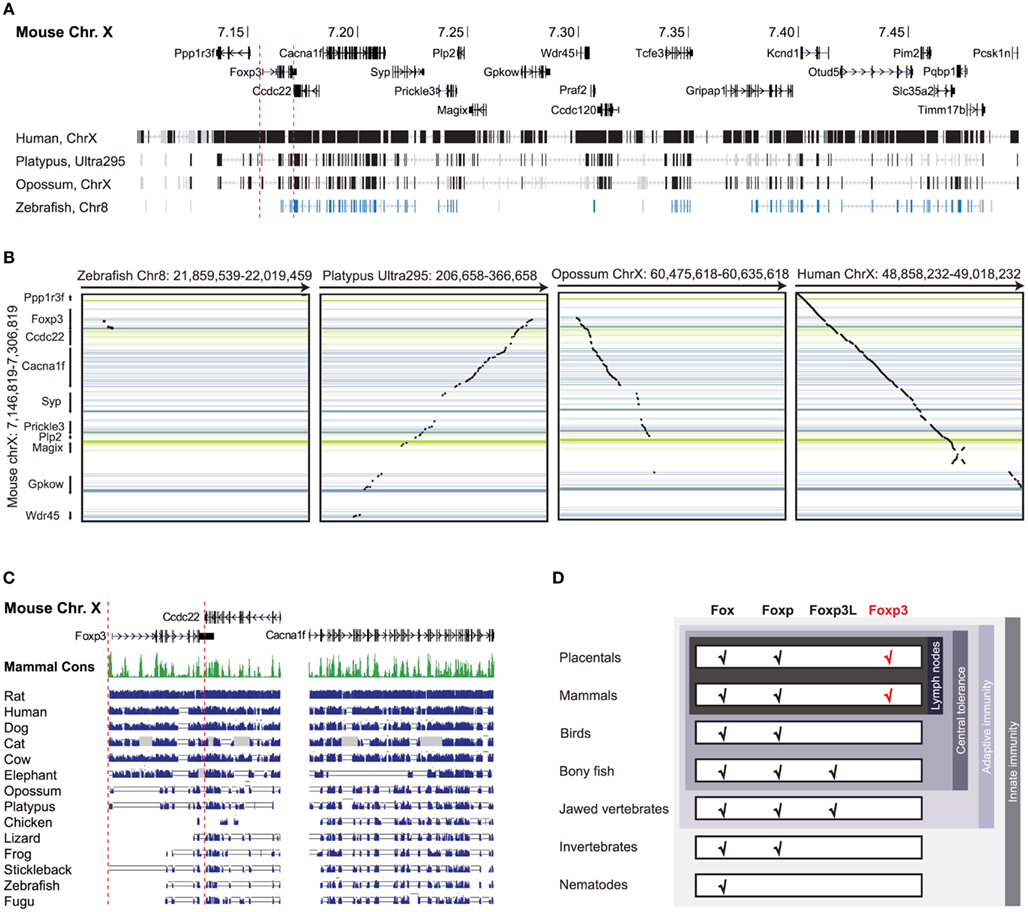
Figure 1. Foxp3 orthologs can be found in mammals and jawed vertebrates. (A) Mouse Chr. X 7.10–7.50 mb containing the foxp3 locus and flanking regions with exons shown as vertical bars. A discontinuous whole genome nucleotide alignment is shown below as implemented in the UCSC genome browser (Kent et al., 2002). (B) Continuous dotblot genome alignments of 160 kb flanking the murine foxp3 locus with foxp3 loci of other species (black dots: aligned region; dark blue/green: forward/reverse exons; light blue/green: forward/reverse UTRs). (C) Mouse Chr. X containing foxp3 and adjacent genes with exons shown as vertical black bars. The mammalian consensus (Mammal Cons) represents 20 placental mammals available in the UCSC Genome browser with the height of the green bars denoting the level of conservation in all species determined by BLASTZ (Miller et al., 2007). A discontinuous whole genome nucleotide alignment of the mouse genes in this region with those of other species, irrespective of their location in the genome, are shown as blue bars. The height of the bars corresponds to the level of conservation. Low quality or missing sequence data is shown as gray boxes and alignment gaps are shown as gray double lines. For clarity, only regions containing genes are shown. (D) Conservation of Fox family members. The emergence of the Foxp subfamily coincides with the evolution of adaptive immunity in jawed vertebrates.
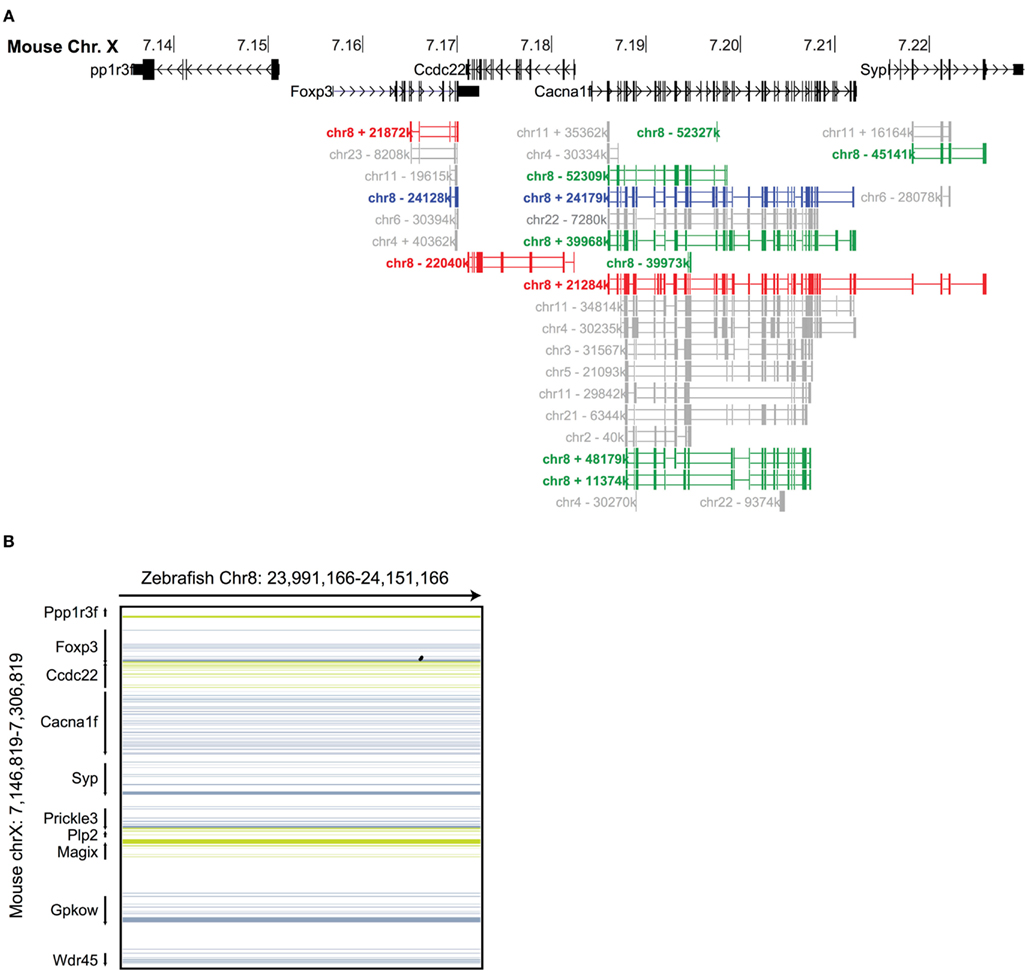
Figure 2. Syntenic analysis of the Foxp3 loci in zebrafish. (A) Mouse Chr. X 7.135–7.235 mb containing the foxp3 locus and flanking regions with exons shown as vertical black bars. A discontinuous whole genome nucleotide alignment of the zebrafish genome as determined using BLASTZ (Schwartz et al., 2003) in the UCSC genome browser (Kent et al., 2002) is shown below. Alignments from Chr. 8 are shown in red (Chr. 8 in the region around 21.8 mb), blue (Chr. 8 in the region around 24.1 mb) and green (multiple regions on Chr. 8), and those from other chromosomes in gray. (B) Continuous genome alignments of 160 kb flanking the murine foxp3 locus with the putative foxp3 locus from zebrafish on Chr. 8 in the region of 24.1 mb (black dots: aligned region; dark blue/green: forward/reverse exons; light blue/green: forward/reverse UTRs).
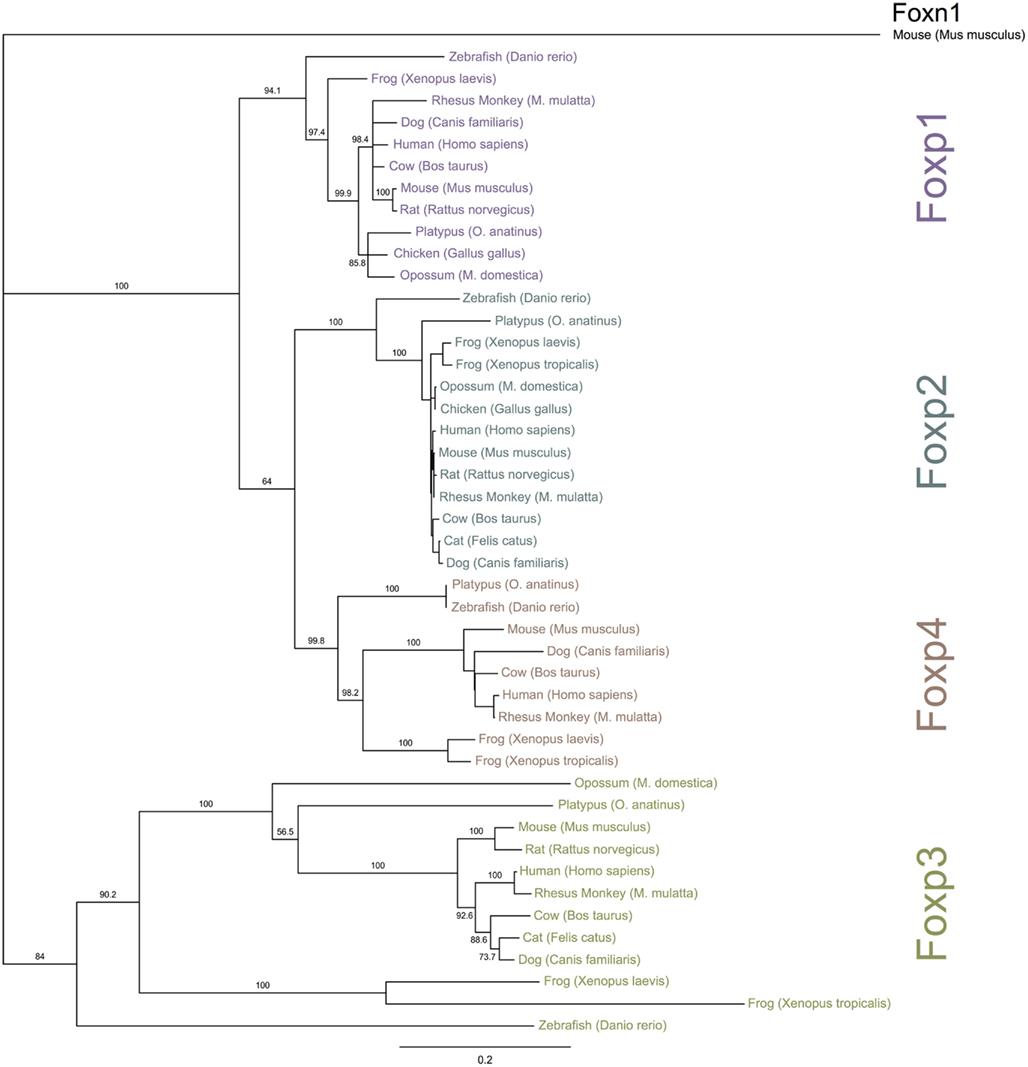
Figure 3. Phylogenetic relationship of Foxp subfamily orthologs. The NCBI and Ensembl databases were queried for full-length protein sequences for Foxp subfamily members. The proteins were aligned and a bootstrapped tree (1000 repetitions) was constructed with the Neighbor Joining algorithm implemented in Geneious (Drummond et al., 2010). Foxn1 was used for out-group rooting. The numbers represent bootstrap values and the scale-bar is equivalent to an average of 20% change in amino acid divergence.
Taken together, our data suggest that foxp3 or foxp3-like genes can be found in jawed vertebrates, which correlates with the presence of an adaptive immune system and thus a need for peripheral tolerance mechanisms (Figure 1D).
Stepwise Gain of Functional Domains
To gain insight into the functional potential of the identified foxp3 orthologs, we performed comparative analyses of the various proteins. We found that the sequence homology of foxp3 orthologs across all vertebrates is restricted to the C-terminal half of the protein containing the FKH, CC, and ZnF (Figure 4). While in the other Foxp subfamily members the conservation is evenly distributed over the length of the protein (Figure 4), mammalian Foxp3 distinguishes itself from its non-mammalian counterparts by a proline-rich region (ProR; >15% prolines) spanning exons 2 and 3 (Figures 5A–C). In placentals, the homology of this region extends further into exon 1 (Figures 5A,C).
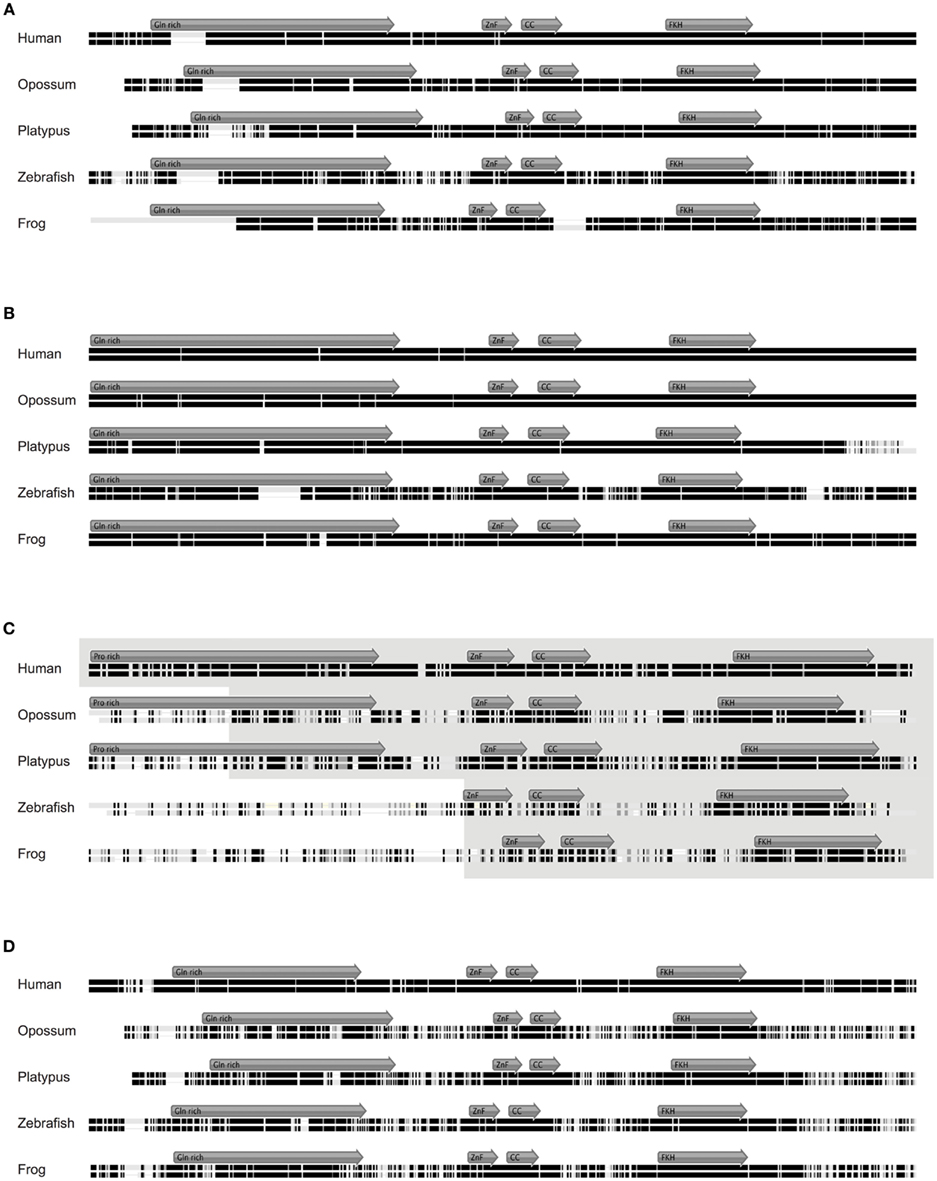
Figure 4. Alignment of Foxp1, Foxp2, Foxp3, and Foxp4 orthologs. (A) Mouse Foxp1 amino acid (aa) sequence aligned to its orthologs in human (92.9% identity; 677aa), opossum (88.3% identity; 677aa), platypus (86.3% identity; 686aa), frog (94.8% identity; 607aa), and zebrafish (78.4% identity; 659aa). (B) Mouse Foxp2 amino acid (aa) sequence aligned to its orthologs in human (99.4% identity; 715aa), opossum (98.7% identity; 713aa), platypus (91.0% identity; 723aa), frog (94.8% identity; 738aa), and zebrafish (78.4% identity; 697aa). (C) Mouse Foxp3 protein sequence aligned to its putative orthologs in human (86.5% identity; 431aa), opossum (48% identity; 473aa), platypus (55.5% identity; 502aa), frog (34.5% identity; 593aa), and zebrafish (30.1% identity; 376aa). (D) Mouse Foxp4 protein sequence aligned to its putative orthologs in human (92.3% identity; 680aa), opossum (55.7% identity; 677aa), platypus (69.7% identity; 670aa), frog (70.8% identity; 641aa), and zebrafish (69.7% identity; 670aa). The gray arrows show the position of the putative functional domains within the aligned sequence. Identical amino acids are represented by black bars, similar amino acids by gray bars, and not similar amino acids by white bars. Gaps are shown as black line.
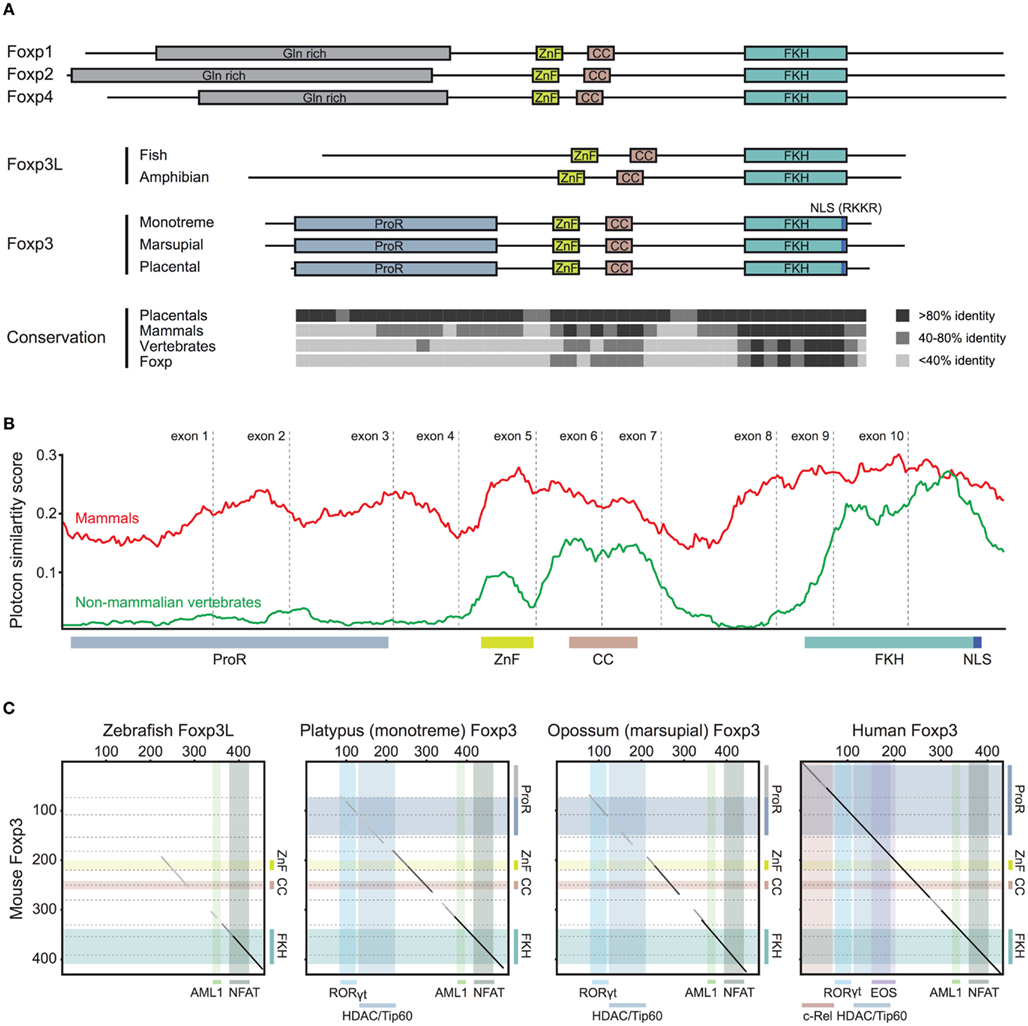
Figure 5. Stepwise gain of Foxp3 domains. (A) Representative schematic of the functional domains of Foxp1, Foxp2, Foxp3, and Foxp4 that can be found in mammalian proteins. (ProR, Proline-rich region; ZnF, zinc finger; CC, coiled-coil; FKH, forkhead; NLS, nuclear localization signal. All domains are drawn to scale using mouse proteins). The conservation across the Fox family members is shown as the percent identity in windows of 10 amino acids over the length of mouse Foxp3 as compared to the placental (8 species), mammalian (10 species), and vertebrate (3 species) consensus as well as that of the mouse Foxp subfamily. (B) A conservation plot showing the average similarity score at individual amino acid positions from multiple sequence alignments of mammalian Foxp3 (red; 10 species) and non-mammalian vertebrate Foxp3L (green; 7 species). The plots were generated using EMBOSS plotcon with a window size of 20 (Rice et al., 2000). (C) Dotblot alignments of Foxp3 proteins with the predicted interaction partners and functional domains overlaid (based on mouse Foxp3; black lines: strongly aligned regions; gray lines: aligned regions; dotted lines: exon boundaries; x-axis color overlays: binding regions of known interaction partners; y-axis color overlays: predicted functional domains).
We performed a comparison of multiple sequence alignments of Foxp3 from 10 mammals with that of 5 non-mammalian vertebrates. We found that while the sequence-space occupied by the ProR in mammals is also present in non-mammalian vertebrates, this region is not conserved (Figure 5B) and has low proline content (∼5%).
Proline-rich structures, through their intrinsic disorder, increase a domains ability to bind interaction partners (Kay et al., 2000). Given the conservation of the ProR in mammals, it is possible that Foxp3 in these species have an increased their ability to interact with other proteins. Indeed, a GlobPlot analysis of the various orthologs revealed that the disordered character of the N-terminal half of Foxp3 is substantially higher in placentals than in other vertebrates (Figure 6).
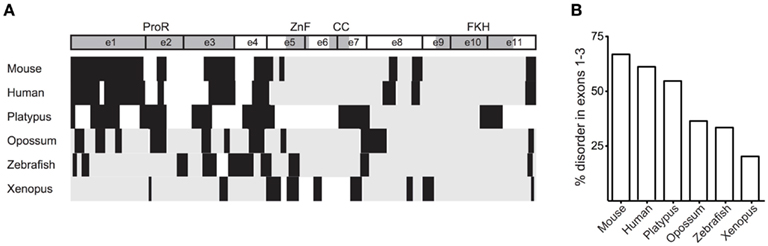
Figure 6. The ProR is disordered in placentals. (A) The disorder of Foxp3 from various species was calculated using GlobPlot (Linding, 2003). (B) The percentage of disorder in the ProR from the various species. Since not all Foxp3s have a ProR, the part of the N-terminal region having the best alignment to mouse Foxp3 was chosen from these organisms.
When we superimposed the binding regions of known interaction partners of mouse Foxp3 onto pairwise sequence alignments (Figure 5C), we found that the ability to bind RORγt (Ichiyama et al., 2008; Zhou et al., 2008), HDACs, and Tip60 (Li et al., 2007) appears to have been acquired in the common mammalian ancestor (Figure 5C). The “extended” ProR seen in all placentals may have enabled Foxp3 to bind to EOS (Pan et al., 2009) and the NF-κB member c-Rel (Loizou et al., 2011; Figure 5C) – both of which play a crucial role in modulating immune responses (Loizou et al., 2011).
Together, our findings suggest that during the evolution of Foxp3 it acquired the ability to bind a multitude of different proteins via the ProR. This new acquisition is likely to have extended its capacity as a master-regulator of the TR cell transcriptional network.
Functionally Important Domains Are under Purifying Selection
To gain further insight into the domain evolution of Foxp3, we examined evidence for purifying (negative) selection in the ProR, ZnF, CC, and FKH. Using a REL test (Kosakovsky Pond and Frost, 2005) we estimated a dN/dS ratio at each position in a codon alignment of placental Foxp3s and calculated a Bayes factor for the event that domains are under purifying selection. We observed strong selection signals in the ProR and FKH (Figure 7A), which is suggestive of their functional importance. No signals above our threshold could be identified in the ZnF and CC, indicating that these domains may have a more generic function allowing for sequence flexibility.
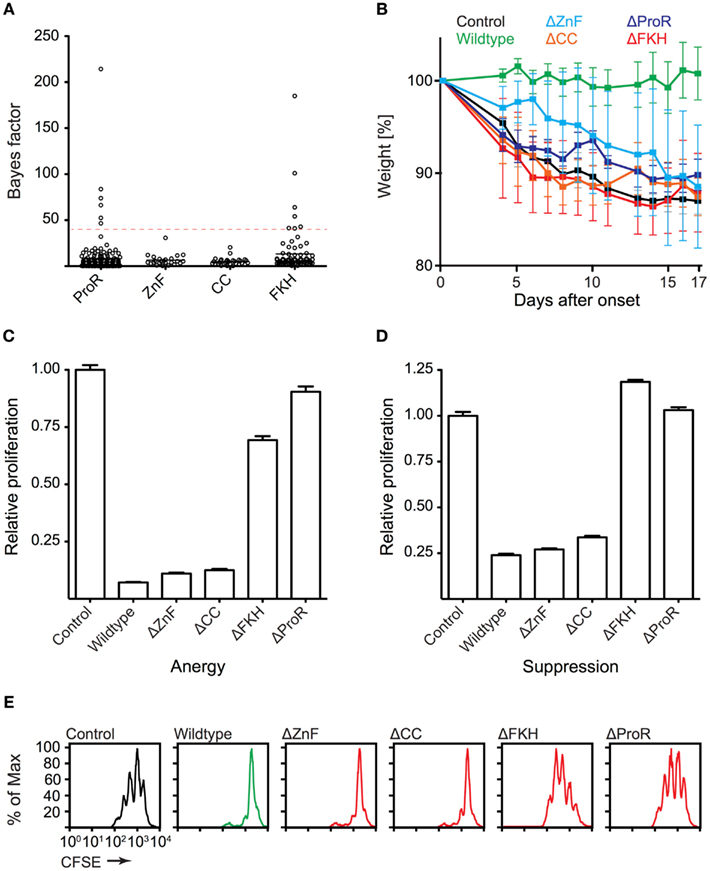
Figure 7. Functionally important Foxp3 domains are under purifying selection in placentals. (A) The REL (Kosakovsky Pond and Frost, 2005) test as implemented in Datamonkey (Pond and Frost, 2005) was used to perform a selection analysis of placental Foxp3s. Bayes factor scores of individual codons from the ProR, ZnF, CC, and FKH are shown (dotted red line: arbitrary Bayes factor cutoff for purifying selection). (B–E) T cells were transduced with wildtype or mutant Foxp3 as well as an irrelevant control gene. (B) The ability of the transduced cells to prevent weight loss by co-transferred “aggressor” T cells was measured by following the mean weight of the mice (n ≥ 4 per group) normalized to their weight on the day of onset in control mice. (wildtype vs. mutants: P ≤ 0.001 in each case; one-way ANOVA). (C–E) Suppressive activity and induction of anergy (non-proliferation) in the transduced T cells as shown by the relative proliferation normalized to that of control transduced cells of (C) “target” T cells or (D) transduced T cells. (E) Representative CFSE-profiles of “target” T cell proliferation. Error-bars represent the SEM.
To test our computational predictions, we ectopically expressed wildtype Foxp3 and domain-deletion mutants lacking putative functional elements, in “normal” T cells. The forced expression of wildtype Foxp3 in non-regulatory T cells has been shown to confer a TR cell phenotype to the transduced cells in most measurable aspects (Fontenot et al., 2003; Hori et al., 2003). The transduced cells suppress the proliferation of “target” TH cells and become anergic (non-proliferative) ex vivo. When tested in vivo, they are capable of preventing weight loss induced by co-transfer of “aggressor” cells into lymphopenic mice (Hori et al., 2003; Mottet et al., 2003). When we analyzed our domain-deletion mutants, we found that the ProR, ZnF, CC, and FKH domains all were required to confer TR cell phenotype in vivo (Figure 7B). Ex vivo, in contrast, only cells transduced with mutants lacking the ProR or FKH appeared to be defective in Foxp3 function. They were no longer anergic (Figure 7C) and failed to suppress target T cell proliferation (Figures 7D,E).
Together, the computational and functional tests highlight the importance of the functional domains of Foxp3 and agree with previous studies (Lopes et al., 2006; Ziegler, 2006).
Mammalian Evolution of the Forkhead Domain
Evolutionary changes that alter the function of a highly conserved domain like the FKH are likely more subtle than the gain of an entire functional domain such as the ProR.
To gain further insight into the evolutionary differentiation of Foxp3, we investigated whether individual residues within the FKH distinguish the Foxp3 orthologs from those of other Foxp subfamily members. We found 12 such “signature” residues, 9 of which are conserved in all mammals (Figure 8A). In contrast, maximally 3 of these 12 signature residues could be found in the FKH of Foxp3L in fish and amphibians (Figure 8A).
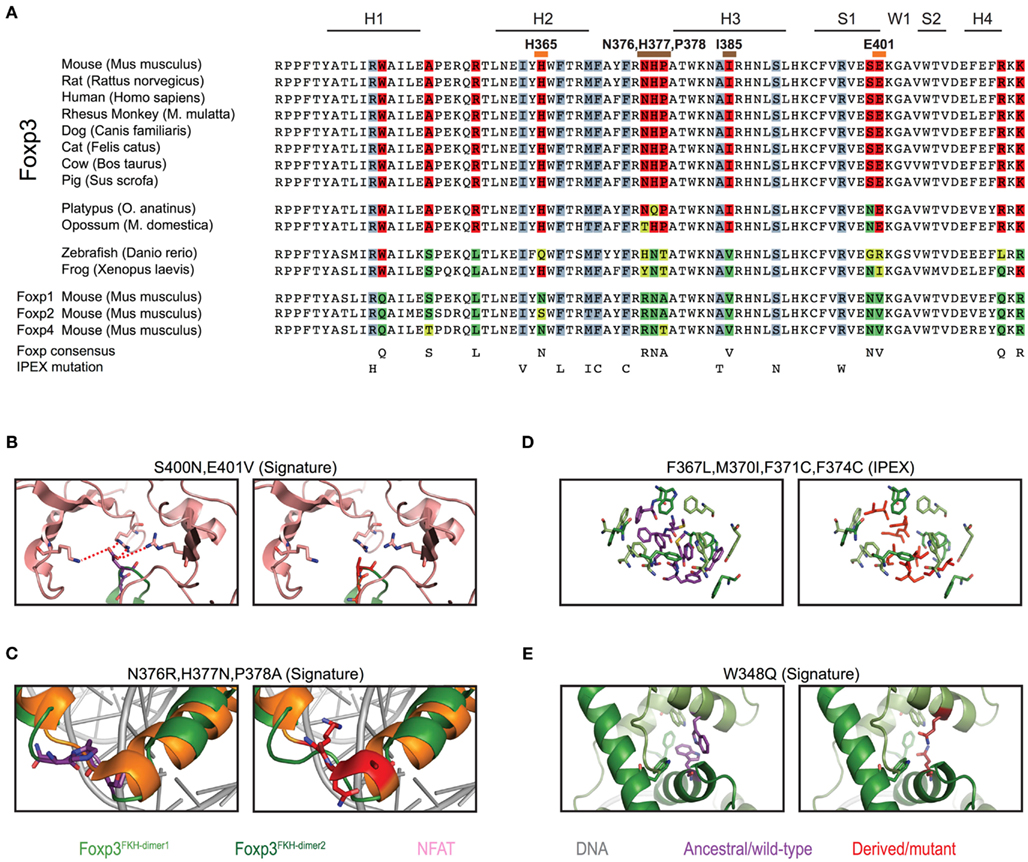
Figure 8. Mammalian evolution of the forkhead. (A) Alignment of Foxp subfamily FKH domains. Foxp3-specific signature residues are highlighted in red, whereas those of other Foxp subfamilies are highlighted in shades of green. IPEX mutations are underlaid in blue. Signature residues predicted to be involved in NFAT interaction or to affect DNA binding are marked with orange and brown lines respectively (H, helix; S, β-sheet; W, wing). (B–E) Predicted effects of signature residue and IPEX mutations on the structure of Foxp3. Wildtype residues are shown in the left panel, whereas mutants/Foxp consensus residues are shown on the right. Red lines represent attractive forces. (C) Structure alignment of helix 2 and 3 of the FKH of Foxp3 (green; Bandukwala et al., 2011) and Foxp2 (orange; Stroud et al., 2006) with the Foxp3-specific (left panel; purple) and Foxp2 (right panel; red) residues highlighted.
To gain insight into the relevance of these findings, we used structural modeling to examine the effects of mutations in the signature residues and compared them to Foxp3 mutations that cause loss of TR cells in human immunodysregulation polyendocrinopathy enteropathy X-linked syndrome (IPEX) patients (Harbuz et al., 2010). Interestingly, the IPEX mutations target amino acids that are conserved across all vertebrates. We found that many of the signature residues may play important roles in protein–protein interaction and DNA binding (Figure 9). For example, the residues His365 and Glu401 are part of the Foxp3/NFAT interface (Figures 8B and 9H). Their reversion into the Foxp consensus residues Asn365 and Val401 is likely to negatively affect their contribution to NFAT interaction (Bandukwala et al., 2011).
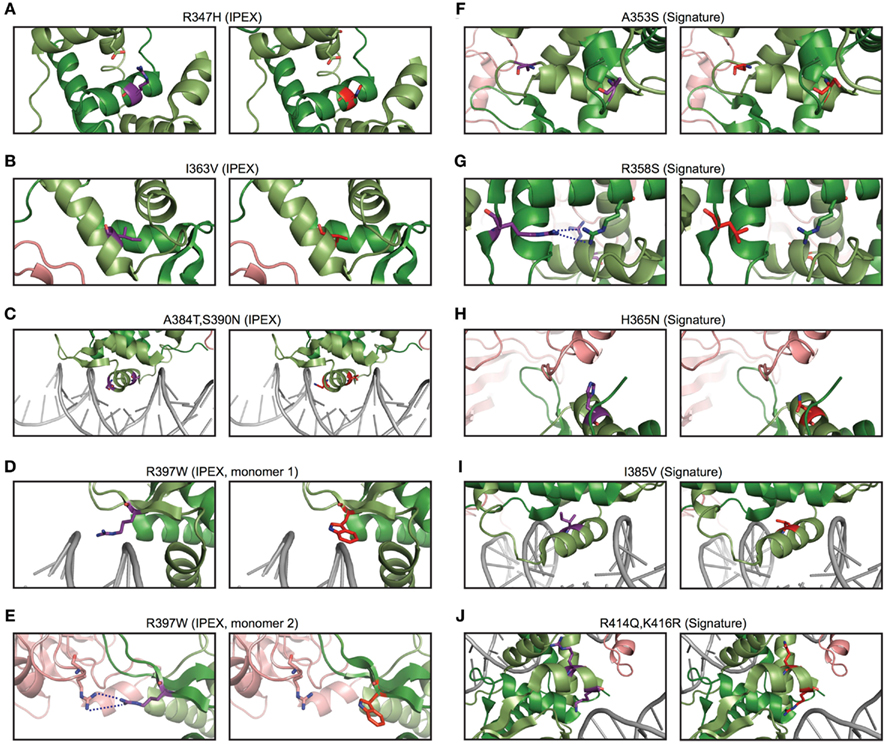
Figure 9. The predicted effects of point mutations in the Foxp3 forkhead. (A–E) IPEX point mutants in Foxp3 (right) with the corresponding wildtype residue (left). (F–J) Foxp3-specific signature residues (left) compared to the Foxp consensus (right).
The signature residues Gln376, His377, and Pro378, located directly upstream of the DNA recognition helix (H3), likely influence the way Foxp3 binds DNA (Figure 8C). While Gln376 points away from the DNA, the arginine found in other Foxp subfamily members makes close contact with the minor groove of the DNA (Figure 8C). In addition, helix 3 of Foxp3 has a substantially shorter N-terminus than helix 3 found in Foxp2 (Figure 8C). This is likely caused by the helix-breaking properties of Pro378, which in Foxp3 replaces an alanine or threonine found in the other Foxp subfamily members.
In contrast to the signature residues suggested role in DNA binding and protein interaction, we found that most IPEX mutations target residues important for FKH domain swapping and structural stability (Figures 8D and 9A–E; Bandukwala et al., 2011). For example, the IPEX mutations Foxp3F367L, Foxp3M370C, Foxp3F371C, and Foxp3F374C, together with the signature residue Trp348, affect an aromatic cluster that is involved in FKH domain swapping (Figures 8D,E), which is important for Foxp3 function (Bandukwala et al., 2011).
Together, our findings suggest that mammalian-specific signature residues are important for Foxp3s ability to interact with other molecules. IPEX residues in contrast, appear to play critical roles in protein stability and folding.
Mammalian-Specific Forkhead Residues are Functionally Important
Our homology modeling and conservation analyses suggest that mutations in the signature residues and residues affected by IPEX mutations affect the function and structural integrity of the FKH (Figure 10A). IPEX residues are largely buried within the FKH of Foxp3 (Figure 10B). Signature residues, in contrast, appear to be more accessible for interaction with other molecules, such as NFAT, as they can primarily be found on the surface of the FKH (Figures 10A,B).
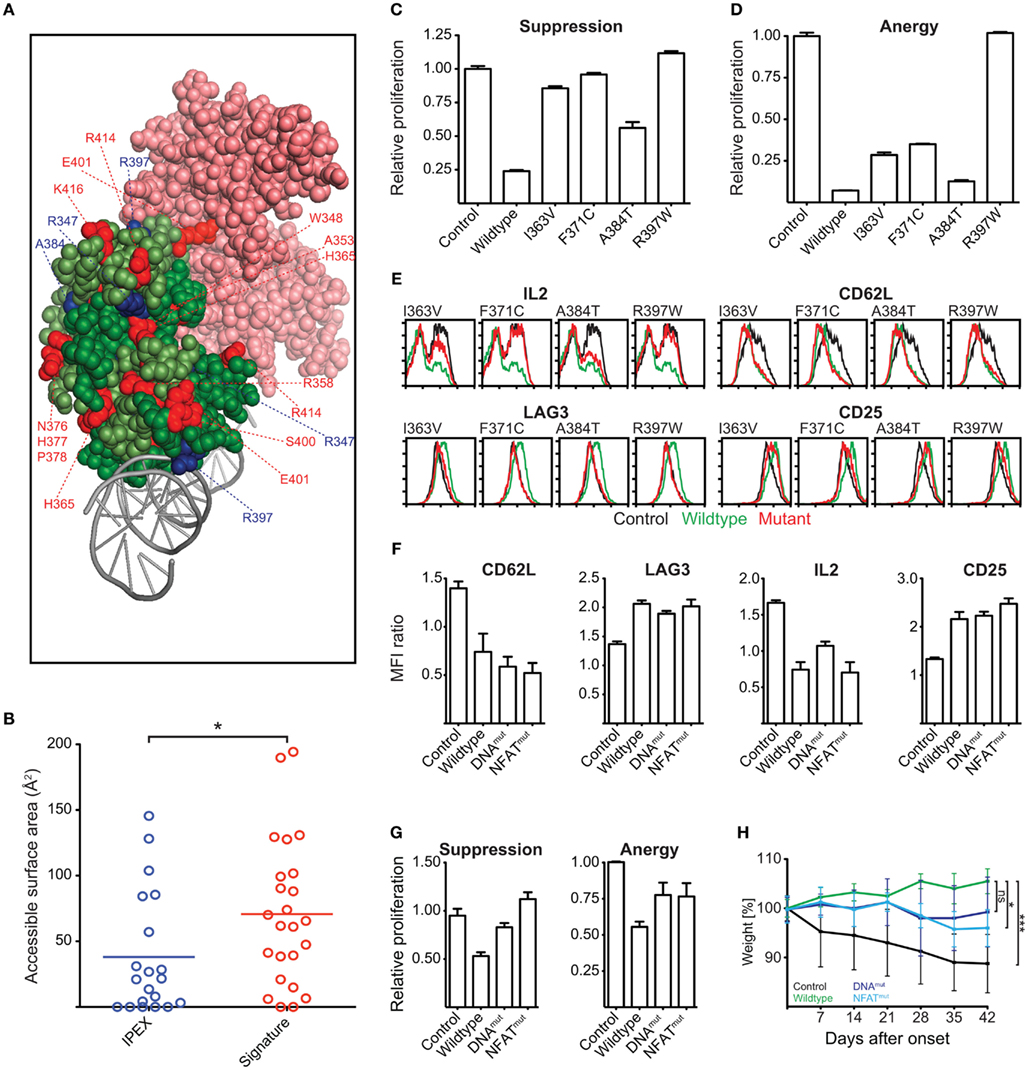
Figure 10. Identification of Functionally Important Residues in the Foxp3 forkhead domain. (A) Structure of the domain-swapped FKH of Foxp3 (light green: monomer 1; dark green: monomer 2) in complex with NFAT (pink) and DNA (gray; Bandukwala et al., 2011). Red: signature residues; blue: IPEX mutations. (B) Surface accessibility of IPEX and signature residues of the domain-swapped FKH calculated using GetArea (Fraczkiewicz and Braun, 1998; *P-value < 0.05, unpaired t test). (C–E) T cells were transduced with wildtype Foxp3, IPEX mutants, or an irrelevant control gene. (C,D) Suppressive activity and induction of anergy in the transduced T cells as shown by the relative proliferation normalized to that of control transduced cells of (C) “target” T cells or (D) transduced T cells. (E) Representative FACS plots of the expression of Foxp3 target genes in the transduced T cells (at least three independent experiments). (F–H) Foxp3 mutants containing reverted signature residues predicted to be involved in NFAT interaction (NFATmut with H365N and E401V) or influence DNA binding (DNAmut with N376R, H377N, P378A, I385V) or a deletion of the entire FKH (ΔFKH) were created and expressed in T cells. As a control, the cells were transduced with an irrelevant control gene. (F) Bar graphs showing the mean fluorescence intensity (MFI) by FACS analysis of Foxp3 target genes in transduced cells as compared to the non-transduced cells within the same well (two independent experiments). (G) Suppressive activity and induction of anergy in the transduced T cells (two independent experiments). (H) The ability of the transduced cells to prevent weight loss caused by co-transferred “aggressor” T cells was measured by following the mean weight of the mice (n ≥ 4 per group) normalized to their weight on the day of onset in control mice. P values determined by one-way ANOVA; ns, not significant; *≤0.05, ***≤0.001. Error-bars represent the SEM.
To test the functional importance of IPEX and signature residues, we ectopically expressed Foxp3 mutants carrying point mutations in the various residues. We assessed their ability to confer suppressive and anergic potential and measured their influence on the regulation of the Foxp3 target genes IL-2, CD62L, LAG-3, CTLA-4, and CD25 (Hori et al., 2003; Andersen et al., 2008).
We found that the IPEX mutants strongly affected Foxp3 function; especially the mutant R397W that led to a complete loss of Foxp3 function (Figures 10C–E). Reversion of individual signature residues to that of the “non-Foxp3” consensus sequence (Figure 8A) only had minor effects on Foxp3 function (data not shown). When we replaced all signature residues predicted to be involved in NFAT interaction (E401, H365; Foxp3NFATmut), or to influence DNA binding (N376, H377, P378, I385; Foxp3DNAmut), we found them to have a marked effect in ex vivo assays (Figures 10F,G). When we tested the signature residue mutants in vivo, we found that Foxp3NFATmut had a significant effect on Foxp3 function (Figure 10H). Foxp3DNAmut also appeared to negatively influence TR cell differentiation of the transduced cells in this assay, but did not reach statistical significance in our experiments (Figure 10H).
Taken together, our computational and functional studies suggest that key stepwise events occurred during the evolution of Foxp3. While orthologs of the gene can be found in many higher vertebrates, functionally important characteristics such as the ProR and signature residues are unique features restricted to the mammalian lineage (Figure 11). This suggest that selection pressures specific to mammals affected the evolution of Foxp3 function and one might speculate that Foxp3+ TR cells in turn facilitated the evolution of invasive placental pregnancy.
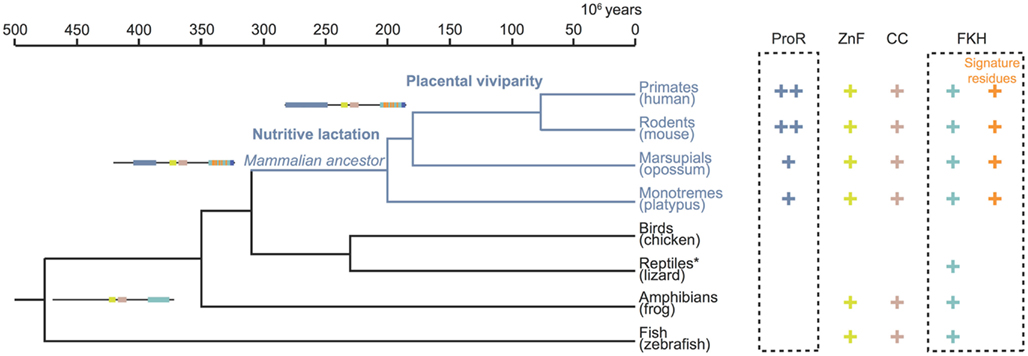
Figure 11. Stepwise gain of functional domains during Foxp3 evolution. The topology and divergence timeline on the phylogenetic tree are adapted from previous studies (Woodburne et al., 2003; Brawand et al., 2008). The presence of a domain in the Foxp3 orthologs is denoted by a plus sign. Within the FKH the presence of Foxp3-specific signature residues is distinguished. The incremental gain of functional domains and signature residues is schematically represented. *The protein data available for lizard (Anolis carolinensis) is restricted to part of the FKH.
Discussion
Little is known about how Foxp3 evolved its ability to operate as a transcriptional repressor and activator, hereby acting as a master-regulator of TR cell development and function. Our study suggests that this happened via a stepwise gain of domains with key events occurring in the common mammalian and placental ancestors. We found foxp3-like genes in fish and amphibians, suggesting that the gene was acquired early in the vertebrate lineage. It appears that foxp3 has been lost from the genomes of birds, suggesting that at this point in evolution it may have served a non-essential or redundant role. However, the sequencing projects of birds are still incomplete and thus we cannot completely exclude the presence of foxp3-like genes.
Our analyses revealed that the C-terminal half of Foxp3 containing the CC, ZnF, and FKH is largely conserved across all vertebrates. In contrast, the ProR and the signature residues in the FKH, were novel components that appear to have been gained in the common mammalian ancestor, as they can be found in all mammals including monotremes and marsupials. In addition, the very N-terminal tail of the ProR is only conserved in placentals, suggesting a further functional differentiation.
Both the FKH and the ProR in the genomes of placentals contain signatures of purifying selection, highlighting the importance of these domains in Foxp3 function. Our data suggest that the FKH benefited from point mutations that “fine-tuned” functions such as NFAT interaction and DNA binding. These amino acids have been retained as Foxp3-specific signature residues within the mammalian lineage. Structural and functional studies support this notion (Stroud et al., 2006; Wu et al., 2006; Bandukwala et al., 2011) and demonstrate an increase in the Foxp3/NFAT contact interface over that of Foxp2, which contains the Foxp consensus residues in this region (Bandukwala et al., 2011).
The acquisition of the ProR in mammals may have increased Foxp3s evolutionary differentiation from other Foxp proteins by allowing it to bind to factors involved in T cell activation and lineage commitment. Foxp3 interacts with a vast array of proteins via this domain, including the DNA binding factor EOS (Pan et al., 2009), the histone deacetylases HDAC7/9, the histone acetyltransferase Tip60 (Li et al., 2007), as well as the transcription factors RORγt (Ichiyama et al., 2008; Zhou et al., 2008), RORα (Du et al., 2008), and c-Rel (Loizou et al., 2011). It is plausible that the ability of Foxp3 to bind to these factors might have significantly increased its capacity to control TR cell development and function in the mammalian lineage.
It has been suggested that foxp3-like genes that can be found in fish are expressed in the lymphocyte lineage and fulfill similar T cell specific functions (Quintana et al., 2010; Wen et al., 2011). However, as these divergent orthologs appear to lack key features of mammalian Foxp3, further studies need to address to what extent Foxp3L can re-program cells in non-mammalian vertebrates. While Foxp3L appears to confer some suppressive activity (Quintana et al., 2010; Wen et al., 2011), the reprogramming of T cells by Foxp3 in mammals is likely to be far more widespread and affect many characteristics of TR cell function.
In conclusion our data suggest that Foxp3 gained the ability to interact with multiple partners in a stepwise fashion. These interactions can occur individually or as a complex (Li et al., 2006). Although it is impossible to directly prove that there is a link between the evolution of TR cells and that of invasive placentation, our findings are consistent with this hypothesis. Based on the conservation of Foxp3, it appears that the common mammalian ancestor had TR cells with similar characteristics to those in mice and humans. The evolution of CD4 T cell memory, which is believed to have occurred in the mammalian lineage rendered negative selection inadequate for the suppression of undesirable immune responses (Lane et al., 2010). This mechanistic niche appears to have been filled by the evolution of TR cells which provided nature with a mechanism to suppress undesirable immune responses in a localized and specific fashion (Gaspal et al., 2011). This in turn is likely to have been required prior to the evolution of invasive placentation. Once acquired, Foxp3 was subjected to strong purifying selection in placentals, consistent with the pivotal role of TR cells in maternal–fetal tolerance (Aluvihare et al., 2004; Rowe et al., 2011).
Conflict of Interest Statement
The authors declare that the research was conducted in the absence of any commercial or financial relationships that could be construed as a potential conflict of interest.
Acknowledgments
We would like to thank Felix Randow for provision of the retroviral vector system and helpful discussions; Richard Berks and Angela Middleton for expert animal handling; Bodo Stern, Pardis Sabeti, Matt Stremlau, Danny Park, Rachel Sealfon, Jim Kaufman, and Sarah Teichmann for reading of the manuscript and useful suggestions. Kristian G. Andersen was a recipient of a fellowship from the Carlsberg Foundation. Jesper K. Nissen was funded by a grant from the Kornerup Foundation. Work was performed at the Laboratory of Molecular Biology in Cambridge, UK and Harvard University in Cambridge, MA, USA. This work was supported by the Medical Research Council (MRC file reference number U105184296).
Abbreviations
CC, coiled-coil; FKH, forkhead domain; IPEX, immunodysregulation polyendocrinopathy enteropathy X-linked syndrome; ProR, proline-rich region; TH cells, helper T cells; TR cells, regulatory T cells; ZnF, zinc finger.
References
Aluvihare, V. R., Kallikourdis, M., and Betz, A. G. (2004). Regulatory T cells mediate maternal tolerance to the fetus. Nat. Immunol. 5, 266–271.
Andersen, K. G., Butcher, T., and Betz, A. G. (2008). Specific immunosuppression with inducible Foxp3-transduced polyclonal T cells. PLoS Biol. 6, e276. doi: 10.1371/journal.pbio.0060276
Bandukwala, H. S., Wu, Y., Feuerer, M., Chen, Y., Barboza, B., Ghosh, S., Stroud, J. C., Benoist, C., Mathis, D., Rao, A., and Chen, L. (2011). Structure of a domain-swapped FOXP3 dimer on DNA and its function in regulatory T cells. Immunity 34, 479–491.
Bloor, S., Ryzhakov, G., Wagner, S., Butler, P. J., Smith, D. L., Krumbach, R., Dikic, I., and Randow, F. (2008). Signal processing by its coil zipper domain activates IKK gamma. Proc. Natl. Acad. Sci. U.S.A. 105, 1279–1284.
Brawand, D., Wahli, W., and Kaessmann, H. (2008). Loss of egg yolk genes in mammals and the origin of lactation and placentation. PLoS Biol. 6, e63. doi: 10.1371/journal.pbio.0060063
DeLano, W. L. (2002). The PyMOL Molecular Graphics System. San Carlos, CA: DeLano Scientific. Available at: http://www.pymol.org
Drummond, A. J., Ashton, B., Cheung, M., Heled, J., Kearse, M., Moir, R., Stones-Havas, S., Sturrock, S., Thierer, T., and Wilson, A. (2010). Geneious v5.0. Available at: http://www.geneious.com
Du, J., Huang, C., Zhou, B., and Ziegler, S. F. (2008). Isoform-specific inhibition of ROR alpha-mediated transcriptional activation by human FOXP3. J. Immunol. 180, 4785–4792.
Edgar, R. C. (2004). MUSCLE: multiple sequence alignment with high accuracy and high throughput. Nucleic Acids Res. 32, 1792–1797.
Fontenot, J. D., Gavin, M. A., and Rudensky, A. Y. (2003). Foxp3 programs the development and function of CD4+CD25+ regulatory T cells. Nat. Immunol. 4, 330–336.
Fontenot, J. D., Rasmussen, J. P., Williams, L. M., Dooley, J. L., Farr, A. G., and Rudensky, A. Y. (2005). Regulatory T cell lineage specification by the forkhead transcription factor foxp3. Immunity 22, 329–341.
Fraczkiewicz, R., and Braun, W. (1998). Exact and efficient analytical calculation of the accessible surface areas and their gradients for macromolecules. J. Comput. Chem. 319–333.
Gaspal, F., Withers, D., Saini, M., Bekiaris, V., McConnell, F. M., White, A., Khan, M., Yagita, H., Walker, L. S., Anderson, G., and Lane, P. J. (2011). Abrogation of CD30 and OX40 signals prevents autoimmune disease in FoxP3-deficient mice. J. Exp. Med. 208, 1579–1584.
Hannenhalli, S., and Kaestner, K. H. (2009). The evolution of Fox genes and their role in development and disease. Nat. Rev. Genet. 10, 233–240.
Harbuz, R., Lespinasse, J., Boulet, S., Francannet, C., Creveaux, I., Benkhelifa, M., Jouk, P. S., Lunardi, J., and Ray, P. F. (2010). Identification of new FOXP3 mutations and prenatal diagnosis of IPEX syndrome. Prenat. Diagn. 30, 1072–1078.
Hori, S., Nomura, T., and Sakaguchi, S. (2003). Control of regulatory T cell development by the transcription factor Foxp3. Science 299, 1057–1061.
Ichiyama, K., Yoshida, H., Wakabayashi, Y., Chinen, T., Saeki, K., Nakaya, M., Takaesu, G., Hori, S., Yoshimura, A., and Kobayashi, T. (2008). Foxp3 inhibits RORgammat-mediated IL-17A mRNA transcription through direct interaction with RORgammat. J. Biol. Chem. 283, 17003–17008.
Josefowicz, S. Z., and Rudensky, A. (2009). Control of regulatory T cell lineage commitment and maintenance. Immunity 30, 616–625.
Kay, B. K., Williamson, M. P., and Sudol, M. (2000). The importance of being proline: the interaction of proline-rich motifs in signaling proteins with their cognate domains. FASEB J. 14, 231–241.
Kent, W. J., Sugnet, C. W., Furey, T. S., Roskin, K. M., Pringle, T. H., Zahler, A. M., and Haussler, D. (2002). The human genome browser at UCSC. Genome Res. 12, 996–1006.
Khattri, R., Cox, T., Yasayko, S. A., and Ramsdell, F. (2003). An essential role for Scurfin in CD4+CD25+ T regulatory cells. Nat. Immunol. 4, 337–342.
Kosakovsky Pond, S. L., and Frost, S. D. (2005). Not so different after all: a comparison of methods for detecting amino acid sites under selection. Mol. Biol. Evol. 22, 1208–1222.
Lane, P. J., McConnell, F. M., Withers, D., Gaspal, F., Saini, M., and Anderson, G. (2010). Lymphoid tissue inducer cells and the evolution of CD4 dependent high-affinity antibody responses. Prog. Mol. Biol. Transl. Sci. 92, 159–174.
Li, B., Samanta, A., Song, X., Furuuchi, K., Iacono, K. T., Kennedy, S., Katsumata, M., Saouaf, S. J., and Greene, M. I. (2006). FOXP3 ensembles in T-cell regulation. Immunol. Rev. 212, 99–113.
Li, B., Samanta, A., Song, X., Iacono, K. T., Bembas, K., Tao, R., Basu, S., Riley, J. L., Hancock, W. W., Shen, Y., Saouaf, S. J., and Greene, M. I. (2007). FOXP3 interactions with histone acetyltransferase and class II histone deacetylases are required for repression. Proc. Natl. Acad. Sci. U.S.A. 104, 4571–4576.
Linding, R. (2003). GlobPlot: exploring protein sequences for globularity and disorder. Nucleic Acids Res. 31, 3701–3708.
Loizou, L., Andersen, K. G., and Betz, A. G. (2011). Foxp3 interacts with c-Rel to mediate NF-kappaB repression. PLoS ONE 6, e18670. doi: 10.1371/journal.pone.0018670
Lopes, J. E., Torgerson, T. R., Schubert, L. A., Anover, S. D., Ocheltree, E. L., Ochs, H. D., and Ziegler, S. F. (2006). Analysis of FOXP3 reveals multiple domains required for its function as a transcriptional repressor. J. Immunol. 177, 3133–3142.
Lupas, A., Van Dyke, M., and Stock, J. (1991). Predicting coiled coils from protein sequences. Science 252, 1162–1164.
Macdonald, T. T., and Monteleone, G. (2005). Immunity, inflammation, and allergy in the gut. Science 307, 1920–1925.
Miller, W., Rosenbloom, K., Hardison, R. C., Hou, M., Taylor, J., Raney, B., Burhans, R., King, D. C., Baertsch, R., Blankenberg, D., Kosakovsky Pond, S. L., Nekrutenko, A., Giardine, B., Harris, R. S., Tyekucheva, S., Diekhans, M., Pringle, T. H., Murphy, W. J., Lesk, A., Weinstock, G. M., Lindblad-Toh, K., Gibbs, R. A., Lander, E. S., Siepel, A., Haussler, D., and Kent, W. J. (2007). 28-Way vertebrate alignment and conservation track in the UCSC genome browser. Genome Res. 17, 1797–1808.
Mottet, C., Uhlig, H. H., and Powrie, F. (2003). Cutting edge: cure of colitis by CD4+CD25+ regulatory T cells. J. Immunol. 170, 3939–3943.
Pan, F., Yu, H., Dang, E. V., Barbi, J., Pan, X., Grosso, J. F., Jinasena, D., Sharma, S. M., McCadden, E. M., Getnet, D., Drake, C. G., Liu, J. O., Ostrowski, M. C., and Pardoll, D. M. (2009). Eos mediates Foxp3-dependent gene silencing in CD4+ regulatory T cells. Science 325, 1142–1146.
Pancer, Z., and Cooper, M. D. (2006). The evolution of adaptive immunity. Annu. Rev. Immunol. 24, 497–518.
Pond, S. L., and Frost, S. D. (2005). Datamonkey: rapid detection of selective pressure on individual sites of codon alignments. Bioinformatics 21, 2531–2533.
Quintana, F. J., Iglesias, A. H., Farez, M. F., Caccamo, M., Burns, E. J., Kassam, N., Oukka, M., and Weiner, H. L. (2010). Adaptive autoimmunity and Foxp3-based immunoregulation in zebrafish. PLoS ONE 5, e9478. doi: 10.1371/journal.pone.0009478
Rice, P., Longden, I., and Bleasby, A. (2000). EMBOSS: the European molecular biology open software suite. Trends Genet. 16, 276–277.
Rowe, J. H., Ertelt, J. M., Aguilera, M. N., Farrar, M. A., and Way, S. S. (2011). Foxp3(+) regulatory T cell expansion required for sustaining pregnancy compromises host defense against prenatal bacterial pathogens. Cell Host Microbe 10, 54–64.
Sakaguchi, S. (2004). Naturally arising CD4+ regulatory t cells for immunologic self-tolerance and negative control of immune responses. Annu. Rev. Immunol. 22, 531–562.
Schultz, J., Milpetz, F., Bork, P., and Ponting, C. P. (1998). SMART, a simple modular architecture research tool: identification of signaling domains. Proc. Natl. Acad. Sci. U.S.A. 95, 5857–5864.
Schwartz, S., Kent, W. J., Smit, A., Zhang, Z., Baertsch, R., Hardison, R. C., Haussler, D., and Miller, W. (2003). Human-mouse alignments with BLASTZ. Genome Res. 13, 103–107.
Schwartz, S., Zhang, Z., Frazer, K. A., Smit, A., Riemer, C., Bouck, J., Gibbs, R., Hardison, R., and Miller, W. (2000). PipMaker – a web server for aligning two genomic DNA sequences. Genome Res. 10, 577–586.
Schwede, T., Kopp, J., Guex, N., and Peitsch, M. C. (2003). SWISS-MODEL: an automated protein homology-modeling server. Nucleic Acids Res. 31, 3381–3385.
Stroud, J. C., Wu, Y., Bates, D. L., Han, A., Nowick, K., Paabo, S., Tong, H., and Chen, L. (2006). Structure of the forkhead domain of FOXP2 bound to DNA. Structure 14, 159–166.
Wen, Y., Fang, W., Xiang, L. X., Pan, R. L., and Shao, J. Z. (2011). Identification of Treg-Like Cells in Tetraodon: Insight into the Origin of Regulatory T Subsets during Early Vertebrate Evolution. Hangzhou: College of Life Sciences, Zhejiang University.
Woodburne, M. O., Rich, T. H., and Springer, M. S. (2003). The evolution of tribospheny and the antiquity of mammalian clades. Mol. Phylogenet. Evol. 28, 360–385.
Wu, Y., Borde, M., Heissmeyer, V., Feuerer, M., Lapan, A. D., Stroud, J. C., Bates, D. L., Guo, L., Han, A., Ziegler, S. F., Mathis, D., Benoist, C., Chen, L., and Rao, A. (2006). FOXP3 controls regulatory T cell function through cooperation with NFAT. Cell 126, 375–387.
Zhou, L., Lopes, J. E., Chong, M. M., Ivanov, I. I., Min, R., Victora, G. D., Shen, Y., Du, J., Rubtsov, Y. P., Rudensky, A. Y., Ziegler, S. F., and Littman, D. R. (2008). TGF-beta-induced Foxp3 inhibits T(H)17 cell differentiation by antagonizing RORgammat function. Nature 453, 236–240.
Keywords: regulatory T cell, Foxp3, evolution of immune system, lineage commitment, comparative genomics
Citation: Andersen KG, Nissen JK and Betz AG (2012) Comparative genomics reveals key gain-of-function events in Foxp3 during regulatory T cell evolution. Front. Immun. 3:113. doi: 10.3389/fimmu.2012.00113
Received: 27 March 2012; Paper pending published: 06 April 2012;
Accepted: 20 April 2012; Published online: 10 May 2012.
Edited by:
Luis Graca, University of Lisbon, PortugalReviewed by:
Jocelyne Demengeot, Instituto Gulbenkian de Ciencia, PortugalAntonio Freitas, Institut Pasteur, France
Peter John Lane, Birmingham University, UK
Copyright: © 2012 Andersen, Nissen and Betz. This is an open-access article distributed under the terms of the Creative Commons Attribution Non Commercial License, which permits non-commercial use, distribution, and reproduction in other forums, provided the original authors and source are credited.
*Correspondence: Kristian G. Andersen, Department of Organismic and Evolutionary Biology, FAS Center for Systems Biology, Harvard University, Cambridge, MA 02138, USA. e-mail: kandersen@oeb.harvard.edu; Alexander G. Betz, Medical Research Council, Laboratory of Molecular Biology, Cambridge CB2 0QH, UK. e-mail: betz@mrc-lmb.cam.ac.uk