 Matías Sáenz-Cuesta1,2
 Ander Arbelaiz3,4Amaia Oregi1
 Haritz Irizar1,2
 Iñaki Osorio-Querejeta1,2Maider Muñoz-Culla1,2
 Jesus M. Banales3,4,5,6,7
 Juan M. Falcón-Pérez5,6,8
 Javier Olascoaga1,2,9
 David Otaegui1,2*
- 1Multiple Sclerosis Unit, Neuroscience Area, Biodonostia Health Research Institute, San Sebastián, Spain
- 2Spanish Network on Multiple Sclerosis, Madrid, Spain
- 3Department of Liver and Gastrointestinal Diseases, Biodonostia Health Research Institute, Donostia University Hospital, San Sebastián, Spain
- 4University of the Basque Country, San Sebastián, Spain
- 5National Institute for the Study of Liver and Gastrointestinal Diseases (CIBERehd, Instituto de Salud Carlos III), Madrid, Spain
- 6Ikerbasque - Basque Foundation for Science, Bilbao, Spain
- 7Asociación Española Contra el Cáncer, Madrid, Spain
- 8Metabolomics Unit, CIC bioGUNE, Derio, Spain
- 9Department of Neurology, Donostia University Hospital, San Sebastián, Spain
The research in extracellular vesicles (EVs) has been rising during the last decade. However, there is no clear consensus on the most accurate protocol to isolate and analyze them. Besides, most of the current protocols are difficult to implement in a hospital setting due to being very time-consuming or to requirements of specific infrastructure. Thus, our aim is to compare five different protocols (comprising two different medium-speed differential centrifugation protocols; commercially polymeric precipitation – exoquick – acid precipitation; and ultracentrifugation) for blood and urine samples to determine the most suitable one for the isolation of EVs. Nanoparticle tracking analysis, flow cytometry, western blot (WB), electronic microscopy, and spectrophotometry were used to characterize basic aspects of EVs such as concentration, size distribution, cell-origin and transmembrane markers, and RNA concentration. The highest EV concentrations were obtained using the exoquick protocol, followed by both differential centrifugation protocols, while the ultracentrifugation and acid-precipitation protocols yielded considerably lower EV concentrations. The five protocols isolated EVs of similar characteristics regarding markers and RNA concentration; however, standard protocol recovered only small EVs. EV isolated with exoquick presented difficult to be analyzed with WB. The RNA concentrations obtained from urine-derived EVs were similar to those obtained from blood-derived ones, despite the urine EV concentration being 10–20 times lower. We consider that a medium-speed differential centrifugation could be suitable to be applied in a hospital setting as it requires the simplest infrastructure and recovers higher concentration of EV than standard protocol. A workflow from sampling to characterization of EVs is proposed.
Introduction
Extracellular vesicles (EVs) are membrane-bound particles shed from almost all cell types, carrying components from the cell donor such as lipids, proteins, RNA, glycolipids, and metabolites (1). It has been suggested that they play several biological roles like, for example, antigen presentation without cell contact (2), microenvironment modification, and distant cell education (3), roles that have been encompassed under the term “cell-to-cell contact-free communication”. In turn, their biological functions have been related to many pathophysiological processes, the most studied being cancer (4), immune-mediated diseases (5), and cardiovascular disorders (6).
A widespread concern in the biomedical research community is the gap between the basic research carried out in the laboratories and the clinical setting where the new biological information should have a direct impact. Many researchers have directed their efforts toward bridging that gap and look for ways to translate lab findings into clinical solutions, emerging therefore the translational research. The translational research on EVs is not foreign to this goal: the current knowledge about EVs, mostly developed in vitro, has been proposed to be applied in a daily hospital routine giving answers to specific health queries (7–13). This possible application ranges from diagnostic to therapeutic objectives, including disease monitoring and the search of prognostic biomarkers, among others. But are the hospitals technologically prepared to employ EVs studies routinely?
The main steps for studying EVs and applying the results involve sampling (blood, urine, saliva, cerebrospinal fluid, joint fluid, breast milk, ascitic fluid, etc.) and isolation, to be afterward characterized and analyzed their cargo and, finally, give a potential clinical interpretation and application. Concerning the first steps, sampling and pre-analytical parameters have been widely studied and are close to reach a consensus (14, 15). However, isolation is still a critical step due to several reasons. First, the methods to isolate EVs are currently highly diverse [reviewed by Momen-Heravi et al. (16) and Witwer et al. (17)] and depending on which one is employed, the results can be considerably different, even having started from the same sample. At the moment, most of them are based on EV density, including differential centrifugation steps from low speeds (1,500 × g) to ultracentrifugation (>100,000 × g), combined or not with density gradient and/or filtration. Precipitation using polymers and immunoaffinity agglutination are also widely used. Recently, the size-exclusion chromatography (18) and chip devices (19) have been added to the rest of methods. All of them, either by themselves or in combination, yield a solution enriched in EVs in different extents. Finally, depending on several factors such as time consumption, cost, friendly use, and reproducibility, these methods are or not able to be applied in a daily clinical routine. Despite lots of important works shedding light on this field, there is still a lack of consensus (20) evidencing the urgent need of standardized protocols appropriate for hospitals.
Considering the problems and needs regarding the use of EVs in a clinical setting, we established the following objectives for the present study: to compare several protocols for EVs isolation and to analyze which of them could be the most suitable one to be used in daily clinical setting.
Material and Methods
Blood and urine are the most widely used samples in a hospital setting, as they provide useful information and they are easy to obtain with minimally invasive techniques. Thus, we decided to isolate EVs from these biofluids as the starting point for EV isolation.
Samples were collected from 10 healthy individuals (5 males and 5 females; average age = 37 ± 8 years old) and stored according to the criteria of the Donostia node of the Basque Biobank. All subjects gave written informed consent and the study was approved by the Hospital Ethics Committee.
Donors underwent a questionnaire about recent exercising (within the last hour), drugs/medication intake, ovulatory cycle, acute illness, and sleeping hours.
The workflow followed in the present work is summarized in Figure 1.
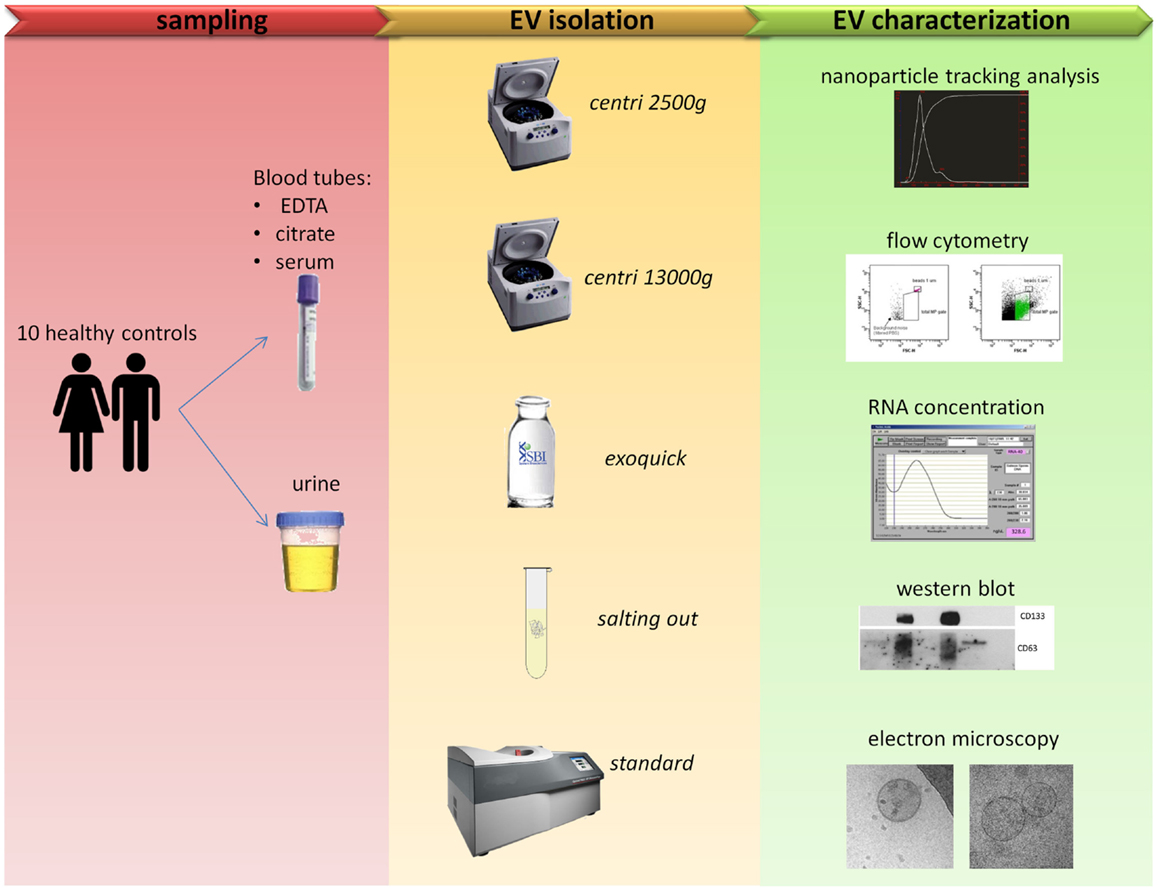
Figure 1. Comparison of five protocols for EVs isolation. Blood and urine samples were isolated with five different protocols (see Table 1 for more details) and then characterized with five outputs methods.
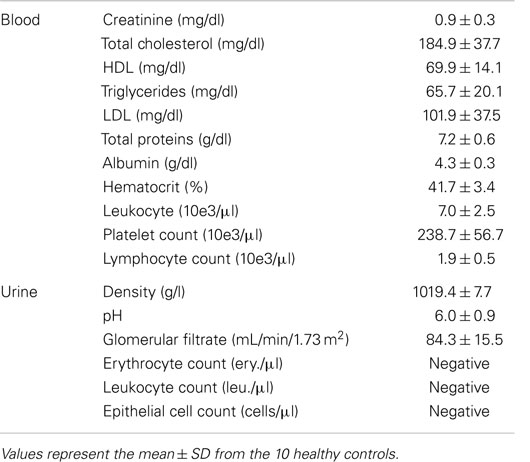
Table 1. Lab parameters analyzed in blood and urine samples.
Blood
Peripheral blood samples were collected at the Donostia University Hospital at 8:30 a.m. on fasting and were processed separately (without pooling them) within the first hour. After discarding the first milliliter, blood collection was done by venipuncture with a 21-gage needle in a 10-ml EDTA tube, a 3.8-ml citrate tube, and a 8-ml serum tube [Vacutainer, Becton Dickinson (BD)], kept upright and centrifuged at 2,500 × g during 15 min. The supernatant was recovered to obtain platelet-poor plasma (PPP) or platelet-poor serum, being these samples the starting point for all the protocols. Besides, additional blood samples were collected in EDTA and serum tubes to perform a hemogram and obtain protein and lipid profiles in the core laboratory of the Hospital. The parameters tested are shown in Table 1.
Although we collected plasma and serum from peripheral blood, the present work is focused on plasma. In this sense, we are going to refer only to plasma in all the sections of “Materials and Methods” for the sake of simplicity. The results and discussion of blood-derived EVs will be also centered on plasma and only relevant results will be presented in the case of serum.
Urine
Sixty milliliter-first void of the day was collected in aseptic conditions by each individual at home, kept at 4°C until their processing with an average time of 2.7 h between collection and processing. Ten milliliters were sent to the core laboratory for the analysis of the most common urine parameters (Table 1). The rest was aliquoted in five tubes of 10 ml and centrifuged at 2,500 × g for 15 min in order to obtain cell-free urine (CFU).
EV isolation protocols
The protocols described below are summarized in Table 2.

Table 2. EV isolation methods compared in this work.
Centri2500. This method is based on the protocol published by Lacroix and colleagues (14). Briefly, 1.3 ml of PPP or 9.5 ml of CFU obtained at the first centrifugation are centrifuged again at 2,500 × g during 15 min to get 1 ml of platelet-free plasma (PFP) or 9 ml of debris-free urine (DFU). Both PFP and DFU samples were stored at −80°C for later use. When needed, samples were thawed on ice and centrifuged once again at 20,000 × g during 20 min to pellet the EVs, discarding 900 μl of supernatant, following the protocols described by Ashcroft and colleagues (21) and Jayachandran and colleagues (22). The pellet containing the EVs was resuspended in 100 μl of PBS (GIBCO, Life Technologies) filtered twice through a 0.22 μm-pore filter.
Centri13000. This method is based on the protocol published by Dey-Hazra and colleagues (23) and Dignat-George and colleagues (24). In brief, it is a modification of the previous method where the second centrifugation performed on the 1.3 ml of PPP was done at 13,000 during 2 min to obtain PFP or DFU. The rest of the protocol was the same as the previous one. To note, this protocol was not performed for urine samples.
Exoquick. The basis for this method lays on the precipitation of EVs using a commercial agglutinating agent and was performed following the manufacturer’s instructions. In summary, 63 μl or 2 ml of exoquick TC (System Biosciences) were added either to 250 μl of PPP or to 9.5 ml of CFU, respectively, and the mix was incubated overnight at 4°C with no rotation. Then, two centrifugation steps were performed at 1,500 × g for 30 and 5 min, respectively, to sediment the EVs and the pellet was resuspended in 200 μl of PBS. It needs to be noted that, although the first versions of the manufacturer’s instructions included a filtering step using a 0.45 μm-pore filter, it was removed in the latest version and, thus, it has not been included in our protocol.
Salting out. This method has been adapted from the protocol recently published by Brownlee and colleagues (25) and it is based on the precipitation of EVs through an aggregate of sodium acetate 1 M, ph 4.75. A centrifugation was performed on 1.3 ml of PPP or 9.5 ml of DFU at 13,000 × g for 30 min; we collected the supernatant (1 ml of PPP or 9 ml of DFU), added sodium acetate (dilution 1/10), and incubated on ice for 60 min and, subsequently at 37°C for 5 min. The dilution was then centrifuged at 5,000 × g during 10 min and the resulting pellet was washed with a buffer with sodium acetate at 0.1 M to be finally resuspended in 200 μl of PBS.
Standard. This is the method considered as the standard isolation protocol nowadays (26). The starting point was 1.3 ml of PPP or 9.5 ml of CFU that were filtered through a 0.22 μm-pore filter and centrifuged at 10,000 × g during 30 min to obtain either PFP or DFU. These were ultracentrifuged at 100,000 × g in an Optima MAX tabletop centrifuge (Beckman Coulter) during 75 min. The resulting EV pellet was resuspended in 200 μl of filtered PBS.
EV detection and characterization methods
Nanoparticle tracking analysis. The size distribution and concentration of EVs were measured using a NanoSight LM10 machine (NanoSight). All the parameters of the analysis were set at the same values for all samples and 1 min-long videos were recorded in all cases. Background was measured by testing filtered PBS, which revealed no signal. The EVs obtained from PFP (5 μl) were diluted with filtered PBS to 1:150 and the ones obtained from DFU (5 μl) to 1:50. For each sample, two measurements were performed. It is necessary for a minimum of 200 tracks (movements of single particles recorded by a camera) to obtain valid results. The following parameters were measured: the mean and mode of the size distribution and the concentration of EVs (27).
Flow cytometry. The labeling and gating of EVs were performed as described by Sáenz-Cuesta and colleagues (28). Briefly, 4 μl of CD61-PE (Cytgonos) or CD45-PE (BD) monoclonal antibodies were mixed with 40 μl of resuspended EVs and incubated for 20 min. Next, labeled EVs were washed once with 300 μl of filtered PBS, resuspended in further 200 μl of filtered PBS and acquired at low rate in a FACS Canto II flow cytometer (BD). Side and forward scatter were measured on a logarithmic scale with the threshold set at 300 for each parameter to avoid instrument noise (background signal). Then, the lower limit was defined with the exclusion of background noise given by the signal of PBS filtered twice. To define the upper limit of the total MP gate, 1-μm non-labeled polystyrene latex beads were used (Sigma-Aldrich). The events that appeared in this region were included in the total EV count and were further analyzed for specific labeling (positive for PE marker). We defined CD61+ EVs as platelet-derived EVs (PEV) and CD45+ EVs as leukocyte-derived EVs (LEV). The total and cellular origin-specific EV concentrations were obtained using Trucount™ tubes [BD; Ref. (28)].
Western blot. Primary CD133 (Miltenyi Biotec S. L) and CD63 (Santa Cruz Biotechnology, Inc.) antibodies were used to study specific EV transmembrane markers. Mouse and rabbit HRP-conjugated antibodies (Cell Signaling) were employed as secondary antibodies. All protein procedures were done at non-reducing conditions. Samples (10 μl of PBS-resuspended EVs) were incubated at 95°C for 5 min, separated in SDS polyacrilamide gels, and transferred to nitrocellulose membranes (GE Healthcare). Membranes were blocked for 1 h at room temperature with 5% milk (w/v) in TBS solution with 0.1% Tween-20 (T-TBS) and incubated in the same solution with primary antibodies overnight at 4°C. Primary antibodies were washed with the T-TBS solution and incubation with secondary HRP-conjugated antibodies was performed at room temperature for 1 h in the same solution used for the primary antibodies. After washing with T-TBS solution, the HRP signal was detected by a chemiluminiscent reaction with the SuperSignal West Dura Extended Duration Substrate (Thermo Fisher Scientific, Inc.).
RNA isolation. A 185 μl-aliquot of resuspended EVs was used to extract total RNA with the miRNeasy serum/plasma kit (Qiagen). RNA concentration was measured with the nanodrop 1000 spectrophotometer (Thermo Scientific).
Cryo-electron microscopy. The cryo-electron microscopy (EM) was performed following the protocol used by Perez and colleagues (29). Briefly, 10 μl of EV preparations were directly adsorbed onto glow-discharged holey carbon grids (QUANTIFOIL Micro Tools GmbH). Grids were blotted at 95% of humidity and rapidly plunged into liquid ethane with the aid of VITROBOT (Maastricht Instruments B). Vitrified samples were imaged at liquid nitrogen temperature using a JEM-2200FS/CR transmission cryo-electron microscope (JEOL) equipped with a field emission gun and operated at an acceleration voltage of 200 kV.
Statistical analysis
The statistical analysis was performed with PASW Statistics v18.0 (SPSS Inc.). Kolmogorov–Smirnov and Shapiro–Wilk tests were used to check normality of distributions. As all of the variables were shown to follow a normal distribution, T-tests were applied to assess differences between the groups. Pearson’s R correlations were computed to explore the relations between lab parameters and some EV parameters. Both differences between groups and correlations between variables were considered significant when p < 0.05.
Results
Blood
EV concentration
Extracellular vesicles concentration was measured using two independent methods: nanoparticle tracking analysis (NTA) and conventional flow cytometry (FC). It is to be noted that the lower detection limits are different, being 50 nm for NTA (27) and around 400 nm for FC (30).
Nanoparticle tracking analysis
When using NTA, the software requires a minimum of 200 tracks during the capture time of the video. In the case of the samples processed with the salting out and standard methods, only few of them reached that minimum. This was critical for NTA analysis causing a high variability on these samples (Figures 2A,E). The exoquick method yielded higher EV concentration values than any other method used. We obtained four times higher EV concentration with exoquick than with centri2500 (p = 0.007) and centri13000 (p = 0.05) and 23 times higher concentration values comparing to salting out (p = 0.002) and standard (p = 0.002) methods (Figure 2A). No significant differences have been found either between the EV concentrations obtained with the centri2500 and centri13000 methods, or between those yielded by the standard and the salting out methods. However, there are significant differences between these two groups of methods (Figure 2A) obtaining a p value of <0.001 for both centri2500 vs. salting out and standard and 0.002 and <0.001 for centri13000 vs. salting out and standard respectively. Regarding the EVs isolated from serum, they were obtained using the exoquick, centri13000, and standard protocols and we have observed that, as it happens with plasma, the exoquick method yields significantly higher EV concentrations than the other two methods. When we compared serum and plasma considering all isolation methods, 3.4 times higher EV concentrations have been observed for serum using exoquick and 1.3 times higher ones when using centri13000, but these comparison did not reach statistical significance (see Table S1 in Supplementary Material).
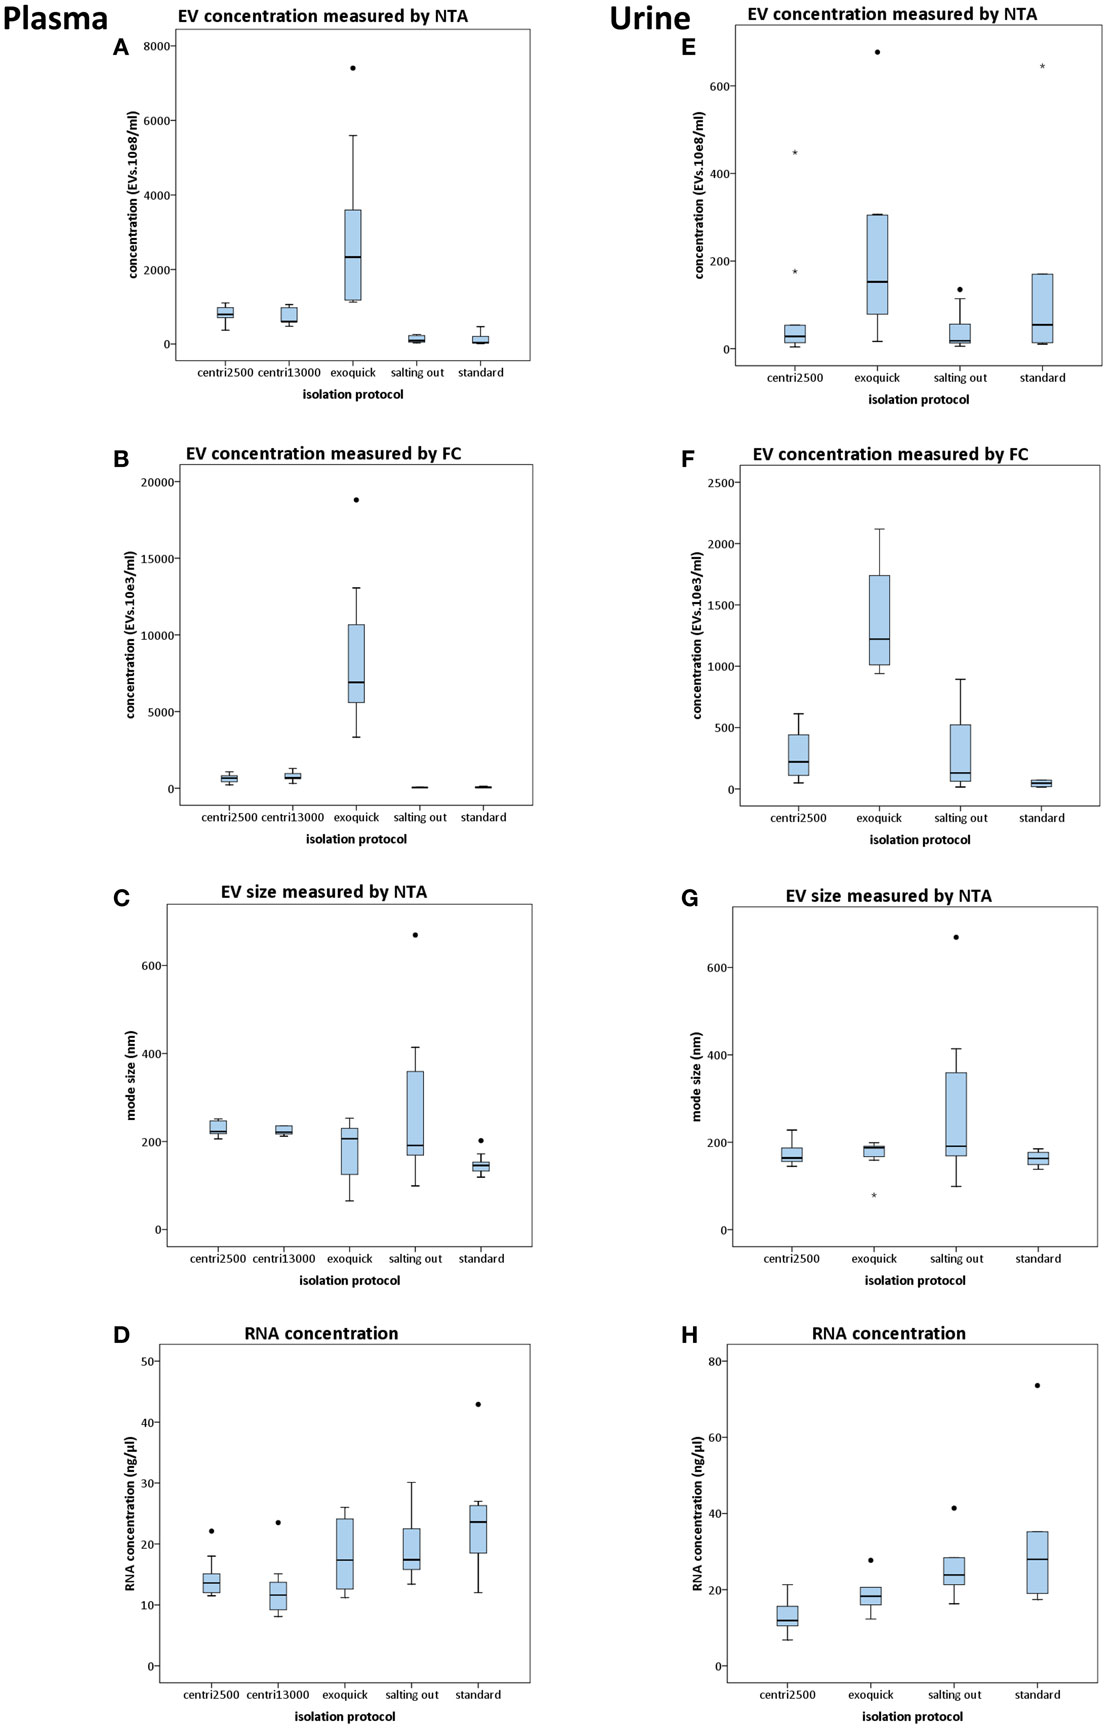
Figure 2. Results of the comparison of five protocols for isolation of EVs. Box plots show EV concentration measured by nanoparticle tracking analysis [NTA; (A,E)] or conventional flow cytometry [FC; (B,F)], EV size distribution measured by NTA (C,G), and concentration of RNA yielded from EVs (D,H). In the left column, the results from plasma-derived EVs are shown and in the right column those from urine. For statistical significance, see text. All bars represent mean values with SD except for size plots (C,G) that bars indicate mode with SD.
Flow cytometry. Although the EV concentrations obtained using FC were lower than those obtained by NTA, there was good correlation between the concentration profiles yielded by each approach when using the averages for each isolation method for the comparison (R = 0.99; p < 0.001). Nevertheless, no significant correlations were observed when performing the analysis for each isolation method separately. Besides, significant differences were observed between all isolation methods except for centri2500 vs. centri13000 and salting out vs. standard (Figure 2B).
EV size
There is great similarity between the modes of EV size obtained with the different isolation protocols ranging from 150 to 277 nm, average of mode size: 228 nm (Figure 2C). In accordance to these results, the EM images show EVs with a size between 100 and 200 nm (Figure 3A). Significant differences in size only exist between the EVs isolated with the standard method when compared to those obtained through the centri2500 and centri13000 methods, being the former the smallest of all at 158.7 nm. Besides, the EM images of the EVs obtained with exoquick present several filamentous aggregates and other globular structures not considered EVs.
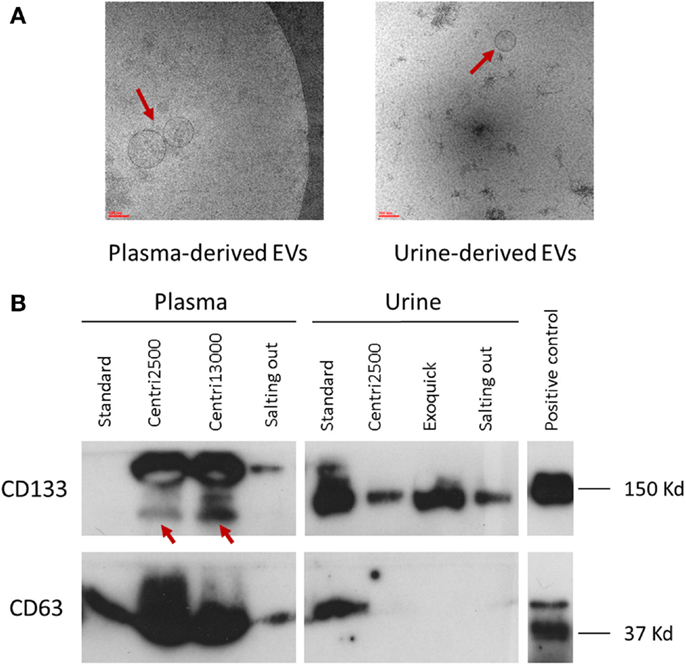
Figure 3. Characterization of EVs. (A) Two images of electronic microscopy of EVs (pointed with red arrows) derived from plasma and urine. Scale bar represents 100 nm. To note, in the image of urine-derived EVs, it is observed contaminants not seen in the plasma-derived one. (B) Western blot analysis using the specific EV markers CD133 and CD63. In CD133 plasma samples, the specific bands are pointed with red arrows. Positive control was performed with NHC-2 p10 cell line.
RNA concentration in EVs
Despite the salting out and the standard methods being the ones that yield the lowest EV concentrations, the highest RNA concentrations have been obtained through these methods (19.5 ± 5.7 and 23.6 ± 8.2 ng/μl, respectively), higher than with the centri2500 and centri13000 methods (14.5 ± 3.3 and 12.5 ± 4.5 ng/μl, respectively). It is remarkable that exoquick yields 18.1 ± 6.0 ng/μl of RNA, despite having isolated around 23 times more EVs than the salting out and standard methods (Figure 2D).
Western blot
The detection of EV markers through western blot (WB) was used as a confirmation of the presence of EVs in the solutions obtained at the end of the isolation protocols. The objective was not to perform a detailed characterization of the markers, but to look for differences in their detection between the different methods.
Great inter-method variability has been observed. Briefly, CD63 detection is better in EVs isolated from plasma than in those obtained from serum. Among the plasma-derived EVs, CD133 showed better signal for centri2500 and centri13000 than for the salting out and the standard protocols. The detection of CD133 was also worse in serum-derived sample than in plasma-derived samples. Nonetheless, CD133 detection was better in urine-derived EVs than in the samples obtained from blood (Figure 3B). It is of note that the EVs isolated with exoquick could not be used for WB marker analysis using plasma samples due to be impossible to dissolve its pellet.
Urine
EV concentration
In the NTA analysis of the EVs isolated from urine, we have observed that the concentrations were as low as the great majority of the samples have not reached the minimum track-count. Thus, once again the interpretation of NTA data from urine-derived EVs was carried out with caution. Exoquick was the method that yields the highest EV concentrations from urine using either NTA or FC, followed by the standard protocol. The centri2500 and salting out protocols yielded very similar concentrations. Figures 2E,F summarizes the EV concentration results from the application of the different protocols to urine as measured by NTA and FC, respectively (for p values, please see Table S1 in Supplementary Material). In summary, using both NTA and FC, we obtained a similar concentration profile to that of blood but with 10–20 times lower concentrations.
EVs size
The modes of the size distributions obtained with the different protocols were similar and, the average of these modes (207 nm) was similar to that achieved in blood samples (228 nm). As it happened with blood samples, the smaller EVs were isolated with the standard method (162.5 nm) comparing to the other protocols (Figure 2G). The results of the size assessed by NTA were, once again, consistent with the observations done using EM. In most of these urine samples, the number of contaminating particles that could not be considered EVs was higher than in blood (Figure 3A).
RNA concentration in EVs
Higher RNA concentrations were obtained from EVs isolated with the standard (33 ng/μl) and salting out (25.9 ng/μl) methods and even higher than the concentrations obtained from blood samples, where the EV concentration was from 10 to 20 times higher than in urine (Figure 2H).
Western blot
The EV samples isolated from urine using exoquick, in contrast to the ones isolated from plasma, can be used for marker analysis with WB (Figure 3B).
In brief, CD133 detection in urine-derived samples is better with precipitant agents (exoquick and salting out methods) than with centrifugation methods, although the standard shows better results in urine and serum than in plasma. On the opposite, CD63 signal is weak in urine-derived samples compared to that of plasma- or serum-derived samples for all methods.
Correlation with Laboratory Parameters
We have also tested whether the EV concentration values obtained with different methods and the different types of samples (plasma, serum, or urine) could be reflected in some of the lab parameters measured in blood and urine, especially the ones that are related to the main components of EVs, i.e., lipids and proteins. Furthermore, the analysis of these correlations would serve to test a possible interference in EV quantification produced by these parameters, a phenomenon that has been previously described (31).
Interestingly, a significant correlation has been observed between the concentration, as measured by NTA, of the EVs isolated from plasma with the centri13000 method and the total cholesterol (R = 0.953; p = 0.003) and LDL concentrations (R = 0.935; p = 0.006) in blood. We have also detected a significant correlation between the NTA-measured concentration of the plasma-derived EVs isolated using the standard method and the concentration of triglycerides in blood (R = 0.789; p = 0.007).
No significant correlation has been found between the concentrations of the EVs of specific cell-origins and the concentrations of the respective source cells in blood. The concentrations of CD61+ (platelet origin) or CD45+ (leukocyte origin) EVs are plotted in Figure S1 in Supplementary Material.
In regard to the EVs isolated from urine, the only significant correlation we have observed is the one between the density of urine and concentration of EVs, measured with both NTA and FC, isolated with the salting out protocol (R = 0.841; p = 0.002 for NTA and R = 1.000; p = > 0.001 for FC).
Discussion
In the present work, we have studied and compared several widely used methods for the isolation of EVs, including differential centrifugation, agglutination, precipitation, and the one considered the standard that includes ultracentrifugation (plus filter). All methods under study can be applied using relatively simple technology, with the exception of ultracentrifugation, which must be performed with an instrumentation that, even if it is easy to use, is not usually found in most hospital laboratories. The election of one or other method as the most suitable one to be used in a hospital setting greatly depends on the goals to be reached with the method, which could be, among others: to maximize the final EV concentration, to obtain high levels of purity as measured by markers and several classical characteristics of EVs, to select one of the three fundamental types of EVs (exosomes, microvesicles, and apoptotic bodies) or to get the less time and/or money consuming protocol. We have set the first two as preferential aims, leaving the rest out of the scope of this work.
Isolating EVs
We have observed that, besides being the method that can be implemented most easily (it is quick and relies on very little technology), exoquick is also the method that yields, in a statistically significant manner, the highest concentration of EVs (as measured by NTA and FC) compared to the other four isolation protocols. The EV quantity is even higher when using serum as the starting sample. On top of that, to dissolve the pellet obtained using exoquick from serum-derived samples is notably easier than plasma-derived samples. Nonetheless, the considerably higher EV concentrations obtained with exoquick (23 times higher than those obtained with the standard protocol) could be linked to the aggregation and precipitation of other elements in suspension in the sample that are not necessarily EVs; as it can be observed in the images obtained by EM. Taylor and colleagues (32) demonstrated that using exoquick more EVs are isolated than using ultracentrifugation (standard), chromatography, and magnetic beads, and with a higher purity of exosomal RNA and proteins. Our results only partially coincide with the observations of Taylor and colleagues, as the RNA concentration we obtained with exoquick is lower than that yielded by the standard method. In another study that compared the exoquick method with the standard method, the authors concluded that a combination of these two methods is the protocol that yields the highest EV counts, although exosomes of higher quality were obtained combining the standard method with the sucrose density gradient (33). Yet, Exoquick is the most expensive of the methods used in the present work.
The differences in EV concentration between the two centrifugation methods (centri2500 and centri13000) are not statistically significant. The sole differences are that the cluster of EVs observed by FC in the FSC/SSC dotplot shows less debris around in the case of centri13000 and that the EVs isolated with this method also show a stronger labeling of CD63 in WB. The conclusions reached at the workshop of the Scientific and Standardization Committee of the International Society of Thrombosis and Hemostasis to promote the use of these protocols (15) and aimed to reducing the variability due to a resuspension of the pellet (24). Nonetheless, in our opinion, the main drawback of this proposal is that, as the EVs are not concentrated in a pellet–like, we performed with the final centrifugation at 20,000 × g, a pellet-washing step cannot be introduced and EVs are maintained in dissolution along with many other contaminating particles such as protein aggregates. Regarding size, very similar EV sizes have been obtained with these two methods, even when measuring size on EM imagery. These suggest that the second centrifugation is probably not that critical and could vary, at least between 2,500 and 13,000 × g, with the objective of eliminating cell debris. Moreover, these methods collect six times higher EV concentrations than the standard protocols, what can be explained by the fact that they are less restrictive methods. Finally, the technical requirements for the use of these methods are usually met in most basic research laboratories and they are considerably less time-consuming than the standard method.
Ultracentrifugation is nowadays the “gold standard” method for the isolation of EVs, fundamentally exosomes. With the aim of finding alternative methods to this protocol, Brownlee and colleagues (25) have recently described a new method called salting out, based on the precipitation of EVs using the aggregate of acetic acid. In the present study, the salting out method yielded the lowest EV concentrations when compared to the other protocols, although showing similar values to those obtained with the standard method as the authors of the aforementioned article also pointed. It has to be noted, though, that Brownlee and colleagues isolated EVs from cell culture supernatants and, thus, comparisons with the present work must be done with caution.
Although out of the main objectives of this work, we have also compared the EVs isolated from three different types of samples: plasma, serum, and urine. We have observed that higher concentrations of EVs are obtained from serum than from plasma for all methods, and 10–20 times more, depending on the method, when comparing plasma with urine. As comparisons between serum and plasma have been performed by other authors (34, 35), we just present our results.
The EV size distributions that we have obtained with the exoquick, salting out, centri2500, and centri13000 methods are very similar, being the EVs with a size below 200 nm the most abundant. Nevertheless, a cluster of EVs can be observed with a size around 500–600 nm that could represent the population of microparticles. On the contrary, the standard method isolates smaller EVs as it uses a 0.22 μm-pore filter leaving out the bigger EVs (microparticles and apoptotic bodies). We agree with Jy and colleagues (36) that the capacity of the first four methods to isolate the bigger EVs can be useful when applying these protocols in clinical practice.
In the case of urine, very low EV concentrations have been obtained with the five methods and, thus, we recommend not to dilute or to dilute very little urine-derived samples before analyzing them by NTA, FC, and WB. Once again, exoquick was the method that yields the highest concentrations according to other authors’ results (37). Certainly, when using urine samples, it would be of great consequence to avoid contaminating proteins such as Tamm–Horsfall, which traps EVs but it can be removed with the simple addition of dithiothreitol and heat (38). Furthermore, Rood et al. (18) suggest that the most effective method in terms of purity for urine-derived EVs to undergo downstream proteomic analysis is the combination of ultracentrifugation followed by size-exclusion chromatography. The major disadvantage of this protocol would be that it is time-consuming and it requires of specific infrastructure that make it difficult to be compatible with clinical applications.
Detecting and Characterizing EVs
During the processing, after the centrifugation at 20,000 × g for 20 min, a fine lipidic layer could be observed in some of the samples. This corresponded to a FC image with a higher EV density (data not shown). Nevertheless, the presence of this layer did not show correlation with NTA results. It is well known that the density and size of the EVs can overlap with these of lipoproteins and this can produce artifactual results in FC analyses (31). Besides, we have found positive correlation between the LDL levels in blood and the concentration of EVs obtained with several methods, which suggests that, when isolating the EVs, some LDL particles are also dragged and counted as EVs. One approach to measure the purity of EVs is the EV/protein ratio (39), a method that is easy to use and yield reproducible results. However, it remains out of the scope of the present work.
The most widely used methods for the quantification of EVs are NTA and FC. According to our data, the results yielded by these two methods are not interchangeable, probably because the size ranges that they can analyze are different. The correlation between the two methods would be better studied using only the concentration of EVs larger than 400 nm, as this is the minimum size for the FC analysis. Nevertheless, we have looked for correlation using concentration results for EVs larger than 400 nm in another dataset (data not shown) and we have found none. Thus, we consider that these two quantification methods do not exclude each other but are complementary, as NTA gives more accurate counts but FC allows the characterization of distinct cellular origins.
From the comparison of the methods that we have used to study the size of EVs, we can conclude that, while the NTA, as it allows to recover information from individual particles, allows to obtain and compare size distributions, EM provides more robust information on the characteristics of EVs but size distributions cannot be obtained through EM imagery. Furthermore, NTA has the advantage of performing a multiple analysis in few minutes.
Tetraspanins have been widely used as general markers of EVs; however, during the last years, some works have provided evidence that not all vesicles express them at the same levels suggesting that different EV subsets could coexist in the same pellet (40, 41). In the case of urine-derived EVs, our results present low or undetectable levels of CD63 except for those obtained with the standard protocol (Figure 3B). Both the previously described lack of CD63 in urine-derived EVs larger than 100 nm (42) and its expression in EVs obtained with the standard protocol (43, 44) are congruent with our results. In the other hand, we found expression of CD133 with all the methods. In agreement with other authors, we concluded that the presence of CD133+/CD63− EVs demonstrate the recovery of the large ones that usually express this pattern of markers (45–47). Moreover, Bobrie and colleagues described the CD63 as a variable marker found only in a fraction of the sucrose gradient (40), which implies questioning the use of CD63 as a standard EV marker (48). Finally, the expression of CD63 is susceptible to SCORT regulation leading to the blockage of the budding of this EV subset (49) and this mechanism could hypothetically be more frequent in urine-derived EVs. Regarding to plasma-derived EVs, the detection of the opposite pattern (CD133−/CD63+) in the EVs obtained with standard protocol unravel the isolation of a specific EV fraction, being probably only exosomes (46).
Regarding the RNA concentrations yielded by the different EV isolation methods, we have observed great variability. Although Taylor and colleagues conclude that exoquick isolates more than, among other methods, ultracentrifugation (32), we have observed, unexpectedly, that the RNA concentrations obtained with the different methods are very similar, despite the notable differences in EV concentrations. Surprisingly, high RNA concentrations were obtained from urine (especially when using the salting out and standard methods), concentrations similar to or even higher than those obtained from plasma and serum, regardless of EV concentrations being between 10 and 20 times lower. These results lead us to think that, as we have not used RNAses, we are measuring the concentration not only of the RNA contained in the EVs but of the free RNA. In a position paper of the International Society of Extracellular Vesicles, the authors suggest that the use of RNAses only removes the free RNA not specifically bound to EVs, while their use in combination with proteases also removes the nucleoproteic complexes (50). In any case, if the final objective is to use the RNA as a source of potential biomarker, we believe that it would be useful to preserve not only the RNA inside the EVs but the RNA stuck to their membrane.
EVs from Bench to Bedside
The importance of the study of EVs in a hospital setting to complement the diagnosis and prognosis of several diseases has been well demonstrated (51–53). Moreover, their application in therapeutic approaches has already been tested in clinical trials with promising results (54). Nonetheless, we believe that the workflows from the collection of the samples aimed at the isolation, processing, and characterization of EVs to yield significant results to be applied on patients need to be urgently standardized. Specifically, the different isolation method can yield different types of EVs and, thus, omics studies performed on them could give incomparable results. Besides, not all methods are applicable in a hospital setting.
With aim of contributing to this debate and in accordance to the results of the present work, we consider that the centri13000 method is the most suitable one to be used in a hospital setting as (a) it requires a simple infrastructure (and does not require ultracentrifuge) that is available in any general laboratory, (b) isolates EVs with similar characteristics to the ones isolated with the standard method but in higher concentrations, (c) it recovers not only small EVs as standard does but also the largest, and (d) in analysis with FC and WB showed less contamination when comparing with centri2500. We concur with Deun and colleagues (55) in that it is necessary for a validation of the isolation procedure and we propose that this validation could be carried out in referent laboratories lead by group with great expertise in the study of EVs. The results obtained in the hospital setting should be compared to those obtained by the reference lab to assure a quality control. On the other, for the posterior detection and characterization of EVs, we recommend to analyze them with at least one quantification method (NTA or FC) and one characterization method (WB, EM, or FC) as they provide complementary information. Figure 4 summarizes a proposed workflow based on the discussion above.
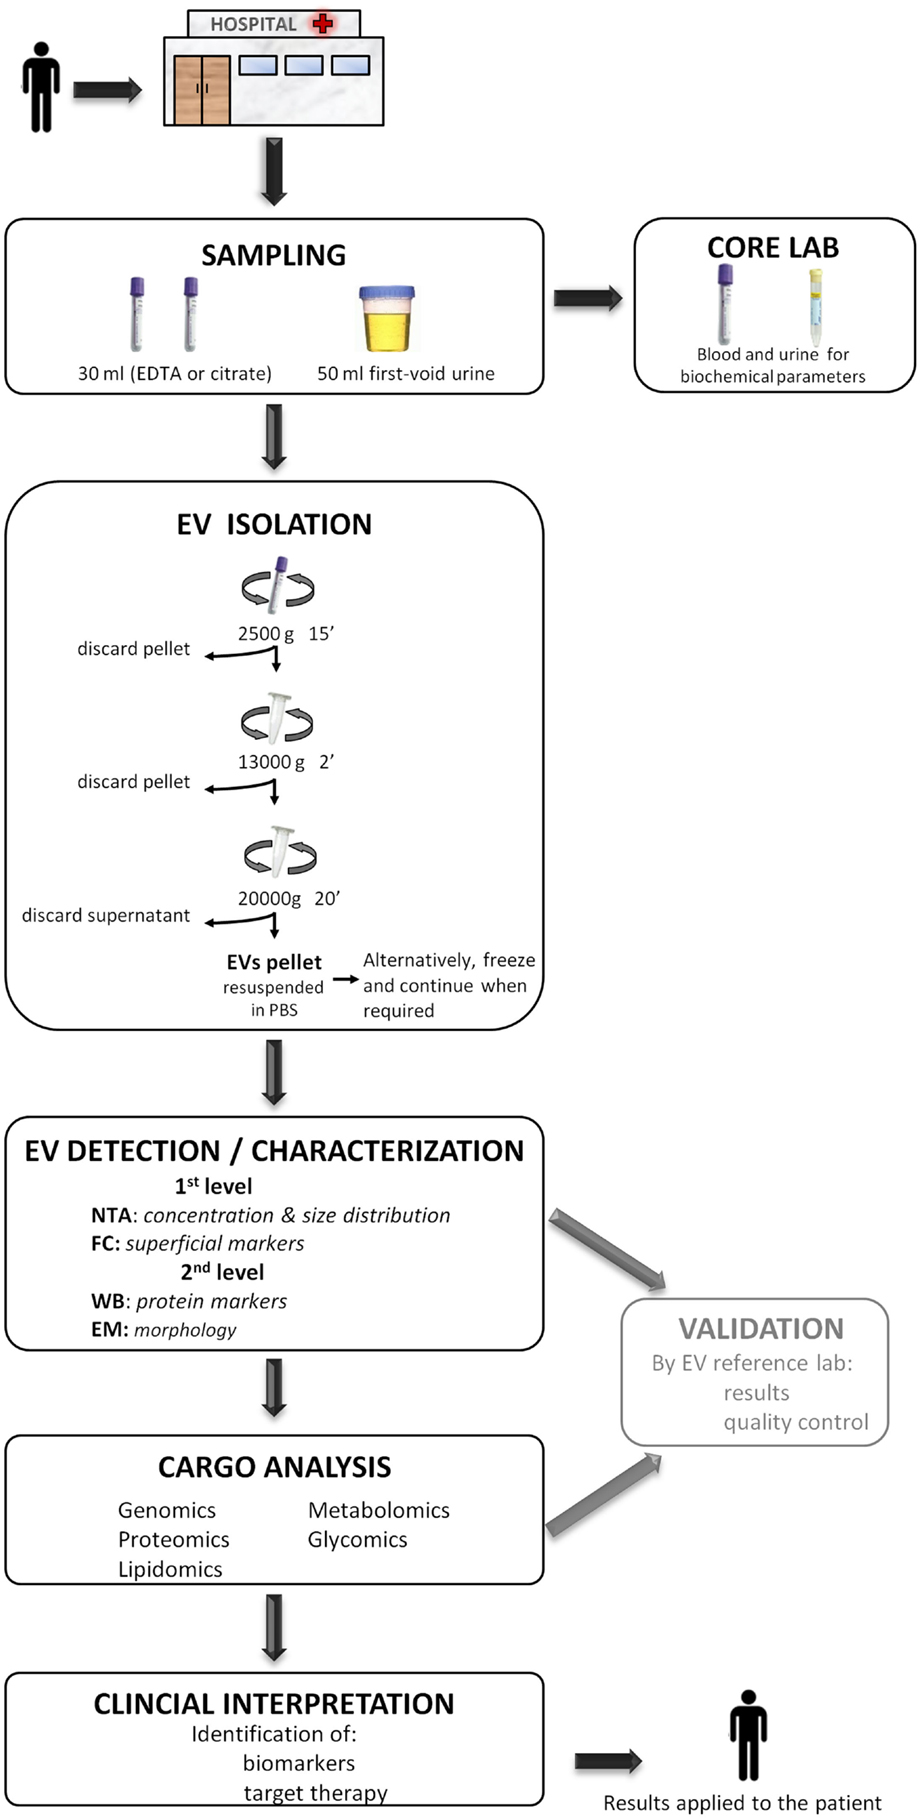
Figure 4. A proposed workflow for the study of extracellular vesicles (EVs) in a hospital setting. Patients visited during the morning in the hospital, preferentially on fasting, undergo sample collection of 30 ml of blood (EDTA or citrate) and 50 ml of the first void urine. Immediately, 15 ml of blood and 40 ml of urine are destined to the EV isolation protocol to obtain a pellet and the rest 15 and 10 ml are sent to the core laboratory to analyze biochemical parameters. The obtained EV pellet resuspended in PBS could optionally be frozen at −80°C and continue when required. Next, the detection/characterization of EV is divided in two levels for quantification, size [nanoparticle tracking analysis (NTA)], and initial characterization with flow cytometry (FC) followed by an extensive description with western blot (WB) and electronic microscopy (EM). Subsequently, the analysis of EV cargo with several omics platforms allows the identification of specific compounds carried by EVs. EVs detection and their cargo analysis could optionally be referenced, at least during the initial setting of this workflow, to an expert EV laboratory in order to provide a validation of the results and pass a quality control test. Finally, the detected molecules are interpreted in the whole context of the patient with the aim of identifying biomarkers or a target for a putative therapy. The results provided by the study of EV are applied back to the patient improving the diagnosis or course of the disease.
To conclude, the isolation of EVs, at least for plasma-derived ones, through differential centrifugation at medium speed (centri13000) and their posterior analysis with at least one quantification method (NTA, for example) and another characterization method (FC or WB, for example) could fit in a workflow that goes from the patient to lab and all the way back to the patient and would contribute to face several health problems.
Conflict of Interest Statement
The authors declare that the research was conducted in the absence of any commercial or financial relationships that could be construed as a potential conflict of interest.
Acknowledgments
We especially thank Lucía Sepúlveda for technical support. Funding: this work was supported partially by two grants from the Basque Government: SAIOTEK program (SAIO11-PC11BN3) and Health Department (GV-2011111028).
Supplementary Material
The Supplementary Material for this article can be found online at http://www.frontiersin.org/Jounal/10.3389/fimmu.2015.00050/abstract
References
1. Vlassov AV, Magdaleno S, Setterquist R, Conrad R. Exosomes: current knowledge of their composition, biological functions, and diagnostic and therapeutic potentials. Biochim Biophys Acta (2012) 1820(7):940–8. doi:10.1016/j.bbagen.2012.03.017
Pubmed Abstract | Pubmed Full Text | CrossRef Full Text | Google Scholar
2. Zitvogel L, Regnault A, Lozier A, Wolfers J, Flament C, Tenza D, et al. Eradication of established murine tumors using a novel cell-free vaccine: dendritic cell-derived exosomes. Nat Med (1998) 4(5):594–600. doi:10.1038/nm0598-594
Pubmed Abstract | Pubmed Full Text | CrossRef Full Text | Google Scholar
3. Peinado H, Ale M, Lavotshkin S, Matei I, Costa-silva B, Moreno-Bueno G, et al. Melanoma exosomes educate bone marrow progenitor cells toward a pro-metastatic phenotype through MET. Nat Med (2012) 18(6):883–91. doi:10.1038/nm.2753
Pubmed Abstract | Pubmed Full Text | CrossRef Full Text | Google Scholar
4. Lee TH, D’Asti E, Magnus N, Al-Nedawi K, Meehan B, Rak J. Microvesicles as mediators of intercellular communication in cancer – the emerging science of cellular “debris”. Semin Immunopathol (2011) 33(5):455–67. doi:10.1007/s00281-011-0250-3
Pubmed Abstract | Pubmed Full Text | CrossRef Full Text | Google Scholar
5. Robbins PD, Morelli AE. Regulation of immune responses by extracellular vesicles. Nat Rev Immunol (2014) 14(3):195–208. doi:10.1038/nri3622
Pubmed Abstract | Pubmed Full Text | CrossRef Full Text | Google Scholar
6. Fleury A, Martinez MC, Le Lay S. Extracellular vesicles as therapeutic tools in cardiovascular diseases. Front Immunol (2014) 5(August):370. doi:10.3389/fimmu.2014.00370
Pubmed Abstract | Pubmed Full Text | CrossRef Full Text | Google Scholar
7. Garcia-Contreras M, Robbins PD. Exosomes and microvesicles: applications for translational research from biomarkers to therapeutic applications. 2013 ASMEV meeting report. CellR4 (2013) 1(2):e412; 173–5. Available from: http://www.cellr4.org/article/412
8. El Andaloussi S, Mager I, Breakefield XO, Wood MJA. Extracellular vesicles: biology and emerging therapeutic opportunities. Nat Rev Drug Discov (2013) 12(5):347–57. doi:10.1038/nrd3978
Pubmed Abstract | Pubmed Full Text | CrossRef Full Text | Google Scholar
9. Gyorgy B, Szabo TG, Pasztoi M, Pal Z, Misjak P, Aradi B, et al. Membrane vesicles, current state-of-the-art: emerging role of extracellular vesicles. Cell Mol Life Sci (2011) 68(16):2667–88. doi:10.1007/s00018-011-0689-3
Pubmed Abstract | Pubmed Full Text | CrossRef Full Text | Google Scholar
10. Santiago-Dieppa DR, Steinberg J, Gonda D, Cheung VJ, Carter BS, Chen CC. Extracellular vesicles as a platform for “liquid biopsy” in glioblastoma patients. Expert Rev Mol Diagn (2014) 14(7):819–25. doi:10.1586/14737159.2014.943193
Pubmed Abstract | Pubmed Full Text | CrossRef Full Text | Google Scholar
11. Heinemann ML, Ilmer M, Silva LP, Hawke DH, Recio A, Vorontsova MA, et al. Benchtop isolation and characterization of functional exosomes by sequential filtration. J Chromatogr A (2014) 1371C:125–35. doi:10.1016/j.chroma.2014.10.026
Pubmed Abstract | Pubmed Full Text | CrossRef Full Text | Google Scholar
12. Yalak G, Ehrlich YH, Olsen BR. Ecto-protein kinases and phosphatases: an emerging field for translational medicine. J Transl Med (2014) 12(1):165. doi:10.1186/1479-5876-12-165
Pubmed Abstract | Pubmed Full Text | CrossRef Full Text | Google Scholar
13. Hood JL, Wickline SA. A systematic approach to exosome-based translational nanomedicine. Wiley Interdiscip Rev Nanomed Nanobiotechnol (2012) 4(4):458–67. doi:10.1002/wnan.1174
Pubmed Abstract | Pubmed Full Text | CrossRef Full Text | Google Scholar
14. Lacroix R, Judicone C, Poncelet P, Robert S, Arnaud L, Sampol J, et al. Impact of pre-analytical parameters on the measurement of circulating microparticles: towards standardization of protocol. J Thromb Haemost (2012) 10(3):437–46. doi:10.1111/j.1538-7836.2011.04610.x
Pubmed Abstract | Pubmed Full Text | CrossRef Full Text | Google Scholar
15. Lacroix R, Judicone C, Mooberry M, Boucekine M, Key NS, Dignat-George F. Standardization of pre-analytical variables in plasma microparticle determination: results of the international society on thrombosis and haemostasis SSC collaborative workshop. J Thromb Haemost (2013) 11:1190–3. doi:10.1111/jth.12207
Pubmed Abstract | Pubmed Full Text | CrossRef Full Text | Google Scholar
16. Momen-Heravi F, Balaj L, Alian S, Mantel P-Y, Halleck AE, Trachtenberg AJ, et al. Current methods for the isolation of extracellular vesicles. Biol Chem (2013) 394(10):1253–62. doi:10.1515/hsz-2013-0141
17. Witwer KW, Buzás EI, Bemis LT, Bora A, Lässer C, Lötvall J, et al. Standardization of sample collection, isolation and analysis methods in extracellular vesicle research. J Extracell Vesicles (2013) 2:1–25. doi:10.3402/jev.v2i0.20360
Pubmed Abstract | Pubmed Full Text | CrossRef Full Text | Google Scholar
18. Rood IM, Deegens JKJ, Merchant ML, Tamboer WPM, Wilkey DW, Wetzels JFM, et al. Comparison of three methods for isolation of urinary microvesicles to identify biomarkers of nephrotic syndrome. Kidney Int (2010) 78(8):810–6. doi:10.1038/ki.2010.262
Pubmed Abstract | Pubmed Full Text | CrossRef Full Text | Google Scholar
19. Shao H, Chung J, Balaj L, Charest A, Bigner DD, Carter BS, et al. Protein typing of circulating microvesicles allows real-time monitoring of glioblastoma therapy. Nat Med (2012) 18(12):1835–40. doi:10.1038/nm.2994
Pubmed Abstract | Pubmed Full Text | CrossRef Full Text | Google Scholar
20. van der Meel R, Krawczyk-Durka M, van Solinge WW, Schiffelers RM. Toward routine detection of extracellular vesicles in clinical samples. Int J Lab Hematol (2014) 36(3):244–53. doi:10.1111/ijlh.12247
Pubmed Abstract | Pubmed Full Text | CrossRef Full Text | Google Scholar
21. Ashcroft BA, de Sonneville J, Yuana Y, Osanto S, Bertina R, Kuil ME, et al. Determination of the size distribution of blood microparticles directly in plasma using atomic force microscopy and microfluidics. Biomed Microdevices (2012) 14(4):641–9. doi:10.1007/s10544-012-9642-y
Pubmed Abstract | Pubmed Full Text | CrossRef Full Text | Google Scholar
22. Jayachandran M, Miller VM, Heit JA, Owen WG. Methodology for isolation, identification and characterization of microvesicles in peripheral blood. J Immunol Methods (2012) 375(1–2):207–14. doi:10.1016/j.jim.2011.10.012
Pubmed Abstract | Pubmed Full Text | CrossRef Full Text | Google Scholar
23. Dey-Hazra E, Hertel B, Kirsch T, Woywodt A, Lovric S, Haller H, et al. Detection of circulating microparticles by flow cytometry: influence of centrifugation, filtration of buffer, and freezing. Vasc Health Risk Manag (2010) 6:1125–33. doi:10.2147/VHRM.S13236
Pubmed Abstract | Pubmed Full Text | CrossRef Full Text | Google Scholar
24. Dignat-George F, Sabatier F, Camoin-Jau L, Sampol J. Numeration of circulating microparticles of various cellular origin by flow cytometry. J Thromb Haemost (2004) 2:1844–6. doi:10.1111/j.1538-7836.2004.00938.x
25. Brownlee Z, Lynn KD, Thorpe PE, Schroit AJ. A novel “salting-out” procedure for the isolation of tumor-derived exosomes. J Immunol Methods (2014) 407:120–6. doi:10.1016/j.jim.2014.04.003
Pubmed Abstract | Pubmed Full Text | CrossRef Full Text | Google Scholar
26. Théry C, Amigorena S, Raposo G, Clayton A. Isolation and characterization of exosomes from cell culture supernatants and biological fluids. Curr Protoc Cell Biol (2006) 30:3.22.1–29. doi:10.1002/0471143030.cb0322s30
27. Dragovic RA, Gardiner C, Brooks AS, Tannetta DS, Ferguson DJP, Hole P, et al. Sizing and phenotyping of cellular vesicles using nanoparticle tracking analysis. Nanomedicine (2011) 7(6):780–8. doi:10.1016/j.nano.2011.04.003
Pubmed Abstract | Pubmed Full Text | CrossRef Full Text | Google Scholar
28. Sáenz-Cuesta M, Irizar H, Castillo-Triviño T, Muñoz-Culla M, Osorio-Querejeta I, Prada A, et al. Circulating microparticles reflect treatment effects and clinical status in multiple sclerosis. Biomark Med (2014) 8(5):653–61. doi:10.2217/bmm.14.9
Pubmed Abstract | Pubmed Full Text | CrossRef Full Text | Google Scholar
29. Perez A, Loizaga A, Arceo R, Lacasa I, Rabade A, Zorroza K, et al. A pilot study on the potential of RNA-associated to urinary vesicles as a suitable non-invasive source for diagnostic purposes in bladder cancer. Cancers (Basel) (2014) 6(1):179–92. doi:10.3390/cancers6010179
Pubmed Abstract | Pubmed Full Text | CrossRef Full Text | Google Scholar
30. van der Pol E, Coumans FAW, Grootemaat AE, Gardiner C, Sargent IL, Harrison P, et al. Particle size distribution of exosomes and microvesicles determined by transmission electron microscopy, flow cytometry, nanoparticle tracking analysis, and resistive pulse sensing. J Thromb Haemost (2014) 12(7):1182–92. doi:10.1111/jth.12602
Pubmed Abstract | Pubmed Full Text | CrossRef Full Text | Google Scholar
31. van Ierssel SH, Hoymans VY, Van Craenenbroeck EM, Van Tendeloo VF, Vrints CJ, Jorens PG, et al. Endothelial microparticles (EMP) for the assessment of endothelial function: an in vitro and in vivo study on possible interference of plasma lipids. PLoS One (2012) 7(2):e31496. doi:10.1371/journal.pone.0031496
Pubmed Abstract | Pubmed Full Text | CrossRef Full Text | Google Scholar
32. Taylor DD, Zacharias W, Gercel-taylor C. Exosome isolation for proteomic analyses and RNA profiling. Methods Mol Biol (2011) 728(1):235–46. doi:10.1007/978-1-61779-068-3_15
Pubmed Abstract | Pubmed Full Text | CrossRef Full Text | Google Scholar
33. Yamada T, Inoshima Y, Matsuda T, Ishiguro N. Comparison of methods for isolating exosomes from bovine milk. J Vet Med Sci (2012) 74(11):1523–5. doi:10.1292/jvms.12-0032
Pubmed Abstract | Pubmed Full Text | CrossRef Full Text | Google Scholar
34. George JN, Thoi LL, McManus LM, Reimann TA. Isolation of human platelet membrane microparticles from plasma and serum. Blood (1982) 60(4):834–40.
35. Momen-Heravi F, Balaj L, Alian S, Trachtenberg AJ, Hochberg FH, Skog J, et al. Impact of biofluid viscosity on size and sedimentation efficiency of the isolated microvesicles. Front Physiol (2012) 3:162. doi:10.3389/fphys.2012.00162
Pubmed Abstract | Pubmed Full Text | CrossRef Full Text | Google Scholar
36. Jy W, Horstman LL, Ahn YS. Microparticle size and its relation to composition, functional activity, and clinical significance. Semin Thromb Hemost (2010) 36(8):876–80. doi:10.1055/s-0030-1267041
Pubmed Abstract | Pubmed Full Text | CrossRef Full Text | Google Scholar
37. Alvarez ML, Khosroheidari M, Kanchi Ravi R, DiStefano JK. Comparison of protein, microRNA, and mRNA yields using different methods of urinary exosome isolation for the discovery of kidney disease biomarkers. Kidney Int (2012) 82(9):1024–32. doi:10.1038/ki.2012.256
Pubmed Abstract | Pubmed Full Text | CrossRef Full Text | Google Scholar
38. Alvarez ML. Isolation of urinary exosomes for RNA biomarker discovery using a simple, fast, and highly scalable method. In: Alvarez ML, Nourbakhsh M, editors. Methods in Molecular Biology RNA Mapping SE – 13. (Vol. 1182), New York, NY: Springer (2014). p. 145–70.
39. Webber J, Clayton A. How pure are your vesicles? J Extracell Vesicles (2013) 2(7):1–6. doi:10.3402/jev.v2i0.19861
40. Bobrie A, Colombo M, Krumeich S, Raposo G, Théry C. Diverse subpopulations of vesicles secreted by different intracellular mechanisms are present in exosome preparations obtained by differential ultracentrifugation. J Extracell Vesicles (2012) 1:1–11. doi:10.3402/jev.v1i0.18397
Pubmed Abstract | Pubmed Full Text | CrossRef Full Text | Google Scholar
41. Tauro BJ, Greening DW, Mathias RA, Mathivanan S, Ji H, Simpson RJ. Two distinct populations of exosomes are released from LIM1863 colon carcinoma cell-derived organoids. Mol Cell Proteomics (2013) 12(3):587–98. doi:10.1074/mcp.M112.021303
Pubmed Abstract | Pubmed Full Text | CrossRef Full Text | Google Scholar
42. Hara M, Yanagihara T, Hirayama Y, Ogasawara S, Kurosawa H, Sekine S, et al. Podocyte membrane vesicles in urine originate from tip vesiculation of podocyte microvilli. Hum Pathol (2010) 41(9):1265–75. doi:10.1016/j.humpath.2010.02.004
Pubmed Abstract | Pubmed Full Text | CrossRef Full Text | Google Scholar
43. Pisitkun T, Shen R-F, Knepper MA. Identification and proteomic profiling of exosomes in human urine. Proc Natl Acad Sci U S A (2004) 101(36):13368–73. doi:10.1073/pnas.0403453101
Pubmed Abstract | Pubmed Full Text | CrossRef Full Text | Google Scholar
44. Gonzales PA, Pisitkun T, Hoffert JD, Tchapyjnikov D, Star RA, Kleta R, et al. Large-scale proteomics and phosphoproteomics of urinary exosomes. J Am Soc Nephrol (2009) 20(2):363–79. doi:10.1681/ASN.2008040406
Pubmed Abstract | Pubmed Full Text | CrossRef Full Text | Google Scholar
45. Marzesco A-M, Janich P, Wilsch-Bräuninger M, Dubreuil V, Langenfeld K, Corbeil D, et al. Release of extracellular membrane particles carrying the stem cell marker prominin-1 (CD133) from neural progenitors and other epithelial cells. J Cell Sci (2005) 118(Pt 13):2849–58. doi:10.1242/jcs.02439
Pubmed Abstract | Pubmed Full Text | CrossRef Full Text | Google Scholar
46. Berckmans RJ, Sturk A, Tienen LM, van Schaap MCL, Nieuwland R. Cell-derived vesicles exposing coagulant tissue factor in saliva. Blood (2011) 117(11):3172–81. doi:10.1182/blood-2010-06-290460
47. Dimuccio V, Ranghino A, Praticò Barbato L, Fop F, Biancone L, Camussi G, et al. Urinary CD133+ extracellular vesicles are decreased in kidney transplanted patients with slow graft function and vascular damage. PLoS One (2014) 9(8):e104490. doi:10.1371/journal.pone.0104490
Pubmed Abstract | Pubmed Full Text | CrossRef Full Text | Google Scholar
48. Jorgensen M, Rikke B, Pedersen S, Sondergaard E, Kristensen S, Varming K. Extracellular vesicle (EV) array: microarray capturing of exosomes and other extracellular vesicles for multiplexed phenotyping. J Extracell Vesicles (2013) 1:1–9. doi:10.3402/jev.v2i0.20920
Pubmed Abstract | Pubmed Full Text | CrossRef Full Text | Google Scholar
49. Gan X, Gould SJ. Identification of an inhibitory budding signal that blocks the release of HIV particles and exosome/microvesicle proteins. Mol Biol Cell (2011) 22(6):817–30. doi:10.1091/mbc.E10-07-0625
Pubmed Abstract | Pubmed Full Text | CrossRef Full Text | Google Scholar
50. Hill AF, Pegtel M, Lambertz U, Leonardi T, O’Driscoll L, Pluchino S, et al. ISEV position paper: extracellular vesicle RNA analysis and bioinformatics. J Extracell Vesicles (2013) 1:1–8. doi:10.3402/jev.v2i0.22859
Pubmed Abstract | Pubmed Full Text | CrossRef Full Text | Google Scholar
51. Ghiran I, Kuo W. Examining the role of microvesicles to develop prognostic and diagnostic assays. J Appl Oral Sci (2010) 18(5):1. doi:10.1590/S1678-77572010000500001
52. Katsuda T, Kosaka N, Ochiya T. The roles of extracellular vesicles in cancer biology: toward the development of novel cancer biomarkers. Proteomics (2014) 14(4–5):412–25. doi:10.1002/pmic.201300389
Pubmed Abstract | Pubmed Full Text | CrossRef Full Text | Google Scholar
53. van der Pol E, Böing A, Harrison P. Classification, functions, and clinical relevance of extracellular vesicles. Pharmacol Rev (2012) 64:676–705. doi:10.1124/pr.112.005983
Pubmed Abstract | Pubmed Full Text | CrossRef Full Text | Google Scholar
54. Escudier B, Dorval T, Chaput N, André F, Caby M-P, Novault S, et al. Vaccination of metastatic melanoma patients with autologous dendritic cell (DC) derived-exosomes: results of thefirst phase I clinical trial. J Transl Med (2005) 3(1):10. doi:10.1186/1479-5876-3-10
Pubmed Abstract | Pubmed Full Text | CrossRef Full Text | Google Scholar
55. Deun J, Van Mestdagh P, Sormunen R, Cocquyt V, Vermaelen K, Vandesompele J, et al. The impact of disparate isolation methods for extracellular vesicles on downstream RNA profiling. J Extracell Vesicles (2014) 1:1–14. doi:10.3402/jev.v3.24858
Pubmed Abstract | Pubmed Full Text | CrossRef Full Text | Google Scholar
Keywords: extracellular vesicles, protocol standardization, clinical application, nanoparticle tracking analysis, flow cytometry, translational research, urine
Citation: Sáenz-Cuesta M, Arbelaiz A, Oregi A, Irizar H, Osorio-Querejeta I, Muñoz-Culla M, Banales JM, Falcón-Pérez JM, Olascoaga J and Otaegui D (2015) Methods for extracellular vesicles isolation in a hospital setting. Front. Immunol. 6:50. doi: 10.3389/fimmu.2015.00050
Received: 12 December 2014; Paper pending published: 27 December 2014;
Accepted: 27 January 2015; Published online: 13 February 2015.
Edited by:
Masaaki Murakami, Hokkaido University, JapanCopyright: © 2015 Sáenz-Cuesta, Arbelaiz, Oregi, Irizar, Osorio-Querejeta, Muñoz-Culla, Banales, Falcón-Pérez, Olascoaga and Otaegui. This is an open-access article distributed under the terms of the Creative Commons Attribution License (CC BY). The use, distribution or reproduction in other forums is permitted, provided the original author(s) or licensor are credited and that the original publication in this journal is cited, in accordance with accepted academic practice. No use, distribution or reproduction is permitted which does not comply with these terms.
*Correspondence: David Otaegui, Multiple Sclerosis Unit, Neuroscience Area, Biodonostia Health Research Institute, Dr. Begiristain s/n, San Sebastián 20014, Spain e-mail: david.otaegui@biodonostia.org