Nutrients and carbon fluxes in the estuaries of major rivers flowing into the tropical Atlantic
 Moacyr Araujo
 Carlos Noriega
 Nathalie Lefèvre3
- 1Department of Oceanography – DOCEAN, Federal University of Pernambuco, Recife, Brazil
- 2Department of Engineering, Center for Risk Analysis and Environmental Modeling – CEERMA, Federal University of Pernambuco, Recife, Brazil
- 3IRD, Sorbonne Universités (UPMC, Univ Paris 06), CNRS, MNHN, LOCEAN Laboratório, Paris, France
Knowledge of the seasonal variability of river discharge and the concentration of nutrients in the estuary waters of large rivers flowing into the tropical Atlantic contributes to a better understanding of the biogeochemical processes that occur in adjacent coastal and ocean systems. The monthly averaged variations of the physical and biogeochemical contributions of the Orinoco, Amazon, São Francisco, Paraíba do Sul (South America), Volta, Niger and Congo (Africa) Rivers are estimated from models or observations. The results indicate that these rivers deliver approximately 0.1 Pg C year−1 in its dissolved organic (DOC 0.046 Pg C year−1) and inorganic (DIC 0.053 Pg C year−1) forms combined. These values represent 27.3% of the global DOC and 13.2% of the global DIC delivered by rivers into the world's oceans. Estimations of the air-sea CO2 fluxes indicate a slightly higher atmospheric liberation for the African systems compared with the South American estuaries (+10.6 ± 7 mmol m−2 day−1 and +5.4 ± 8 mmol m−2 day−1, respectively). During the high river discharge periods, the fluxes remained positive in all of the analyzed systems (average +12 ± 8 mmol m−2 day−1), except at the mouth of the Orinoco River, which continued to act as a sink for CO2. During the periods of low river discharges, the mean CO2 efflux decreased to +5.2 ± 9 mmol m−2 day−1. The updated and detailed review presented here contributes to the accurate quantification of CO2 input into the atmosphere and to ongoing studies on the oceanic modeling of biogeochemical cycles in the tropical Atlantic.
Introduction
The quantification of nutrient input from the continents to the oceans is of fundamental importance for the estimation of the global balance of nutrients available for the maintenance of aquatic biota and for the determination of the preferential pathways of biogeochemical processes governing the composition of oceanic waters and their interaction with the atmosphere. The high nutrient loads carried by large rivers and discharged into the waters of the continental shelf and the adjacent oceanic region increase primary production and can lead to substantial CO2 uptake (Körtzinger, 2003; Regnier et al., 2013). Recent studies, for example, have indicated that the high nutrient loads brought by large rivers enhance atmospheric N2 fixation, increasing primary production and the atmospheric sequestration of CO2 in the tropical Atlantic (Subramaniam et al., 2008; Yeung et al., 2012). Thus, although they constitute a limited proportion of the ocean surface, coastal ocean waters comprise the most biogeochemically active areas of the biosphere, playing an important role in the global cycle of oceanic carbon, a phenomenon that requires further study. This need for additional study is particularly evident within the context of a warming planet as a result of the emission of greenhouse gases such as carbon dioxide and methane, which are components of the natural carbon cycle. Knowledge of the variability of the nutrient and carbon flux from the continents to the oceans is important for the correct estimation of the global carbon balance and its natural and anthropogenic components (Ludwig and Probst, 1998; Archer, 2005; Regnier et al., 2013). Furthermore, quantifying the supply of nutrients resulting from major river discharge is of fundamental importance to accurately modeling oceanic biogeochemical cycles. The currently used three-dimensional, ocean-only, coupled ocean-atmosphere and/or Earth system models include nutrients and the carbon cycle but do not consider the land-ocean variability of lateral loads (Cotrim da Cunha et al., 2007; Dunne et al., 2010; Collins et al., 2011; de Farias et al., 2013; Regnier et al., 2013). Most of these numerical tools consider average values of biogeochemical state variables (or even general population and/or land use-dependent regression laws) as the characteristics of each system. The seasonal variations of the continental nutrient loads transported to the oceans in these models are obtained from the simple weighting of these values by the climatological river discharges (Harrison et al., 2005; Mayorga et al., 2010).
Here, we focus on the supply of nutrients brought by major rivers flowing into the tropical Atlantic, a region that receives ~32% of the world's river discharge (Dai and Trenberth, 2002) and where the scarcity of measurements also causes large uncertainties regarding the seasonal variability of the CO2 flux in estuaries and coastal seas (Chen et al., 2013; Laruelle et al., 2013). In the western tropical Atlantic, the primary freshwater contributions originate from the Amazon River (0.5°N–50.5°W), the Orinoco River (9.5°N–61.5°W), the São Francisco River (10.5°S–37.5°W) and the Paraíba do Sul River (21.6°S–41.0°W) (Figure 1). The estuaries of equatorial rivers have been identified as particularly high-energy marine systems because of the combined action of the currents in the western Atlantic Ocean, trade winds, tidal oscillations and the discharge of continental waters from the Orinoco River and especially from the Amazon River (Nittrouer and Demaster, 1996; Silva et al., 2010). This inflow varies seasonally, with a maximum in May and a minimum in November (Geyer et al., 1996; Dai and Trenberth, 2002). The plume of the Amazon River extends far into the ocean and can reach approximately 1000 km in the northeast direction (Lentz, 1995; Romanova et al., 2011). The seasonal variation of the convergence zone causes the trade winds that are active in the region to be continuously predominant in the southeast from June to November and in the northeast from December to May, thus favoring the interhemispheric transportation of the plumes of the Orinoco and Amazon Rivers (Geyer et al., 1996; Nittrouer and Demaster, 1996). During low discharge periods, ocean currents can also transport the freshwater supply a great distance. Satellite images show high chlorophyll concentrations and low sea surface salinities far from the mouth of the Amazon because the Amazon waters are transported eastward with the North Equatorial Counter Current (NECC) in boreal autumn (Johns et al., 1990; Reul et al., 2013).
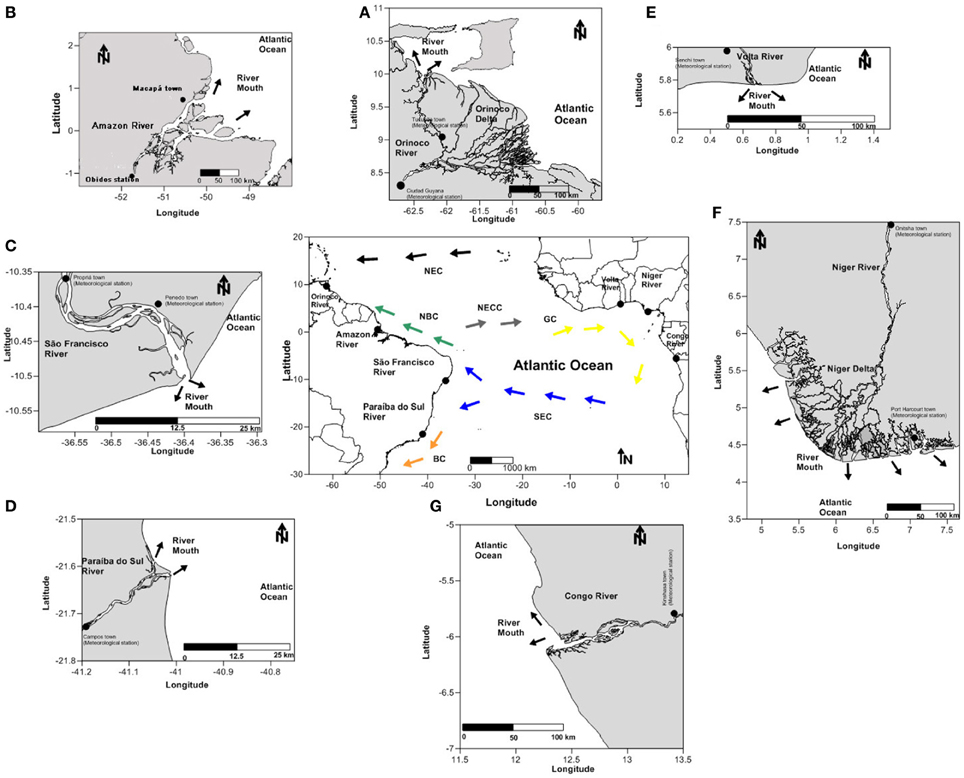
Figure 1. Locations of the sites indicating river mouths of the (A) Orinoco, (B) Amazon, (C) São Francisco, and (D) Paraíba do Sul (South America) and the (E) Volta, (F) Niger and (G) Congo (Africa). The black dots indicate meteorological stations. Arrows indicate the currents blank (the central map) of Brazil Current (BC), North Brazil Current (NBC), Guinea current (GC), south equatorial current (SEC), north equatorial counter current (NECC), and north equatorial current (NEC).
The most important contributions in the eastern portion of the tropical Atlantic originate from the Congo River (5.5°S–12.5°E), the Niger River (5.5°N–6.5°E) and the Volta River (6.5°N–0.5°E) (Figure 1). The Congo River plume interacts with the strong wind-driven coastal resurgence, increasing local productivity (Schneider et al., 1997; Dale et al., 2002). The Congo plume is transported northward by the Benguela Current and/or westward by the southern branch of the South Equatorial Current (Hardman-Mountford et al., 2003; Bourlès and Caniaux, 2013). Two other systems that are important on the western edge of the African continent are the Niger and Volta Rivers, which are located in the Gulf of Guinea. Based on an extensive literature review, we estimate the monthly averaged discharge, temperature (T), salinity (S), dissolved inorganic nitrogen (DIN), dissolved inorganic phosphorus (DIP), dissolved organic carbon (DOC), dissolved oxygen (DO), dissolved inorganic carbon (DIC), total alkalinity (TA) and silicate and iron contents of these seven major river systems flowing into the tropical Atlantic. The methods used in this study are described in section Material and Methods and are detailed in Appendix A of the supplementary material. The databases used to estimate the physical and biogeochemical quantities are listed in Appendix B of the supplementary material, and the monthly averaged calculated values and the derived partial pressure values of CO2 in seawater are listed in Appendix C.
Materials and Methods
The references for the demographic data (population and density), river discharge, DIN, DIP, Si, Fe, DOC, and DIC are listed in Appendix B (supplementary material).
River Discharges
Areas and discharges of the drainage basins were obtained from the Design of Total Runoff Integrating Pathways—TRIP database (Oki and Sud, 1998). For Brazilian rivers, the data originated from the Brazilian National Water Agency (ANA) and the Brazilian National Agency of Electric Energy (ANEEL). These databases provided information on precipitation, water level and river discharge from Brazil's primary water systems. For the other water systems, the long-term series of the outflow were taken from the Global River Discharge Data Base/SAGE of the University of Wisconsin, USA.
Nutrient Loads
The continental fluxes of dissolved inorganic nitrogen (DIN) and dissolved inorganic phosphorus (DIP) were calculated through regression models that were originally constructed based on the analysis of 165 water systems worldwide and that incorporate information on DIN and DIP flows (Meybeck and Ragu, 1997; Smith et al., 2003). The final calculated values were compared with the global estimations (UNPD, 2004). The monthly data on the discharge of silicon (Si) and iron (Fe) were obtained from different surveys, as indicated in Appendix B (supplementary material). Similar to that of nitrogen and phosphorous, the estimations of the discharge of silicon for the months for which no information was available were based on the methodology used for semi-empirical modeling (Dürr et al., 2011). Iron (Fe) plays a crucial role in ocean biogeochemistry. Rivers and continental shelf sediments supply Fe to surface waters. Because Fe is extensively removed from the dissolved phase in estuaries, rivers are thought to be a minor source for the open ocean but not for coastal zones (Cotrim da Cunha et al., 2007). The accepted average concentration of dissolved Fe in river waters is 40 μg L−1 (Chester, 2000; Cotrim da Cunha et al., 2007). During estuarine mixing, the flocculation of colloidal Fe and organic matter form particulate Fe because of the major change in ionic strength upon the mixing of fresh water and seawater (De Baar and De Jong, 2001). This removal has been well documented in many estuaries. The literature values show that approximately 80–99% of the gross dissolved Fe input is lost to the particulate phase in estuaries with low salinities (Chester, 2000; Lohan and Bruland, 2006). We applied the removal rate of 80% to our gross Fe flux and obtained a net input of riverine dissolved Fe and concentrations to the coastal sea.
Land-Ocean-Atmosphere Carbon Fluxes
The carbon discharges of the river into the oceans are normally estimated based on models that consider the climatological information and characteristics of the different drainage basins (Ludwig et al., 1996a,b; Ludwig and Probst, 1998). DIC is transported by rivers primarily in the dissolved form, which is composed of the following three main fractions: CO2, HCO−3, and CO−32. The TA and pH values were used to obtain DIC through the carbonate system equations when data were missing for DIC. We used a simple conservative mixing model to calculate the proportions of estuarine systems and seawater in a given estuary sample (Cooley and Yager, 2006). For each discrete water sample, we solved the following equations for the estimation of the proportions of the river and seawater concentrations. The surface seawater endmembers of the DIC (DICSW), TA (TASW) and salinity (SSW) were averaged monthly for non-plume sampling regions. Table 1 indicates the DICSW, TASW, and SSW values of the seawater of plume endmembers of the major river estuaries flowing into the tropical Atlantic. The partial pressures of CO2 in seawater (pCO2) and the air-sea exchanges (FCO2) were calculated using the CO2calc software (Robbins et al., 2010) once the two parameters of the carbon system, temperature, salinity, phosphate, and silicate concentrations were known.
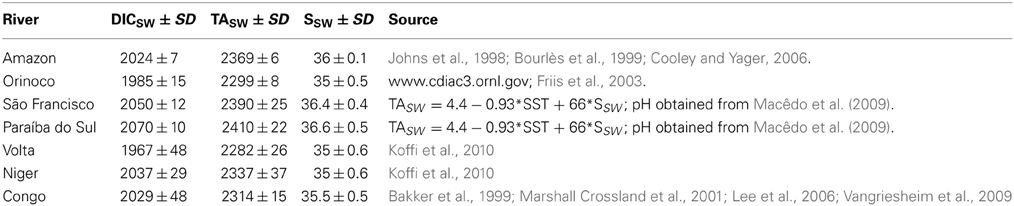
Table 1. DICSW, TASW and SSW values of the seawater endmembers of the major river estuaries flowing into the tropical Atlantic.
Results
Hydrology, Nutrient Loads and Dissolved Oxygen
The climatological series for the river discharge, temperature, and salinity of each of the hydrographic basins are displayed in Figures 2A–C. The mean annual water discharge from the Brazilian estuaries varied from 370 to 239,302 m3 s−1, contributing 8112 km3 year−1 to the Atlantic Ocean (Appendix C; Supplementary Material). The Amazon River contributes the highest volume (5413 km3 year−1), followed by the volumes discharged by the Congo River (1263 km3 year−1) and the Orinoco River (1170 km3 year−1). Statistical analysis to categories showed significant differences (t-test; α = 0.05) between discharges of eastern and western rivers (Table 2). These analyzes also showed significant differences (t-test; α = 0.05) between larger and smaller rivers, as well as between, wet and dry period (Table 2).
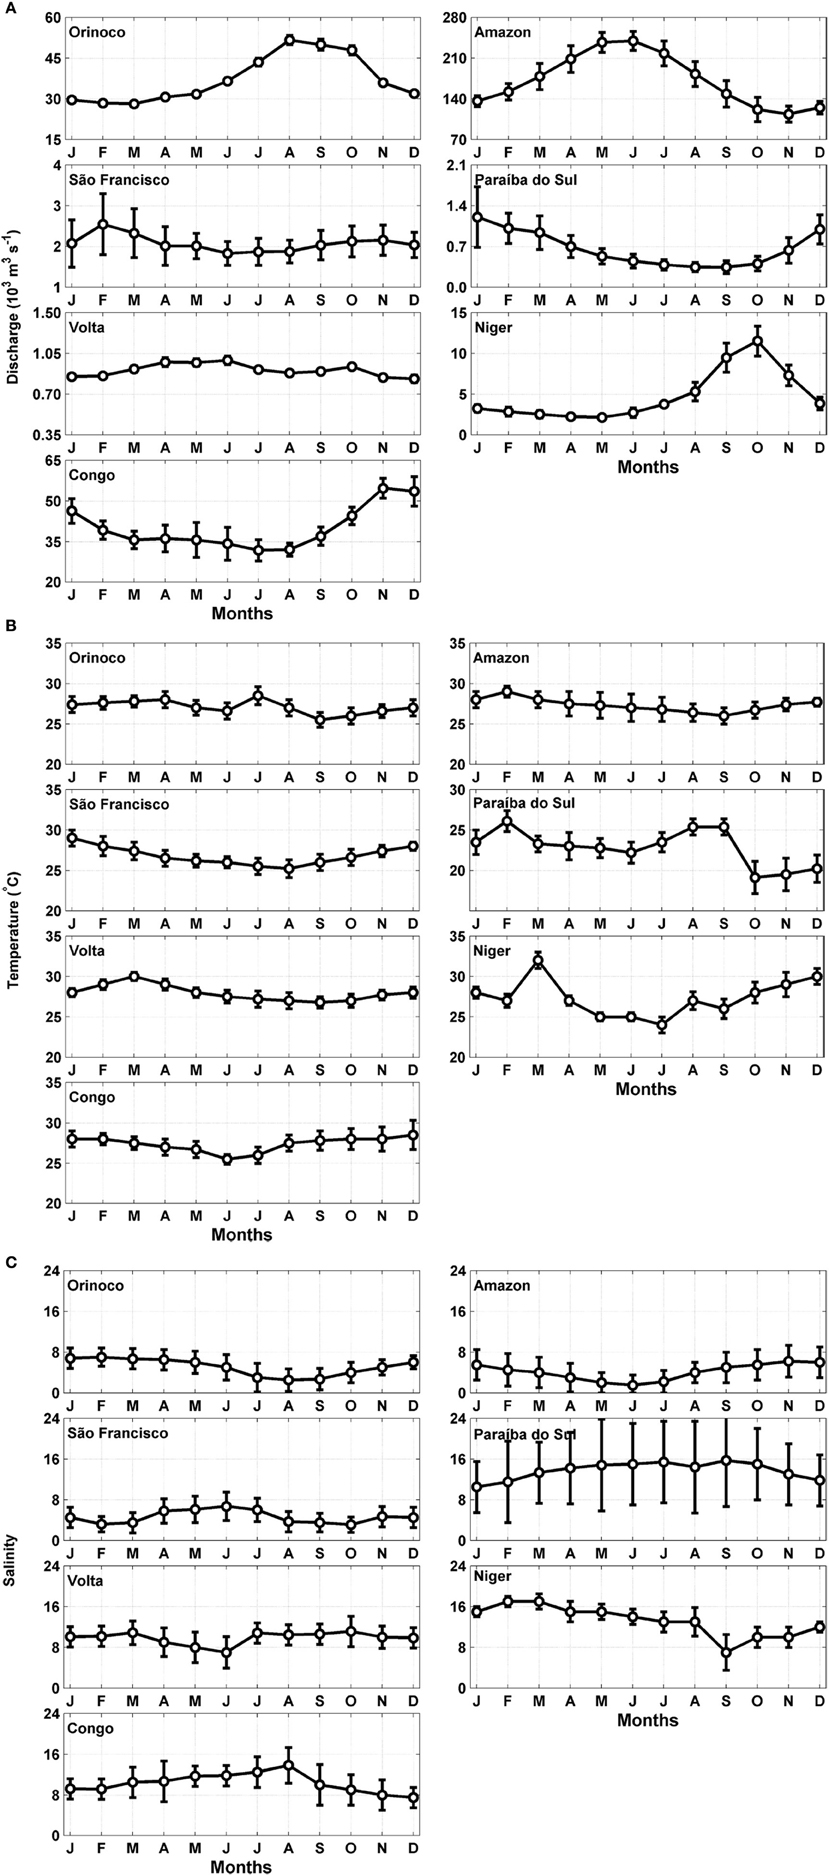
Figure 2. Seasonal variation of the (A) river discharge, (B) temperature and (C) salinity for the major hydrographic basins in the tropical Atlantic. The error bars represent the standard deviations.
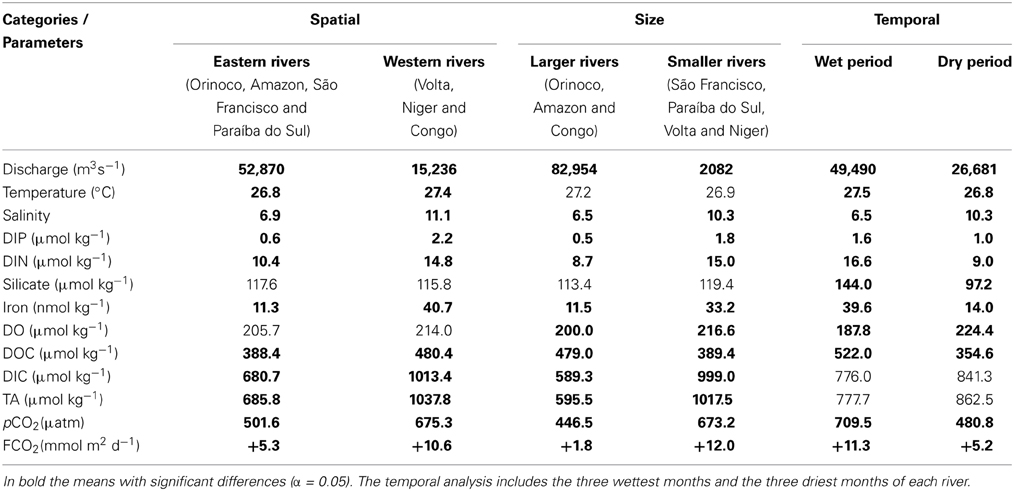
Table 2. Statistical analysis to categories.
The values ranged from 24 to 32°C for temperature and from 1.5 to 17 units for salinity. In general, the temperature and salinity series of rivers of the eastern and western Atlantic were significantly different (t-test; α = 0.05; Table 2). For the western rivers, the temperature ranged from 19 to 29°C and the salinity values ranged from 1.5 to 16, whereas eastern rivers presented temperatures between 24 and 32°C and salinity values from 7 to 17.
Figures 3A,B show the results for the DIP and DIN, of each of the hydrographic basins are shown in Figures 3A,B. The continental concentrations of DIP and DIN to the tropical Atlantic showed significant differences (t-test; α = 0.05; Table 2) at both edges. The average values of DIP and DIN by the rivers of the eastern and western edges were approximately 0.6 ± 1.5 to 2.2 ± 2.0 μmol kg−1 and 10.4 ± 4.0 to 14.8 ± 9.0 μmol kg−1, respectively. The basin-averaged values of DIP oscillated between 0.1 and 6.4 μmol kg−1, with the São Francisco River exhibiting the minimum value and the Volta River exhibiting the maximum value. With regard to inorganic nitrogen, the lowest value was recorded in the Congo River (3.5 μmol kg−1) and the highest value was found in the Volta River (35.7 μmol kg−1).
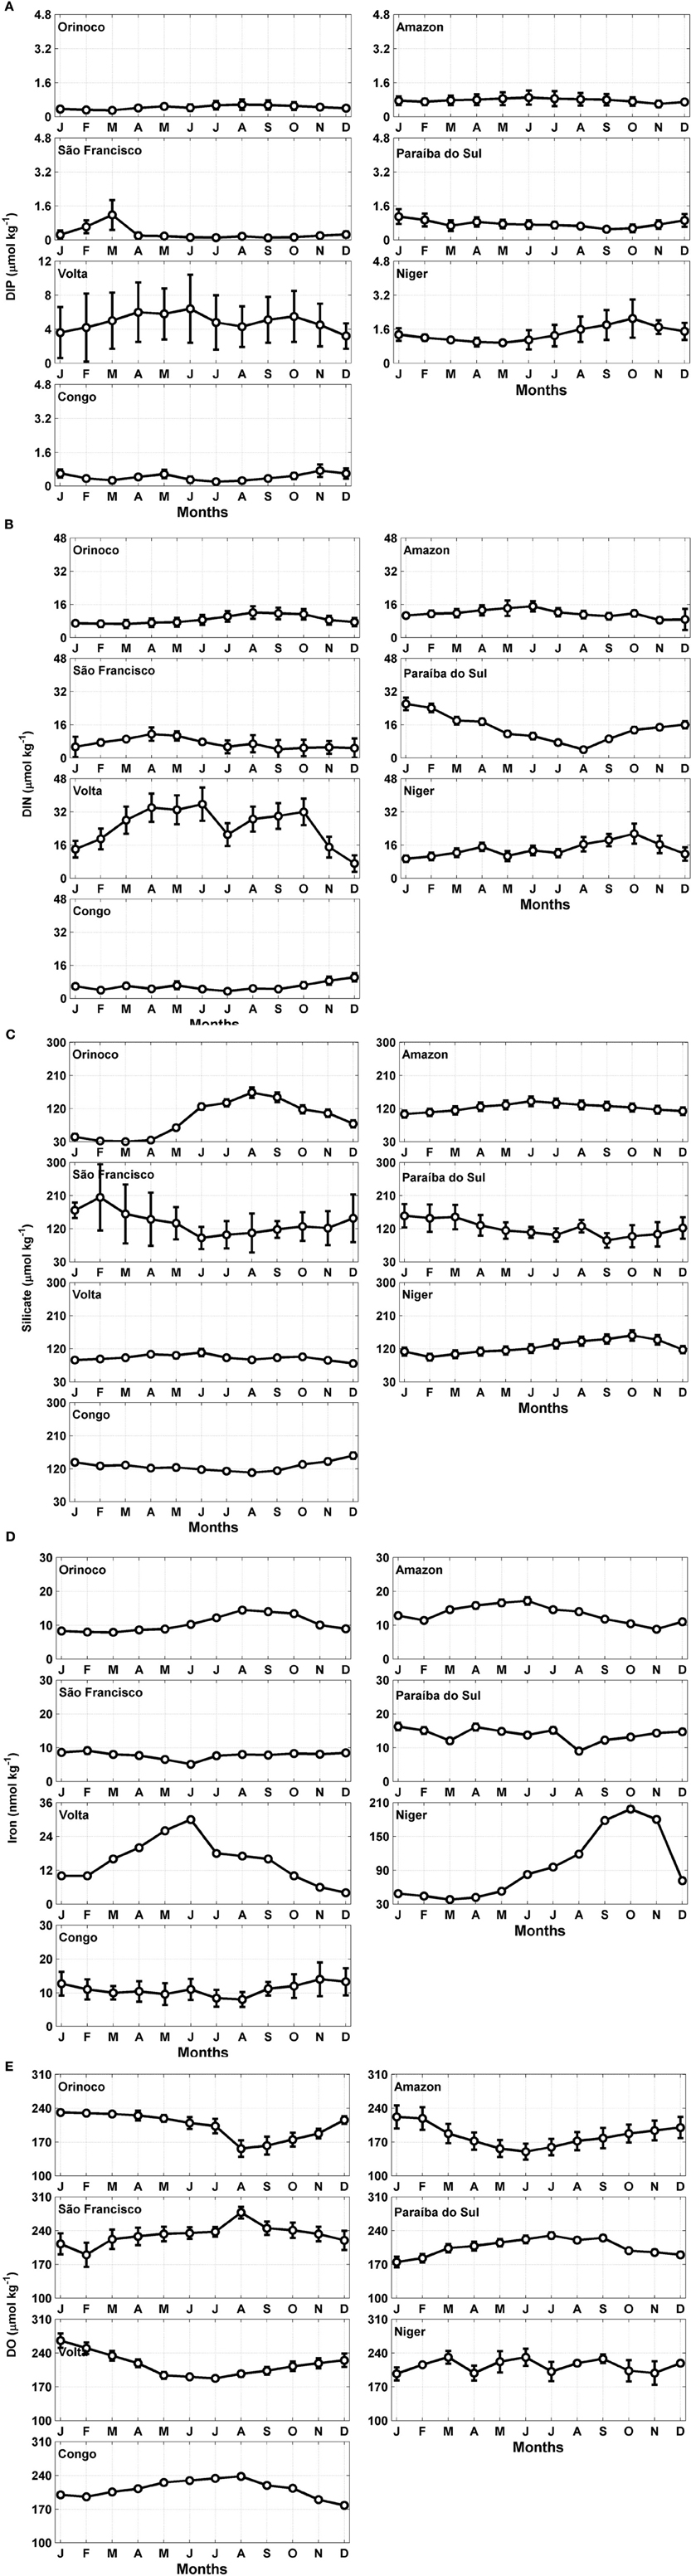
Figure 3. Seasonal variation of the (A) dissolved inorganic phosphorus (DIP), (B) dissolved inorganic nitrogen (DIN), (C) silicate, (D) iron and (E) dissolved oxygen (DO) concentrations in the estuarine areas of the major rivers flowing into the tropical Atlantic. The error bars represent the standard deviations.
The results of the silicate and iron are shown in Figures 3C,D. The mean concentration of silicate (at both edges of the ocean) was approximately 100 μmol kg−1, and the monthly averaged iron concentration was 24 nmol kg−1. These variables are also dependent on the hydrological cycles. The concentrations of silicate in the three largest river estuaries (Amazon, Congo and Orinoco) were similar to those measured in the smaller river systems (Niger, São Francisco, Paraíba do Sul and Volta), exhibiting values of 113 and 119 μmol kg−1, respectively. However, the averaged iron concentrations showed significant differences (t-test; α = 0.05; Table 1), with mean values approximately 3 times higher in the estuaries of the smaller rivers than in those of the larger rivers (33.2 and 11.5 nmol kg−1, respectively).
The climatological series for DO are displayed in Figure 3E. The statistical analysis of the DO concentrations did not indicate significant differences between the systems located at the two edges of the Atlantic (t-test; α = 0.05; Table 2). The highest DO concentration was found at the mouth of the São Francisco River, and the lowest was found in the area of the Amazon River (277 and 150 μmol kg−1, respectively). The mean concentration of DO (at both edges of the ocean) was approximately 209 ± 24 μmol kg−1 (Appendix C; Supplementary Material). However, the comparison between the DO concentrations in the group of larger rivers vs. the group of smaller rivers indicated significant differences (t-test; α = 0.05; Table 2), with a higher mean DO concentration in the systems with smaller discharges (217 μmol kg−1) compared with those with larger discharges (199 μmol kg−1).
Land-Ocean-Atmosphere Carbon Fluxes
The results for the DIC and TA, of each of the hydrographic basins are shown in Figures 4A,B. The average annual DIC concentration in the rivers at the eastern edge (1013.4 μmol kg−1) exceeded that of the rivers at the western edge (680.7 μmol kg−1). The average annual DIC concentration at the mouth of the Amazon River was 504.8 μmol kg−1. The highest average annual DIC concentration was found at the mouth of the Niger River (1340 μmol kg−1). A significant difference (t-test; α = 0.05; Table 2) was found in the concentrations of DIC between the larger and smaller rivers. The TA value in the estuaries of the western border and that in the estuaries of the eastern border were significantly different (t-test-; α = 0.05; Table 2). The highest annual averaged TA on the African side was found at the mouth of the Niger River (1395 μmol kg−1), representing the largest TA among all of the studied estuaries. We also found a significant difference (t-test; α = 0.05; Table 2) in the TA between the larger and smaller rivers.
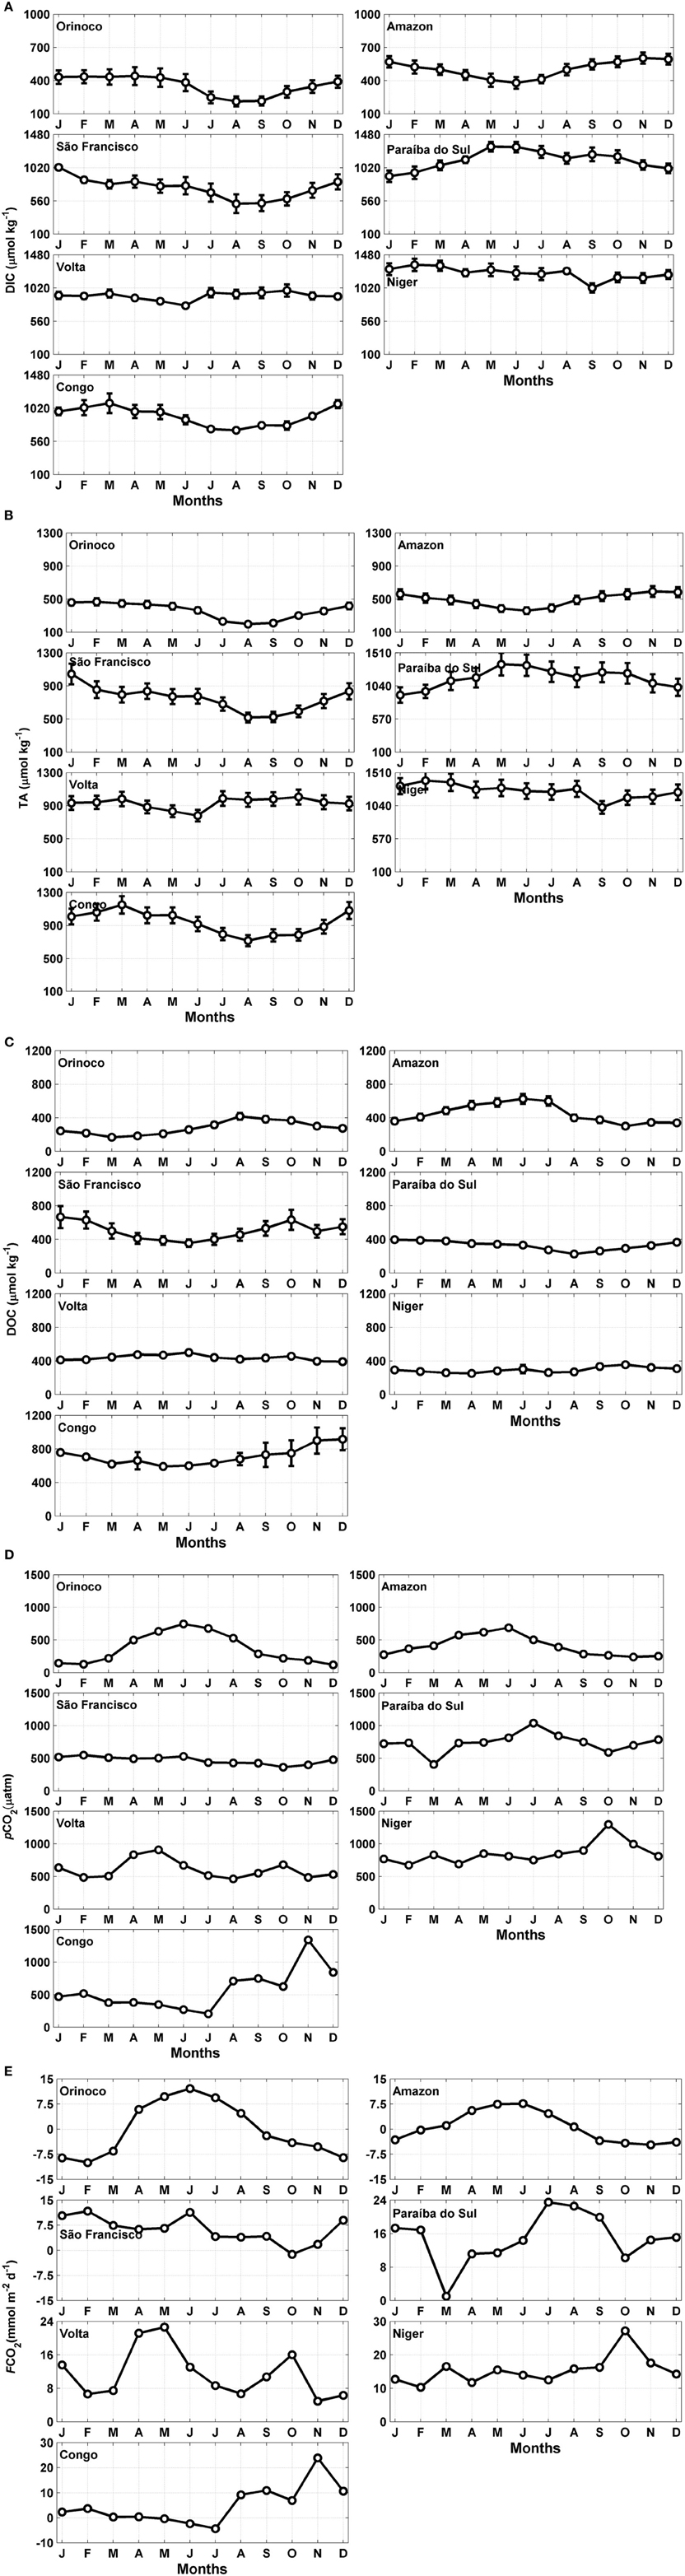
Figure 4. Seasonal variation of the (A) dissolved inorganic carbon (DIC), (B) total alkalinity (TA), (C) dissolved organic carbon (DOC) concentrations, (D) partial pressure of CO2 in seawater (pCO2) and (E) flux of CO2 (FCO2) in the estuaries of the major rivers flowing into the tropical Atlantic. The error bars represent the standard deviations.
Figure 4C shows the results for DOC. The monthly concentrations of DOC in the American estuaries and those of the African estuaries were significantly different (t-test; α = 0.05; Table 2). The average DOC concentration of the eastern edge rivers was higher than that of the western edge rivers (478 and 388 μmol kg−1, respectively). The highest concentration was observed at the mouth of the Congo River (916 μmol kg−1), and the lowest concentration was found in the estuary area of the Orinoco River (115 μmol kg−1).
The average pCO2 values of the eastern edge hydrographic basins were higher than those of the western border (675 ± 248 and 501 ± 218 μatm, respectively). The monthly concentrations of pCO2 in the American estuaries and those of the African estuaries were significantly different (t-test; α = 0.05; Table 2). The greatest seasonal variability of the water pCO2 was observed at the mouth of the Congo River (208 to 1338 μatm).
During the high discharge period, the pCO2 values were higher than during the low discharge period (Figures 2, 4D). For all of the rivers studied, the mean pCO2 value for the three months of high discharge (709 ± 282 μatm) was higher than the mean pCO2 value during the three months of low discharge (480 ± 243 μatm). The large rivers, such as the Amazon, Congo, and Orinoco, displayed an average monthly pCO2 value of 446 ± 252 μatm, which is smaller than the value of 673 ± 190 μatm estimated for the smaller rivers. The pCO2 value calculated for the mouth of the Amazon River was 405 ± 150 μatm (monthly average).
The calculated values for the CO2 flux were higher for the smaller rivers (Niger: +15.3 ± 4 mmol m−2 day−1; Paraíba do Sul: +14.8 ± 6 mmol m−2 day−1; and Volta: +11.5 ± 6 mmol m−2 day−1), indicating a gas transfer from the sea to the atmosphere (Figure 4E). However, the estuary of the Orinoco River served as a sink for atmospheric CO2 throughout the year, with an average flux rate of −0.3 ± 8 mmol C m−2 day−1. The Amazon River was also, in general, a source of CO2 to the atmosphere (annual average +0.6 ± 4.5 mmol C m−2 day−1). The rivers on the eastern border, on average, served as sources of twice as much CO2 as the rivers on the western edge, with a CO2 flux of +10.6 ± 7 mmol C m−2 day−1 versus +5.4 ± 8 mmol C m−2 day−1, respectively.
The air-sea CO2 flux of the Amazon, São Francisco, Volta, Niger and Congo systems followed the variations of the river discharge, showing stronger outgassing during the months of high river discharge. Based on an annual average, the larger rivers are a source of CO2 of +1.8 ± 7 mmol C m−2 day−1 and the smaller rivers provide a source of +12 ± 6 mmol C m−2 day−1.
During the low discharge period, all of the analyzed estuaries acted as a source of CO2 to the atmosphere, with the exception of the Orinoco and Amazon Rivers (−8.3 and −4.2 mmol m−2 day−1, respectively) (Figure 5A). The average flux during this period was +5.2 ± 9 mmol m−2 day−1, with strong escapes of CO2 verified at the mouths of the Paraíba do Sul (+17.5 mmol m−2 day−1) and Niger (+14.5 mmol m−2 day−1).
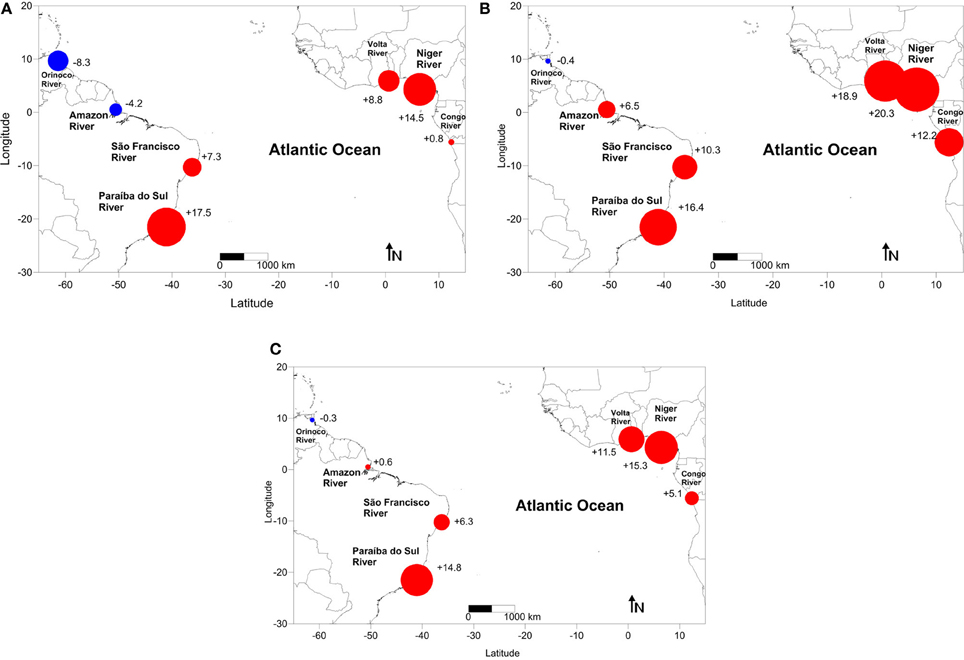
Figure 5. CO2 flux (mmol C m−2 day−1) in the estuaries of the major rivers flowing into the tropical Atlantic (A) during the low river discharge period (three-month average), (B) during the high river discharge period (three-month average) and (C) averaged annual values. The red circles (+) indicate that the system acts as a source of CO2 for the atmosphere, and the blue circles (−) indicate that the estuaries behave as atmospheric CO2 sinks.
According to Figure 5B, the estuaries of the Niger, Volta and Paraíba do Sul Rivers also act as strong sources of CO2 to the atmosphere during the high discharge period (+20.3, +18.9, and +16.4 mmol m−2 day−1, respectively). At the western edge, the tropical estuaries of the Paraíba do Sul, São Francisco and Amazon Rivers also behave as a source of CO2 to the atmosphere (+16.4, +10.3, and +6.5 mmol m−2 day−1, respectively), and only the Orinoco River continues serving as a CO2 sink (−0.4 mmol m−2 day−1) during the high river discharge period. The qualitative findings for high river discharge periods are similar to those for the average annual calculations (Figure 5C), in which most of the studied systems act as sources of atmospheric CO2 (the total average was +7.6±8 mmol m−2 day−1), except for the Orinoco River system, which sinks approximately 0.3±8 mmol m−2 day−1. As indicated in Figure 5B, the greatest fluxes of CO2 released into the atmosphere were found in the small river basins (the Paraíba do Sul, Volta and Niger Rivers).
Discussion
Hydrology, Nutrient Loads and Dissolved Oxygen
The total volume discharged by these basins into the tropical Atlantic amounts to 8112 km3 year−1, which is 21% of the total global volume (37,288 km3 year−1) (Dai and Trenberth, 2002; Dai et al., 2009). The river discharges of Amazon, Congo and the Orinoco Rivers were similar to those observed in worldwide estimations (of approximately 900 rivers) (Dai and Trenberth, 2002; Dai et al., 2009). The seasonal variations exhibit periods of high and low river discharge, except for the rivers with flow-regulation dams such as the São Francisco and the Volta (Figure 2A). Statistical analyzes showed significant differences produced by the strong influence of large rivers such as the Amazon, Orinoco, and Congo, affecting the seasonal and spatial river inflow (east and west edge).
The temperature and salinity series exhibit time evolutions that follow variability in river discharge. The mean temperatures of the water masses adjacent to the coasts of the western regions of Brazil are 27.6 and 27.2°C (Macêdo et al., 2009), respectively. In the eastern edge the mean temperatures of the water masses adjacent to coast are 26.7°C and 28.3°C (Lefèvre, 2009). We obtained similar results for the estuaries of the eastern and western regions (26.8 ± 1.1 to 27.4 ± 1.3, respectively; Table 2).
The continental contributions of DIP and DIN to the tropical Atlantic showed significant differences at both edges. The joint analyses of the DIP/DIN concentrations showed significant differences (t-test; α = 0.05) between the large (Amazon, Orinoco and Congo) and small (São Francisco, Paraíba do Sul, Volta and Niger) rivers. The comparison of the average DIN values indicated a concentration 1.7 times higher in the estuaries of smaller river discharges than in the larger rivers. For the DIP values, the difference was 3.3 times greater for the smaller rivers than for the larger rivers.
The time-series of the DIP and DIN concentrations in the estuaries showed similar values to those reported for scenarios with a low population density (1 hab km−2) and high runoff (Smith et al., 2003). Our calculations provided average values of 1.3 ± 1 and 12.3 ± 7 μmol kg−1 for DIP and DIN, respectively (Appendix C; Supplementary Material), while the means average values found in literature are of 0.5 mmol m−3 (μmol kg−1) for DIP and 10 mmol m−3 (μmol kg−1) for DIN (Smith et al., 2003).
The calculated average silicate and iron concentrations were approximately 117 ± 29 μmol kg−1 and 24 ± 16 nmol kg−1, respectively, with variations typically associated with the seasonality of the river discharges. In contrast to the other rivers of the region, which display much lower silicate concentrations during the low river discharge periods, the Amazon River exhibited relatively constant silicate concentrations of greater than 100 μmol kg−1. In this case, the Amazon River basin was considered to possess 85.6% silicate rocks and only 14.4% carbonate rocks. The average silicate concentration was approximately 127 μmol kg−1 (Amiotte-Suchet et al., 2003).
The results presented here indicate an N:Si:P ratio of 17:230:1, whereas the Redfield ratio normally found in ocean environments dominated by phytoplankton is 16:15:1. The significant difference in the silicate concentration between these two ratios is primarily due to the influence of the continental discharge over the estuary areas, which is stronger during rainy months.
The variation in the iron concentration also suggests a direct relationship with the hydrological cycle of the analyzed systems, with the exception of the Paraíba do Sul River. The iron concentration in the Paraíba do Sul River is highly variable with the seasons, and generally, the highest loads are related to the highest water discharge and suspended particulate matter concentrations. Thus, this specific trend is most likely due to the heavy metals associated with the suspended particulate matter (Carvalho et al., 2002).
The statistical analysis of the DO concentrations did not indicate significant differences between the systems located at the two edges of the Atlantic (t-test; α = 0.005; Table 2). However, the comparison between the DO concentrations in the group of larger rivers versus the group of smaller rivers indicated significant differences (t-test; α = 0.05), with a higher mean DO concentration in the systems with smaller discharges (217 μmol kg−1) compared with those with larger discharges (199 μmol kg−1).
Land-Ocean-Atmosphere Carbon Fluxes
The processes involved in the chemical erosion of rocks in the drainage basin also control the discharge transportation of DIC, mainly the processes associated with the hydrolysis of silicate minerals, such as albite, or even those resulting from the dissolution of carbonate minerals, such as calcite. These reactions involve the carbonic acid from the CO2 present in the soil/atmosphere. The CO2 of the soil/atmosphere is transformed into bicarbonate ion during the alteration processes of silicates and carbonates, thus contributing to the river transportation of DIC in the drainage basin through surface and/or underground routes (Wollast and Mackenzie, 1983; Amiotte-Suchet and Probst, 1993). For example, the contribution of the atmospheric CO2 consumed by the rocks through weathering to the formation of fluvial HCO−3 (a major element of the DIC) was greater in the Congo River system compared with the Amazon River (Amiotte-Suchet and Probst, 1993). Furthermore, the Congo River basin has an average population density (20 hab km−2) 5-fold higher than that of the Amazon River basin (4 hab km−2), implying a greater potential for discharge of domestic effluents in the fluvial water body without prior treatment, which in turn may increase the production of HCO−3 (Mortatti et al., 2006).
According to an extensive classification of the lithological composition of the primary hydrographic basins of the world (Amiotte-Suchet et al., 2003), the percentage of carbonate rocks in relation to the drainage area is greatest in the São Francisco River basin (39.8%), followed by the Congo River (10.1%). According to these studies, carbonate rocks constitute only 1.3% of the drainage area of the Orinoco River, which may explain the low average annual DIC concentration observed at the mouth of this river (586 μmol kg−1) compared with the DIC concentrations found for other studied basins (Figure 4A).
The DOC is one of the primary fractions of organic matter that constitute an energy source in aquatic environments, possibly influencing the various biogeochemical processes in which it are involved. Organic carbon enters river systems throughout the course of the river from the adjacent terrestrial ecosystems and/or the fixation of autochthonous carbon (Schlesinger, 1981). Another possible source of DOC is the process of sedimentary desorption, primarily in shallow environments and those natural systems subject to oscillations in the concentration of DO (Krüger et al., 2003). In European eutrophic estuaries, including the Sheldt River (Belgium) and the Thames River (England), the average DOC concentrations range from approximately 5.8–6.8 mg C L−1 (580–680 μmol kg−1), whereas in less eutrophic temperate systems, such as the estuaries of the Gironde (France) and Douro (Portugal) Rivers, the typical DOC concentration values are between 2.5 and 3.1 mg C L−1 (Abril et al., 2002). In tropical estuaries, the typical DOC concentration varies between 2.0 and 15 mg C L−1 (200–1500 μmol kg−1) (Meybeck, 1982). Considering the variations in the DOC and DO concentrations, the estuaries analyzed in this study may be classified as non-polluted systems, with the exception of the Congo River estuary, for which an average DOC concentration of 711 μmol kg−1 was found (Figure 4C). The majority of these systems displayed a direct linear relationship between the DOC concentration and the river discharge (Figure S1, Appendix D, Supplementary Material), with correlation coefficients of r2 = 0.92 (Amazon River), r2 = 0.89 (Orinoco River) and r2 = 0.85 (Congo River). Among the rivers with smaller flows, the Paraíba do Sul (r2 = 0.75), Volta (r2 = 0.96) and São Francisco (r2 = 0.83) displayed a well-defined trend. The Niger River system displayed a less consistent linear trend between the DOC and the discharge (r2 = 0.70), most likely associated with the large number of tributaries along this delta system that are subject to different chemical, geological, biological anthropogenic forcings.
Comparisons between the DOC concentrations and the DO/DIC concentrations in the estuaries did not display consistent relationships for any of the studied estuaries (data not shown here). The negative relationship between DOC and pCO2 and the concentrations of DO greater than 100 μmol kg−1 serve as evidence of a non-eutrophic environment. Furthermore, neither DOC nor DO displayed a relationship with population density, indicating that there are other sources of organic matter. According to the concentrations reported above, these rivers deliver approximately 0.1 Pg C year−1. This total is divided between DIC (0.053 Pg C year−1) and DOC (0.046 Pg C year−1).
The water pCO2 is approximately one to two orders of magnitude greater than the atmospheric pCO2. The high water pCO2 value may be caused by the oxidation of soil organic matter (Salomons and Mook, 1986; Mortatti et al., 2006). Therefore, rivers are typically sources of CO2 to the atmosphere (Richey et al., 1990; Butman and Raymond, 2011; Raymond et al., 2013). However, at the river mouths, there may be an inversion of this natural trend due to intense biological activity that primarily results from the mixing of oceanic waters, which decreases the turbidity, allowing phytoplankton development because of the large supply of nutrients.
The African estuaries are strong sources of CO2 throughout the year (Figures 4E, 5A–C), with CO2 fluxes averaging +10.6 ± 7 mmol CO2 m−2 day−1. The Niger River was the estuarine area showing the highest flux of CO2 to the atmosphere, whereas the Congo River showed the lowest value. The estuarine mixing area of the Niger River is an extensive deltaic area covered by 71% wetland area and including 12 large cities (> 100,000 people) and an average population density of 500 hab km−2, whereas the lower Congo River has 9% wetland area, 2 large cities and an average population density of 100 hab km−2.
At the western boundary of the tropical Atlantic, the mouth of the Amazon River has an annual average flux of +0.6 ± 4.5 mmol m−2 day−1, whereas the mouth of the Orinoco River has an average flux of −0.3 ± 8 mmol m−2 day−1 (Figure 5A). The average CO2 fluxes in the estuaries at low and medium latitudes (23.5–0°S) are approximately +44 ± 29 mmol m−2 day−1 (Chen et al., 2013). However, these estimations do not include the large river systems, such as the Orinoco, Niger and São Francisco Rivers. Another study indicated a value of +57.5 mmol m−2 day−1 of CO2 flux for tidal systems in low latitudes (Laruelle et al., 2010). Recently, two studies indicated that the large rivers, such as the Amazon and Orinoco, generally possess a low pCO2 (<360 μatm) (Cooley et al., 2007; Cai et al., 2011). The estimations presented here demonstrate that these two rivers have negative fluxes throughout the year, primarily during periods of minimal river discharge, when the estuaries behave as sinks for atmospheric CO2 (Figures 4E, 5A). In particular, the estuary of the Amazon River oscillates slightly as a source and sink of CO2 over the course of the year.
In our calculations, the maximum CO2 outgassing was associated with the month of July (+7.6 mmol m−2 day−1), corresponding to the higher river discharge period. The two other estuaries of the western edge (São Francisco and Paraíba do Sul) displayed positive average flow values throughout the year (mean values of +6.3 ± 4 and +14.8±6 mmol m−2 day−1, respectively), characterizing them as permanent sources of atmospheric CO2. These rivers present water volume discharges much smaller than those of the Amazon River (São Francisco: 65 km3 year−1; Paraíba do Sul: 28 km3 year−1; Amazon: 5413 km3 year−1), with population densities 5- and 6-fold greater, respectively, than in the Amazon basin (IBGE, 2011). The large release of CO2 at the mouth of the São Francisco River, primarily during the low discharge period, may be attributed to the combination of climatic characteristics (BSh—hot and arid steppe according to Köppen-Geiger nomenclature), high anthropogenic forcing and the presence of dams in the middle and lower river reaches.
The information compiled in this review contributes to the identification of the primary biogeochemical processes that occur in adjacent coastal and ocean systems. The quantification of carbon fluxes among land, ocean, and atmosphere is essential for understanding the mechanisms driving the natural carbon cycle and for closing the C budget due to ongoing anthropogenic perturbation. Our analysis shows that large tropical rivers flowing to the Atlantic ocean provide 13.2% of the global DIC and 27.3% of the global DOC. Considering the influence of these continental systems, the initiative proposed in this study contributes to the accurate quantification of CO2 input into the atmosphere and to future studies on the oceanic modeling of biogeochemical cycles in the tropical Atlantic.
Author Contributions
All authors (Moacyr Araujo, Carlos Noriega, and Nathalie Lefèvre) reviewed the manuscript.
Conflict of Interest Statement
The authors declare that the research was conducted in the absence of any commercial or financial relationships that could be construed as a potential conflict of interest.
Acknowledgments
This study is a contribution of the INCTAmbTropic – Brazilian National Institute of Science and Technology for Tropical Marine Environments, CNPq/FAPESB Grants 565054/2010-4 and 8936/2011.
Supplementary Material
The Supplementary Material for this article can be found online at: http://www.frontiersin.org/journal/10.3389/fmars.2014.00010/abstract
References
Abril, G., Nogueira, M., Etcheber, H., Cabeçadas, G., Lemaire, E., and Brogueira, M. J. (2002). Behaviour of organic carbon in nine contrasting European estuaries. Estuar. Coast. Shelf Sci. 54, 241–262. doi: 10.1006/ecss.2001.0844
Amiotte-Suchet, P., and Probst, J. L. (1993). Modelling of atmospheric CO2 consumption by chemical weathering of rocks: application to the Garonne, Congo and Amazon basins. Chem. Geol. 107, 205–210. doi: 10.1016/0009-2541(93)90174-H
Amiotte-Suchet, P., Probst, J. L., and Ludwig, W. (2003). Worldwide distribution of continental rock lithology: implications for the atmospheric/soil CO2 uptake by continental weathering and alkalinity river transport to the oceans. Global Biogeochem. Cycles 17, 1–13. doi: 10.1029/2002GB001891
Archer, D. (2005). Fate of fossil fuel CO2 in geologic time. J. Geophys. Res. 110, 1–6. doi: 10.1029/2004JC002625
Bakker, D. C., De Baar, H. J., and De Jong, E. (1999). The dependence on temperature and salinity of dissolved inorganic carbon in East Atlantic surface waters. Mar. Chem. 65, 263–280. doi: 10.1016/S0304-4203(99)00017-1
Bourlès, B., and Caniaux, G. (2013). Ocean Circulation and Climate in the Gulf of Guinea. Project African Monsoon Multidisciplinary Analyses. AMMA-EGEE. Available online at: http://www.coriolis.eu.org/Science/Research-Activities2/Atlantic-Ocean/AMMA-EGEE
Bourlès, B., Gouriou, Y., and Chuchla, R. (1999). On the circulation in the upper layer of the western equatorial Atlantic. J. Geophys. Res. 104, 21151–21170. doi: 10.1029/1999JC900058
Butman, D., and Raymond, P. A. (2011). Significant efflux of carbon dioxide from streams and rivers in the United States. Nat. Geosci. 4, 839–842. doi: 10.1038/ngeo1294
Cai, W. J., Guo, X., Chen, C. T. A., Dai, M., Zhang, L., Zhai, W., et al. (2011). Estuarine and coastal ocean carbon paradox: CO2 sinks or sites of terrestrial carbon incineration? Annu. Rev. Marine Sci. 3, 123–145. doi: 10.1146/annurev-marine-120709-142723
Carvalho, C. E. V., Salomão, M. S. M. B., Molisani, M. M., Rezende, C. E., and Lacerda, L. D. (2002). Contribution of a medium-sized tropical river to the particulate heavy-metal load for the South Atlantic Ocean. Sci. Total Environ. 284, 85–93. doi: 10.1016/S0048-9697(01)00869-5
Chen, C. T., Huang, T. H., Chen, Y. C., Bai, Y., He, X., and Kang, Y. (2013). Air–sea exchanges of CO2 in the world's coastal seas. Biogeosciences 10, 6509–6544. doi: 10.5194/bg-10-6509-2013
Collins, W. J., Bellouin, N., Doutriaux-Boucher, M., Gedney, N., Halloran, P., Hinton, T., et al. (2011). Development and evaluation of an Earth-System model – HadGEM2. Geosci. Model Dev. 4, 1051–1075. doi: 10.5194/gmd-4-1051-2011
Cooley, S. R., Coles, V. J., Subramaniam, A., and Yager, P. L. (2007). Seasonal variations in the Amazon plume-related atmospheric carbon sink. Global Biogeochem. Cycles 21, 1–15. doi: 10.1029/2006GB002831
Cooley, S. R., and Yager, P. L. (2006). Physical and biological contributions to the western tropical North Atlantic Ocean carbon sink formed by the Amazon River plume. J. Geophys. Res. 111, C08018. doi: 10.1029/2005JC002954
Cotrim da Cunha, L., Buitenhuis, E. T., Le Quéré, C., Giraud, X., and Ludwig, W. (2007). Potential impact of changes in river nutrient supply on global ocean biogeochemistry. Global Biogeochem. Cycles 21, 1–15. doi: 10.1029/2006GB002718
Dai, A., Qian, T., Trenberth, K. E., and Milliman, J. D. (2009). Changes in continental freshwater discharge from 1948 to 2004. J. Clim. 22, 2773–2792. doi: 10.1175/2008JCLI2592.1
Dai, A., and Trenberth, K. (2002). Estimates of freshwater discharge from continents: latitudinal and seasonal variations. J. Hydrometeorol. 3, 660–687. doi: 10.1175/1525-7541(2002)003%3C0660:EOFDFC%3E2.0.CO;2
Dale, B., Dale, A. L., and Jansen, J. H. F. (2002). Dino flagellate cysts as environmental indicators in surface sediments from the Congo deep-sea fan and adjacent regions. Palaeogeogr. Palaeoclimatol. 185. doi: 10.1016/S0031-0182(02)00380-2
De Baar, H. J. W., and De Jong, J. T. M. (2001). “Distributions, sources and sinks of iron in seawater, in the biogeochemistry of iron,” in The Biogeochemistry of Iron in Seawater, eds D. R. Turner and K. A. Hunter (Chichester: John Wiley), 123–253.
de Farias, E. G. G., Nobre, P., Lorenzzetti, J. A., Almeida, R. A. F., and Júnior, L. C. I. (2013). Variability of air-sea CO2 fluxes and dissolved inorganic carbon distribution in the Atlantic Basin: a coupled model analysis. Int. J. Geosci. 4, 249–258. doi: 10.4236/ijg.2013.41A022
Dunne, J. P., Gnadesikan, A., Sarmiento, J. L., and Slater, R. D. (2010). Technical description of the prototype version (v0) of Tracers of Phytoplankton with Allometric Zoo- plankton (TOPAZ) ocean biogeochemical model as used in the Princeton IFMIP Model. Biogeosciences Suppl. 7, 3593–3624. doi: 10.5194/bg-7-3593-2010
Dürr, H. H., Meybeck, M., Hartmann, J., Laruelle, G. G., and Roubeix, V. (2011). Global spatial distribution of natural riverine silica inputs to the coastal zone. Biogeosciences 8, 597–620. doi: 10.5194/bg-8-597-2011
Friis, K., Körtzinger, A., and Wallace, D. W. (2003). The salinity normalization of marine inorganic carbon chemistry data. Geophys. Res. Lett. 330, GL015898. doi: 10.1029/2002GL015898
Geyer, W. R., Beardsley, R. C., Lentz, S. J., Candela, J., Limeburner, R., Johns, W. E., et al. (1996). Physical oceanography of the Amazon shelf. Cont. Shelf Res., 16, 575–616. doi: 10.1016/0278-4343(95)00051-8
Hardman-Mountford, N. J., Richardson, A. J., Boyer, D. C., Kreiner, A., and Boyer, H. J. (2003). Relating sardine recruitment in the Northern Benguela to satellite-derived sea surface height using a neural network pattern recognition approach. Prog. Oceanogr. 59, 241–255. doi: 10.1016/j.pocean.2003.07.005
Harrison, J., Caraco, N., and Seitzinger, S. (2005). Global patterns and sources of dissolved organic matter export to the coastal zone: results from a spatially explicit, global model. Global Biogeochem. Cycles 19, GB4S04. doi: 10.1029/2005GB002480.
IBGE. (2011). Tendencias demograficas. Censo 2000. IBGE, 63. Available online at: www.ibge.gov.br
Johns, W. E., Lee, T. N., Beardsley, R. C., Candela, J., Limeburner, R., and Castro, B. M. (1998). Annual cycle and variability of the North Brazil Current. J. Phys. Oceanogr. 28, 103–128. doi: 10.1175/1520-0485(1998)028<0103:ACAVOT>2.0.CO;2
Johns, W. E., Lee, T. N., Schott, F. A., Zantopp, R. J., and Evans, R. H. (1990). The north brazil current retroflection: seasonal structure and eddy variability. J. Geophys. Res., 95, 22103–22120. doi: 10.1029/JC095iC12p22103
Koffi, U., Lefèvre, N., Kouadio, G., and Boutin, J. (2010). Surface CO2 parameters and air–sea CO2 flux distribution in the eastern equatorial Atlantic Ocean. J. Marine Sys. 82, 135–144. doi: 10.1016/j.jmarsys.2010.04.010
Körtzinger, A. (2003). A significant CO2 sink in the tropical Atlantic Ocean associated with the Amazon River plume. Geophys. Res. Lett. 30, 2287. doi: 10.1029/2003GL018841
Krüger, G., Carvalho, C., Ferreira, A. G., Gonçalves, G. M., Truccoloand, E. C., and Schettini, C. A. F. (2003). Dinãmica de Carbono Orgãnico Dissolvido no estuário do Rio Paraíba do Sul, R. J. sob diferentes condições de maré e descarga fluvial. Atlãntica 25, 27–33.
Laruelle, G. G., Dürr, H. H., Lauerwald, R., Hartmann, J., Slomp, C. P., and Regnier, P. A. G. (2013). Global multi-scale segmentation of continental and coastal waters from the watersheds to the continental margins. Hydrol. Earth Syst. Sci. 17, 2029–2051. doi: 10.5194/hess-17-2029-2013
Laruelle, G. G., Dürr, H. H., Slomp, C. P., and Borges, A. V. (2010). Evaluation of sinks and sources of CO 2 in the global coastal ocean using a spatially-explicit typology of estuaries and continental shelves. Geophys. Res. Lett. 37, L15607. doi: 10.1029/2010GL043691
Lee, K., Tong, L. T., Millero, F. J., Sabine, C. L., Dickson, A. G., Goyet, C., et al. (2006). Global relationships of total alkalinity with salinity and temperature in surface waters of the world's oceans. Geophys. Res. Lett. 33, 1–5. doi: 10.1029/2006GL027207
Lefèvre, N. (2009). Low CO2 concentrations in the Gulf of Guinea during the upwelling season in 2006. Mar. Chem. 113, 93–101. doi: 10.1016/j.marchem.2009.01.001
Lentz, S. (1995). The Amazon River Plume during AMASSEDS: spatial characteristics and salinity variability. J. Geophys. Res. 100, 2377–2390. doi: 10.1029/94JC01411
Lohan, M. C., and Bruland, K. W. (2006). Importance of vertical mixing for additional sources of nitrate and iron to surface waters of the Columbia River Plume: implications for biology. Mar. Chem. 98, 260–273. doi: 10.1016/j.marchem.2005.10.003
Ludwig, W., Amiotte-Suchet, P., and Probst, J. L. (1996a). River discharges of carbon to the world's oceans: determining local inputs of alkalinity and of dissolved and particulate organic carbon. C. R. Acad. Sci. II A Sci. Terres Planetes 323, 1007–1014.
Ludwig, W., and Probst, J. L. (1998). River sediment discharge to the oceans: present-day controls and global budgets. Am. J. Sci. 298, 265–295. doi: 10.2475/ajs.298.4.265
Ludwig, W., Probst, J. L., and Kempe, S. (1996b). Predicting the oceanic input of organic carbon by continental erosion. Global Biogeochem. Cycles 10, 23–42.
Macêdo, S. J., Flores Montes, M., and Costa, K. (2009). “Condições hidrológicas da Zona Econõmica Exclusiva (ZEE) do Nordeste do Brasil,” in Meteorologia e Sensoriamento Remoto, Oceanografia Física, Oceanografia Química e Oceanografia Geológica Programa REVIZEE-SCORE Nordeste, V. 1, ed F. Hazin (Fortaleza: Editora Martins e Cordeiro), 104–136.
Marshall Crossland, J. I., Crossland, C. J., and Swaney, D. P. (2001). “Congo (Zaire) River Estuary, Democratic Republic of Congo,” in Estuarine Systems of Sub-Saharanafrica: Carbon, Nitrogen and Phosphorus Fluxes. LOICZ Reports and Studies No. 18, eds V. Dupra, S. V. Smith, J. I. Marshall Crossland, and C. J. Crossland (Texel: LOICZ), 32–36.
Mayorga, E., Seitzingera, S. P., Harrison, J. A., Dumont, E., Beusen, A. H., Bouwmand, A. F., et al. (2010). Global nutrient export from WaterSheds 2 (NEWS 2): model development and implementation. Environ. Model. Softw. 25, 837–853. doi: 10.1016/j.envsoft.2010.01.007
Meybeck, M. (1982). Carbon, nitrogen and phosphorus transport by world rivers. Am. J. Sci. 282, 401–450. doi: 10.2475/ajs.282.4.401
Meybeck, M., and Ragu, A. (1997). Presenting the GEMS-GLORI, a compendium of world river discharge to the oceans. Ass. Hydrol. Sci. Publ. 243, 3–14.
Mortatti, J., Probst, J. L., De Oliveira, H., Paulo, J., Bibian, R., and Fernandes, A. M. (2006). Fluxo de carbono inorgãnico dissolvido no Rio Piracicaba (São Paulo): partição e reações de equilíbrio do sistema carbonato. Geoci~encias 25, 429–436.
Nittrouer, C., and Demaster, J. (1996). The Amazon shelf setting: tropical, energetic, and influenced by a large river. Cont. Shelf Res. 16, 553–573. doi: 10.1016/0278-4343(95)00069-0
Oki, T., and Sud, Y. C. (1998). Design of Total Runoff Integrating Pathways (TRIP)—a global river. Earth Interact. 2, 7–22. doi: 10.1175/1087-3562(1998)002<0001:DOTRIP>2.3.CO;2
Raymond, P. A., Hartmann, J., Lauerwald, R., Sobek, S., McDonald, C., Hoover, M., et al. (2013). Global carbon dioxide emissions from inland waters. Nature 503, 355–359. doi: 10.1038/nature12760
Regnier, P., Friedlingstein, P., Ciais, P., Mackenzie, F. T., Gruber, N., Janssens, I. A., et al. (2013). Anthropogenic perturbation of the carbon fluxes from land to ocean. Nat. Geosci. 6, 597–607. doi: 10.1038/ngeo1830
Reul, N., Fournier, S., Boutin, J., Hernandez, O., Maes, C., Chapron, B., et al. (2013). Sea surface salinity observations from space with the SMOS satellite: a new means to monitor the marine branch of the water cycle. Surv. Geophys. 35, 681–722. doi: 10.1007/s10712-013-9244-0
Richey, J., Hedges, J., Devol, A., Quay, P., Victoria, R., Martinelli, L., et al. (1990). Biogeochemistry of carbon in the Amazon river. Limnol. Oceanogr. 35, 352–371.
Robbins, L., Hansen, M., Kleypas, J., and Meylan, S. (2010). CO2calc - A user-friendly seawater carbon calculator for Windows, Max OS X, and iOS (iPhone). U. S. Geological Survey Open-File Report (St. Petersburg), 2010–1280.
Romanova, V., Köhl, A., and Stammer, D. (2011). Seasonal cycle of near-surface freshwater budget in the western tropical Atlantic. J. Geophys. Res. 116, C07009. doi: 10.1029/2010JC006650
Salomons, W., and Mook, W. G. (1986). “Isotope geochemistry of carbonates in the weathering zone,” in Handbook of Isotope Geochemistry, the Terrestrial Environment, eds P. Fritz and J. C. Fontes (Amsterdam: Elsevier Ltd), 239–270.
Schlesinger, W. (1981). Transport of organic carbon in the world's rivers. Tellus 33, 172–187. doi: 10.1111/j.2153-3490.1981.tb01742.x
Schneider, E., Lindzen, R., and Kirtman, B. (1997). A tropical influence on global climate. J. Atmos. Sci. 54, 1349–1358. doi: 10.1175/1520-0469(1997)054<1349:ATIOGC>2.0.CO;2
Silva, A., Araujo, M., and Bourlès, B. (2010). Seasonal variability of the Amazon River plume during REVIZEE program. Trop. Oceanogr. 38, 76–87.
Smith, S. V., Swaney, D. P., Talaue-mcmanus, L., Bartley, J. D., Sandhei, P. T., McLaughlin, C. J., et al. (2003). Humans, hydrology, and the distribution of inorganic nutrient loading to the Ocean. Bioscience 53, 235–245. doi: 10.1641/0006-3568(2003)053
Subramaniam, A., Yager, P. L., Carpenter, E. J., Mahaffey, C., Bjorkman, K., Cooley, S., et al. (2008). Amazon River enhances diazotrophy and carbon sequestration in the tropical North Atlantic Ocean. Proc. Natl. Acad. Sci. U.S.A. 105, 10460–10465. doi: 10.1073/pnas.0710279105
Vangriesheim, A., Pierre, C., Aminot, A., Metzl, N., Baurand, F., and Caprais, J. C. (2009). The influence of Congo River discharges in the surface and deep layers of the Gulf of Guinea. Deep-sea Res. II Top. Stud. Oceanogr. 56, 2183–2196. doi: 10.1016/j.dsr2.2009.04.002
Wollast, R., and Mackenzie, F. T. (1983). “The global cycle of silica,” in Silicon Geochemistry and Biogeochemistry, ed S. E. Aston (London: Academic Press), 39–76.
Keywords: biogeochemistry, carbon dioxide, tropical Atlantic, large rivers, estuaries
Citation: Araujo M, Noriega C and Lefèvre N (2014) Nutrients and carbon fluxes in the estuaries of major rivers flowing into the tropical Atlantic. Front. Mar. Sci. 1:10. doi: 10.3389/fmars.2014.00010
Received: 19 March 2014; Accepted: 06 May 2014;
Published online: 27 May 2014.
Edited by:
Antonio Tovar-Sanchez, CSIC (IMEDEA), SpainReviewed by:
Gotzon Basterretxea, Consejo Superior de Investigaciones Cientificas, SpainMarta Álvarez, Instituto Español de Oceanografía, Spain
Copyright © 2014 Araujo, Noriega and Lefèvre. This is an open-access article distributed under the terms of the Creative Commons Attribution License (CC BY). The use, distribution or reproduction in other forums is permitted, provided the original author(s) or licensor are credited and that the original publication in this journal is cited, in accordance with accepted academic practice. No use, distribution or reproduction is permitted which does not comply with these terms.
*Correspondence: Moacyr Araujo, Department of Oceanography - DOCEAN, Federal University of Pernambuco, Av. Arquitetura, s/n, Cidade Universitária, Recife, PE 50740-550, Brazil e-mail: moa@ufpe.br