Phytoplankton communities from San Francisco Bay Delta respond differently to oxidized and reduced nitrogen substrates—even under conditions that would otherwise suggest nitrogen sufficiency
 Patricia M. Glibert1*
  Frances P. Wilkerson2
  Richard C. Dugdale2 Alexander E. Parker2,3 Jeffrey Alexander1 Sarah Blaser2 Susan Murasko1,4
- 1Horn Point Laboratory, University of Maryland Center for Environmental Science, Cambridge, MD, USA
- 2Romberg Tiburon Center, San Francisco State University, Tiburon, CA, USA
- 3The California Maritime Academy, Vallejo, CA, USA
- 4Florida Fish and Wildlife Conservation Commission, Fish and Wildlife Research Institute, St. Petersburg, FL, USA
The effect of equivalent additions of nitrogen (N, 30–40 μM-N) in different forms (ammonium, NH+4, and nitrate, NO−3) under conditions of different light exposure on phytoplankton community composition was studied in a series of four, 5-day enclosure experiments on water collected from the nutrient-rich San Francisco Bay Delta over 2 years. Overall, proportionately more chlorophyll a and fucoxanthin (generally indicative of diatoms) was produced per unit N taken up in enclosures enriched with NO−3 and incubated at reduced (~15% of ambient) light intensity than in treatments with NO−3 with high (~60% of ambient) light exposure or with NH+4 under either light condition. In contrast, proportionately more chlorophyll b (generally indicative of chlorophytes) and zeaxanthin (generally indicative of cyanobacteria) was produced in enclosures enriched with NH+4 and incubated under high light intensity than in treatments with low light or with added NO−3 at either light level. Rates of maximal velocities (Vmax) of uptake of N substrates, measured using 15N tracer techniques, in all enclosures enriched with NO−3 were higher than those enriched with NH+4. Directionality of trends in enclosures were similar to phytoplankton community shifts observed in transects of the Sacramento River to Suisun Bay, a region in which large changes in total N quantity and form occur. These data substantiate the growing body of experimental evidence that dichotomous microbial communities develop when enriched with the same absolute concentration of oxidized vs. reduced N forms, even when sufficient N nutrient was available to the community prior to the N inoculations.
Introduction
Two classic tenets in oceanographic phytoplankton ecology are that ammonium (NH+4) is used preferentially to nitrate (NO−3) and that the fate of production on NH+4 and NO−3 differs in terms of the microbial community composition supported. The assimilation of NH+4 is considered to be less energy expensive for the cell, and NH+4 is more easily transported across the cell membrane than NO−3 under both balanced growth or N limited conditions (Raven, 1984). Field efforts have provided considerable evidence of preferential uptake of NH+4 over NO−3 at concentrations of NH+4 exceeding a few μM. McCarthy et al. (1975) illustrated, for the Chesapeake Bay, the relationship between the fraction of total N utilized by natural assemblages and the concentration of ambient NH+4; the uptake of oxidized forms of N never exceeded more than a few percent of the total N ration when NH+4 concentrations exceeded 1–2 μ M. Berman et al. (1984) illustrated the same pattern for Lake Kinneret and, more recently, Dugdale et al. (2007) reported a comparable relationship for San Francisco Bay estuarine phytoplankton.
In an oceanographic context, based on the concept of “new” and “regenerated” production it is generally assumed that NH+4 leads to production that is cycled within the microbial loop, whereas NO−3—based production more often leads to production that supports a food web leading to secondary production as well as export out of the euphotic zone (Dugdale and Goering, 1967; Eppley and Peterson, 1979). Shifts in nitrogen (N) form from NO−3 to NH+4 have been shown in numerous systems to lead to community shifts away from plankton communities dominated by diatoms to those dominated by flagellates, cyanobacteria, and bacteria, in turn, resulting in a shift in composition of higher food webs (e.g., Legendre and Rassoulzadegan, 1995; Glibert, 1998; Mousseau et al., 2001; Berg et al., 2003; Heil et al., 2007). In coastal and estuarine environments, both forms of N can be supplied as “new” nutrients, and therefore the question emerges as to whether N form plays a similar regulatory role in shaping food webs as it does in the oceanic realm. In fact, dichotomous production of different phytoplankton communities with N form under N sufficiency is at odds with another paradigm of phytoplankton ecology; that nutrients cannot be controlling of phytoplankton composition when they are at levels sufficient to saturate the phytoplankton demand. As stated by Reynolds (1999, p. 31), “… there should be no selective effect, consequential upon different affinities of storage capabilities for a nutrient resource, that might distinguish between the potential performances of any pair of planktonic algae, so long as the resource concentrations are able to saturate the growth demand. If that is true, then the ratio between the (saturating) concentration of any of the resources also fails to exert any regulatory significance.” It is thus classically assumed, based on invariant kinetic relationships and cell quotas (e.g., Droop, 1983), that when cells are growing at maximal growth rates (set by culture or environmental conditions of light, temperature, etc.), the total N taken up will be the same whether the cells are provided NO−3 or NH+4 (or urea or other forms of N), and therefore it has also been assumed in field studies and models that growth and phytoplankton biomass should respond similarly regardless of the form of N (e.g., Gowen et al., 1992).
In recent years, the idea that regulation occurs across the entire spectrum of nutrient gradients has begun to take hold, replacing the notion that regulation of phytoplankton growth occurs only at the limiting end of the nutrient spectrum (Glibert et al., 2013 and references therein). Recognition of the complexity and variability in uptake kinetics has contributed to our evolving ideas of regulation by nutrients (Glibert et al., 2013 and references therein). However, because of the persistent focus on the role of “limiting substrates,” the effects of high nutrient concentrations on phytoplankton processes and composition has been significantly understudied. An important question in this context is whether the physiological and ecological consequences of dependence on NO−3 vs. NH+4 remain the same under nutrient sufficiency as under nutrient deficiency.
Moreover, growth in and of itself is not the only ecologically relevant parameter. A clear example of this is many mixotrophic, toxic dinoflagellates have inherently slower growth rates than their non-mixotrophic counterparts, namely diatoms, yet play key roles in ecological functioning (e.g., Flynn et al., 2013). Related important ecological concepts are how the nutrient signal propagates through the food web, whether variance in nutrient constituents can be related to that of primary producers and whether variances in each step of the food chain can be related to each other. While individual nutrients, light availability, and cellular nutrient ratios regulate the growth rate of phytoplankton, the wide plasticity of cell composition in algae under both nutrient limited and nutrient- saturated conditions alters the elemental quality of the algal food available to grazers. What is unclear is whether changes in nutrient quality under conditions of nutrient sufficiency alter the composition of the primary producers that, in turn, have an effect on the composition of the food web.
These questions have a high degree of relevance for the San Francisco Bay Delta ecosystem (Figure 1). This system is one in which the regulatory role of nutrients has been historically dismissed because most nutrients have been assumed to be at levels that saturate (maximize) phytoplankton growth; instead phytoplankton growth has been considered to be regulated primarily by light limitation (Cole and Cloern, 1984; Alpine and Cloern, 1992; Cloern and Dufford, 2005) and biomass is thought to be limited by grazing (Kimmerer, 2004). However, over the past decades there have been large changes in phytoplankton community composition and the role of nutrients in these changes has received increasing scrutiny because nutrient loads are high and increasing (e.g., Wilkerson et al., 2006; Dugdale et al., 2007, 2013; Van Nieuwenhuyse, 2007; Glibert, 2010; Glibert et al., 2011, 2013). One of the major sources of nutrients to the Bay Delta is sewage effluent (Van Nieuwenhuyse, 2007; Jassby, 2008), with one of the largest wastewater treatment plants (WWTP) discharging N primarily as NH+4 at the rate of 14–15 tons day−1, and at concentrations that have increased from ~10 mg L−1 when the plant came on line in the early 1980s to > 20 mg L−1 in the 2000s (Glibert, 2010; Glibert et al., 2011). Approximately 90% of the total N in northern San Francisco Estuary originates from this single point source (Jassby, 2008).
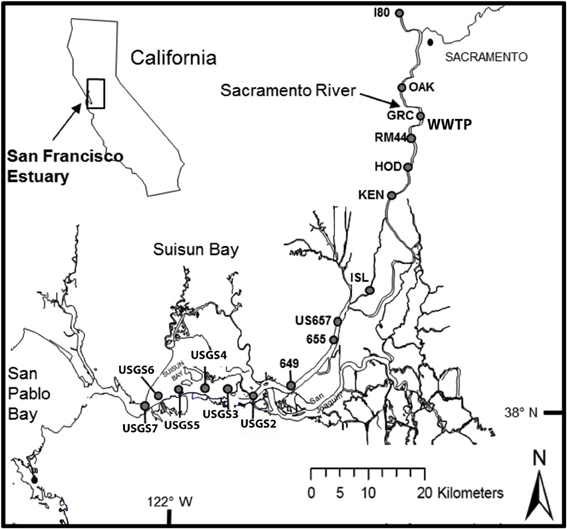
Figure 1. Locations of sampling sites for transects conducted along the Sacramento River to Suisun Bay (San Francisco Bay Delta) in September 2011, 2012 and in March 2012, 2013. At sites Garcia Bend and USGS4, additional samples were collected for experimental manipulations, as described in text.
Although nutrient effects have been dismissed as controlling factors in San Francisco Estuary in favor of factors such as light and grazing, the more subtle ecological impacts of NH+4 loading and the importance of changes in NO−3:NH+4 in phytoplankton succession are beginning to be considered as important factors that may have contributed to historical changes seen in the food web (e.g., Dugdale et al., 2007, 2012; Glibert, 2010, 2012; Glibert et al., 2011; Parker et al., 2012a,b). Not only have dominant species changed in this system, but rates of primary production have also declined over the course of the past few decades (e.g., Jassby et al., 2002; Kimmerer et al., 2012). In particular, increased NH+4 loading relative to NO−3 in conjunction with changes in nitrogen (N) and phosphorus (P) stoichiometry are now thought to be related to the long-term changes in the food web because of their effects on the dominant primary producers (Dugdale et al., 2007, 2012; Glibert, 2010; Glibert et al., 2011). While phytoplankton productivity throughout most of the year is, in fact, supported by NH+4, productivity on NH+4 is reduced relative to that of NO−3 due to differences in cellular metabolism of NH+4 vs. NO−3 and the resulting phytoplankton community that differentially develops under these different substrates (Dugdale et al., 2007; Parker et al., 2012a,b; Glibert et al., 2014). The reduction in N productivity with increasing NH+4 availability is a function of NH+4 repression of NO−3 uptake on the short time scale (minutes to hours), followed by differential growth of different phytoplankton taxa on a longer time scale (days to weeks). Much has been written about the inhibition or repression of NO−3 uptake by NH+4 (Dortch, 1990); in general, with increasing concentrations of NH+4, the cell down-regulates its ability to take up or assimilate NO−3. The typical response of NO−3 uptake in the presence of increasing NH+4 concentrations is a near complete suppression and examples of this relationship in the literature abound (e.g., Caperon and Ziemann, 1976; Collos et al., 1989; Dortch et al., 1991; Flynn, 1999; Lomas and Glibert, 1999a,b; Maguer et al., 2007; L'Helguen et al., 2008). While the relationship between NH+4 availability and NO−3 uptake and transport suppression is robust, it is now recognized that down-stream metabolites, not NH+4 per se, are responsible for this down-regulation (e.g., Flynn et al., 1997). In most algae, the regulation is via the size of the glutamine pool, and such regulation has been incorporated into biochemical models that simulate the interactions of NH+4 and NO−3 in “generic” algae based on a cell quota approach (e.g., Flynn and Fasham, 1997; Flynn et al., 1997).
Here we directly tested the effects of alterations of nutrient form on phytoplankton composition and rates of N-based productivity for samples collected from the freshwater and low salinity reaches of San Francisco Estuary. Understanding the factors changing this ecosystem is crucial to water management, but understanding how aquatic trophic cascades are modified by nutrients and other factors is a key scientific question and a major challenge more broadly (e.g., Carpenter and Kitchell, 1993; Polis and Strong, 1996). As part of a broader study of the effects of nutrient forms and light on phytoplankton, we report on a series of enclosure experiments in which samples were collected from different locations along a river to bay transect during different seasons, enriched with NH+4 or NO−3 and tracked over a period of several days when incubated under different light treatments. We focus only on the effects of additions of the inorganic nutrient forms of NH+4 and NO−3 because of the direct relevance of these forms to the potential effect on the composition and productivity of primary producers that might be expected as a result of management actions to increase nitrification in WWTP processing of effluent in the coming years. We specifically hypothesized that a greater proportion of diatoms would be produced when samples were enriched with NO−3 and that a greater proportion of cyanobacteria and other NH+4-tolerant flagellates would be produced when enriched with NH+4; and that if samples were indeed light limited, a lower rate of production overall would be evident at reduced light levels of incubation. We expected these changes even against a background of elevated nutrient concentrations in the ambient environment. These experiments supplement and extend previous “enclosure” experiments conducted in Bay Delta waters (Dugdale et al., 2007; Parker et al., 2012a) in which N depletion trends and N uptake rates were measured on samples that did not receive supplement nutrient enrichments.
Materials and Methods
Site Description and Sample Collection
The San Francisco Estuary consists of South San Francisco Bay, Central Bay, San Pablo Bay, Suisun Bay, and the Sacramento-San Joaquin Bay Delta, a complex of rivers, channels, wetlands, and floodplains (Atwater et al., 1979; Nichols et al., 1986; Muller-Solger et al., 2002). The upper estuary is an inverse delta and receives the majority of its flow from the Sacramento and San Joaquin Rivers (Figure 1, Atwater et al., 1979; Nichols et al., 1986). The Sacramento River is the larger river, contributing ~80% of the freshwater to the system (Jassby, 2008); the upper reaches of the Sacramento River drain 61,721 km2, while the upper San Joaquin River drains 19,030 km2 (Sobota et al., 2009). With exception of the deeper Central Bay, the mean depths of the various sub-embayments in the estuary range from 3.3 to 5.7 m (Kimmerer, 2004).
Samples were collected from the R/V Questuary during 4 seasons over 2 years, September 2011, March 2012, September 2012, and March 2013. During each period of sampling, a transect from the upper Sacramento River to Suisun Bay was conducted, with sites beginning above the Sacramento WWTP and ending at Suisun Bay (Figure 1). Each survey was conducted during outgoing tide, although the absolute phase of the tide was not the same for each sampling period. At each station, a Seabird Electronics SB-32 rosette mounted with 6, 3-L Niskin bottles and fitted with a Seabird SBE-19 plus CTD was deployed to collect vertical profiles of temperature and salinity and to collect near-surface water samples.
At each site, samples were immediately filtered on board (precombusted, 2 h 450°C, Whatman GF/F filters) for the collection of chlorophyll a (chl a), and accessory pigments (accessory pigments were not collected in September 2011). Filters were immediately frozen and returned to the laboratory for analysis. The filtrate was also stored on ice, returned to the laboratory and immediately analyzed for NH+4 and NO−3 (within 3 h). Aliquots of sample were also frozen for subsequent analysis of PO3−4 as well as silicate (Si(OH)4) and organic nutrient forms of N and P; (Si(OH)4 and organic nutrient data not shown).
During September 2011 and March 2012, over 400 L of water were also collected from the site identified as Garcia Bend (GRC), which is located just above the Sacramento WWTP, and during September 2012 and March 2013 similar bulk collections of water were undertaken at Garcia Bend as well as in Suisun Bay at site USGS4. This water was pre-screened through 150 μm mesh to remove large grazers, held in large carboys, shaded and returned to the shore-based laboratory at the end of the day.
Experimental Treatments
All large-volume samples collected from Garcia Bend and USGS4 were held overnight at ambient temperatures at the Romberg Tiburon Laboratory and were enriched with different N substrates by midmorning the following day. In “cubitainers” of 20 L volume, samples were enriched with either 40 μM (September 2011, March 2012) or 30 μM (September 2012, March 2013) NO−3 or NH+4, with cubitainers from each site being enriched with each N form in parallel. The level of N enrichment was targeted to raise the total available N to a value >40 μM, representing a change that was >2-fold larger than that observed in NH+4 along the riverine transects. The cubitainers were then placed in large (1000 L), water-filled enclosures to maintain ambient temperatures. They were covered with either a single layer of neutral density screening to simulate 60% neutral irradiance (high light) or with 3 layers of neutral density screening to simulate 15% of natural irradiance (low light). The overall experiment was thus a 2 × 2 factorial, with 2 N sources and 2 light treatments. Cubitainers were incubated under these conditions for up to 5 days.
On a daily basis at midmorning, subsamples were collected from each cubitainer and immediately filtered as described above for chl a, accessory pigments and ambient nutrient concentrations. Samples for chl a were subsequently extracted as described below, while samples for accessory pigments (collected only on selected days) were flash frozen in liquid N2 until subsequently analyzed. The filtrates were also frozen for nutrient analysis.
At the same time subsamples were collected for nutrient and pigment analysis, subsamples from the cubitainers were also collected on days 1–2 (September 2011, March 2012) and on days 1–5 (September 2012, March 2013) for determination of the rates of uptake of NH+4 and NO−3. Sufficient sample was removed from each cubitainer to prepare 3, 200 mL incubation bottles to which an additional 30 μM-N were added to each, but each bottle was enriched with a different form of 15N- labeled substrate: NH+4, NO−3 or urea. These 15N enrichments were at levels that were assumed to be more than sufficient to saturate the N uptake system (these enrichments supplemented the initial NH+4 or NO−3 enrichment of the cubitainers). These enrichments were designed to be large, pulsed additions and were not representative of “trace” uptake. The goal was to characterize how the phytoplankton responded to a pulsed addition, analogous to the interception of a plume of effluent in a river. Each bottle was immediately returned to the enclosures under screening that was the same as the cubitainers from which the respective samples were taken. Incubations for 15N uptake were ~1 h, after which time the bottles were removed from the enclosure, immediately filtered onto Whatman precombusted GF/F filters and frozen. Samples were later analyzed by mass spectrometry as described below.
Analytical Protocols
Ambient nutrients were analyzed using manual colorimetric assays (NH+4) and autoanalysis techiques (NO−3, PO3−4, Si(OH)4). Concentration of NH+4 was analyzed according to Solórzano (1969). Samples from the transects were never frozen, while daily samples from the cubitainers were frozen. Concentration of NO−3 was analyzed on samples from the transects that were also never frozen, using a Bran and Lubbe Autoanalyzer II according to Whitledge et al. (1981) and Bran and Luebbe (1999c) Method G-172-96, while cubitainer samplings for NO−3 as well as PO3−4 and silicate (Si(OH)4) were analyzed on the same instrument after a period of frozen storage, although there was a 24 h thawing period before analysis (MacDonald et al., 1986). Methods for these latter analytes were Bran and Luebbe (1999b) Method G-175-96 and for Si(OH)4, Bran and Luebbe (1999a) Method G-177-96. Samples for chl a were analyzed using a Turner Designs Model 10-AU fluorometer following a 24 h 90% acetone extraction at 4°C (Arar and Collins, 1992), and a 10% hydrochloric acid addition to correct for phaeophytin. The fluorometer was calibrated with commercially available chl a (Turner Designs).
Accessory pigment samples were frozen at −80°C until analysis, approximately 6 weeks after sampling. They were processed by High Performance Liquid Chromatograph (Agilent) following the protocols of Van Heukelem and Thomas (2001). All 15N analyses were done on a Sercon mass spectrometer following drying of the filters and encapsulation into tin capsules.
Calculations and Statistical Analyses
For each cubitainer for each day of incubation, the daily change in inorganic N (typically removal) and the daily change in chl a or accessory pigments (typically increase) were calculated and compared, thus giving a daily chl a or pigment yield per unit N consumed. In sum, accounting for all sites and seasons, for each light level, there were 22 pairs of N treatments for which such calculations were possible for chl a. Given that accessory pigments were only collected on selected days, there were 14 such paired treatments.
For each incubation irradiance condition and each N form, all data from all dates of sampling and stations were combined. Pearson correlation analysis was used to compare the strength of the response in each pigment in relation to the change in total DIN. The strength of the correlation (Pearson correlation coefficient, r) and the rates of change (slopes or regression coefficients) for all treatments (high vs. low irradiance with NH+4 or NO−3 enrichment) were calculated. Significance of the regressions is reported for both p < 0.05 and p < 0.01 levels.
For the 15N analyses conducted on each day for each cubitainer, rates were calculated as biomass-specific uptake rates, V (h−1), using the following formula (Dugdale and Wilkerson, 1986; Glibert and Capone, 1993):
where atom % sample is the 15N enrichment in the sample, atom % normal is the natural 15N background enrichment, and 15N atom % enrichment is the initial isotope enrichment based on added plus ambient substrates (Glibert and Capone, 1993). Given the elevated concentration of 15N made to these experiments, these rates are assumed to be representative of Vmax and no isotope dilution correction was necessary (Glibert et al., 1982; Glibert and Capone, 1993). The individual rates for NH+4, NO−3 and urea were calculated and these rates were summed. The summation is provided as a physiological index; it does not represent the actual uptake by the cells but rather the potential for ∑N uptake should all forms of N be provided at or near saturating conditions. These summed rates were compared across N and light treatments for each day of incubation of the cubitainers. When summed, the values are referred to as N-based productivity rates (Wilkerson et al., 2006); here they represent maximal N-based productivity rates. Data were analyzed using a 2-Way ANOVA.
Results
Ambient Environmental Conditions and Riverine Transects
Changes in nutrient concentration and form were apparent in all transects (Figures 2A–D). In all but March 2012, a large (20–30 μM-N) increase in NH+4 was noted just south of the Garcia Bend site, which is also just south of the WWTP discharge site. A smaller peak (~7 μM-N) in NH+4 was noted during March 2012 in the same river region. While increased concentrations of NH+4 were detected in all cases below the Garcia Bend site, it is recognized that our surface sampling does not capture the peak of the effluent plume. While it is not known why the March 2012 peak was smaller than that observed during the other seasons, the WWTP does alter its discharge, even holding it for several days without discharge, depending on conditions at the plant at the time. As water moved from the Sacramento River toward Suisun Bay, the NH+4 peaks in September 2011, 2012, and March 2013 dissipated, but near equivalent increases in NO−3 were noted, suggestive of nitrification. Increases in PO3−4 downstream were also noted. In March 2012, concentrations of NH+4 did not decrease downstream, but nevertheless concentrations of NO−3 increased significantly.
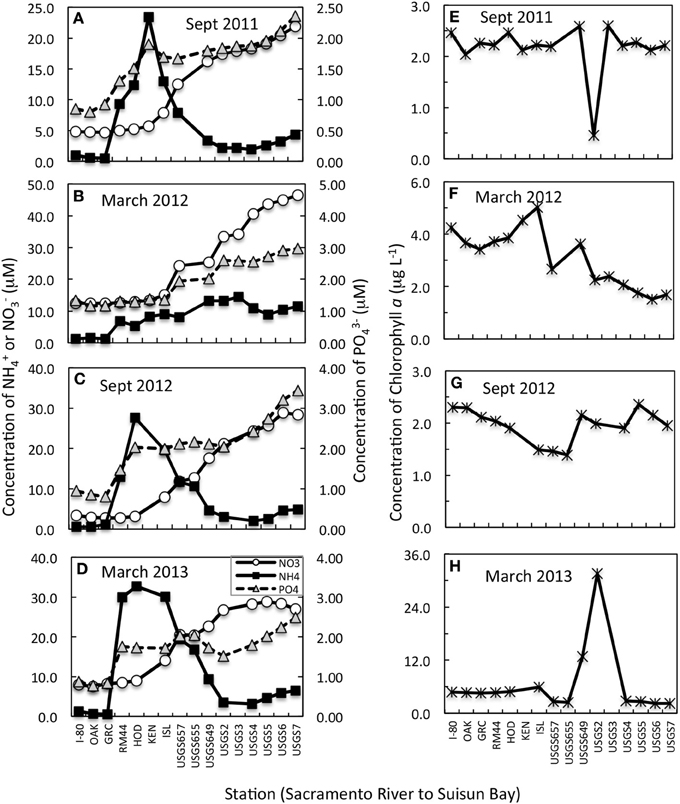
Figure 2. (A–D) Concentration changes in NH+4, NO−3 (primary Y axis) and PO3−4 (secondary Y axis) from the upper Sacramento River to Suisun Bay for transects conducted on dates indicated. All data shown are from near surface samples. Note that the scales change from panel to panel but the relationship to the primary to secondary axis remains the same for all panels. (E–H) Concentration changes in chlorophyll a from the upper Sacramento River to Suisun Bay for transects conducted on dates indicated.
The trends in chl a along the river to bay transects were highly variable from sampling period to sampling period (Figures 2E–H). In general, concentrations of chl a were < 3 μg L−1 regardless of sampling site or time period, but there was one important exception to this trend. In March 2013, all chl a-values were higher by a few μg L−1 than observed in previous time periods and at site USGS2, a spatially limited phytoplankton bloom was found, with chl a-values reaching 30 μg L−1 (Figure 2H). Interestingly, in September 2011, the same USGS2 site had a depression in chl a-values (from ~2.5 to 0.5 mg L−1) compared to the other sites along the transect (Figure 2E).
Large changes were observed in accessory pigments along the riverine to bay transect, indicative of changes in species composition (Figure 3; note that no accessory pigment data are available for September 2011). Whether the accessory pigment data are expressed in relation to concentrations of chl a (Figures 3A,C,E), or in relation to concentrations measured at Garcia Bend (located above the WWTP; Figures 3B,D,F), the pattern is fundamentally the same: decreased concentrations of fucoxanthin, suggestive of fewer diatoms, and increased concentrations of alloxanthin, suggestive of more cryptophytes. In all cases, fucoxanthin declined from the upper Sacramento River to Suisun Bay, although secondary peaks in fucoxanthin:chl a were noted in Suisun Bay in both March 2012 and September 2012 (Figures 3A,C). Alloxanthin increased toward Suisun Bay relative to both chl a and relative to values at Garcia Bend in all transects. In September 2012, an increase in zeaxanthin (generally indicative of cyanobacteria) toward Suisun Bay was also noted. Chl b had a pronounced increase toward Suisun Bay in March 2013 when viewed both in relation to chl a and relative to values determined at Garcia Bend (Figures 3E,F).
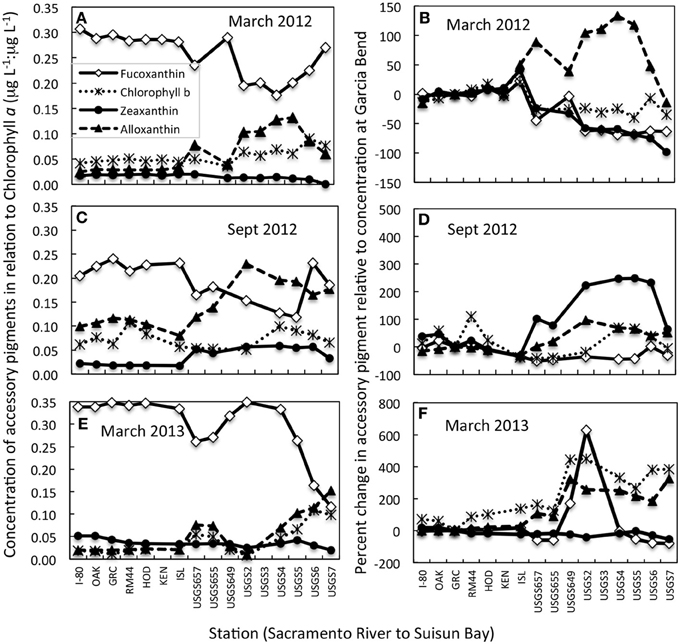
Figure 3. Changes in concentrations of accessory pigments from the upper Sacramento River to Suisun Bay for transects conducted on dates indicated. (A,C,E) Data are expressed as concentrations of accessory pigment relative to concentrations of chlorophyll a. (B,D,F) Data are expressed as the percent change in the accessory pigment relative to concentrations of the same pigments at the Garcia Bend station. All data shown are from near surface samples. Note that the scales change from panel to panel.
Samples used in the N enrichment experiments were collected during periods in which temperatures ranged over a gradient from 11 to 19.6°C (Table 1) and salinities were fresh (all salinities <5.9, and most ≤1.0). Secchi depths reflected the turbid conditions of river and bay, with values ranging from 0.3 to 1.3 m, but consistently the upper Sacramento River had higher light penetration than did Suisun Bay (Table 1). Ambient chl a-values did not vary by much more than a factor of 2 (1.91–4.60 μg L−1) across the variable spatial and temporal sampling. Nutrient concentrations for all inorganic N and P forms were never at levels reflective of depletion; NH+4 concentrations ranged from 0.50 to 3.2 μM-N, NO−3 concentrations ranged from 2.70 to 28.2 μM-N, and PO3−4 values ranged from 0.80 to 2.42 μM-P (Table 1). Molar ratios of DIN (sum of NO−3 and NH+4) to PO3−4 were less than the canonical Redfield ratio for all sampling sites except for Suisun Bay in March 2013 when the value was 17.5. Values of Si(OH)4 for all samples (not shown) were in the several 100 μM-Si range for all samples collected.
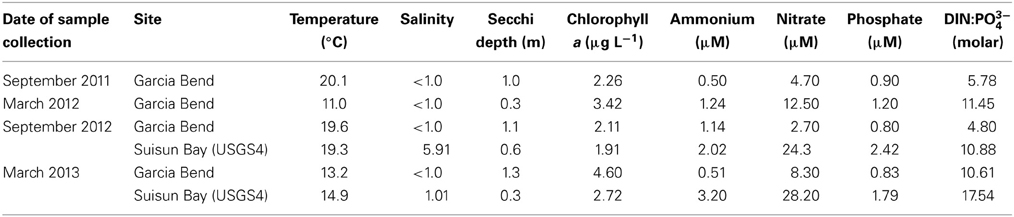
Table 1. Ambient environmental conditions of sites sampled in the San Francisco Bay Delta from which samples were subsequently incubated under varying N and light conditions.
Responses in Phytoplankton Pigments to Different forms of N and Irradiance Levels
In the enrichment experiments, when all data from all sites and seasons were compiled, a linear relationship emerged when the daily rate of change in chl a was compared to the daily change in N (Figures 4A,D; r > 0.66 in all cases; Table 2). However, the rate of change in chl a differed significantly for those samples enriched with NH+4 compared to those enriched with NO−3 when these samples were incubated under low light conditions. Those that were enriched with NH+4 under low light yielded ~1 μg chl a:1 μM N consumed; for those that were enriched with NO−3, the chl a yield was ~2 μg chl a:1 μM N consumed (Figures 4A,C; Table 2; significance of t-statistic for regression comparison <0.01). The chl a yield for all high light treatments was ~1 μg chl a:1 μM N.
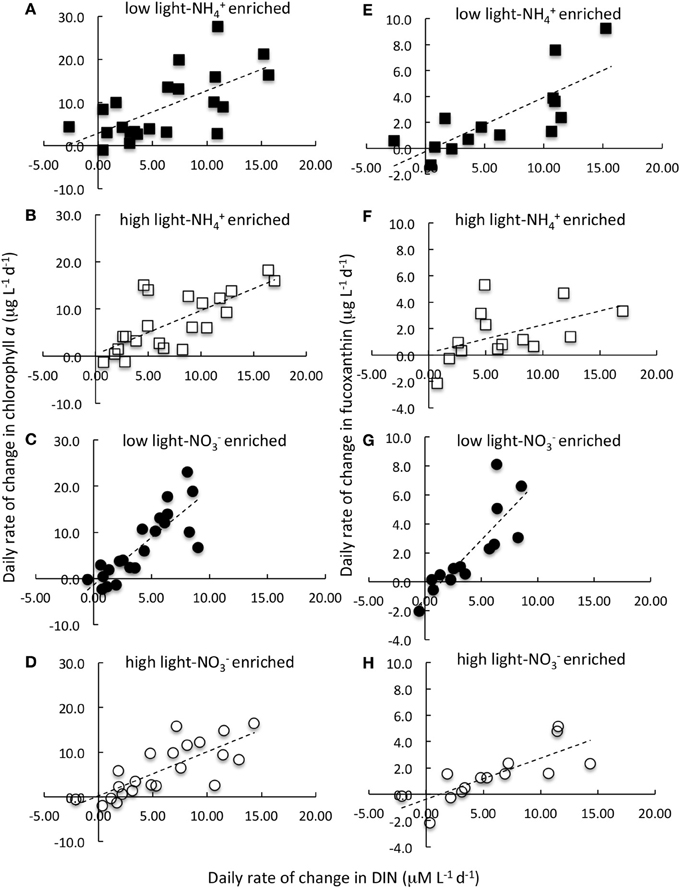
Figure 4. Daily rate of change in chlorophyll a (A–D) and in fucoxanthin (E–H) in relation to daily rate of change in the dissolved inorganic nitrogen (DIN) concentration. Data are the composite of all N-enrichment experiments conducted on samples collected from the Sacramento River (Garcia Bend) and Suisun Bay (USGS4) in September 2011, 2012, and in March 2012 and 2013. Samples were enriched with NH+4 (A,B,E,F; squares) or NO−3 (C,D,G,H; circles) and incubated at 15% of ambient irradiance (A,E,C,G; filled symbols) or 60% of surface irradiance (B,F,D,H; open symbols). Nitrogen enrichment levels and other experimental details are described in text. Lines represent linear regressions. Note that of all the pigments measured, only fucoxanthin is illustrated here. Regression statistics and comparisons for these data as well as for other pigments are given in Table 2 and Figure 5.
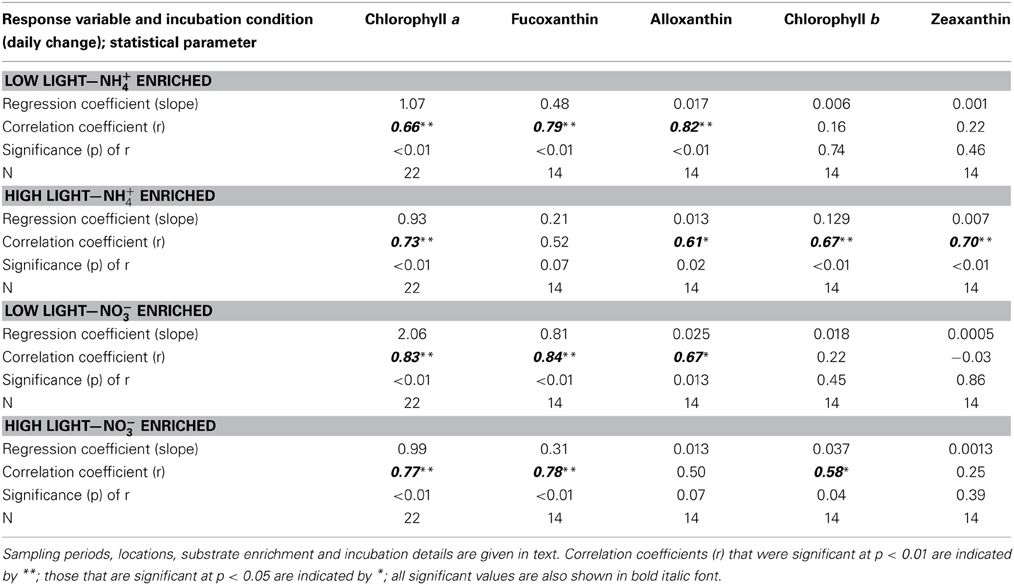
Table 2. Comparison of correlation statistics for trends in the daily rate of change in major phytoplankton pigments (μg L−1 d−1) in relation to the daily rate of change in total dissolved inorganic N (DIN, μM d−1) for samples from San Francisco Bay Delta enriched with NH+4 or NO−3 and incubated at high or low light levels.
When the daily yields in individual pigments are compared in the analogous way, the responses were quite varied (Note that the responses for fucoxanthin are illustrated in Figures 4E–H; the slopes of the regression lines for all pigment changes in relation to changes in N are compared in Figure 5; Table 2 compares all regression statistics for all pigments). For fucoxanthin, as with chl a, there was approximately a doubling of the yield per unit N consumed for samples that were enriched with NO−3 and incubated under low light compared with the parallel samples incubated with NH+4 under low light (Figures 4E,G, 5, Table 2; significance of t-statistic for regression comparison <0.05). Interestingly, the relationship between the daily yield of fucoxanthin and daily change in NH+4 for samples held under high light was not significant (r = 0.52; Table 2, Figures 4, 5). When changes in fucoxanthin were compared to changes in chl a, all treatments were significantly related and not different from each other (r = 0.72–0.89; not shown).
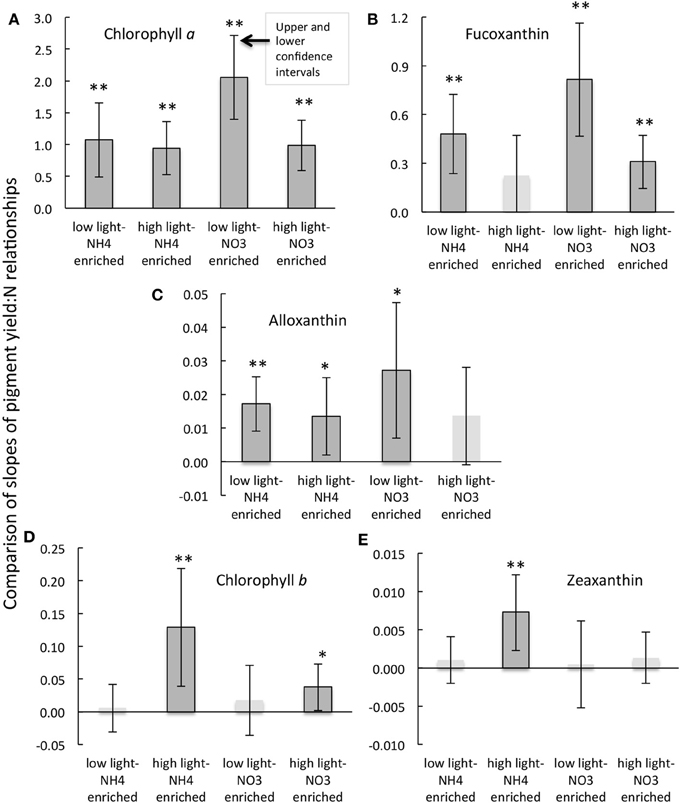
Figure 5. Comparisons of the slopes and the upper and lower confidence intervals (at the 5% significance level) for the regressions of the daily rate of change in pigment as a function of the daily rate of change in dissolved inorganic N (A–E) for the experimental treatments indicated and as described in text. Regressions that were significant at the p < 0.01 level are indicated by **; those that are significant at the p < 0.05 levels are indicted by *. Note that slopes for regression that were not significant are shown as pale bars without outlines and their confidence intervals are given for reference purposes only. Further details of the correlation statistics are given in Table 2.
The response of alloxanthin to change in N form differed somewhat from those of the aforementioned pigments. In this case, significant increases in relation to changes in N were observed for samples enriched with NH+4 and incubated under both high or low light as well as for samples enriched with NO−3 and incubated under reduced irradiance, but the relationship was not significant for samples enriched with NO−3 and incubated under high light (r = 0.61–0.82 vs. 0.50; Figure 5, Table 2). Highest yields in alloxanthin were found for samples incubated with NO−3 at low light (Figure 5). All alloxanthin responses were significant when compared to changes in chl a (r > 0.64; not shown).
The responses of chl b and zeaxanthin were quite different from those of fucoxanthin and alloxanthin. For these pigments, the most significant relationships in terms of the change in pigment in relation to change in N were observed in the treatments that were enriched with NH+4 and incubated at high light (r = 0.67 and 0.70, respectively; Figure 5, Table 2; significance of t-statistic for regression comparisons of both pigments at high vs. low light <0.01). In the case of chl b, but not zeaxanthin, samples incubated with NO−3 and also held under high light were significantly related to the change in N (Table 2). Additionally, whereas there was a relationship between change in N and change in zeaxanthin for the NH+4 and high light treatment, no such relationship was observed for the change in zeaxanthin in relation to the change in chl a (r < 0.5, p > 0.05, not shown) suggestive that under these conditions the proportional change in zeaxanthin was greater.
Biomass-Specific N Productivity Rates
In contrast to the classic assumption that when provided nutrients in sufficiency, rates of uptake should not vary by N form, here it was found, based on 15N uptake measurements, that maximal N-based biomass-specific productivity rates (Vmax h−1) were consistently higher for those samples taken from experimental cubitainers that were initially enriched with NO−3 compared to those initially enriched with NH+4 (Figure 6; see SI for fractional uptake of each N form). [Note that the same pattern emerges if instead of summed rates, the average uptake rates are reported]. The directionality of the different rates between samples initially enriched with NO−3 and those with NH+4 was similar to the differences in total chl a and fucoxanthin, which also trended higher under NO−3 enrichment than with NH+4 enrichment. These differences were due overwhelmingly to the depression in rates of Vmax NO−3 in those treatments originally enriched with NH+4. Rates of Vmax NO−3 were depressed by 88–96% in September 2011, 54–73% in March 2012, 69–95% in September 2012 and 58–93% in March 2013 in treatments enriched with NH+4 relative to treatments enriched with NO−3 initially. Rates of Vmax NH+4, or Vmax urea, however, were not proportionately higher to compensate, and therefore total rates were lower. Thus, every one of the 14 experiments had rates of summed uptake for the NO−3 enrichments that were higher than for the NH+4 enrichments- even though in each case the pairs of treatments had exactly the same amounts of added N. Averaging all data from all dates, the rates of summed Vmax (and the same is the case for average Vmax) for the NO−3 enrichment treatments were 65% higher than those of the NH+4 enrichment treatments. A Two-Way ANOVA confirmed that there were significant effects with regard to substrate form (p < 0.0001) but not with light for either substrate.
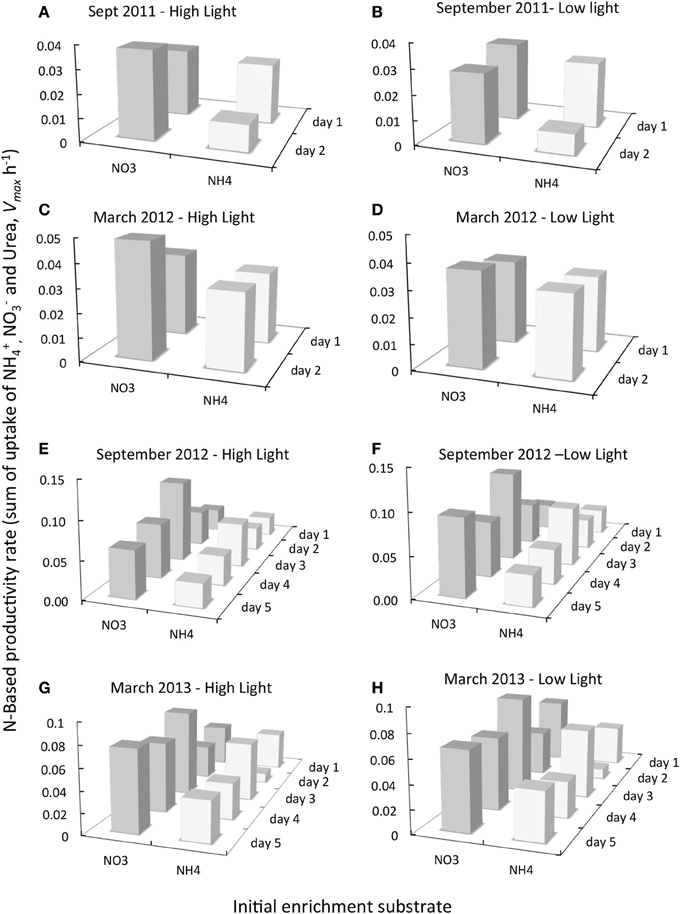
Figure 6. Comparison of the daily change in N-based productivity rate (Vmax h−1) for samples removed from experiments initially enriched with NO−3 (dark gray bars) or NH+4 (pale gray bars) and subsequently incubated with saturating levels of 15N- NO−3, NH+4 and urea as described in text for dates indicted. All experiments shown are for samples originally collected from Garcia Bend. 15N uptake rates for all substrates were summed for each day of experimentation and for each treatment from which the samples were obtained [only 2 days of these 15N experiments were conducted in September 2011 and March 2012 (A–D), but 5 days of 15N experimentation were conducted in September 2012 and March 2013 (E–H)]. The initial enrichment substrate (NO−3 or NH+4) is given along the X axis. The day of sampling of the experiments is also indicted.
Discussion
The range of nutrient values from the riverine transects described here (Figure 2) are consistent with previously reported nutrient values in the Sacramento River in 2005 (Parker et al., 2012a,b). Previous studies have also observed a large step increase in NH+4 downstream of the WWTP, leading to peak values in the central region of river for the stage of tide on which these transects were made. The values reported herein are also similar to those previously reported for Suisun Bay (site USGS6) in 2002, where throughout the year NO−3 concentrations values were >30 μM-N, NH+4 values ranged from 1.3 to 16 μM-N, PO3−4 values were >2 μM-P, and Si(OH)4 values were >200 μM-Si (Wilkerson et al., 2006). Values of chl a along the transects (Figure 3) were also consistent with previously reported ranges for this region of the estuary for most years (Wilkerson et al., 2006; Kimmerer et al., 2012; Parker et al., 2012a). Both previous studies reported ambient chl a in Suisun Bay to be in the 1–2 μg L−1 range for most of the year (occasional blooms excepted), and long-term data covering the period from 1975 to 2005 also show that Suisun Bay chl a-values tend to be <5 μg L−1 on average. Because of the seeming abundance of ambient nutrients in contrast to the chl a levels accumulated, this system is typically characterized as a High Nutrient Low Growth or Low Chlorophyll (HNLG or HNLC) region (Cloern, 2001; Yoshiyama and Sharp, 2006; Dugdale et al., 2007). Suppression of productivity by elevated NH+4 levels is thought to be a major factor contributing to the low growth/low biomass in this system.
The values of chl a yield found here ranged from ~1 μg chl a:1 μM N for both nutrient enrichment conditions at high irradiance levels as well as for reduced irradiance with NH+4 enrichment, but about twice that value, ~2 μg chl a:1 μM N, for samples enriched with NO−3 and held under reduced irradiance. These values are comparable to previous values of chl a yield reported from a range of environments (Gowen et al., 1992; Edwards et al., 2005). Gowen et al. (1992) reported a range from 0.25 to 4.4 μg chl a:1 μM N, with a median of 1.1 μg chl a:1 μM N for Scottish coastal waters, and a similar range was found by Edwards et al. (2005) in studies of a coastal lagoon and of the coast of Portugal. Although both investigators compared various environment or seasonality in their assessments of chl a yields, and recognized that different phytoplankton communities likely contributed to the differences in such yields, neither reported the effects of changing forms of N nor related their findings to variable N forms.
Phytoplankton ecologists have long known that NH+4 is energetically favored over NO−3 (Raven, 1984) and thus it is thought to be universally preferred as an N substrate. The evidence for NH+4 preference is several-fold, much of this understanding grounded in the classical physiological literature, and, importantly, in studies where N was the limiting nutrient. In culture experiments where both NH+4 and NO−3 are supplied together, as well in experimental mesocosm experiments in which both substrates are available, the typical pattern is for NH+4 to be drawn down first, and only then is NO−3 used in any substantial way, as evidenced by disappearance from the water or media provided. However, except in culture studies, rarely are natural phytoplankton in an environment in which only one form of N is available, and this condition is particularly rare in nutrient-enriched or eutrophic environments. More typically in such conditions, a cell is balancing the uptake of both oxidized and reduced forms of N. Importantly, different phytoplankton functional groups differ in their ability to take up and assimilate different forms of N, and molecular genetics on NO−3 transporters confirm that there are clear differences between the major algal groups (Song and Ward, 2007). Diatoms tend to have more copies of high affinity transporters for NO−3, while some picoplankton and cyanobacteria may not have any (Lindell and Post, 2001; Moore et al., 2002; Song and Ward, 2007). Moreover, for many cyanobacteria, the high affinity transporter for NH+4 is not regulated at all, being constitutively expressed (Lindell and Post, 2001). Similarly, NO−3 reductase shows a great deal of genetic diversity across species groups. The net effect of these metabolic differences is that, as a generality, diatoms appear to be NO−3 specialists, while many cyanobacteria are NH+4 specialists (Lomas and Glibert, 1999a,b, 2000).
The concept of differential rates of production under NH+4 vs. NO−3 enrichment, even when the total load remains the same, is not necessarily intuitive and therefore has not traditionally been appreciated in nutrient-enriched systems, even though it is well accepted in oceanic environments. In order to have effects on higher trophic levels, it is often assumed that the levels of NH+4 must be in the range that causes direct toxicity, and typically that is considered only relevant when NH3, rather than NH+4 is the dominant form. However, any environmental factor that affects the availability of substrates, the nutritional state of the cell, the regulation of photosynthesis, or the rate of enzyme activity will affect the rates by which NH+4 or NO−3 are transported and/or assimilated. Ultimately these differences play a regulatory role in the community composition. The more subtle ecological impacts of NH+4 and the importance of changes in NO−3:NH+4 in phytoplankton metabolism and succession have been more difficult to appreciate. While NH+4 can be characterized as a paradoxical nutrient—preferentially used at one end of the concentration spectrum when N is limiting and toxic to the cell when supplied at super-saturating levels (Britto and Kronzucker, 2002), its regulatory effects span the entire spectrum of its availability.
The responses shown here by individual components of the phytoplankton communities were as hypothesized based on the oceanographic paradigms of response to oxidized (classically termed “new”) vs. reduced (classically termed “regenerated”) N forms. These data provide direct experimental evidence that dichotomous phytoplankton communities developed when enriched with the same absolute concentration of oxidized vs. reduced N forms, even when seemingly sufficient N nutrient was available to the community prior to the N inoculations (Figures 4, 5). These observations are contradictory to the notion of Reynolds (1999) that at or near saturation of the growth demand, different types of algae should not have differential success when nutrients change but remain at saturated levels. The Reynolds idea has heretofore been used to argue that if nutrients are not limiting for growth in the San Francisco Bay Delta then some other factor, namely light must be limiting for phytoplankton growth (Cole and Cloern, 1984; Jassby et al., 2002).
Overall, greater response by fucoxanthin-containing organisms (diatoms) was observed in those samples enriched with NO−3 and incubated under reduced irradiance, and greater responses by zeaxanthin and Chl b-containing organisms (predominantly cyanobacteria and chlorophytes) were observed in samples enriched with NH+4 and incubated under higher irradiance. Where pigment changes were significantly correlated to changes in N on a daily basis, the relationships were not a function of seasonal or site differences: data from different seasons and sites fell on the same trend line. The experimental results shown here also are supportive of reduced rates of N-based productivity for samples incubated with NH+4 enrichment compared to those incubated with NO−3 enrichment (Figure 6). These data add to the emerging body of evidence that such responses are not solely observed in oligotrophic systems. The pattern of low rates of productivity in the presence of elevated NH+4 conditions in the Sacramento River and Suisun Bay is comparable to observations in other river, estuarine and coastal ecosystems impacted by wastewater effluent (MacIsaac et al., 1979; Yoshiyama and Sharp, 2006; Waiser et al., 2011). The inhibitory effect of NH+4 on diatoms seen here has, for example, been observed in other estuaries, such as the Delaware Estuary and the inner bay of Hong Kong Harbor (Yoshiyama and Sharp, 2006; Xu et al., 2012). In the Delaware Estuary, inhibition by NH+4 was greatest when diatoms dominated (Yoshiyama and Sharp, 2006). A series of 3-week nutrient-rich mesocosm experiments conducted in Wascana Lake, Saskatchewan, Canada, yielded largely similar findings: total cyanobacterial biomass was associated with NH+4 additions, but diatom biomass was associated with NO−3 additions (Donald et al., 2013). And, earlier mesocosm experiments conducted in eutrophic Delaware Bay revealed higher primary production with NO−3 than with NH+4 (Parker, 2004).
The responses reported here were also related to the exposure irradiance level, but not necessarily in a manner originally anticipated. Whereas light has previously been thought to be limiting in this system (e.g., Cole and Cloern, 1984), low light enhanced the N-based yields of chl a, fucoxanthin and alloxanthin, while high light enhanced the response of chl b and zeaxanthin. However, pigment yields are a product of both cell growth as well as photoacclimation. The light responses here suggest that rather than being light limited, cells were low-light adapted and, in fact, may have experienced some degree of photoinhibition in the treatments with higher irradiance. It is interesting to compare these responses in the experimental manipulations to light responses along the riverine transects. In all of the transects reported here, Secchi depths were never greater than 1.6 m, and the greatest light penetration was always observed in the Sacramento River, above site USGS655. Reductions in light penetration were noted in Suisun Bay compared to the upper reaches of the river (Table 1), as also previously observed by Parker et al. (2012b). In all transects, fucoxanthin declined downriver (with the exception of two single sites around USGS2 in March 2013). Shifts away from diatoms in the transects in the region of Suisun Bay occurred despite the decrease in light penetration, the opposite direction of our experimental findings in which more fucoxanthin was produced in treatments with lower light. These shifts in community composition were, however, consistent with a lesser production of fucoxanthin in waters influenced by the NH+4—enriched conditions. In the transects reported herein, Secchi depths varied by factors of 2.5 to 5, with the largest range measured in March 2013, but, by contrast, NH+4 concentrations varied along the transects by a minimum of 11-fold (in March 2012) to 65-fold (in March 2013), and the ratio of NH+4: NO−3 varied along the same spatial gradient by 4-fold (in September 2011) to >100-fold (in September 2012). If light were the dominant regulatory factor, we would have expected to see shifts in community composition along the transects that compared at least in directionality with those of the experimental high vs. low light manipulations. The difference in the experimental enclosures when incubated with differing nutrient forms were indeed consistent with trends in changes in pigments, and we thus suggest that the large nutrient changes, delivered over a short section of the river, were the dominant factors contributing to changes in phytoplankton community composition, observed along the riverine to bay transects (Figure 3).
During September 2012 (the only September for which pigment transect data are available), a large increase down-river in zeaxanthin was also noted. Cyanobacteria not only are preferential users of NH+4 compared to NO−3 (Berg et al., 2003; Glibert and Berg, 2009), but they also are favored under the warmer temperatures of that season compared to temperatures observed in March (Paerl and Huisman, 2008). All transects had a >100% increase in alloxanthin (relative to values at Garcia Bend) beginning at the riverine site where the pulse of NH+4 became pronounced- a trend also consistent with reductions in water column transparency from the upper river to the bay (not shown).
There are a number of important implications of these data in the context of management implications of nutrient loads in the San Francisco Bay Delta region. These results bear substantially on the ongoing management debate in the Bay Delta region concerning the importance of reducing total N loads from sewage effluent and/or adding nitrification with or without N reductions. Water management in California is challenging and contentious, and a significant fraction of the water supply for state needs is extracted from the Delta. The Bay Delta is also the subject of considerable national public awareness due to the sociopolitical and socioeconomic tension surrounding the plight of the endemic delta smelt (Hypomesus transpacificus), a small (length ca. 6 cm) fish whose decline has been taken as a sign of adverse environmental conditions in the region. The delta smelt was put on the Threatened Species list in 1993 (Wanger, 2007a,b) and it underwent further population decline along with longfin smelt (Spirinchus thaleichthys), threadfin shad (Dorosoma petenense) and young-of-the-year striped bass (Morone saxatilis) in the early 2000s (Sommer et al., 2007). Accelerated losses during the last decade have been termed the “Pelagic Organism Decline” (POD) period (Sommer et al., 2007). An important question is whether fish declines are related to changes in both abundance and species composition of the primary producers, and if so, are the changes in primary producers a result of shifts in nutrient quantity and quality? Before 1982, chl a concentrations in Suisun Bay were relatively high, averaging 9 μg L−1, with numerous values exceeding 30 μg L−1, and diatoms and delta smelt were abundant. The decline in diatoms, which began in 1982, has been shown to be highly correlated with the increase in NH+4 loading that occurred with the start of the operations of the WWTP on the Sacramento River (Dugdale et al., 2007; Glibert, 2010; Glibert et al., 2011). Beginning around 1999, when sharp declines in fish species began to be noted, NH+4 loading from wastewater discharge increased >25%, from ~9 tons day−1 to 12–14 metric tons day−1, and flagellates and cyanobacteria emerged as the dominant phytoplankton class (Lehman, 1996; Muller-Solger et al., 2002; Lehman et al., 2005, 2008; Brown, 2010; Glibert, 2010; Glibert et al., 2011).
The data herein lend support to a growing experimental body of evidence that an important management strategy for the San Francisco Bay Delta is the planned improvement in effluent N discharge through nitrification and denitrification; such a strategy is projected to increase the proportional production of diatoms and should lead to an increase in food quality (and amount) for fish and other higher trophic level consumers (Wilkerson et al., 2006; Dugdale et al., 2007, 2012; Glibert, 2010; Glibert et al., 2011; Parker et al., 2012a,b). Based on the data here, it can be inferred that by increasing the fractional availability of NO−3 relative to NH+4, N-based production should increase, as will the yield per unit N of both chl a and fucoxanthin in this low-light environment. This growing consensus is further supported by recent modeling efforts of Dugdale et al. (2012). Dugdale et al. (2012) developed a conceptual model that correctly predicted the development of two unusual spring phytoplankton blooms in Suisun Bay based on only three criteria: the rate of NH+4 loading (based on present day sewage effluent loads), the water column concentration of NH+4, and river flow (analogous in steady-state chemostat growth to “washout”). This conceptual model was further advanced in a one-dimensional, N-based model (Dugdale et al., 2013) that included terms for the time-varying rates of maximum NO−3 uptake as a function of NO−3 concentration and for inhibition of NO−3 uptake by NH+4 and that predicted either a high-biomass state that occurred under low flow and variable NH+4 levels, or a low-biomass state that occurred under high flow conditions but high NH+4 conditions. The modeled high-biomass, NO−3-based, high-productivity state is analogous to the pre-1982, diatom era during which delta smelt were plentiful (Glibert, 2010; Glibert et al., 2011). Interestingly, in 2014, a major spring bloom was observed in Suisun Bay that also conformed to the low-flow, high NO−3, high biomass state. This bloom is thought to have been a response to the long-term drought that not only resulted in longer residence time for phytoplankton growth and accumulation, but also allowed a longer period of time for nitrification to occur, reducing sewage-derived NH+4 to a level where the NO−3 could be accessed for uptake and growth (Glibert et al., 2014). The modeled low-biomass, low-productivity state based on NH+4 is analogous to the post-1982 cryptophyte/flagellate era that is related to the decline of smelt, threadfin shad, and young-of-the-year striped bass (Glibert, 2010; Glibert et al., 2011).
Placing these findings in the context of other observations of physiological changes in phytoplankton metabolism along the entire spectrum of nutrient availability suggests that the form of N plays a regulatory role in physiology and community composition at all concentration levels, not just at the limiting end of the spectrum (Glibert et al., 2013). Finally, the findings herein also point to an important consideration in the development of numeric criteria for nutrients in estuaries, a challenge that many states are now facing (U.S. EPA, 2010). Many such criteria, or integrated indices of water quality status and trends, are based on total N or P, rather than specific forms of N or P (U.S. EPA, 2010). The more subtle ecological impacts of NH+4 loading and the importance of changes in NO−3:NH+4 in phytoplankton succession have not been appreciated in nutrient criteria development to date. These findings show that N form is related to the “quality” of phytoplankton and that has previously been related to the trajectory of higher trophic levels in this N-rich ecosystem.
Author Contributions
All authors contributed to the experimental design, acquisition and analysis of the data; Patricia M. Glibert, Frances P. Wilkerson, Richard C. Dugdale and Alexander E. Parker drafted the manuscript; Jeffrey Alexander, Sarah Blaser, and Susan Murasko contributed intellectual content and manuscript critiques; all authors approved the final manuscript version.
Conflict of Interest Statement
P. Glibert and R. Dugdale have previously consulted for the State and Federal Contractors Water Agency (SFCWA); that work terminated 22 months ago. SFWCA in recent years has been developing a rigorous science program. They co-funded the work herein with the Delta Stewardship Council in an open competition. SFWCA has no knowledge of the data described here or their interpretations. The authors declare that the research was conducted in the absence of any commercial or financial relationships that could be construed as a potential conflict of interest.
Acknowledgments
This study was co-funded by the Delta Stewardship Council (Grant Number 2038) and the State and Federal Contractors Water Agency (Grant Number 12-20). We thank E. Kiss and M. Maddox from the Horn Point Laboratory, and A. Pimenta, C. Buck, A. Johnson, J. Lee, E. Kress, N. Travis, S. Strong, J. Fuller, D. Bell, and D. Morgan from the Romberg Tiburon Center, for assistance with sampling and analysis. HPL Analytical Services Laboratory provided analysis of the accessory pigments. The authors thank the reviewers for helpful comments on an earlier version of this paper. This is contribution number 4879 from the University of Maryland Center for Environmental Science.
Supplementary Material
The Supplementary Material for this article can be found online at: http://www.frontiersin.org/journal/10.3389/fmars.2014.00017/abstract
References
Arar, E. J., and Collins, G. B. (1992). “In vivo determination of chlorophyll a and phaeophytin a in marine and freshwater phytoplankton by fluorescence,” in Methods for the Determination of Chemical Substances in Marine and Estuarine Samples (Cincinnati, OH: Environmental Monitoring and Support Laboratory, Office of Research an Development, U.S. EPA, OH EPA/600/R-92/121), 22.
Alpine, A. E., and Cloern, J. E. (1992). Trophic interactions and direct physical effects control phytoplankton biomass and production in an estuary. Limnol. Oceanogr. 37, 946–955. doi: 10.4319/lo.1992.37.5.0946
Atwater, B. F., Conard, S. G., Dowden, J. N., Hedel, C. W., MacDonald, R. L., and Savage, W. (1979). “History, landforms, and vegetation of the estuary's tidal marshes,” in San Francisco Bay: The Ecosystem, ed J. T. Hollibaugh (San Francisco, CA: Pacific Division of the American Association for the Advancement of Science), 347–385
Berg, G. M., Balode, M., Purina, I., Bekere, S., Béchemin, C., and Maestrini, S. (2003). Plankton community composition in relation to availability and uptake of oxidized and reduced nitrogen. Aquatic. Microb. Ecol. 30, 263–274. doi: 10.3354/ame030263
Berman, T., Sherr, B. F., Sherr, E., Wynne, D., and McCarthy, J. J. (1984). The characteristics of ammonium and nitrate uptake by phytoplankton in Lake Kinneret. Limnol. Oceanogr. 29, 287–297. doi: 10.4319/lo.1984.29.2.0287
Bran and Luebbe, Inc. (1999a). Bran Luebbe Autoanalyzer Applications: AutoAnalyzer Method No. G-177-96 Silicate in Water and Seawater. Buffalo Grove, IL: Bran Luebbe, Inc.
Bran and Luebbe, Inc. (1999b). Bran Luebbe AutoAnalyzer Applications: AutoAnalyzer Method No. G-175-96 Phosphate in Water and Seawater. Buffalo Grove, IL: Bran Luebbe, Inc.
Bran and Luebbe, Inc. (1999c). Bran Luebbe AutoAnalyzer Applications: AutoAnalyzer Method No. G-172-96 Nitrate and Nitrite in Water and Seawater. Buffalo Grove, IL: Bran Luebbe, Inc.
Britto, D. T., and Kronzucker, H. J. (2002). NH+4 toxicity in higher plants: a critical review. J. Plant Physiol. 159, 567–584. doi: 10.1078/0176-1617-0774
Brown, T. (2010). Phytoplankton community composition: the rise of the flagellates. IEP Newslett. 22, 20–28.
Caperon, J., and Ziemann, D. A. (1976). Synergistic effects of nitrate and ammonium ion on the growth and uptake kinetics of Monochrysis lutheri in continuous culture. Mar. Biol. 36, 73–84. doi: 10.1007/BF00388430
Carpenter, S. R., and Kitchell, J. F. (eds.). (1993). The Trophic Cascade in Lakes. New York, NY: Cambridge University Press.
Cloern, J. E. (2001). Our evolving conceptual model of the coastal eutrophication problem. Mar. Ecol. Prog. Ser. 210, 223–253. doi: 10.3354/meps210223
Cloern, J. E., and Dufford, R. (2005). Phytoplankton community ecology: principles applied in San Francisco Bay. Mar. Ecol. Prog. Ser. 285, 1–28. doi: 10.3354/meps285011
Cole, B. E., and Cloern, J. E. (1984). Significance of biomass and light availability to phytoplankton productivity in San Francisco Bay. Mar. Ecol. Prog. Ser. 17, 15–24. doi: 10.3354/meps017015
Collos, Y., Maestrini, S. Y., and Robert, M. (1989). High long-term nitrate uptake by oyster-pond microalgae in the presence of high ammonium concentrations. Limnol. Oceanogr. 34, 957–964. doi: 10.4319/lo.1989.34.5.0957
Donald, D. B., Bogard, M. J., Finlay, K., Bunting, L., and Leavitt, P. R. (2013). Phytoplankton-specific response to enrichment of phosphorus-rich surface waters with ammonium, nitrate, and urea. PLoS ONE 8:e53277. doi: 10.1371/journal.pone.0053277
Dortch, Q. (1990). The interaction between ammonium and nitrate uptake in phytoplankton. Mar. Ecol. Prog. Ser. 61, 183–201. doi: 10.3354/meps061183
Dortch, Q., Thompson, P. A., and Harrison, P. J. (1991). Short-term interaction between nitrate and ammonium uptake in Thalassiosira pseudonana: effect of preconditioning nitrogen source and growth rate. Mar. Biol. 110, 183–193. doi: 10.1007/BF01313703
Droop, M. R. (1983). 25 years of algal growth kinetics. Bot. Mar. 26, 99–112. doi: 10.1515/botm.1983.26.3.99
Dugdale, R. C., and Goering, J. J. (1967). Uptake of new and regenerated forms of nitrogen in primary productivity. Limnol. Oceanogr. 12, 196–206. doi: 10.4319/lo.1967.12.2.0196
Dugdale, R. C., and Wilkerson, F. P. (1986). The use of 15N to measure nitrogen uptake in eutrophic oceans; experimental considerations. Limnol. Oceanogr. 31, 673–689. doi: 10.4319/lo.1986.31.4.0673
Dugdale, R. C., Wilkerson, F. P., Hogue, V. E., and Marchi, A. (2007). The role of ammonium and nitrate in spring bloom development in San Francisco Bay. Est. Coast. Shelf Sci. 73, 17–29. doi: 10.1016/j.ecss.2006.12.008
Dugdale, R. C., Wilkerson, F. P., and Parker, A. E. (2013). A biogeochemical model of phytoplankton productivity in an urban estuary: the importance of ammonium and freshwater flow. Ecol. Model. 263, 291–307. doi: 10.1016/j.ecolmodel.2013.05.015
Dugdale, R. C., Wilkerson, F. P., Parker, A. E., Marchi, A., and Taberski, K. (2012). River flow and ammonium discharge determine spring phytoplankton blooms in an urbanized estuary. Est. Coast. Shelf Sci. 115, 187–199. doi: 10.1016/j.ecss.2012.08.025
Edwards, V., Icely, J., Newton, A., and Webster, R. (2005). The yield of chlorophyll from nitrogen: a comparison between the shallow Ria Formosa lagoon and the deep oceanic conditions at Sagres along the southern coast of Portugal. Est. Coast. Shelf Sci. 62, 391–405. doi: 10.1016/j.ecss.2004.09.004
Eppley, R. W., and Peterson, B. J. (1979). Particulate organic matter flux and planktonic new production in the deep ocean. Nature 282, 677–680. doi: 10.1038/282677a0
Flynn, K. J. (1999). Nitrate transport and ammonium-nitrate interactions at high nitrate concentrations and low temperatures. Mar. Ecol. Prog. Ser. 187, 283–287. doi: 10.3354/meps187283
Flynn, K. J., and Fasham, M. J. R. (1997). A short version of the ammonium-nitrate interaction model. J. Plankt. Res. 19, 1881–1897. doi: 10.1093/plankt/19.12.1881
Flynn, K. J., Fasham, M. J. R., and Hipkin, C. R. (1997). Modelling the interactions between ammonium and nitrate uptake in marine phytoplankton. Phil. Trans. R. Soc. 352, 1625–1645.
Flynn, K. J., Stoecker, D. K., Mitra, A., Raven, J. A., Glibert, P. M., Hansen, P. J., et al. (2013). Misuse of the phytoplankton-zooplankton dichotomy: the need to assign organisms as mixotrophs within plankton functional types. J. Plank. Res. 35, 3–11. doi: 10.1093/plankt/fbs062
Glibert, P. M. (1998). Interactions of top-down and bottom-up control in planktonic nitrogen cycling. Hydrobiology 363, 1–12. doi: 10.1023/A:1003125805822
Glibert, P. M. (2010). Long-term changes in nutrient loading and stoichiometry and their relationships with changes in the food web and dominant pelagic fish species in the San Francisco Estuary, California. Rev. Fish. Sci. 18, 211–232. doi: 10.1080/10641262.2010.492059
Glibert, P. M. (2012). Ecological stoichiometry and its implications for aquatic ecosystem sustainability. Curr. Opin. Envir. Sustainabil. 4, 272–277. doi: 10.1016/j.cosust.2012.05.009
Glibert, P. M., and Berg, G. M. (2009). “Nitrogen form, fate and phytoplankton composition,” in Experimental Ecosystems and Scale: Tools for Understanding and Managing Coastal Ecosystems, eds V. S. Kennedy, W. M. Kemp, J. E. Peterson, and W. C. Dennison (New York, NY: Springer), 183–189.
Glibert, P. M., and Capone, D. G. (1993). “Mineralization and assimilation in aquatic, sediment, and wetland systems,” in Nitrogen Isotope Techniques, eds R. Knowles and T. H. Blackburn (San Diego, CA: Academic), 243–271.
Glibert, P. M., Dugdale, R. C., Wilkerson, F., Parker, A. E., Alexander, J., Antell, E., et al. (2014). Major- but rare- spring blooms in 2014 in San Francisco Bay Delta, California, a result of the long-term drought, increased residence time, and altered nutrient loads and forms. J. Exp. Mar. Biol. Ecol. 460, 8–18. doi: 10.1016/j.jembe.2014.06.001
Glibert, P. M., Fullerton, D., Burkholder, J. M., Cornwell, J., and Kana, T. M. (2011). Ecological stoichiometry, biogeochemical cycling, invasive species, and aquatic food webs: San Francisco Estuary and comparative systems. Rev. Fish. Sci. 19, 358–417. doi: 10.1080/10641262.2011.611916
Glibert, P. M., Kana, T. M., and Brown, K. (2013). From limitation to excess: consequences of substrate excess and stoichiometry for phytoplankton physiology, trophodynamics and biogeochemistry, and implications for modeling. J. Mar. Syst. 125, 14–28. doi: 10.1016/j.jmarsys.2012.10.004
Glibert, P. M., Lipschultz, F., McCarthy, J. J., and Altabet, M. A. (1982). Isotope dilution models of uptake and remineralization of ammonium by marine plankton. Limnol. Oceanogr. 27, 639–650. doi: 10.4319/lo.1982.27.4.0639
Gowen, R. J., Tett, P., and Jones, K. J. (1992). Predicting marine eutrophication: the yield of chlorophyll from nitrogen in Scottish coastal waters. Mar. Ecol. Prog. Ser. 85, 153–161. doi: 10.3354/meps085153
Heil, C. A., Revilla, M., Glibert, P. M., and Murasko, S. (2007). Nutrient quality drives phytoplankton community composition on the West Florida Shelf. Limnol. Oceanogr. 52, 1067–1078. doi: 10.4319/lo.2007.52.3.1067
Jassby, A. (2008). Phytoplankton in the upper San Francisco Estuary: re- cent biomass trends, their causes and their trophic significance. San Francisco Estuar. Watershed Sci. 6, 1–26.
Jassby, A. D., Cloern, J. E., and Cole, B. B. (2002). Annual primary production: patterns and mechanisms of change in a nutrient-rich tidal ecosystem. Limnol. Oceanogr. 47, 698–712. doi: 10.4319/lo.2002.47.3.0698
Kimmerer, W. J. (2004). Open water processes of the San Francisco Estuary: from physical forcing to biological responses. San Francisco Estuar. Watershed Sci. 2, 1–140.
Kimmerer, W. J., Parker, A. E., Lidstrom, U., and Carpenter, E. J. (2012). Short-term and interannual variability in primary productivity in the low-salinity zone of the San Francisco Estuary. Estuar. Coast. 35, 913–920. doi: 10.1007/s12237-012-9482-2
Legendre, L., and Rassoulzadegan, F. (1995). Plankton and nutrient dynamics in marine waters. Ophelia 41, 153–172.
Lehman, P. W. (1996). “Changes in chlorophyll-a concentration and phytoplankton community composition with water-year type in the upper San Francisco Estuary,” in San Francisco Bay: The Ecosystem, ed J. T. Hollibaugh (San Francisco, CA: Pacific Division of the American Association for the Advancement of Science), 351–374.
Lehman, P. W., Boyer, G., Hall, C., Walker, S., and Gehrts, K. (2005). Distribution and toxicity of a new colonial Microcystis aeruginosa bloom in the San Francisco Bay Estuary, California. Hydrobiology 541, 87–99. doi: 10.1007/s10750-004-4670-0
Lehman, P. W., Boyer, G., Stachwell, M., and Walker, S. (2008). The influence of environmental conditions on seasonal variation of Microcystis abundance and microcystins concentration in San Francisco Estuary. Hydrobiology 600, 187–204. doi: 10.1007/s10750-007-9231-x
L'Helguen, S., Maguer, J.-F., and Caradec J. (2008). Inhibition kinetics of nitrate uptake by ammonium in sze-fractionated oceanic phytoplankton communities: implications for new production and f-ratio estimates. J. Plankt. Res. 10, 1179–1188. doi: 10.1093/plankt/fbn072
Lindell, D., and Post, A. F. (2001). Ecological aspects of ntcA gene expression and its use as an indicator of the nitrogen status of marine Synechococcus spp. Appl. Envir. Microbiol. 67, 3340–3349. doi: 10.1128/AEM.67.8.3340-3349.2001
Lomas, M. W., and Glibert, P. M. (1999a). Temperature regulation of nitrate uptake: a novel hypothesis about nitrate uptake and reduction in cool-water diatoms. Limnol. Oceanogr. 44, 556–572. doi: 10.4319/lo.1999.44.3.0556
Lomas, M. W., and Glibert, P. M. (1999b). Interactions between NH+4 and NO3−− uptake and assimilation: comparison of diatoms and dinoflagellates at several growth temperatures. Mar. Biol. 133, 541–551. doi: 10.1007/s002270050494
Lomas, M. W., and Glibert, P. M. (2000). Comparisons of nitrate uptake, storage and reduction in marine diatoms and flagellates. J. Phycol. 36, 903–913. doi: 10.1046/j.1529-8817.2000.99029.x
MacDonald, R. W., McLaughlin, F. A., and Wong, C. S. (1986). The storage of reactive silicate samples by freezing. Limnol. Oceanogr. 31, 1139–1142. doi: 10.4319/lo.1986.31.5.1139
MacIsaac, J. J., Dugdale, R. C., Huntsman, S., and Conway, H. L. (1979). The effect of sewage on uptake of inorganic nitrogen and carbon by natural populations of marine phytoplankton. J. Mar. Sci. 37, 51–66.
Maguer, J.-F., L'Helguen, S., Madec, C., Labry, C., and Le Corre, P. (2007). Nitrogen uptake and assimilation kinetics in Alexandrium minutum (Dinophyceae): effect of N-limited growth rate on nitrate and ammonium interactions. J. Phycol. 43, 295–303. doi: 10.1111/j.1529-8817.2007.00334.x
McCarthy, J. J., Taylor, W. R., and Taft, J. L. (1975). “The dynamics of nitrogen and phosphorus cycling in the open waters of Chesapeake Bay,” in Marine Chemistry in the Coastal Environment, ed T. M. Church (Washington, DC: American Chemical Society), 664–681.
Moore, L. R., Post, A. F., Rocap, G., and Chisholm, S. W. (2002). Utilization of different nitrogen sources by the marine cyanobacteria Prochlorochoccus and Synechococcus. Limnol. Oceanogr. 47, 989–996. doi: 10.4319/lo.2002.47.4.0989
Mousseau, L., Klein, B., Legendre, L., Dauchez, S., Tamigneaux, E., Tremblay, J.-E., et al. (2001). Assessing the trophic pathways that dominate food webs: an approach based on simple ecological ratios. J. Plank. Res. 23, 765–777. doi: 10.1093/plankt/23.8.765
Muller-Solger, A. B., Jassby, A. D., and Muller-Navarra, D. (2002). Nutritional quality of food resources for zooplankton (Daphnia) in a tidal freshwater system (Sacramento-San Joaquin River Delta). Limnol. Oceanogr. 47, 1468–1476. doi: 10.4319/lo.2002.47.5.1468
Nichols, F. H., Cloern, J. E., Luoma, S. N., and Peterson, D. H. (1986). The modification of an estuary. Science 231, 567–573. doi: 10.1126/science.231.4738.567
Paerl, H. W., and Huisman, J. (2008). Blooms like it hot. Science 320, 57–58. doi: 10.1126/science.1155398
Parker, A. E. (2004). Assessing the Phytoplankton-Heterotrophic Bacterial Link in the Eutrophic Delaware Estuary, Ph.D. dissertation, University of Delaware.
Parker, A. E., Hogue, V. E., Wilkerson, F. P., and Dugdale, R. C. (2012a). The effect of inorganic nitrogen speciation on primary production in San Francisco Estuary. Est. Coast. Shelf Sci. 104–105, 91–101. doi: 10.1016/j.ecss.2012.04.001
Parker, A. E., Wilkerson, F. P., and Dugdale, R. C. (2012b). Elevated ammonium concentrations from wastewater discharge depress primary productivity in the Sacramento River and the northern San Francisco Estuary. Mar. Poll. Bull. 64, 574–586. doi: 10.1016/j.marpolbul.2011.12.016
Polis, G. A., and Strong, D. R. (1996). Food web complexity and community dynamics. Am. Nat. 147, 813–846. doi: 10.1086/285880
Raven, J. A. (1984). Energetics and Transport in Aquatic Plants. New York, NY: Alan R. Liss, Inc, 587.
Reynolds, C. S. (1999). Non-determinism to probability, or N:P in the community ecology of phytoplankton. Arch. Hydrobiol. 146, 23–35.
Sobota, D. J., Harrison, J. A., and Dahlgren, R. A. (2009). Influences of climate, hydrology, and land use on input and export of nitrogen in California watersheds. Biogeochemistry 94, 1–20. doi: 10.1007/s10533-009-9307-y
Solórzano, L. (1969). Determination of ammonia in natural waters by the phenolhypochlorite method. Limnol. Oceanogr. 14, 799–801. doi: 10.4319/lo.1969.14.5.0799
Sommer, T. R., Armor, C., Baxter, R., Breuer, R., Brown, L., Chotkowski, M., et al. (2007). The collapse of pelagic fishes in the upper San Francisco Estuary. Fisheries 32, 270–277. doi: 10.1577/1548-8446(2007)32[270:TCOPFI]2.0.CO;2
Song, B., and Ward, B. B. (2007). Molecular cloning and characterization of high-affinity nitrate transporters in marine phytoplankton. J. Phycol. 43, 542–552. doi: 10.1111/j.1529-8817.2007.00352.x
U.S., Environmental Protection Agency (EPA). (2010). Nutrients in Estuaries and Relation to Water Quality Criteria Derivation State of the Science, eds P. Glibert, C. Madden, W. Boynton, D. Flemer, C. Heil, and J. Sharp (EPA Office of Water), 190.
Van Heukelem, L., and Thomas, C. S. (2001). Computer-assisted high-performance liquid chromatography method development with applications to the isolation and analysis of phytoplankton pigments. J. Chromatogr. A 910, 31–49. doi: 10.1016/S0378-4347(00)00603-4
Van Nieuwenhuyse, E. (2007). Response of summer chlorophyll concentration to reduced total phosphorus concentration in the Rhine River (Netherlands) and the Sacramento-San Joaquin Delta (California, USA). Can. J. Fish. Aquat. Sci. 64, 1529–1542. doi: 10.1139/f07-121
Waiser, M. J., Tumber, V., and Holm, J. (2011). Effluent-dominated streams. Part I. Presence and effects of excess nitrogen and phosphorus in Wascana Creek, Saskatchewan, Canada. Environ. Toxicol. Chem. 30, 496–507. doi: 10.1002/etc.399
Wanger, O. W. (2007a). Findings of Fact and Conclusions of Law re Interim Remedies re: Delta Smelt ESA Remand and Reconsultation. Case 1:05-cv- 01207-OWW-GSA, Document 01561. Fresno, CA: United States District Court, Eastern District of California.
Wanger, O. W. (2007b). Interim Remedial Order Following Summary Judgment and Evidentiary Hearing. Case 1:05-cv-01207-OWW-GSA, Document 01560. Fresno, CA: United States District Court, Eastern District of California.
Whitledge, T. E., Malloy, S. C., Patton, C. J., and Wirick, C. D. (1981). Automated Nutrient Analyses in Seawater. Report 51398. Upton, NY: Brookhaven National Laboratory.
Wilkerson, F. P., Dugdale, R. C., Hogue, V. E., and Marchi, A. (2006). Phytoplankton blooms and nitrogen productivity in the San Francisco Bay. Estuar. Coast. 29, 401–416.
Xu, J., Yin, K., Lee, J. H. W., Liu, H., Ho, A. Y. T., Yuan, X. et al. (2012). Long-term and seasonal changes in nutrients, phytoplankton biomass, and dissolved oxygen in Deep Bay, Hong Kong. Estuar. Coast. 33, 399–416. doi: 10.1007/s12237-009-9213-5
Keywords: nitrate, ammonium, phytoplankton pigments, food webs, new and regenerated production
Citation: Glibert PM, Wilkerson FP, Dugdale RC, Parker AE, Alexander J, Blaser S and Murasko S (2014) Phytoplankton communities from San Francisco Bay Delta respond differently to oxidized and reduced nitrogen substrates—even under conditions that would otherwise suggest nitrogen sufficiency. Front. Mar. Sci. 1:17. doi: 10.3389/fmars.2014.00017
Received: 23 January 2014; Accepted: 13 June 2014;
Published online: 07 July 2014.
Edited by:
Anne Bernhard, Connecticut College, USAReviewed by:
Kathleen Scott, University of South Florida, USAMichael A. Mallin, University of North Carolina Wilmington, USA
Copyright © 2014 Glibert, Wilkerson, Dugdale, Parker, Alexander, Blaser and Murasko. This is an open-access article distributed under the terms of the Creative Commons Attribution License (CC BY). The use, distribution or reproduction in other forums is permitted, provided the original author(s) or licensor are credited and that the original publication in this journal is cited, in accordance with accepted academic practice. No use, distribution or reproduction is permitted which does not comply with these terms.
*Correspondence: Patricia M. Glibert, Horn Point Laboratory, University of Maryland Center for Environmental Science, PO Box 775, 2020 Horns Point Rd., Cambridge, MD 21613, USA e-mail: glibert@umces.edu