Barcoding of Asian seabass across its geographic range provides evidence for its bifurcation into two distinct species
 Shubha Vij1*
  Kathiresan Purushothaman1
  G. Gopikrishna2
  Doreen Lau1
  Jolly M. Saju1
  K. V. Shamsudheen3
  K. Vinaya Kumar2
  V. S. Basheer4
  A. Gopalakrishnan4 Mohammad S. Hossain5
  Sridhar Sivasubbu3
  Vinod Scaria3
  J. K. Jena4
  A. G. Ponniah2
  László Orbán1,6,7*
- 1Reproductive Genomics Group, Strategic Research Program, Temasek Life Sciences Laboratory, National University of Singapore, Singapore, Singapore
- 2Genetics and Biotechnology Unit, Central Institute of Brackishwater Aquaculture, Chennai, India
- 3Institute of Genomics and Integrative Biology, New Delhi, India
- 4National Bureau of Fish Genetic Resources (Cochin Unit), Kochi, India
- 5Microbiology Program, Department of Mathematics and Natural Sciences, BRAC University, Dhaka, Bangladesh
- 6Department of Animal Sciences and Animal Husbandry, Georgikon Faculty, University of Pannonia, Keszthely, Hungary
- 7Comparative Genome Center, Murdoch University, Perth, Australia
Asian seabass or barramundi (Lates calcarifer) is an important food fish with commercial value and a wide geographic distribution. Though some reports based on molecular and/or morphological data exist, a comprehensive effort to establish species identity across its range is lacking. In order to address this issue and especially to ascertain whether the wide-spread distribution has resulted in bifurcation of the species, we collected Asian seabass samples from various locations representing the Western and Eastern Coastline of India, Andaman and Nicobar Islands, Bangladesh and Australia. Samples from Malaysia, Indonesia, Thailand and Singapore were collected as part of a previous study. DNA sequence variations, including cytochrome c oxidase subunit 1 (COI), 16S rDNA and the highly variable D-loop (or control region), were examined to establish species delineation. Data from all the sequences analyzed concordantly point to the existence of at least two distinct species—one representing the Indian subcontinent plus Myanmar, and a second, representing Southeast Asia (Singapore, Malaysia, Thailand and Indonesia) plus Northern Australia. These data are useful for conservation ecology, aquaculture management, for establishing the extent of genetic diversity in the Asian seabass and implementing selective breeding programs for members of this species complex.
Introduction
Teleost fishes are the most diverse group of vertebrates (Froese and Pauly, 2014), due to which their classification is difficult, especially at the morphological level. It is thus not surprising, that over the years, DNA-based species identification has become popular with obvious merits including ease of use, applicability at any stage of development/state of specimen as well as world-wide transmissibility. For the majority of animals, a 648 bp region of the mitochondrial cytochrome c oxidase subunit 1 (COI) has been established as the stretch of DNA sufficient enough to identify variation among species (Hebert et al., 2003).
Asian seabass or barramundi [Lates calcarifer (Bloch, 1790)] is a commercially valuable, carnivorous, marine teleost fish belonging to the order Perciformes, the largest order of vertebrates, comprising ~40% of all bony fishes (e.g., cichlids, sunfishes/bluegills, damselfishes, basses, and perches) (Nelson, 2006). The representatives of Asian seabass are catadromous—they are born in seawater, then spend most of their lives in freshwater and migrate to the sea only to breed, a task achieved by their ability to tolerate the complete range of salinities (Moore, 1979; Moore and Reynold, 1982). In addition, the Asian seabass has a wide geographic distribution, its natural range being the tropical Indo-West Pacific region, including the whole of Southeast (SE) Asia, Taiwan stretching to Papua New Guinea and Northern Australia. On the other end, it is found in the Bay of Bengal to at least the Western part of India (Yue et al., 2012). It is an important fish species from an aquaculture perspective. Its farming was initiated in the 1970s in Thailand, followed by a rapid spread to Singapore, Malaysia, Indonesia, Taiwan, Brunei, Hongkong, China, Saudi Arabia, and Australia (Chou and Lee, 1997; Frost et al., 2006; Zhu et al., 2006).
Some morphological and molecular evidence exists in support of Asian seabass from a few geographic locations likely to be distinct species (Ward et al., 2008; Pethiyagoda and Gill, 2012). However, a comprehensive survey of genetic and “species” diversity of Asian seabass across its whole range is still lacking. Thus, it is not exactly clear how closely related the Asian seabass from the Western coast of India are to those found in Australia, also their relationship with their SE Asian counterparts is also not yet resolved. This study was thus initiated with the main aim of addressing the existing ambiguities and also for ascertaining the species delineation across most of its native geographic range. DNA sequences from three mitochondrial markers including cytochrome c oxidase subunit 1 (COI), 16S ribosomal RNA gene (16S rDNA or 16S) and the highly variable control region (or D-loop) were analyzed and evidence was obtained pointing to a splitting of the originally defined Lates calcarifer, one representing SE Asia plus Northern Australia and the other representing the Indian sub-continent plus Myanmar. In addition, truss morphometric data was used for discriminant function analysis to study differences at the morphological level between the two genetically identified species.
Materials and Methods
Sample Collection and DNA Isolation
Wild Asian seabass were procured from different locations along the Western and Eastern coastline of India as well as the Andaman and Nicobar Islands. The freshly caught fishes were obtained from the landing centers followed by sample collection. In each case, the pectoral and/or caudal fins were collected into a vial containing 80% ethanol, which was labeled with the identity of the fish. Ten wild individuals were also caught from the Bay of Bengal and obtained from Cox's Bazar, ~400 km away from North-East of Dhaka, Bangladesh. The dorsal, pectoral and tail fin were cut and stored in absolute ethanol. Three wild populations from South China Sea (near Malaysia, Indonesia and Thailand) and one farmed population raised at the Marine Aquaculture Center, AVA, Singapore were sampled as part of an earlier effort to study population differentiation of SE Asian and Australian seabass using microsatellite loci (Yue et al., 2009). For this study, we used 70, 59, 58, and 30 individuals from Malaysia, Indonesia, Thailand and Singapore, respectively (for details on the samples see Table 1). Five representative individuals collected from estuaries between the Yangon and Sittang rivers (Myanmar), 5 from Queensland, Australia and 4 from Western Australia reported in an earlier study (Ward et al., 2008) were also incorporated in the phylogenetic analyses based on COI sequences (Figures 1, 2, Table 1). Asian seabass from the various locations were classified into the following 11 regions: India-Western Coast (I-WC), India-Eastern Coast (I-EC), India-Andaman and Nicobar Islands (I-AN), Bangladesh (BAN), Myanmar (MYA), Thailand East Coast (THA), Malaysian Peninsula East Coast (MAL), Singapore (SIN) and Indonesia (South of Jakarta; INA), Australia-Western Australia (AUS-WC), and Australia-Queensland (AUS-EC).
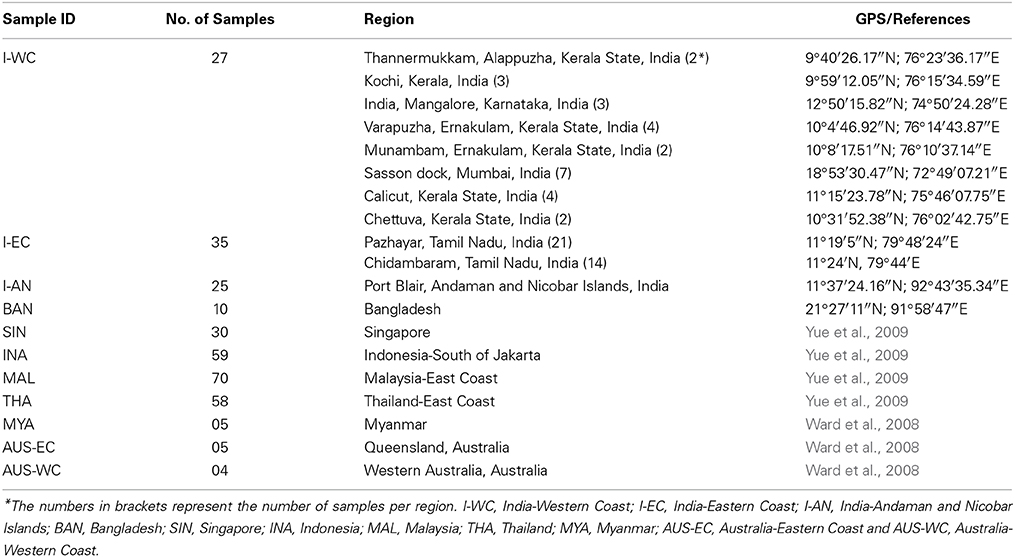
Table 1. Details of Asian seabass samples representing various Indo-West Pacific regions used in the study.
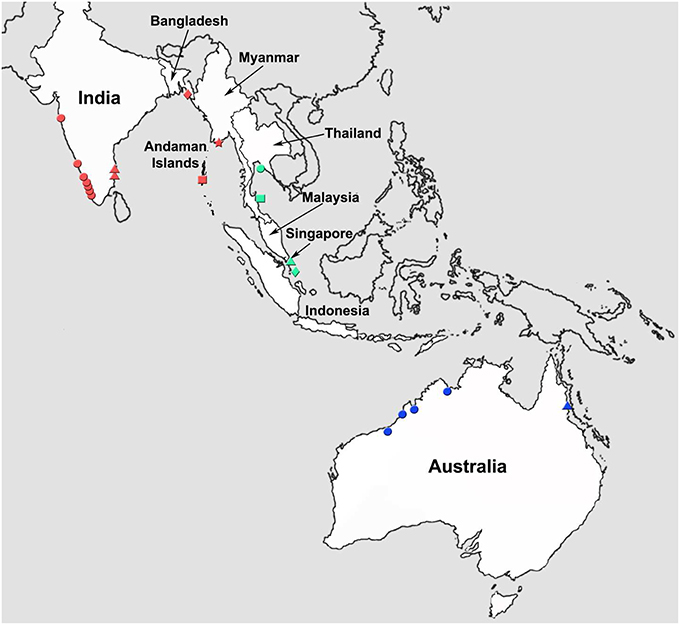
Figure 1. Map of the tropical Indo-West Pacific region illustrating various locations from which Asian seabass were collected for this study. Locations: Western coastline of India (red circle); Eastern coastline of India (red triangle); Andaman and Nicobar Islands (red square); Bangladesh (red diamond); Myanmar (red star); Thailand (green circle); Malaysia (green square); Singapore (green triangle); Indonesia (green diamond); Western Australia (blue circle); and Eastern Australia (blue triangle).
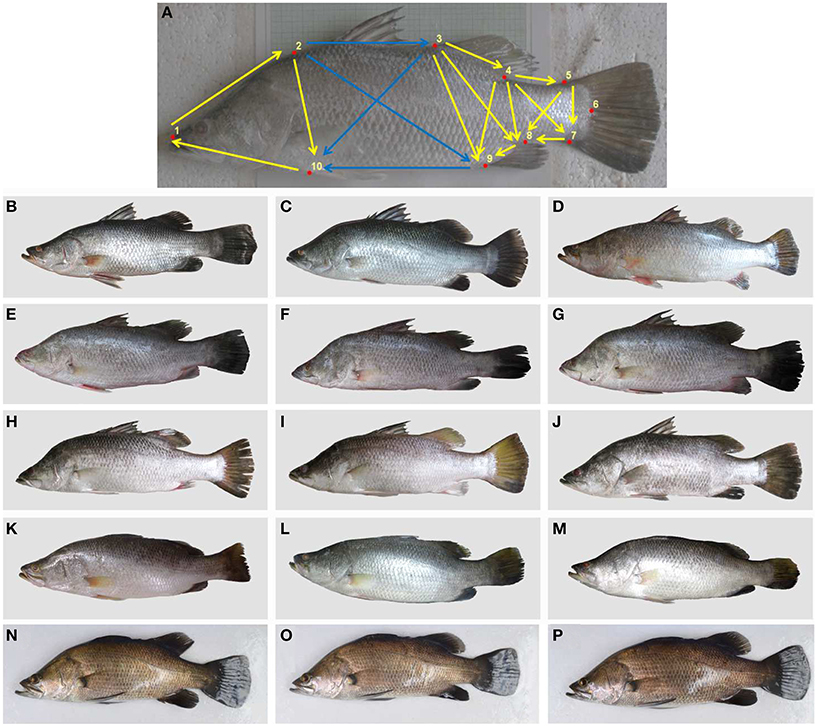
Figure 2. Morphometric analyses of Asian seabass. (A) shows a representative fish with the truss measurements indicated in yellow while those truss measurements which contribute to discrimination are indicated in blue. The landmark regions are indicated as red dots and numbered. The remaining (B–P) show representative pictures of Asian seabass from Western coast-India (B–D), Eastern coast-India (E–G), Andaman and Nicobar Islands (H–J), Bangladesh (K–M) and South-East Asia (N–P).
Genomic DNA from the SE Asia samples was isolated using a method described previously (Yue and Orban, 2005). It was, however, difficult to obtain reasonably good quality DNA from Bangladesh and Indian region samples (except Chidambaram, India) using this method. Therefore, for these samples, the MagAttract HMW DNA kit (Qiagen), which makes use of a high-yield magnetic bead-based method for the purification of DNA, was used.
For the Chidambaram samples, each fin clip was thoroughly homogenized using a sterile pestle in 500 μl of nuclei lysis buffer (0.1 M Tris-Cl, 0.1 M EDTA, 0.01 M NaCl and 0.5% SDS). An additional 500 μl nuclei lysis buffer, containing 10% SDS and 20 μg Proteinase K was added and the samples were incubated at 60°C for 2 h. Then 300 μl of 6N NaCl was added and the samples were centrifuged at 3500 rpm for 35 min. The supernatant was transferred to a fresh tube and the DNA was precipitated with absolute ethanol and washed with 70% ethanol. The pellet was air-dried before dissolving it in 50 μl of nuclease-free water.
Sequencing
Lates calcarifer voucher BW-A2480 (GenBank accession number (from here onwards GBAN: EF609382) Ward et al., 2008) sequence was used to design primers (COI-F: CCTATATCTAGTATTTGGTGCTTGGGCCGG, COI-R: GAACAGATGTTGATAGAGAATGGGATCTCC) to amplify 655 bp of the cytochrome c oxidase subunit 1 (COI) gene. Lates calcarifer voucher GO481 16S ribosomal DNA sequence (GBAN: HQ731431) was used to design primers (16S rDNA-F: CGGCCGCGGTATTTTGACCG, 16S rDNA-R: GGATGTCCTGATCCAACATC) to amplify a 493 bp region (836–1329 bp). The D-loop sequence (1–768 bp) was amplified from the mitochondrial genome (GBAN: NC_007439) by designing primers flanking the region (D-loop-F: GGAGATTTTAACTCCCACCACTAACCCCC, D-loop-R: GGACCAAGCCTTTGTGCTTATGGGACTTTC) resulting in a product range of 911–1023 bp depending on the origin of the sample. iProof ™ High-Fidelity Master Mix (Bio-Rad) was used for amplifying the sequences of interest using ~20–50 ng of genomic DNA (in those cases, where the genomic DNA was not visible on the gel, 5 μl of template was used for PCR) and 1 μl each of forward and reverse primer (10 μm stock). The following conditions were used for PCR amplification: 30 s at 98°C; 30 cycles of 10 s at 98°C, 15 s at 55°C, 30 s at 72°C; 7 min at 72°C. In a few cases, the D-loop region could not be amplified using the above mentioned conditions and hence the following conditions were used: 30 s at 98°C; 30 cycles of 10 s at 98°C, 15 s at 60°C, 60 s at 72°C; 7 min at 72°C. PCR products were run on a 1% agarose gel and the band of the expected size was excised from the gel using Fastgene agarose gel band cutter (NIPPON Genetics) and extracted in 20 μl of nuclease-free water (Qiagen) using QIAquick Gel Extraction Kit (Qiagen). The PCR products were sequenced using BigDye® Terminator v.3.1 Cycle Sequencing Kit (Applied Biosystems, USA) on an ABI 3730 capillary sequencer (Perkin Elmer, USA) according to the manufacturer's recommendations. Typically, multiple individuals per region were analyzed, however, only sequences without a single unambiguous base were considered for sequence divergence and phylogenetic studies. In many cases, especially toward the end of the sequence, bases were verified manually by looking at the individual trace files. A minimum cut-off of six individuals was adhered to in most cases, in order to represent each of the eight regions. The primers used for amplification were also used to generate the sequences in each case. However, in those cases (usually the middle, the start and the end of the sequence), where base quality was low and was difficult to unambiguously identify a base, the sequencing was done with primers designed from regions other than the start/end of sequence to verify and resolve low quality regions (COI-340-F: CCCCTTGCAAGCAACCTTGC, COI-340-R: GCAAGGTTGCTTGCAAGGGG, COI-450-R: GTGGTGATAAAGTTGATAGCTCC, D-loop-400-F: TAACATGAATCCTCGTTACCC, D-loop-400-R: GGGTAACGAGGATTCATGTT, D-loop-340-R: ACCTGAGGTAGGAACCAAATGC, D-loop-IND-F: CTCCCAGTTATATCTATTACCTACCC, D-loop-IND-RA: GCCACCTTAATTTCAATTGTTTTTTAC). The obtained sequences have been deposited in GenBank (GBAN: KJ573807- KJ574010).
Sequence Data and Phylogenetic Analyses
Sequence editing, multiple sequence alignment [using ClustalW (Larkin et al., 2007)], estimation of sequence divergence inferred from corrected pairwise distances based on Kimura two parameter (K2P) nucleotide substitution model (Kimura, 1980), and phylogenetic analyses were conducted with Molecular Evolutionary Genetics Analysis (MEGA) software, version 4 and 6 (Tamura et al., 2007, 2013). Several methods, including Maximum Parsimony (MP), and Minimum Evolution (ME) as implemented in MEGA4, and Maximum Likelihood (ML) as implemented in MEGA6, were used to reconstruct the phylogenetic trees. Lates niloticus (Linnaeus, 1758) represents one of the 11 valid species of Lates (Froese and Pauly, 2014) for which both COI and 16S rDNA sequences were available in Genbank. They were therefore retrieved and used as an outgroup to root the inferred trees. For the model-based methods, the K2P substitution model was applied for ME analyses (for all datasets). The General Time-Reversible substitution model (Lanave et al., 1984) with gamma distributed rate variation among sites (GTR+G) was applied for ML analyses for the COI and D-loop datasets. The Hasegawa-Kishino-Yano (Hasegawa et al., 1985) substitution model with a proportion of invariable sites (HKY+I) was applied for ML analyses for the 16S dataset. The best-fit substitution model for each alignment was deduced using MEGA6 (Tamura et al., 2013). Finally, the nodal support for each inferred gene tree was assessed by bootstrapping (Felsenstein, 1985) based on 100 pseudo-replicates.
Morphometric Analyses
The morphometric truss data was obtained on digital images from 22 individuals each from SE Asia and Indian subcontinent. Three softwares generated by F. James Rohlf (life.bio.sunysb.edu/ee/rohlf/software), called tpsUtil, tpsDig and past, were employed for generating truss data from the digital images. tpsUtil was used for converting digital images in “.jpeg” to “.tps” format, tpsDig was utilized to fix landmarks on digital images and to define scale, while past was used to generate the inter-landmark distances. Ten clearly discernible landmarks (1: Tip of the snout; 2: Point on dorsal surface of fish that is exactly perpendicular to the base of pectoral fin; 3: Anterior base of second dorsal fin; 4: Posterior base of second dorsal fin; 5: Dorsal base of caudal fin; 6: Base of central caudal fin rays; 7: Ventral base of caudal fin; 8: Posterior base of anal fin; 9: Anterior base of anal fin and 10: Base of pelvic fin) were identified from the images and used for generating a total of 18 truss morphometric measurements. Since the sampled individuals belonged to different size ranges, the truss measurements were adjusted to account for size variation through the procedure described by Elliott et al. (1995). The standard length of fish analyzed was used as an indicator of size for adjusting the truss data. The size-adjusted truss variables were then analyzed by discriminant function analysis in SPSS version 17.0 for windows. Standardized canonical discriminant function coefficients and coefficients in structure matrix were used as the criteria to identify the discriminating variables between two species.
Results
Analyses of Sequence Variation from COI Showed Two Main “Groups” of Asian Seabass
A 655 bp fragment, inclusive of the 648 bp of the partial mitochondrial COI, recognized as the official DNA barcode for animals (Hebert et al., 2003) was amplified and sequenced from the DNA isolated from a total of 71 Asian seabass samples collected at I-WC, I-EC, I-AN, BAN, SIN, INA, MAL, and THA (Figure 1; Table 1). For the remaining three regions (MYA, AUS-WC, and AUS-EC), the 14 sequences reported in an earlier study were also included for the analyses (Ward et al., 2008). Representative pictures of the Asian seabass collected for this study from the different sampling locations are shown in Figure 2. A larger number of sequences were generated for I-WC (18 sequences) and I-EC (15 sequences) to account for the wide range of sample collection points (Figure 1; Table 1). Finally, a total of 86 COI sequences including 85 for Asian seabass individuals from the 11 regions plus one from the outgroup were compiled and their ML, MP, and ME trees were constructed based on the aligned sequences. Regardless of the method used, the Asian seabass sampled could be subdivided into three clades in the trees (Figure 3). The first clade (with ≥94% bootstrap value) (henceforth referred to as Indian region/Indian clade/India) contains the Asian seabass (52 samples) collected from various locations across the Indian subcontinent as well as Myanmar. The Asian seabass from SE Asia (24 samples) formed a second well-supported clade (≥98% bootstrap value). Within this clade, all the nine samples from Australia existed as a separate clade (≥96% bootstrap value). (Figure 3).
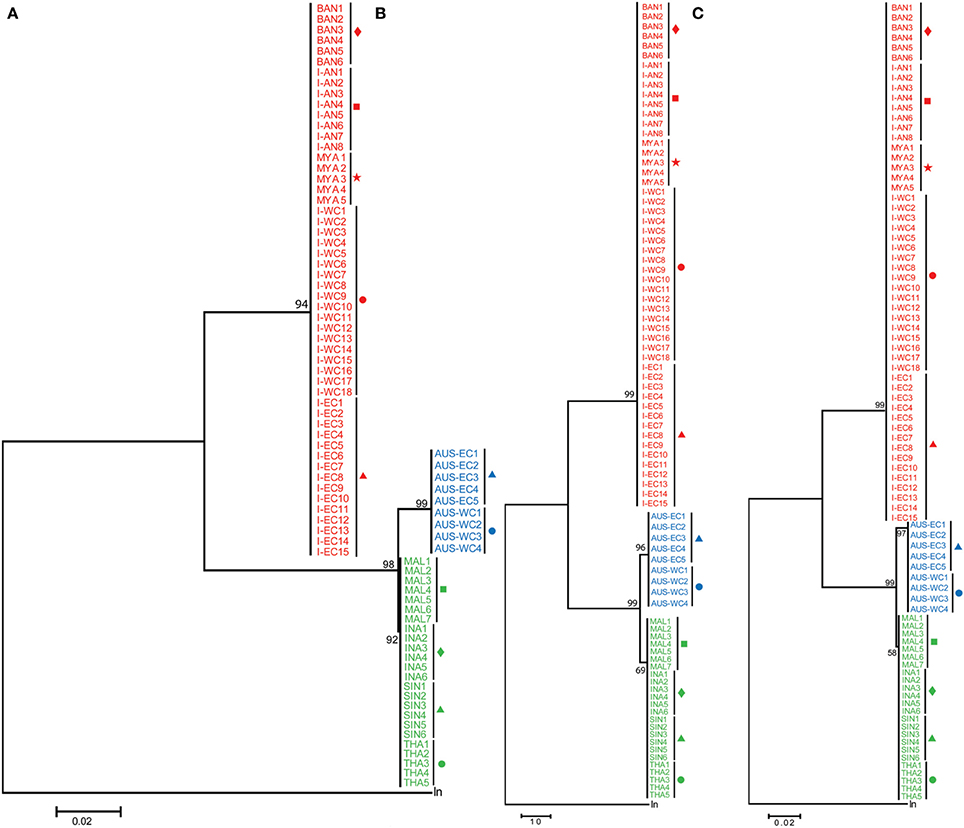
Figure 3. Phylogenetic analyses based on COI sequences. COI sequences from India-Western Coast (I-WC), India-Eastern Coast (I-EC), India-Andaman and Nicobar Islands (I-AN), Bangladesh (BAN), Singapore (SIN), Indonesia (INA), Malaysia (MAL), Thailand (THA), Myanmar (MYA), Australia-Western Australia (AUS-WC), and Australia-Queensland (AUS-EC) were used for Maximum likelihood (ML) (A), Maximum Parsimony (MP) (B) and Minimum Evolution (ME) (C) analyses. Lates niloticus COI sequence was used as an outgroup to root the tree. For each tree, 100 bootstrap replicates were generated and their values are indicated at the nodes. The scale bar represents the number of nucleotide substitutions per site. Taxon label shading and the symbols are in accordance with Figure 1.
Thus, based on the phylogenetic analyses, a total of four genetic groups of seabass could be recognized, these included Asian seabass from Australia (Group A), Malaysia/Indonesia/Thailand/Singapore (Group B) and the Indian region/Myanmar (Group C) as well as Lates niloticus (Group D or outgroup). When COI sequence divergence among taxa was estimated within Group A, the nine sequences reported for Western Australia (4; AUS-WC) and Eastern Australia (5; AUS-EC) were 100% identical to each other. Apart from them, the pairwise comparisons for the sequences from Group B and Group C showed a very low level of intra-group sequence divergence (0.09 ± 0.10% and 0.08 ± 0.10%, respectively). However, these two groups showed an almost 100-fold difference (8.84 ± 0.96%) when compared with each other. Amongst the three groups of Lates calcarifer, Groups A and C were most divergent from each other (9.35 ± 0.09%) while Groups A and B were the least divergent (0.94 ± 0.09%). All these three groups showed a similar percentage of divergence when compared to the Lates niloticus COI sequence (Table 2; Supplementary Figure S2).
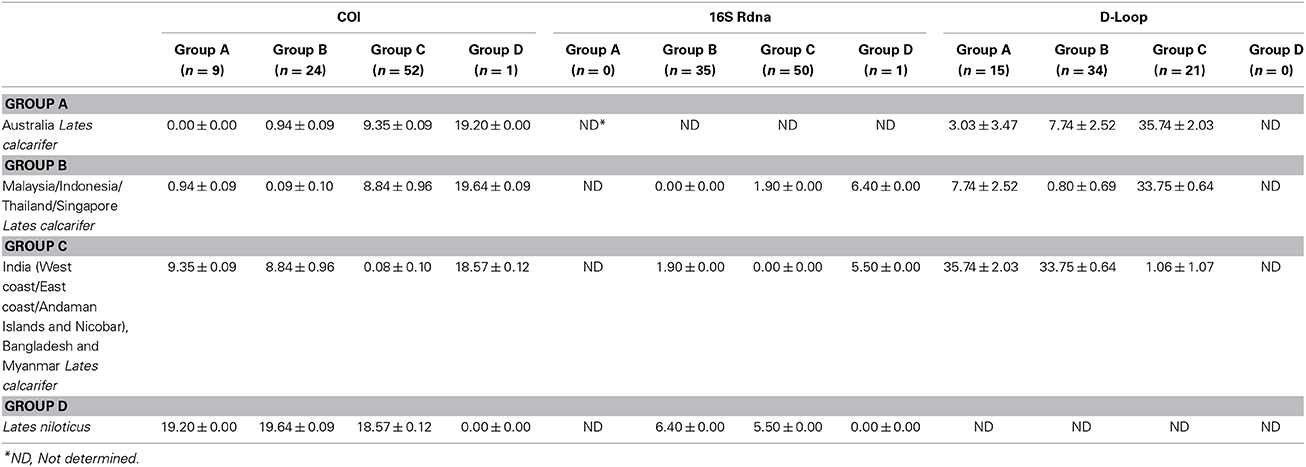
Table 2. Comparison of Kimura 2-parameter distances (%) across different groups of Lates for cytochrome oxidase I (COI), 16S rDNA and D-loop region.
Analyses of 16S Sequences Also Indicated that Asian Seabass from the Indian and Southeast Asian Regions Form Two Distinct “Groups”
Amongst the commonly used mitochondrial genes for barcoding: cytochrome b (CYTB), COI and 16S, the latter exhibits the least nucleotide substitution rate. This attribute makes it unsuitable for the identification of closely related species. To assess whether the 16S sequence exhibits variability between the two groups (Indian region vs. SE Asia), a 493 bp fragment was obtained from 20, 15, 6, 9, 11, 9, 9, and 6 Asian seabass individuals from I-WC, I-EC, I-AN, BAN, SIN, INA, MAL, and THA regions, respectively. Two distinct clades with strong bootstrap support (>90%) were obtained (for ML, MP as well as ME trees), one for the Indian region and the other for the SE Asian region (Figure 4). The 16S sequences within each clade were 100% identical, while the two clades showed a 1.90 ± 0.00% of divergence when compared to each other (Table 2; Supplementary Figure S3). The two clades showed a 6.40 ± 0.00 and 5.50 ± 0.00% of divergence, respectively, with L. niloticus 16S sequence. Of the 85 sequences analyzed, 50 and 35 represented only two haplotypes—the Indian region and the SE Asian region, respectively.
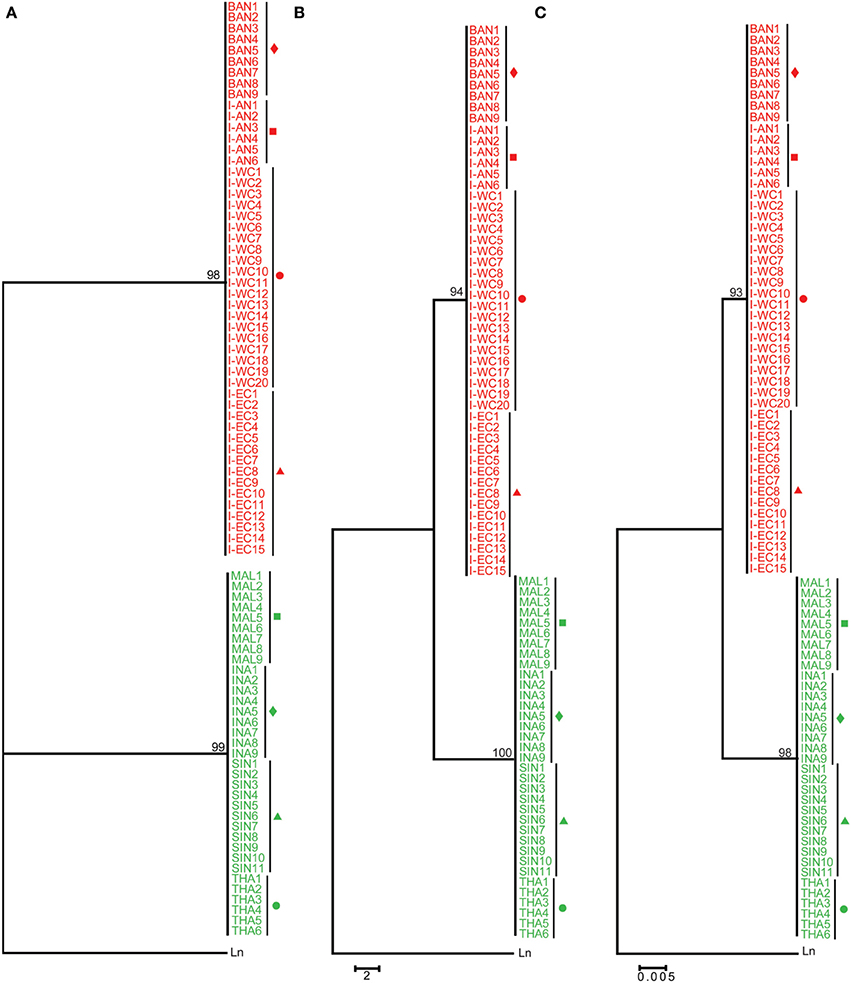
Figure 4. Phylogenetic analyses based on 16S sequences. 16S rDNA sequences from eight regions (for labels and conditions see the legend of Figure 3) were used for ML (A), MP (B), and ME (C) analyses. Lates niloticus 16S rDNA sequence was used as an outgroup to root the tree. For each tree, 100 bootstrap replicates were run and their values are indicated at the nodes. The scale bar represents the number of nucleotide substitutions per site. Taxon label shading and the symbols are in accordance with Figure 1.
Distinct Length Polymorphic Patterns of Amplicons and Sequence Data Obtained from the Mitochondrial Control Region (D-loop) also Supported the Existence of Two Main “Groups” of Asian Seabass
In total, 4, 8, 7, 5, 6, 8, 5, and 5 D-loop sequences were obtained from Asian seabass representing I-WC, I-EC, I-AN, BAN, SIN, INA, MAL, and THA, respectively. These along with 10 (PPD—Singapore) and 15 (BA—Australia) D-loop sequences reported earlier (Lin et al., 2006) were used for phylogenetic and sequence divergence analyses. Intra-group variability was lowest for SE Asian population (Group B: 0.80 ± 0.69%) and highest for the Australian population (Group A: 3.03 ± 3.47%). Amongst the groups, sequence divergence showed a similar (but higher magnitude) pattern as COI, with Australian samples (Group A) being similar to the ones from SE Asia (Group B: 7.74 ± 2.52%) and farthest from the Indian region (Group C: 35.74 ± 2.03%) (Table 2).
From the phylogenetic results based on D-loop sequences, Asian seabass from the Indian region formed a well-supported clade [24 sequences; ML: 99 bootstrap (BS), MP: 99 BS and ME: 100 BS]. However, those from Australia (15 sequences) and SE Asia (34 sequences) could not be clearly distinguished from each other based on the D-loop sequences. Interestingly, the Asian seabass collected from Andaman and Nicobar Islands formed a distinct subgroup (>97% bootstrap support; ~3% difference at the sequence level) within the group representing the Indian region (Figure 5). This implies that the hypervariable region from mitochondrial D-loop may provide better information for resolving the relationships from shallow branches of the trees and phylogeographic patterns for Asian seabass from the Indian region. Finally, it should be noted that due to the fragment length polymorphism of the amplified D-loop-derived PCR products, the samples collected from the Indian and the SE Asian region can be easily differentiated with the former being >1 kb in size, while the latter about 900 bp (Supplementary Figures S1, S4).
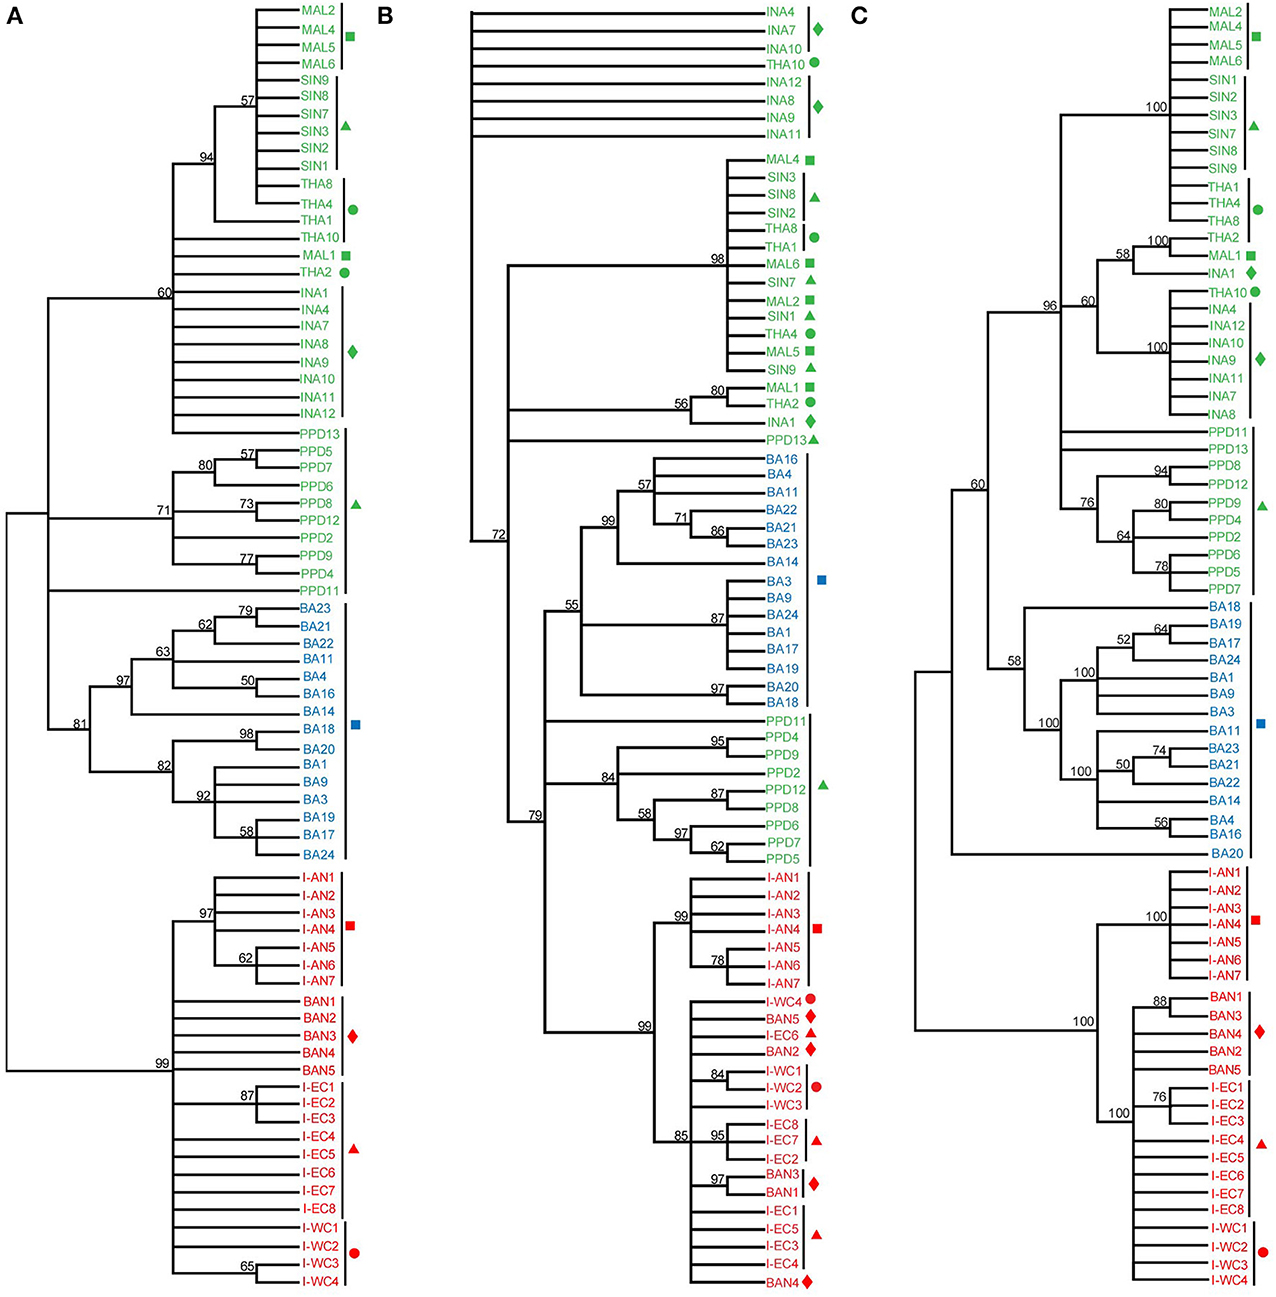
Figure 5. Phylogenetic analysis based on the D-loop region. D-loop sequences from India-Western Coast (I-WC), India-Eastern Coast (I-EC), India-Andaman and Nicobar Islands (I-AN), Bangladesh (BAN), Singapore (SIN as well as PPD), Indonesia (INA), Malaysia (MAL), Thailand (THA), Australia (BA) were used for ML (A), Maximum Parsimony (MP) (B) and Minimum Evolution (ME) (C) trees. Sequences indicated by PPD (Singapore) and BA (Australia) are D-loop sequences published previously (Lin et al., 2006). For each cladogram, 100 bootstrap replicates were run and their values are indicated at the nodes (only nodes with >50 bootstrap support are shown). Taxon label shading and the symbols are in accordance with Figure 1. BA sequences are marked with a blue square.
Morphometric Analyses Identified Differences Between the Asian Seabass from Indian Region and Southeast Asia
Molecular evidence pointed to the existence of at least two distinct genetic groups of Asian seabass seeming to have split across its native range. Discriminant Function Analysis was performed to identify the variables that best discriminate these two species. Altogether, 22 Asian seabass individuals from Singapore (SIN) and 22 from India (I-WC, I-EC, I-AN) were used for this analyses. A total of 10 landmarks were used for generating 18 truss measurements (Figure 2A). The correlation estimates between standard length and original variables were all very high indicating that the variables were influenced by the size (Table 3). The variables were thus adjusted for size by taking into account the standard length. The correlation estimates between standard length and size-adjusted variables were non-significant indicating the effectiveness of size correction. The examination of absolute values of coefficients of variables in discriminant function and the absolute values of coefficients of variables in structure matrix indicated that V3, V5, V6, and V7 are more important than other variables for discriminating the two seabass species (Table 3). These discriminating variables are from the anterior portion of fish abdomen just behind the pectoral fin. The discriminant function could correctly classify about 71% of the individuals analyzed to the respective groups.
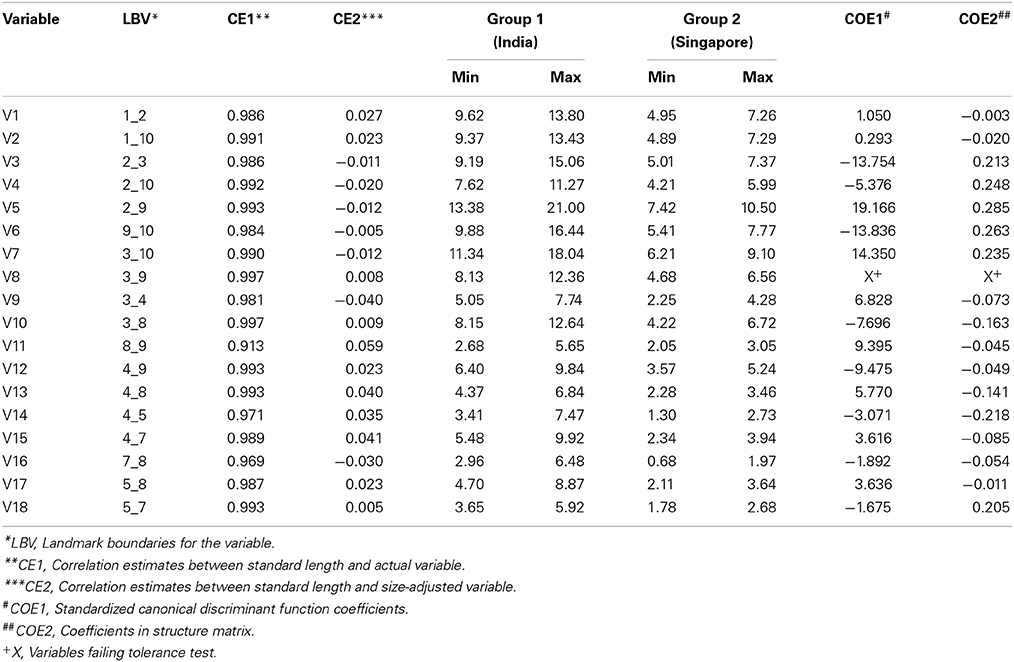
Table 3. Truss morphometric analyses to study differences at the morphological level between the two identified species.
Wild-Caught Individuals Showed the Presence of Indian “Type” Asian Seabass in the Southeast Asian Populations Sampled
During the course of sequencing samples from various geographic regions, six out of 11 individuals from Thailand and two out of eight individuals from Indonesia yielded COI sequences identical to those from the Indian region. The Indian origin of these fishes was further verified by their 16S sequences, which were 100% identical to their Indian region counterparts. These individuals along with the Asian seabass from Malaysia represent wild-caught fishes collected from the South China Sea, while those from Singapore were farmed fishes grown at the Marine Aquaculture Center (AVA, Singapore) (Yue et al., 2009). In the event that the Indian “type” Asian seabass were present in other locations in the South China Sea, these individuals should have also presented themselves in the Malaysian, but not the Singapore population. In order to ascertain this at a larger scale, we made use of the difference in D-loop size of individuals from the Indian region 911 bp) and that of the Asian seabass from SE Asia (1023 bp). The D-loop region was PCR-amplified from individuals representing the East coast of the Malaysian Peninsula (42), the East coast of Thailand (52), Indonesia (South of Jakarta; 59) and Singapore (30). As expected, all the individuals from Singapore showed the same profile as a typical SE Asian type individual (the PCR product being <1 kb). However, populations from the three remaining SE Asian countries all showed the presence of Indian region-type individuals in varying proportions (Malaysia: 7.14%, Indonesia: 18.64%, Thailand: 42.30%). In the majority of cases, these individuals were also verified by partial sequencing of their D-loop region (as well as COI and 16S) and were found to be the same as those from the Indian region (data not shown).
Discussion
The ability to accurately identify a fish species is valuable not only for stock management and conservation ecology, but also from a commercial angle, since many fishes are farmed and have immense value as a source of food. Few nuclear genes/sequences such as rhodopsin, 5S rDNA, Internal Transcribed Spacer 1 (ITS1), 7S ribosomal protein, β-actin and microsatellites have been used for species identification (Pendas et al., 1995; Chow and Hazama, 1998; Lee and Gye, 2001; Sevilla et al., 2007; Chassaing et al., 2011; Hanner et al., 2011; Collins et al., 2012; Herrero et al., 2012; Rehbein, 2013). The use of nuclear gene markers provides the advantage of having a larger number of independent loci to analyze and also the ability to identify hybrids (Chen and Mayden, 2010). However, mitochondrial genes are preferred for barcoding due to the lack of introns, hundreds of copies per cell, haploid genome and a generally higher mutation rate compared to nuclear loci. Amongst the mitochondrial genes, few markers such as CYTB, COI and 16S have been widely used to identify species with COI being recognized as the official barcode sequence in animals (Hebert et al., 2003). Till date, more than 10,000 fish species have been barcoded by the Fish barcode of life program (FISH-BOL, fishbol.org).
The Asian seabass is an important food fish species with a broad native range in Indo-West Pacific. In addition, it has also been introduced for aquaculture in several countries such as Iran, Guam, French Polynesia, USA and Israel (Mathew, 2009). Its wide acclaim is reflected in the many local names it has been given, including koduva, kalaanji, pandugappa, bhetki, and chonak across India and Bangladesh, ikan siakap in Malaysia and barramundi in Australia. Evidence exists pointing to Asian seabass divergence both at the morphological and genetic level (Lin et al., 2006; Ward et al., 2008; Yue et al., 2009; Pethiyagoda and Gill, 2012; this study). Its taxonomy, however, has not been resolved unambiguously, partly since the previous work has not been comprehensive enough and also since different approaches have been used to assess the diversity across different regions, thus, precluding a direct comparison. Therefore, the main aim of the present study was to resolve and establish the species delineation across most of its natural geographic range.
Sequence Analyses Identified Two Distinct Species of Asian Seabass
DNA barcoding of Asian seabass from various locations in Australia, Myanmar and its congeneric Lates niloticus revealed an identical barcode for the nine Asian seabass individuals collected from Australia, but they had a divergence of 9.47 ± 1.22% and 19.30 ± 1.85% from Myanmar seabass and L. niloticus, respectively, based on their COI sequence (Ward et al., 2008). Similar results were obtained when the samples were barcoded using CYTB sequence. Based on this, the authors proposed that the Asian seabass from the two geographic locations (Australia and Myanmar) were congeneric rather than conspecific (Ward et al., 2008). A detailed DNA barcoding effort has been lacking for the Indian and South-East Asian region, nevertheless, a genotyping effort relying on 14 polymorphic microsatellite loci revealed genetic differentiation even between the Southeast Asian and Australian population (Yue et al., 2009). Further, a comprehensive morphometric analysis done for 45 representatives of Lates specimens from various countries representing its geographic range (Australia, India, Malaysia, Myanmar, Singapore, Sri Lanka and Thailand) by a recent study (Pethiyagoda and Gill, 2012), concluded by describing two new species: L. lakdiva from Western Sri Lanka and L. uwisara from eastern Myanmar, with the latter being the same specimens barcoded in the earlier study (Ward et al., 2008).
In this study, we embarked on the task of establishing species delineation by obtaining the sequences of 16S, COI and D-loop regions from several individuals representing a wider (but not yet complete) geographic range of this “Lates calcarifer” species. COI sequences from the individuals representing Australia turned out to be identical. Similarly, the ones from SE Asia (0.09%) and Indian subcontinent/Myanmar (0.1%) showed very little sequence divergence amongst each other within the groups. However, sequence divergence between groups was high with Indian region (including Myanmar) showing differences of 8.91 ± 0.13% and 9.36 ± 0.10% with SE Asia and Australia, respectively, identifying two main distinct groups: (1) Indian region/Myanmar and (2) SE Asia plus Australia.
The main question to answer was whether the observed level of sequence divergence sufficient for these groups to be identified as species. For a particular group to merit being considered a distinct species by following the standard protocol using DNA barcoding, it should exhibit low level of intraspecific differences and high level of interspecific DNA sequence variation (Hebert et al., 2003, 2004; Barrett and Hebert, 2005; Smith et al., 2005; Ward et al., 2005). Ward et al. (2005) barcoded >200 fish species, including mostly teleosts along with chimaerids, sharks and rays and found inter-species variation to be ~25 times higher than the intra-specific one (~9.93% vs. ~0.39%). The within-genus and within-family K2P sequence divergence was much higher at 15.55 and 22.07%, respectively. A similar K2P distance within genera was also seen in a study involving 388 fish species (Ward and Holmes, 2007). In another study, almost 200 species of the Canadian freshwater fish fauna were inventoried using their COI sequences. Conspecific individuals showed a K2P distance of 0.30%, which was >25 times lower than that of congeneric individuals (8.29%) (Hubert et al., 2008). This was also similar to the observation in marine fishes, with conspecific and congeneric individuals displaying 0.4 and 9.9% sequence divergence, respectively. In our study, the Indian region/Myanmar Asian seabass showed ~100 times more variation both against the Australian and SE Asian region in comparison to within group variation (which was quite low for all the groups studied). This indicates that more than one species may exist for Lates calcarifer. On the other hand, the Asian seabass from Australia (Group A) showed ~10× more variation compared to the individuals from SE Asia (Group B). Though most studies have pointed to at least 25× difference, few studies have in fact proposed using a much lesser threshold (10× difference) to help label contingent species (Hebert et al., 2004; Ward et al., 2005, 2008; Steinke et al., 2009; Zemlak et al., 2009). Phylogenetic analyses of the faster evolving D-loop sequences showed more variability for three clades (Group A/B/C), however, only Group C (Indian subcontinent) formed a well-supported group. Therefore, although the Asian seabass from Australia does exhibit divergent sequences to SE Asian ones, but in our opinion, not to the extent for it to be classified as a separate species. This will require future studies with more samples and other approaches (e.g., population genetics) to assess the putative reproductive isolation between the populations or “species.”
Morphological evidence also exists to support the possibility of Asian seabass to split into distinct species. For instance, Pethiyagoda and Gill (2012) did a detailed morphological analysis and reported two new species in addition to L. calcarifer, one from Sri Lanka (L. lakdiva) and the other from Myanmar (L. uwisara). A total of 35 parameters were examined by the authors, of which 18 were non-overlapping between the two proposed new species: Lates lakdiva (Sri Lanka) and Lates uwisara (Myanmar). However, only three parameters were non-overlapping between these two and Lates calcarifer. Also, for doing their morphometric analysis, 2, 3, and 27 specimens of Lates lakdiva, Lates uwisara, and Lates calcarifer, respectively, were used with the latter representing Bangladesh, Western India, SE Asia, and Australia in the study. Our molecular evidence, however, points to a possible misclassification of these particular specimens. This is since specimens from Bangladesh and Western India had the same barcode as fishes from Myanmar, but at the same time they were sufficiently distinct from the individuals from SE Asia and Australia. Further, considering the putative allopatric constraints, it is unlikely that the Asian seabass from Western India, SE Asia and Australia is a single species (Lates calcarifer), but the ones from Sri Lanka (Lates lakdiva) and Myanmar (Lates uwisara) are two distinct species. In fact, although our morphometric analyses do identify a few differences between the two groups identified as distinct species based on our mitochondrial sequence evidence (Indian region and SE Asian/Australian region), however the differences are not very well defined and can at best classify a majority (and not all) of the individuals from the two genetic groups. This could reflect a possibility that the above two groups are “sibling species,” akin to many fish species where species identity is based solely on molecular evidence (due to the lack of distinct morphological differences). In our case too, we observed unambiguous differences at the sequence level, which are distinct enough for diagnosing the individuals from the two groups to be separate species. We have not extended the species name given by Pethiyagoda and Gill (2012) to the species identified in this study as our conclusions are based on different methods of species identification. Future investigations will be required to elucidate their nomenclature.
A study aimed to look at the extent of relatedness across 35 marine fishes with a vast-ranging distribution spanning the Australian and South African waters of the Indian Ocean, found a wide range of sequence divergence (0.05–16.2%; COI). More than 30% of the species tested showed sequence divergence deep enough to be classified as species complex (Zemlak et al., 2009). Due to a substantial number of new species identified by molecular systematic and taxonomic studies, the likely scenario could be that marine diversity is grossly underestimated currently and many more new species would be revealed on closer examination, this, being especially true for species under allopatric effect.
The Presence of Indian “Type” Asian Seabass in the Wild-Caught Populations from Southeast Asia could be an Indication of Translocation Rather than Migration?
Though the Indian region/Myanmar “type” of Asian seabass was detected in all the three wild populations from SE Asia (Malaysia, Thailand and Indonesia), the latter were never found in the Indian region/Myanmar population. Three likely scenarios could possibly explain the presence of the Indian region type individuals in the SE Asian populations. Firstly, it could be due to migration, the extent of which are not known to us. The second possibility could be on account of unrecorded translocations from the Bay of Bengal/Andaman Sea to the South China Sea. Increased cultivation and cross-country translocation have been previously recognized as the main contributing factors resulting in the movement of Lates calcarifer specimen across various geographic locations even in spite of the apparent reproductive constraints. This is especially prevalent in countries such as Malaysia, Thailand, India and Sri Lanka and seems to be the most likely cause for the fish from the Indian region being found in Thailand as well as other locations in the South China Sea (Pethiyagoda and Gill, 2012). Thirdly, it is also possible that the distribution range of “Indian species” extends to the South China Sea and can overlap with that of the “SE Asian+Australian species.” This possibility brings up two interesting questions: (1) What is the relative proportion of the two species on the West coast of Thailand, Malaysia and Indonesia? and (2) To what extent do they hybridize? Additional investigations involving molecular markers or whole genome re-sequencing might help to answer these questions.
A previous effort (Yue et al., 2009) to genotype Asian seabass from various SE Asian countries and Australia was based on the assumption that all the individuals belonged to the same species. Due to which, the individuals were not barcoded, but rather assessed for genetic diversity based on 14 microsatellite loci, this resulted in the inability to detect the presence of Indian region “type” fish in the population. The analyses concluded that the wild-caught populations from SE Asia have the highest allelic and genic diversity with maximum seen in Thailand followed by Indonesia, Malaysia and Singapore. This can now be explained more clearly with our current findings; as the population analyzed from Thailand had the highest representation of the Indian region “type” within the tested population (42.3%) compared to the other wild Asian seabass populations studied from Indonesia and Malaysia and hence consequently displayed maximum genetic diversity in the previous study (Yue et al., 2009).
Conflict of Interest Statement
The authors declare that the research was conducted in the absence of any commercial or financial relationships that could be construed as a potential conflict of interest.
Acknowledgments
This research is supported by the National Research Foundation, Prime Minister's Office, Singapore under its Competitive Research Program (CRP Award No. NRF-CRP7-2010-01).
Supplementary Material
The Supplementary Material for this article can be found online at: http://www.frontiersin.org/journal/10.3389/fmars.2014.00030/abstract
References
Barrett, R. D. H., and Hebert, P. D. N. (2005). Identifying spiders through DNA barcodes. Can. J. Zool. 83, 481–491. doi: 10.1139/z05-024
Chassaing, O., Hanni, C., and Berrebi, P. (2011). Distinguishing species of European sturgeons Acipenser spp. using microsatellite allele sequences. J. Fish Biol. 78, 208–226. doi: 10.1111/j.1095-8649.2010.02852.x
Chen, W.-J., and Mayden, R. L. (2010). A phylogenomic perspective on the new era of ichthyology. BioScience 60, 421–432. doi: 10.1525/bio.2010.60.6.6
Chou, R., and Lee, H. B. (1997). Commercial marine fish farming in Singapore. Aquacult. Res. 28, 767–776. doi: 10.1111/j.1365-2109.1997.tb01001.x
Chow, S., and Hazama, K. (1998). Universal PCR primers for S7 ribosomal protein gene introns in fish. Mol. Ecol. 7, 1255–1256.
Collins, R. A., Armstrong, K. F., Meier, R., Yi, Y., Brown, S. D., Cruickshank, R. H., et al. (2012). Barcoding and border biosecurity: identifying cyprinid fishes in the aquarium trade. PLoS ONE 7:e28381. doi: 10.1371/journal.pone.0028381
Elliott, N. G., Haskard, K., and Koslow, J. A. (1995). Morphometric analysis of orange roughy (Hoplostethus atlanticus) off the continental slope of southern Australia. J. Fish Biol. 46, 202–220. doi: 10.1111/j.1095-8649.1995.tb05962.x
Felsenstein, J. (1985). Confidence limits on phylogenies: an approach using the bootstrap. Evolution 39, 783–791. doi: 10.2307/2408678
Froese, R., and Pauly, D. (eds.). (2014). FishBase. World Wide Web electronic publication. Available online at: http://www.fishbase.com
Frost, L. A., Evans, B. S., and Jerry, D. R. (2006). Loss of genetic diversity due to hatchery culture practices in barramundi (Lates calcarifer). Aquaculture 261, 1056–1064. doi: 10.1016/j.aquaculture.2006.09.004
Hall, T. A. (1999). BioEdit: a user-friendly biological sequence alignment editor and analysis program for Windows 95/98/NT. Nucleic Acids Symp. Ser. 41, 95–98.
Hanner, R., Floyd, R., Bernard, A., Collette, B. B., and Shivji, M. (2011). DNA barcoding of billfishes. Mitochondrial DNA 1, 27–36. doi: 10.3109/19401736.2011.596833
Hasegawa, M., Kishino, H., and Yano, T. (1985). Dating of the human-ape splitting by a molecular clock of mitochondrial DNA. J. Mol. Evol. 22, 160–174. doi: 10.1007/BF02101694
Hebert, P. D. N., Cywinska, A., Ball, S. L., and deWaard, J. R. (2003). Biological identifications through DNA barcodes. Proc. R. Soc. Lond. B 270, 313–321. doi: 10.1098/rspb.2002.2218
Hebert, P. D., Penton, E. H., Burns, J. M., Janzen, D. H., and Hallwachs, W. (2004). Ten species in one: DNA barcoding reveals cryptic species in the neotropical skipper butterfly Astraptes fulgerator. Proc. Natl. Acad. Sci. U.S.A. 101, 4812–14817. doi: 10.1073/pnas.0406166101
Herrero, B., Lago, F. C., Vieites, J. M., and Espineira, M. (2012). Real-time PCR method applied to seafood products for authentication of European sole (Solea solea) and differentiation of common substitute species. Food Addit. Contam. Part A Chem. Anal. Control Expo. Risk Assess 29, 12–18. doi: 10.1080/19440049.2011.623682
Hubert, N., Hanner, R., Holm, E., Mandrak, N. E., Taylor, E., Burridge, M., et al. (2008). Identifying Canadian freshwater fishes through DNA barcodes. PLoS ONE 3: e2490. doi: 10.1371/journal.pone.0002490
Kimura, M. (1980). A simple method for estimating evolutionary rates of base substitutions through comparative studies of nucleotide sequences. J. Mol. Evol. 16, 111–120. doi: 10.1007/BF01731581
Lanave, C., Preparata, G., Saccone, C., and Serio, G. (1984). A new method for calculating evolutionary substitution rates. J. Mol. Evol. 20, 86–93. doi: 10.1007/BF02101990
Larkin, M. A., Blackshields, G., Brown, N. P., Chenna, R., McGettigan, P. A., McWilliam, H., et al. (2007). ClustalW and ClustalX version 2. Bioinformatics 23, 2947–2948. doi: 10.1093/bioinformatics/btm404
Lee, J. S., and Gye, M. C. (2001). Use of beta-actin gene intron 2 as a phylogenetic marker in fish taxonomy. DNA Seq. 12, 71–76. doi: 10.3109/10425170109042053
Lin, G., Lo, L. C., Zhu, Z. Y., Feng, F., Chou, R., and Yue, G. H. (2006). The complete mitochondrial genome sequence and characterization of single-nucleotide polymorphisms in the control region of the Asian Seabass (Lates calcarifer). Marine Biotechnol. 8, 71–79. doi: 10.1007/s10126-005-5051-z
Mathew, G. (2009). “Taxonomy, identification and biology of seabass (Lates calcarifer),” in National Training on 'Cage Culture of Seabass' held at CMFRI (Kochi).
Moore, R. (1979). Natural sex inversion in the giant perch (Lates calcarifer). Mar. Freshwater Res. 30, 803–813. doi: 10.1071/MF9790803
Moore, R., and Reynold, L. F. (1982). Migration patterns of barramundi, Lates calcarifer (Bloch), in Papua New Guinea. Mar. Freshwater Res. 33, 671–682. doi: 10.1071/MF9820671
Pendas, A. M., Moran, P., Martinez, J. L., and Garcia-Vazquez, E. (1995). Applications of 5S rDNA in Atlantic salmon, brown trout, and in Atlantic salmon x brown trout hybrid identification. Mol. Ecol. 4, 275–276. doi: 10.1111/j.1365-294X.1995.tb00220.x
Pethiyagoda, R., and Gill, A. C. (2012). Description of two new species of sea bass (Teleostei: Latidae: Lates) from Myanmar and Sri Lanka. Zootaxa 3314, 1–16. Available onlne at: http://www.mapress.com/zootaxa/2012/f/zt03314p016.pdf
Rehbein, H. (2013). Differentiation of fish species by PCR-based DNA analysis of nuclear genes. Eur. Food Res. Technol. 236, 979–990. doi: 10.1007/s00217-013-1961-6
Sevilla, R. G., Diez, A., Noren, M., Mouchel, O., Jerome, M., Verrez-Bagnis, V., et al. (2007). Primers and polymerase chain reaction conditions for DNA barcoding teleost fish based on the mitochondrial cytochrome b and nuclear rhodopsin genes. Mol. Ecol. Notes 7, 730–734. doi: 10.1111/j.1471-8286.2007.01863.x
Smith, P. J., Mcveagh, S. M., Allain, V., and Sanchez, C. (2005). DNA identification of gut contents of large pelagic fishes. J. Fish Biol. 67, 1178–1183. doi: 10.1111/j.0022-1112.2005.00804.x
Steinke, D., Zemlak, T. S., and Hebert, P. D. (2009). Barcoding nemo: DNA-based identifications for the ornamental fish trade. PLoS ONE 4:e6300. doi: 10.1371/journal.pone.0006300
Tamura, K., Dudley, J., Nei, M., and Kumar, S. (2007). MEGA4: Molecular Evolutionary Genetics Analysis (MEGA) software version 4.0. Mol. Biol. Evol. 24, 1596–1599. doi: 10.1093/molbev/msm092
Tamura, K., Stecher, G., Peterson, D., Filipski, A., and Kumar, S. (2013). MEGA6: molecular evolutionary genetics analysis version 6.0. Mol. Biol. Evol. 30, 2725–2729. doi: 10.1093/molbev/mst197
Ward, R. D., and Holmes, B. H. (2007). An analysis of nucleotide and amino acid variability in the barcode region of cytochrome c oxidase I (cox1) in fishes. Mol. Ecol. Notes 7, 899–907. doi: 10.1111/j.1471-8286.2007.01886.x
Ward, R. D., Holmes, B. H., and Yearsley, G. K. (2008). DNA barcoding reveals a likely second species of Asian sea bass (barramundi) (Lates calcarifer). J. Fish Biol. 72, 458–463. doi: 10.1111/j.1095-8649.2007.01703.x
Ward, R. D., Zemlak, T. S., Innes, B. H., Last, P. R., and Hebert, P. D. (2005). DNA barcoding Australia's fish species. Philos. Trans. R. Soc. Lond. B Biol. Sci. 360, 1847–1857. doi: 10.1098/rstb.2005.1716
Yue, G. H., and Orban, L. (2005). A simple and affordable method for high-throughput DNA extraction from animal tissues for polymerase chain reaction. Electrophoresis 26, 3081–3083. doi: 10.1002/elps.200410411
Yue, G. H., Xia, J. H., Liu, F., and Lin, G. (2012). Evidence for female-biased dispersal in the protandrous hermaphroditic Asian seabass, Lates calcarifer. PLoS ONE 7:e37976. doi: 10.1371/journal.pone.0037976
Yue, G. H., Zhu, Z. Y., Lo, L. C., Wang, C. M., Lin, G., Feng, F., et al. (2009). Genetic variation and population structure of Asian seabass (Lates calcarifer) in the Asia-Pacific region. Aquaculture 293, 22–28. doi: 10.1016/j.aquaculture.2009.03.053
Zemlak, T. S., Ward, R. D., Connell, A. D., Holmes, B. H., and Hebert, P. D. N. (2009). DNA barcoding reveals overlooked marine fishes. Mol. Ecol. Resour. 9, 237–242. doi: 10.1111/j.1755-0998.2009.02649.x
Keywords: Lates calcarifer, COI, 16S rDNA, D-loop, barcoding
Citation: Vij S, Purushothaman K, Gopikrishna G, Lau D, Saju JM, Shamsudheen KV, Kumar KV, Basheer VS, Gopalakrishnan A, Hossain MS, Sivasubbu S, Scaria V, Jena JK, Ponniah AG and Orbán L (2014) Barcoding of Asian seabass across its geographic range provides evidence for its bifurcation into two distinct species. Front. Mar. Sci. 1:30. doi: 10.3389/fmars.2014.00030
Received: 31 March 2014; Accepted: 16 July 2014;
Published online: 05 August 2014.
Edited by:
Wei-Jen Chen, National Taiwan University, TaiwanReviewed by:
Sébastien Lavoué, National Taiwan University, TaiwanJuan Andrés López, University of Alaska Fairbanks, USA
Copyright © 2014 Vij, Purushothaman, Gopikrishna, Lau, Saju, Shamsudheen, Kumar, Basheer, Gopalakrishnan, Hossain, Sivasubbu, Scaria, Jena, Ponniah and Orbán. This is an open-access article distributed under the terms of the Creative Commons Attribution License (CC BY). The use, distribution or reproduction in other forums is permitted, provided the original author(s) or licensor are credited and that the original publication in this journal is cited, in accordance with accepted academic practice. No use, distribution or reproduction is permitted which does not comply with these terms.
*Correspondence: Shubha Vij and László Orbán, Reproductive Genomics Group, Strategic Research Program, Temasek Life Sciences Laboratory, 1 Research Link, National University of Singapore, Singapore 117604, Singapore e-mail: shubha@tll.org.sg; laszlo@tll.org.sg