Interpreting environmental change in coastal Alaska using traditional and scientific ecological knowledge
 William G. Ambrose Jr.1,2*
  Lisa M. Clough3
  Jeffrey C. Johnson4,5
  Michael Greenacre2,6 David C. Griffith7 Michael L. Carroll2
  Alex Whiting8
- 1Department of Biology, Bates College, Lewiston, ME, USA
- 2Akvaplan-niva, FRAM- High North Research Centre for Climate and the Environment, Tromsø, Norway
- 3Division of Polar Programs, National Science Foundation, Arlington, VA, USA
- 4Department of Sociology and Institute for Coastal Science and Policy, East Carolina University, Greenville, NC, USA
- 5Department of Anthropology, University of Florida, Gainesville, FL, USA
- 6Department of Economics and Business, Universitat Pompeu Fabra, and Barcelona Graduate School of Economics, Barcelona, Spain
- 7Department of Anthropology and Institute for Coastal Science and Policy, East Carolina University, Greenville, NC, USA
- 8Native Village of Kotzebue, Kotzebue, AK, USA
Humans who interact directly with local ecosystems possess traditional ecological knowledge that enables them to detect and predict ecosystem changes. Humans who use scientific ecological methods can use species such as mollusks that lay down annual growth rings to detect past environmental variation and use statistical models to make predictions about future change. We used traditional ecological knowledge shared by local Iñupiaq, combined with growth histories of two species of mollusks, at different trophic levels, to study local change in the coastal ecosystems of Kotzebue, Alaska, an area in the Arctic without continuous scientific monitoring. For the mollusks, a combination of the Arctic Oscillation and total Arctic ice coverage, and summer air temperature and summer precipitation explained 79–80% of the interannual variability in growth of the suspension feeding Greenland cockle (Serripes groenlandicus) and the predatory whelk (Neptunea hero), respectively, indicating these mollusks seem to be impacted by local and regional environmental parameters, and should be good biomonitors for change in coastal Alaska. The change experts within the Kotzebue community were the elders and the fishers, and they observed changes in species abundance and behaviors, including benthic species, and infer that a fundamental change in the climate has taken place within the area. We conclude combining traditional and scientific ecological knowledge provides greater insight than either approach alone, and offers a powerful way to document change in an area that otherwise lacks widespread quantitative monitoring.
Introduction
The average atmospheric temperature in the Arctic has increased twice as fast as the average temperature for the rest of the world over the past 50 years, and is predicted to continue to increase rapidly over the next 100 years (Arctic Climate Impact Assessment, 2005). The marine and terrestrial ecosystem changes accompanying these rising temperatures have especially strong impacts on the humans who depend on these ecosystems for their survival and quality of life (Morison et al., 2000; Huntington et al., 2012). We assert that some humans who interact with ecosystems are more attuned to observe changes than others, and are therefore able to report more accurately on such changes (Davis and Wagner, 2003). Similarly, not all species within the ecosystem will be affected equally; rather some species are more sensitive to rapid climate change than others (Wassmann et al., 2011). While the emphasis on sensitivity is typically focused on an organism's ability to withstand change, there is also a component of sensitivity related to the ability to detect or record change. Whereas many studies of climate change only use key indicators that are physical in nature (e.g., atmospheric concentrations of carbon dioxide, sea surface temperature), we advocate here for combining knowledge from key ecosystem components and key human observers in an integrated approach to monitoring and assessing environmental change, especially in areas without continual monitoring of physical variables.
Traditional ecological knowledge (TEK) accumulates in individuals who regularly interact with the natural environment, often via a subsistence lifestyle, making it possible to discern changes occurring over several human generations. TEK can provide information on time scales of 100 years or more (Davis and Wagner, 2003; Shackeroff et al., 2011), and people with high levels of TEK often successfully predict the behaviors of fish, mammals, and other higher trophic level organisms by monitoring how natural resources respond to natural and anthropogenic conditions, and tracking environmental change over time (Griffith, 2006; Menzies and Butler, 2006) (Figure 1). TEK derived from subsistence and commercial resource extraction activities is especially sensitive to environmental changes, as success in obtaining resources is tied to an ability to predict and respond to changing conditions (Huntington, 2000). Further, TEK can be studied using structured methodologies that afford the systematic documentation of cultural beliefs about species, climate, food webs, and other dimensions of natural environments (Boster and Johnson, 1989; García Quijano, 2007). This approach allows a comparison with, and integration into, scientific ecological knowledge (SEK) models. Incorporating TEK into more traditional SEK studies can improve the breadth of research findings while also providing legitimacy to scientific findings for local communities, broadening the knowledge set that local communities can draw on as they develop effective responses to changing ecosystems.
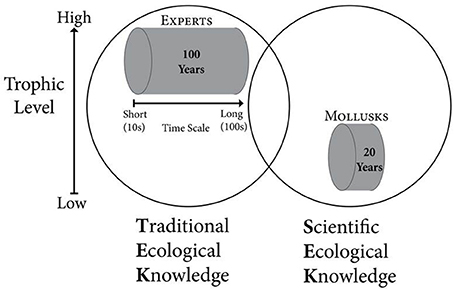
Figure 1. Conceptual model for integrating traditional ecological knowledge (TEK) and scientific ecological knowledge (SEK) of ecosystem change. Experts and Mollusks represent members of the human population and ecosystem (represented by the circles), respectively, who accurately monitor environmental conditions. Experts generally rely on information gathered at mid-high trophic levels (and are themselves usually at these trophic positions) while mollusks reflect conditions at low-mid trophic levels. The length of the cylinders represents the time scale covered by each source of environmental information.
We used both TEK and SEK to understand coastal environmental change in Kotzebue Sound, Alaska, an area without continuous scientific monitoring from, for example, oceanographic moorings. Our scientific knowledge of the history of change within the system was based on the growth patterns of two common mollusks. There is a close relationship between benthic and water column processes in the Arctic (Grebmeier et al., 1988; Ambrose and Renaud, 1995; Dunton et al., 2005), making long-lived, sessile, benthic organisms particularly good biomonitors of environmental change on Arctic shelves (Wanamaker et al., 2011; Kortsch et al., 2012; Mann et al., 2013). A wide range of marine climate conditions can be reconstructed from the growth and shell chemistry of mollusks (Richardson, 2001; Wanamaker et al., 2011). In Kotzebue Sound, Alaska, we used the shell growth of the suspension feeding Greenland cockle Serripes groenlandicus and the predatory whelk Neptunea hero to provide a temporally consistent and uninterrupted record of change over decadal time scales (Figure 1).
Ducklow et al. (2009) maintain that attribution of longer-term changes in marine ecosystems is best assessed with a minimum 50-year dataset, and they assert that documenting a regime shift takes at least a decade of data. Mollusks shells can provide high-resolution seasonal records and while at least one species is known to live in excess of 500 years (Butler et al., 2013), most live on the order of 50 years or less (Gröcke and Gillikin, 2008). The mollusks we examined lived 15–20 years, so use of TEK was necessary to distinguish climate change from climate oscillation in the mollusk growth data. The objectives of our study were to: (1) determine the derived annual growth patterns of mollusks; (2) determine if the patterns of change in mollusk growth were related to environmental parameters for which records are available (with 1 and 2 providing us with information about annual change on decadal time scales); and then (3) determine if there was a shared consensus about ecosystem change within the Kotzebue community, and (4) if within that community there were change experts (with 3 and 4 providing us with information about broader change, over longer temporal scales). We then combine these two forms of knowledge, which we feel results in a much more comprehensive assessment of local environmental change than either type of knowledge could alone.
Materials and Methods
Study Site and Organisms
Kotzebue, Alaska (67° 00′ N, 163° 00′ W), is a town of approximately 3500 people, around 85% of whom are Iñupiaq, with the majority enrolled in the Native Village of Kotzebue (NVK), the federally recognized tribal government. Tribal organizations and corporations, federal, state, tribal, and city government, a hospital, school, and service and transportation industries provide the bulk of the employment in the community. Many Kotzebue households are still dependent on caribou, seal, salmon, sheefish, berries, and other flora and fauna for food, clothing, crafts manufacture, and cultural wellness. The town's population fluctuates seasonally, with many families residing in hunting and fishing camps at various times of the year. Because subsistence is so much a part of the local economy, most jobs provide paid subsistence leave.
Kotzebue Sound is a shallow (average water depth 10–18 m) embayment in the southeast Chukchi Sea. The area is characterized by long, severely cold winters and short, cool summers. Sea ice is typically present from October to June, leaving the sound ice-free for a maximum duration of 4 months. Sediments, poorly to very poorly sorted, are primarily muddy sand to sandy mud, with a minor portion of gravel (Feder et al., 1991). The predominant currents are counterclockwise, with clockwise circulation occasionally occurring at shallower depths (Kinder et al., 1977). During the period of sea ice formation, cold, high salinity bottom water flows out of the Sound via the deepest (28 m) channel.
The shallow depth of the Sound and the influence of two major rivers (the Noatak and Kobuk), result in large annual changes in both the temperature and salinity of the Sound's near shore waters (annual water temperature range of −0.8–15°C and a salinity range of 0.1–35.09 ppt. in 3 m water). The mollusks used in this study were collected at ca. 10 m water depth near Cape Krusenstern (67° 04.9′ N, 163° 41.5′ W) and Cape Blossom (66° 45.1′ N, 162° 39.2′ W). We measured water column properties at collection sites at the time of sampling with a CTD. The mean bottom water temperature during sampling for the years 2002, 2003, and 2004 was 5.5°C (range 4.8–7.3°C) at Cape Krusenstern and 10.2°C (range 6.6–13.6°C) at Cape Blossom. Bottom salinity averaged 28.94 ppt. (range 27.34–29.92 ppt.) at Cape Krusenstern and 21.99 ppt. (range 18.15–27.9 ppt.) at Cape Blossom.
S. groenlandicus (hereafter Serripes) is a large suspension feeding cockle that has a circumpolar distribution (Kafanov, 1980; Koszteyn et al., 1990; Coan et al., 2000). Throughout the Arctic it is an important food for walruses (Fisher and Stewart, 1997; Born et al., 2003), bearded seals (Lowry et al., 1980; Finley and Evans, 1983), and bottom-feeding birds (Merkel et al., 2007). N. heros (hereafter Neptunea), is a large predatory whelk that is common in the Beaufort, Chukchi, and Bering Seas (Wagner, 1977; Feder et al., 1991, 2005). It preys on mollusks, including Serripes and other infaunal taxa (Ambrose, personal observation 2002). Although whelks are sometimes found in the stomachs of marine mammals (Finley and Evans, 1983) they are not common prey for marine mammals.
Standard Growth Index for Serripes and Neptunea
Serripes were collected during July in 2002 (N = 16 individuals), 2003 (N = 6), and 2004 (N = 7) using an otter trawl (2 m mouth) fitted with a tickler chain from approximately 10 m water depth off Cape Krusenstern (2002 and 2003) and off Cape Blossom (2004). The trawl was towed at 2 knots parallel to shore for 20–25 min. Only live cockles with undamaged shells were used for analyses. Neptunea were collected by two means: (1) using the same trawl used to collect Serripes, and (2) provided to us by local fishers from their crab traps. In 2003, Neptunea (N = 27) were trawled from the same areas off Cape Krusenstern and Cape Blossom as Serripes. In 2006, all individuals (N = 80) were collected from crab traps placed 2–6 nautical miles off Cape Krusenstern. A total of 29 Serripes and 103 Neptunea were used in our subsequent analyses.
We only used the hard parts of the mollusks in this study. Serripes deposit annual lines that are visible on the external shell surface, and appear as thin dark lines deposited during the slow growth periods in the winter, separated by thicker light bands representing the faster summer growth. These lines have been verified as annual in Serripes in both the Chukchi Sea (Khim et al., 2003) and in two fjords on Svalbard (Ambrose et al., 2012). The distances between the ventral edges of successive growth lines along the line of maximum growth (shell height) were measured with a digital caliper to the nearest 0.01 mm. We excluded growth beyond the last growth line in analyses because this represents an incomplete growth year. The articulated growth steps, or striate, on the internal face of the opercula of Neptunea species and other genera of Buccinidae also correspond to the summer growth season, and the interrupting depressions to winter quiescence (Richardson et al., 2005). While we did not validate the annual deposition of striate in Neptunea heros for Kotzebue Sound, we presume the same pattern that occurs in other Neptunea species (Richardson et al., 2005). Annual growth of each Neptunea was thus measured as the distance between each annulus as described above for Serripes.
Annual mollusk growth declines with age, so it is necessary to standardize growth increments within an individual and among individuals of different ages before growth can be compared among years. Each growth increment can be assigned to a calendar year because we collected all individuals live and lines are deposited annually. The same methods were applied to Serripes and Neptunea data. We followed established methods (Jones et al., 1989; Ambrose et al., 2006) to remove the ontogentic change in growth rate. Briefly, we used the von Bertalanffy growth function and its first derivative with respect to time to derive a predicted change in shell height for each age based on all individuals in the population. Then we calculated the expected increase in shell height for each individual for each calendar year of its life. Finally, we divided the measured shell growth for each calendar year by the expected growth for that year to generate a standardized growth index (SGI). This standardization process removes the ontogenetic changes in growth and equalizes the variance for the entire series (Fritts, 1976). Once annual changes in shell or operculum growth were standardized, we calculated the mean SGI for each calendar year from all individuals, although individual growth (rather than means) was used for the linear mixed models. The result is an annually resolved growth record, reflecting relatively better and poorer growth years compared to the expected von Bertalanffy fit of the data. An SGI greater than 1 indicates a better than average year for growth, while a value less than 1 reflects a worse than average growth year.
Climatological and Meteorological Data
We obtained climatological and meteorological data from published sources. We examined two Arctic climate indices with potential influence on the region: the Arctic Climate Regime Index (ACRI), and the Arctic Oscillation (AO). Recently, Proshutinsky has refined and re-evaluated the ACRI, resulting in some slight changes to the originally published ACRI values (Johnson et al., 1999). Data for the AO were obtained from http://www.cpc.ncep.noaa.gov/products/precip/CWlink/daily_ao_index/ao_index.html.
We also related growth patterns to three regional indices that influence North Pacific ecosystems: the North Pacific Index NPI-Aleutian Low, reflecting the intensity of the mean winter (November through March) Aleutian low pressure cell; the Siberian/Alaskan Index, the difference between mean winter (December through March) pressure anomalies in eastern Siberia and the Yukon (Alaska); and the Pacific Decadal Oscillation (PDO), a recurring pattern of variability in climate with pan-Pacific effects on marine ecosystems (Overland and Wang, 2005; Overland et al., 2008). For the PDO, we examined the impact of the annual PDO and the summer (June through September) and winter (December through March) indices. The North Pacific Index-Aleutian Low, Siberian/Alaskan Index, and the PDO values were obtained from http://www.beringclimate.noaa.gov/data/.
Meteorological data for the Kotzebue Airport were obtained from the Western Regional Climate Center (http://www.wrcc.dri.edu). We used these data to calculate mean winter (December through March) and summer (June through September) values for wind and mean summer, winter, and annual values for air temperature and precipitation.
Local ice conditions were estimated from the data point nearest Kotzebue Sound collected by the Nimbus-7 SMMR and DMSP SSM/I passive microwave satellite and obtained from the National Snow and Ice Data Center (http://nsidc.org/data/seaice/pm.html). The spatial resolution of the satellite imagery is 25 × 25 km, and the cell used for the ice analysis was located at 67° 5.4′ N, 163° 41.5′ W. The temporal resolution is daily from 1990 to 2005. For our analysis we used the Julian date of freeze-up and break-up defined as the day when ice concentration first falls above or below, respectively, 50%. The threshold used to define ice-free days was ice cover <25%.
We obtained data on total Arctic-wide spatial extent (million km2) of pack ice from the US National Snow and Ice Data Center (https://nsidc.org/data/seaice_index/). We used these data to determine several measures of regional ice conditions: annual average extent of total ice in the Arctic, maximum ice extent (typically in March), autumn ice (average October through December ice coverage), ice coverage the previous 6 months (January through June of the year preceding growth), and an ice anomaly index (percent difference between the average annual total ice coverage and the average Arctic ice cover from 1980 to 2006).
Mollusk Statistical Analysis
To verify if averaging the growth rates of the individuals sampled was warranted, we computed the Cronbach α measure of reliability (Bland and Altman, 1997) for the available growth data on a common set of years (1990–2003). The reliability coefficient measures the homogeneity of the mollusk growth rates. Cronbach α was 0.81 for Serripes; values of α above 0.7 are considered fairly reliable. The growth of individual Neptunea was remarkably homogeneous with a very high Cronbach α measure of reliability (0.94).
We used linear mixed modeling (for example, Pinheiro and Bates, 2000) on individual growth rates, as implemented in the R package nlme, to identify significant relationships between, in this case, mollusk growth rates and the environmental variables. We also investigated the time-dependence between data in consecutive years, leading us to incorporate two data transformations: 2-year running means of environmental data to reduce the magnitude of interannual variability of environmental data, and a 1-year lag in both the original variables and in their running means to account for the time it may take for physical processes to be reflected in shell growth. In these models the mollusks define the random effect, and an autoregressive lag-1 correlation is incorporated into the modeling at the mollusk level across the years.
All subsets of two predictor variables were then investigated (over 6000 models) as well as all subsets of three predictors (over 200,000 models) in an attempt to detect optimum combinations of variables to explain mollusk growth. For the best subsets, interaction effects were also investigated. Models were selected based on the AIC criterion, which penalizes the number of parameters in the model. In order to measure the success of the model in recovering mean growth rates, the predicted growth rates from the models were correlated with mean observed growth rates and then squared to give an R2 measure similar to that obtained in regression.
Assessing Traditional Ecological Knowledge
There were two phases of sampling for the TEK portion of the study (Johnson and Weller, 2002). In Phase I, in-depth interviews were conducted with a non-probability sample of Iñupiaq hunters and fishers in the region who were identified as being knowledgeable about the Kotzebue Sound ecosystem, including hunters and fishers from the villages of Kotzebue and Noatak. In Phase II, the sample consisted of the top 79 hunters and fishers as determined from hunting and fishing records provided by the Native Village of Kotzebue (NVK). The interview protocol for the study was approved by both the East Carolina University Institutional Review Board and the NVK and written consent was obtained from all interviewees.
The Phase I open-ended interviews focused on individuals' uses of local natural resources and the behavior of marine organisms, including their views about how natural resources functioned and changed over time, yielding 25 ecological narratives. During these interviews, respondents routinely spoke of the ways that various features of the natural environment had either changed or not changed over their lifetimes. The narratives were thematically coded and common themes and associated propositions were compiled in an agree/disagree format (Johnson and Weller, 2002). We developed a list of 102 propositions, and subsequently asked the 79 Iñupiaq hunter-fishers (Phase II sample) whether or not they agreed or disagreed with each of the propositions (e.g., see Table 1).
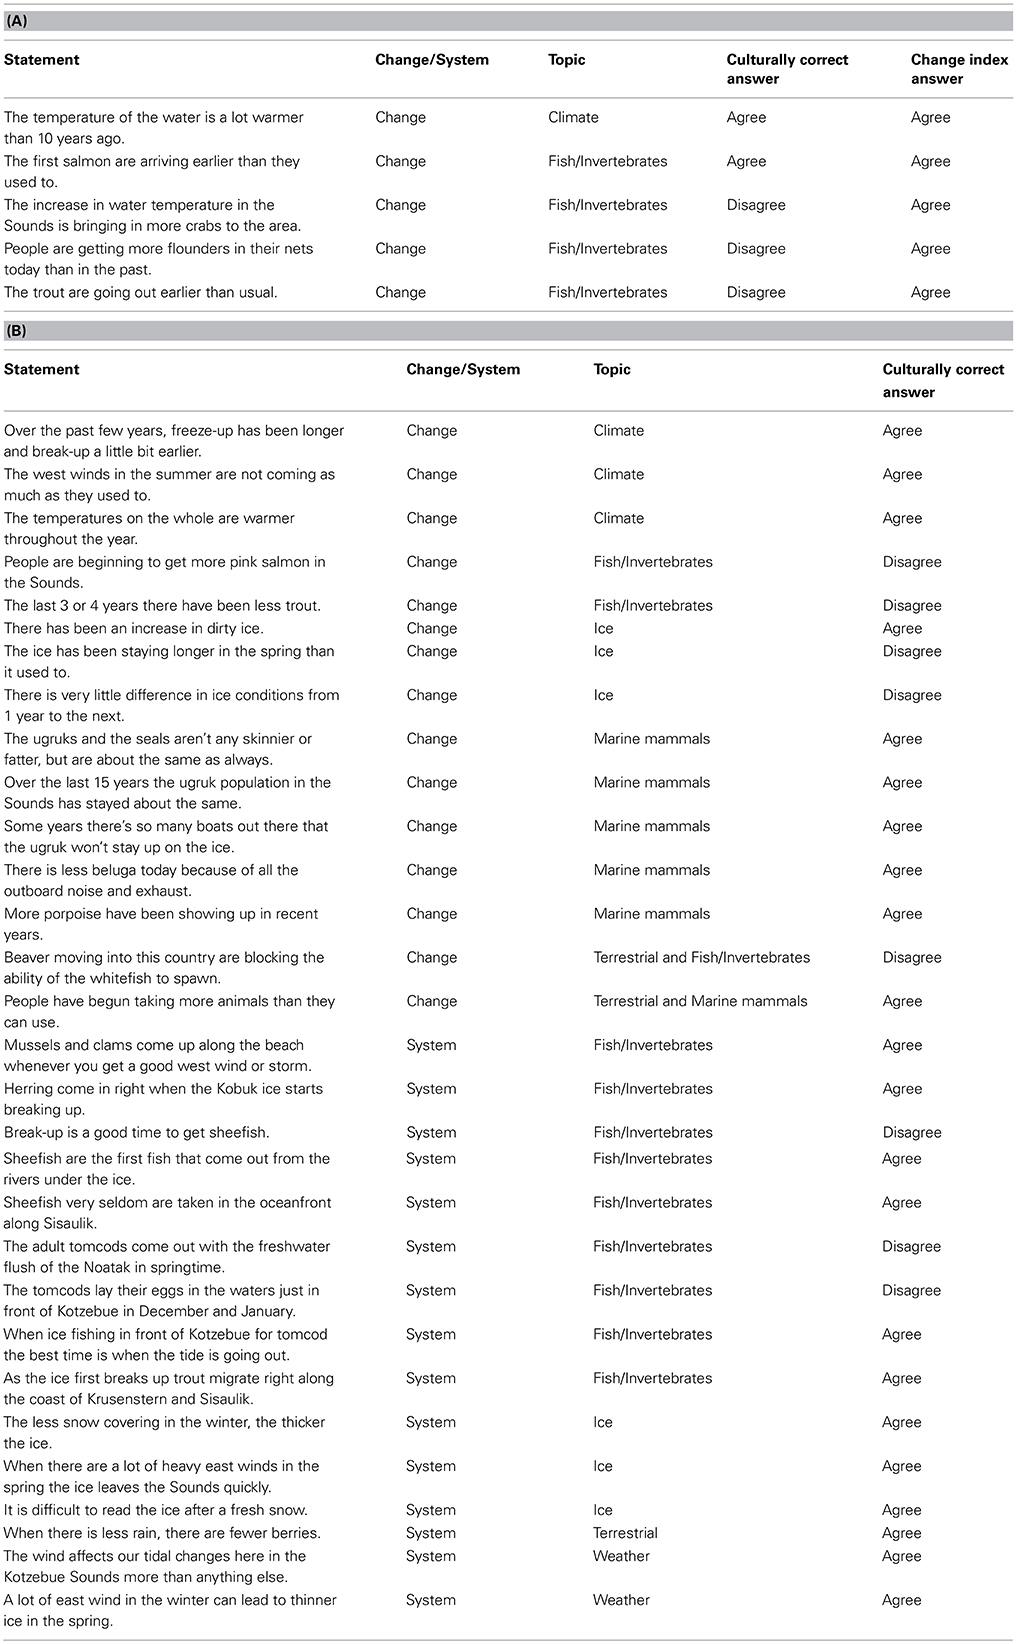
Table 1. (A) The five propositions comprising the Climate Change Knowledge Index (CCKI) as derived from a factor analysis of all 35 propositions, the classification of the statement as either change related or system related, the statement topic, the culturally correct answer (as determined by the cultural consensus model using Bayesian modeling), and the answer for the index. (B) The remaining thirty agree/disagree propositions, the classification of the statement as either change related or system related, the statement topic, and the culturally correct answer (as determined by the cultural consensus model using Bayesian modeling).
Lists of agree-disagree propositions are central to eliciting what is called “cultural consensus,” or consensus among informants regarding specific domains of knowledge. It is formally called the Cultural Consensus Model (CCM), and is a way to understand culture as a matter of belief and knowledge agreement (Romney et al., 1986). The CCM allows for an assessment of the extent to which individuals within a culture have a shared understanding of a set of beliefs and allows for an assessment of intracultural variation within a shared understanding. Here we used the formal model to assess cultural consensus (Romney et al., 1986). For respondents' dichotomous responses (agree/disagree) to fit the model, the rule of thumb is the ratio of the first to second eigenvalue in a minimum residual factor analysis of the respondent's responses should be greater than 3, there should be no negative factor scores on the first factor, and the mean of the factor scores should be >0.5. Table 1 provides the propositions for the marine ecosystem domain (a subset of the 102 propositions) and the culturally correct answers derived from a Bayesian weighting method described by Romney et al. (1987). Also included for the first five propositions are the responses reflecting the change index described below. Supplemental Table 1 lists the 37 propositions (out of the 102) used in the analysis of the bearded seal (Erignathus barbatus, known as ugruk in the Iñupiaq language) knowledge domain for comparison.
We further refined the marine ecosystem domain propositions, and derived a change index while investigating the relationship between expertise and normative cultural ecosystem beliefs. The 35 change propositions (Table 1) were inter-correlated and subjected to minimum residual factor analysis. The first factor contained five propositions with high factor scores (Table 2 and the first five propositions of Table 1). These five propositions were related to increases in water temperature, earlier salmon returns, increases in flounder catches, trout leaving earlier, and increases in the Sound crab populations. Responses to the 5 change propositions (1, 0) were summed across respondents to produce the Climate Change Knowledge Index (CCKI).
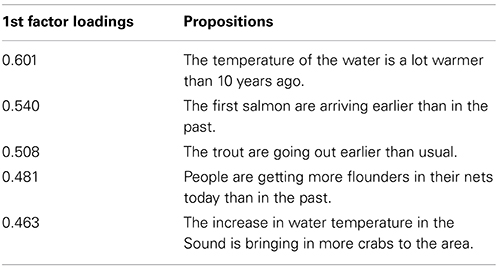
Table 2. Factor loadings from a minimum residual factor analysis for the top five propositions used in the Climate Change Knowledge Index (CCKI).
During Phase II interviews, we also elicited information that allowed us to further define the fishers' and hunters' knowledge networks. The fishers' knowledge network was developed by asking the 79 respondents to name the five individuals they thought were most knowledgeable about fish and fishing in the Kotzebue Sound (Figure 2A). The hunters' knowledge network was derived similarly (Figure 2B). This resulted in two n × m matrices of respondents (rows) reports of whom they perceived as knowledgeable about fishing/hunting (columns). These two-mode networks were transformed into bipartite graphs and symmetrized. This yielded two n × n matrices where the i, jth entry is the presence or absence of a knowledge relation between two respondents. Betweenness centrality (Freeman, 1977) was used to determine knowledge experts in the network. The definition of betweenness centrality is:
where bj is the betweenness centrality of node j and gijk is the number of geodesic paths (shortest paths) connecting i and k through j and gik is the total number of geodesic paths connecting i and k (Borgatti et al., 2013). The measure, as used here, is normalized by dividing bj by the maximum possible betweenness thereby expressing the measure as a percentage. The more an individual respondent connects respondents who are themselves not connected, the higher their betweenness centrality. This generally reflects expertise and brokerage abilities in knowledge and communication networks (Maiolo et al., 1992). The two independent expertise variables using betweenness centrality are “Fish Know Expert” and “Hunt Know Expert.”
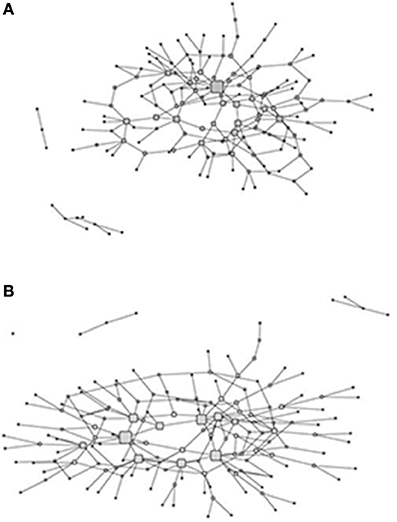
Figure 2. Graphs of the fish (A) and hunt (B) knowledge networks with the size of the nodes (corresponding to hunters and fishers) proportional to normalized betweenness centrality.
We used a general linear model to investigate the relationship between perceived change (CCKI) and expertise while controlling for a number of demographic independent variables including: Age, Education (number of years of formal schooling), Store Bought (percent of food purchased from store), Kotzebue resident (dummy variable, where 1 = Kotzebue residence, 0 otherwise), Wage Labor (dummy variable, where 1 = engaged in wage labor, 0 otherwise), and Percent Marine Food (percent of food that is marine subsistence including mammals) (Table 3). Intercorrelations among the independent variables were conducted in order to limit any potential problems with multicollinearity. Finally, the two expertise variables were simply the normalized betweenness centrality measures in both the hunting and fishing knowledge networks as calculated in UCINET (Borgatti et al., 2002).
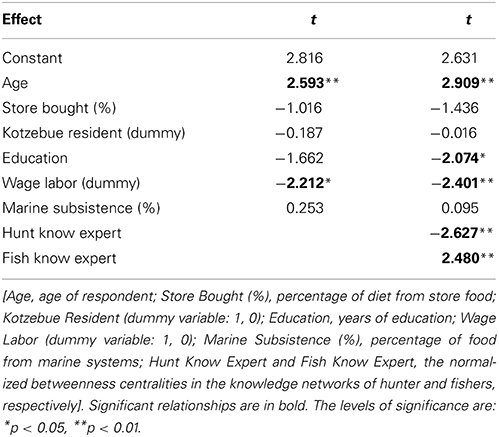
Table 3. Multiple regression for Climate Change Knowledge Index (CCKI) as dependent variable with models using demographic and non-network independent variables (Model 1; R2 = 0.279) and a model including network independent variables (Model 2; R2 = 0.421).
Results
Scientific Ecological Knowledge
As mentioned in the methods, the growth patterns of individual cockles and of individual whelks were homogeneous within a year, meaning that individuals of the same species were responding similarly to environmental conditions and individual SGIs could be reliably averaged. The mean standard growth index (SGI) for each calendar year for both species of mollusks varied considerably over the 22 years of the data set (Figure 3), and patterns for both species exhibit two distinct phases. Before 1996 (for Serripes) and 1995 (for Neptunea) SGIs are consistently below 1.0, representing relatively slow growth, and with little interannual variability. Subsequently, SGIs are near or above 1.0 for both species, with a high degree of interannual variability for Serripes. The growth of both species declines after 2001 (Neptunea) and 2002 (Serripes), with this decline continuing to the end of the chronology in 2005 for Neptunea.
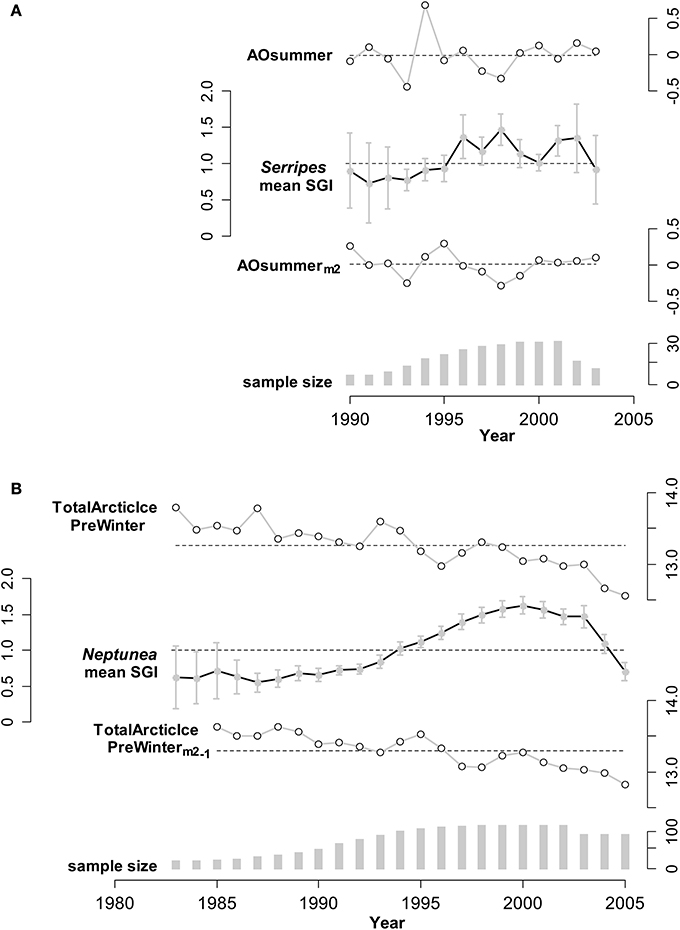
Figure 3. Illustrations of annual means for an environmental predictor unmanipulated, and modified as suggested by the linear mixed modeling results (described in the text), and the SGI (Standard Growth Index; units are relative to expected growth) for: (A) Serripes, using predictor AOSummer (Arctic Oscillation; relative index), and (B) Neptunea, using predictor TotalArcticIcePreWinter (Previous Winter; units are millions of square kilometers). The scales of the variables are shown alongside the corresponding series. For each predictor, the mean across all years is shown as a dashed line; for the SGI the dashed line shows a value of 1 (expected growth = observed growth). Vertical bars are 95% confidence intervals for the SGI means, using the t-distribution appropriate for each annual sample. For (A), the unmanipulated variable (AOsummer) has an effect size of −0.124 on Serripes SGI (estimated from mixed model, variance explained in mean Serripes SGI is R2 = 0.092, p = 0.32), and the 2-year running mean has a stronger effect size of −0.690 (R2 = 0.212, p = 0.002). For (B), the unmanipulated variable has an effect size of 0.052 (R2 = 0.037, p = 0.46) on Neptunea SGI, whereas the 2-year running mean, lagged by 1 year, has an effect size of −0.117 (R2 = 0.116, p = 0.23). In this latter case, variance explained does increase, from 3.7 to 11.6%, but the variable is not significant as a single predictor and becomes important in combination with the other two predictors in the final Neptunea model.
In general, the relationship between the SGI's and potential environmental predictors was improved with the 2-year running means and 1-year lags of the environmental variables, as compared to the original variables. Two environmental examples, and the corresponding lagged predictors, are shown in Figure 3, illustrating the improved relationship, although we caution that the effects of single predictors are not comparable to the multiple predictor models reported next, which additionally include interaction effects. The amount of variability in Serripes growth explained by AO summer increased by more than a factor of 2 from 9 to 21% when the 2-year running mean of AO summer was used compared to the yearly AO summer (Figure 3). Total Arctic Ice the previous winter explains 11.6% of Neptunea growth when the predictor is lagged a year compared to only 3.7% unlagged, though this relationship is not significant as a single predictor of Neptunea growth.
Based on the linear mixed modeling, the best model for Serripes includes two regional parameters and their interaction:
where the subscript m2 represents the 2-year running mean of the variable, and −1 a 1-year lag. In order to make the model coefficients (estimated effect sizes) more meaningful, the predictors have been centered with respect to their means, so that AOsummerm2 is actually [AOsummerm2 − (−0.02065)] and TotalArcticIce−1 is [TotalArcticIce−1 − 11.87]. The constant 1.1314 is then the predicted value of SGI at the mean values of the two predictors.
This model explains 80.3% of the variability in mean growth. The interaction term means that the negative effect of Total Arctic Ice (lagged 1 year) is less as the 2-year running mean of the AO in summer increases. For example, if AOsummerm2 is increased by 0.1 over its mean value, then the effect of TotalArcticIce−1 is increased by 0.1 × 3.4427 = 0.3443, becoming less negative. The modeled relationship between these variables and the effect of the interaction term can be clearly seen when the terms are plotted in three dimensions (see the Video in Supplemental Figure 1).
The best model for Neptunea includes a mixture of regional and local parameters and is more complicated than for Serripes because it contains three terms and an interaction term:
Subscripts are as above for Serripes and m2−1 is a 1-year lag of the 2-year running mean. Once again, the environmental variables have been centered with respect to their means: 9.197°C for AirTempSummerm2, 13.22 million square kms for TotalArcticIcePreWinterm2−1 and 154.9 mm for PrecipSummerm2−1.
This model explains 79.3% of the variability in Neptunea growth and uses the 2-year running mean for all parameters, with ice and precipitation also lagged a year. The interaction between summer air temperature and total Arctic ice the previous winter (2-year running mean lagged 1 year) means that the negative effect on SGI of the previous winter total Arctic ice extent is lessened with increasing summer air temperature.
Traditional Ecological Knowledge
TEK, integrating over longer time scales than the mollusks we examined, can further elucidate the apparent shift in the coastal ecosystem that began in the mid-1990s. Of the 35 separate agree/disagree propositions concerning coastal ecosystems, 20 addressed change/variability, and 16 specifically addressed marine fish or invertebrates (with 7 of the 16 fish/invertebrate propositions related to change) (Table 1). These propositions derived from in-depth interviews with Iñupiaq hunter-fishers allowed for the systematic modeling of cultural ecosystem beliefs and their variation across individuals and groups. In the factor analysis of the inter-correlations among respondents' answers, (i.e., factor analysis of the people rather than the propositions), the ratio of the first to second eigenvalue for coastal ecosystem knowledge was 3.19 and all the factor scores were positive, indicating cultural consensus among the respondents for propositions in this domain (Romney et al., 1987). It is not, however, nearly as strong as the consensus found for bearded seal (ugruk) knowledge (ratio of 7.78, Table 4, with questions presented in Supplemental Table 1). In fact, the coastal ecosystem knowledge is approaching the classification of “proto-cultural” (Caulkins, 2004) (knowledge just entering the cultural system) due to higher levels of intra-cultural variability within the shared understanding. A comparison among the various cultural and TEK knowledge domains assessed indicates that cultural knowledge competency in one domain does not necessarily translate to such competency in others for the Kotzebue community (Table 5). It is important to note that our overall study addressed several topics, and included both hunting and fishing experts.
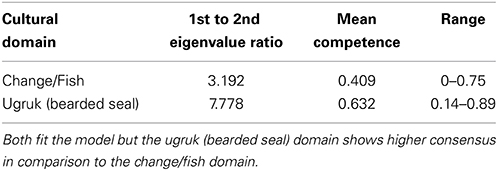
Table 4. Comparison of the cultural consensus tests between two domains.
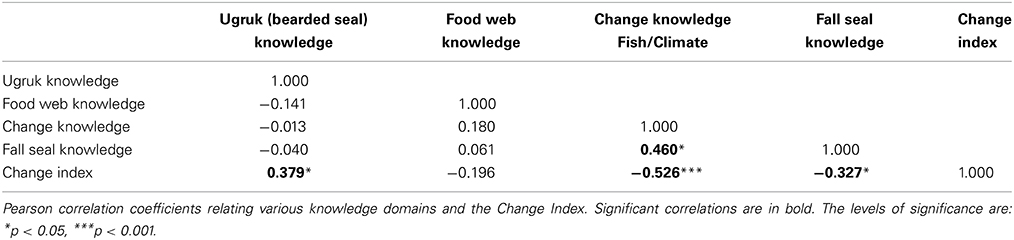
Table 5. Relationships among cultural ecological knowledge domains.
Further breakdown of the 35 coastal ecosystem propositions resulted in the previously mentioned CCKI a subset of 5 statements that dealt explicitly with change. Table 1A compares the culturally correct answers for the 5 statements as determined by the CCM with the responses for the change index. There is general agreement between the two that the water is getting warmer and that the salmon are returning earlier. However, the index reflects more change, particularly with respect to changes in the behavior of some fish and in increasing numbers of some species being observed in the Sound. The CCKI showed that respondents who perceived more change were often at odds with the overall normative ecological beliefs, particularly for the fish/climate domain (Table 5, r = −0.526, p = 0.0001). We subsequently used the knowledge network information to further characterize the hunters/fishers who believe the ecosystem is changing.
The size of the nodes in the networks for both the hunters and the fishers (Figure 2) is proportional to their betweenness centrality and is used as index of expertise in each of the domains as described in the Section Materials and Methods. The two networks are similar in structure, but vary slightly in terms of the distribution of centrality values. Whereas both have a core periphery structure, the fish knowledge network core is more dominated by a single fisher in the core (including a number of fishers with moderate centrality), while the hunt knowledge network has a more uniform distribution of centrality among core members. In both cases, however, the hunters and fishers with higher centrality are in the core of the network linking to other actors in the periphery of the network. The extent to which hunters and fishers are central, in terms of betweenness centrality, in the two networks reflects domain expertise in that they receive knowledge nominations from a broader range of hunters and fishers who are themselves not connected in the network. In addition, hunters and fishers in these central positions in the knowledge network would have access to a wider range of shared ecological knowledge as well as more novel ecological information.
We compared expertise, as determined by normalized betweenness centrality in the knowledge networks, and the change index (CCKI) while controlling for a set of other possible independent variables including age, education, residence, engagement in wage labor, percent of total food purchased at stores, and percent of food from marine subsistence. Interestingly, the two expert subsets of the population (hunters and fishers) had different perspectives on coastal ecosystem change. In a regression of factors that may be driving the increased perceptions of change, both age and fish expertise (Fish Know Expert) were positively related to the change index (CCKI), while involvement in wage labor, education, age, and hunting expertise (Hunt Know Expert) were negatively related (Table 3). This suggests that the fish experts were more likely than others, particularly the hunting experts, to perceive increased coastal change that was outside the range of the normative ecological beliefs as reflected in the consensus analysis of the change statements. Hunters and fishers are aware of the natural variability in the climate over time and as such these normative ecological beliefs already incorporate the normal range of variation that might result from such things as the Arctic Oscillation. For example, in response to the statement on variation in ice conditions from 1 year to the next (Table 1B), the culturally correct answer clearly pointed to recognition of annual variability.
Discussion
Local knowledge of ecosystems has become increasingly valued and used in ecosystem and resource management over the past three decades (Johannes, 1981, 1984; Berkes et al., 2000; Le Fur et al., 2010). When combined with SEK, this often yields a more holistic view of ecosystems than either knowledge base alone (Huntington et al., 2011; Ferguson et al., 2012). Combining TEK and SEK could be especially useful in the Arctic where long-term historical data are lacking (Wassmann et al., 2011), and indigenous peoples have accumulated environmental information for many generations (Huntington et al., 2011). Despite the acknowledgement that TEK can inform SEK and lead to an enhanced environmental understanding in the Arctic (Huntington et al., 2004; Nicholas et al., 2004; Laidler, 2006), few studies have successfully combined the two ways of knowing in Arctic systems (Mahoney et al., 2009; Weatherhead et al., 2010; Carter and Nielson, 2011; Huntington et al., 2011; Riseth et al., 2011). We demonstrate that Iñupiaq fishers are especially attuned to perceiving changes in coastal climate and they can provide the longer time frame needed to interpret the high-resolution changes we see in the growth rate of mollusks. This provides a better understanding of climate change in Kotzebue than if we had relied on either TEK or mollusk growth alone as a climate proxy.
Annual growth patterns of both Neptunea and Serripes reflect variations in large-scale climate drivers in the Kotzebue Sound/Chukchi Sea system and local manifestations of these drivers. The relationship we document between Serripes growth and the Arctic Oscillation (AO), which is closely related to the PDO (Sun and Wang, 2006), is consistent with studies of Serripes growth in the European Arctic where the relationship between Serripes growth and regional climate oscillations is well established (Ambrose et al., 2006; Carroll et al., 2009, 2011a). Even though the relationship was not strong enough to enter the Neptunea growth model, Neptunea growth was also negatively related to the annual AO (1 year lag of the 2-year running mean; effect size = −0.3943, R2 = 0.332, p < 0.001). No study has linked growth of a buccinid to a regional climate index or environmental conditions in the field, but the deposition of annual lines in the operculum and statolith and the longevity of some taxa (Richardson et al., 2005) make members of this genus a good candidate for future climate change studies.
There is not always a direct relationship between a climate index and local conditions (Stenseth et al., 2003), but ultimately the growth of organisms is determined by the manifestation of climate oscillations on the local environment (Ambrose et al., 2006). Serripes growth is best explained by large-scale patterns of ice extent. Interestingly, it is the Arctic-wide ice pattern (total Arctic ice) that is a better predictor of growth than the local ice conditions (freeze up, ice free days) in the mixed-effects model. The local conditions are based on conditions in a 25 × 25 km area, which may not be as robust at predicting larger-scale conditions in Kotzebue Sound as Arctic-wide metrics. Annual phytoplankton production in the Arctic is directly proportional to the length of the open water period (Rysgaard et al., 1999) and this relationship may be driving the effect of ice cover on growth of Serripes, as has been proposed for another suspension feeding cockle (Sjer et al., 2009).
Both regional and local factors enter the mixed model explaining Neptunea growth. As with Serripes, Neptunea growth is also negatively affected by a large-scale measure of ice cover, total Arctic ice the previous winter. Unlike Serripes, however, local parameters are also important predictors of Neptunea growth. Whelks feed primarily on bivalves (including Serripes, Ambrose, personal observation 2002) and polychaetes (Shimek, 1984) and benthic biomass on Arctic shelves is inversely related to ice cover (Ambrose and Renaud, 1995), so ice cover the preceding years might affect the abundance of Neptunea prey and the predator's growth. The mechanisms whereby summer temperature and precipitation affect Neptunea growth are not clear and complicated by an interaction between these two parameters; any explanations without experimentation would be speculative.
Even similar species in the same production regime can have opposite responses to a regime shift (Benson and Trites, 2002), so it is remarkable that species at two trophic levels exhibited relatively simultaneous and significant shifts in annual growth patterns. Only one other study has documented an effect of the AO on two trophic levels simultaneously (Aanes et al., 2002). The AO index shifted from a strong positive to a negative or neutral phase after 1995 (Figure 3; Thompson and Wallace, 1998; Overland and Wang, 2005) concurrent with the PDO switching from a warm to a cool phase (Matua and Hare, 2002) and an increase in the growth of Serripes and Neptunea (Figure 3). A major restructuring of the ecosystem in the northern Bering Sea has been hypothesized to have occurred around 1996 and is attributed to a reduction in the strong positive phase of the AO resulting in stronger southerly winds, less ice, and warmer temperatures over the northern Bering Sea and eastern Siberia (Grebmeier et al., 2006). Our growth data clearly support the documented changes in the regional climate in the mid-1990s.
Growth of the mollusks was best explained by local and regional parameters when parameters were lagged a year relative to growth or when a 2 year running mean of the parameter was used to incorporate the previous year's conditions, or both (Figure 3). Lagged response to climate oscillations are common in marine systems (Overland et al., 2010) and can typically span many trophic levels (Post, 2004) from benthic infauna (Tunberg and Nelson, 1998), including bivalves (Witbaard et al., 2003; Ambrose et al., 2006; Carroll et al., 2011b), to zooplankton (Pershing et al., 2005), fish (Ottersen et al., 2005), and birds (Thompson and Ollason, 2001; Hovinen et al., 2014). This lagged response is well explained by the double integration hypothesis where atmospheric forcing affects large-scale environmental factors (e.g., sea surface temperature, ocean circulation), which in turn affect population dynamics (Bestelmeyer et al., 2011; Di Lorenzo and Ohman, 2013; Doney and Sailley, 2013).
Mollusks are frequently touted as excellent biomonitors for reconstructing environmental conditions (Wanamaker et al., 2011), especially in the Arctic (Mann et al., 2013; Carroll et al., 2014), based on their close relationship between growth and environmental conditions and also because the chemical and mineral content of their shells can be a valuable proxy for environmental conditions. While we only make use of variation in growth in our study, the close correspondence between growth rates and environmental conditions we documented indicates that Serripes and Neptunea growth rates are good proxies for environmental conditions. Without a much longer dataset, though, it is unclear from SEK alone whether the shifts we see in growth are a result of a decadal oscillation, as the relationships between growth and regional climate indices would suggest, or, in contrast, is related to a more sustained climatic change.
To further explore longer term change, we draw on our TEK results that indicate the Kotzebue Sound ecosystem has been undergoing changes on a broader time scale than would be evident from natural oscillations alone. Also in support of this assertion, Moerlein and Carothers (2012) collected TEK via ethnographic methods in the Northwest Alaska communities of Noatak and Selawik, very near Kotzebue, and concluded that the changes in Northwest Alaska over the last 20–30 years are “without precedent and outside of the normal range of variation.” Many of the more observable changes are occurring within the Sound ecosystem as reflected in the clam growth analysis. It is therefore not surprising to find that the older, more experienced fish experts were the first to observe such changes, which includes reported changes in the behavior and increased presence of several marine species. Furthermore, the fact that experts are seeing these changes before other marine mammal hunters and fishers points to the beginnings of the diffusion of new cultural ecological knowledge and understandings. Over time this incipient knowledge should gain broader cultural consensus, eventually representing a new ecological normative understanding, possibly at the same shared level of understanding as exhibited with the bearded seal (ugruk) behavior.
One reasonable hypothesis to make from our results is that it is the experts who would be the most likely to see major ecosystem changes before anyone else. After all, they are the ones who are more experienced and knowledgeable about the ecological and environmental factors, such as air and water temperature, essential for being successful as a hunter or fisher. In addition, they are more committed to the subsistence way of life in that they are older, have less formal Western education, and do not tend to engage in forms of wage labor. They have spent most of their lives on the water and ice fishing. Therefore, it is the fish experts who have intimate knowledge of spawning behaviors and marine species assemblages that are seeing unprecedented increases in some species, particularly benthic species such as crabs. Although we interviewed hunters and fishers at a single point in time, we argue here that the difference in beliefs between fish experts and the traditional cultural beliefs reflects the beginnings of the diffusion of new cultural knowledge.
This is not to say that it is only the fish experts that perceive change in Kotzebue. There was clearly agreement that the ice is breaking up earlier and freezing later, the west summer winds are becoming less frequent, and the air temperatures are getting warmer across the seasons (Table 1B). Further, as is evident from a comparison of responses to the change statements in Table 1A, there is overall cultural agreement among hunters and fishers that the water in the Sound is getting warmer and the salmon are returning earlier. It is the fish experts, however, more than any other group, who recognize the connection between the warming of the water and the increasing numbers of crabs entering the Sound (Table 1A). In addition, they are also observing increases in flounder numbers and changes in trout behavior, changes that have yet to be noticed by others, in particular, the hunting experts. The hunting experts tend to concentrate more on marine mammals, such as bearded seals (ugruk), who interface with hunters on the surface of the water or on the ice. In the consensus analysis there was general agreement that the bearded seal population numbers have been relatively stable over the last 15 years and that the fat content of the seals has stayed relatively the same (Table 1B). What this suggests is that ecosystem changes due to a shift in climate may be more readily observed in the marine ecosystem, particularly the benthos. It also seems to be the case that the shifting climate has had less effect on marine mammal populations and behavior, at least at the time of our study. Recent scientific research has suggested that the pace of a shifting climate may be more pronounced in the ocean than on land at similar latitudes (Burrows et al., 2011). If this is the case, then the fact that the fish experts are noticing ecosystem change before others certainly follows.
Although there is not a direct mollusk-to-mollusk comparison for the two types of data, the fish experts observed changes and increases in the abundance of some benthic species that clearly suggests ongoing changes in the environmental conditions in the Kotzebue Sound, conditions that would also impact the mollusks. The recent decreases in ice cover will increase the growth rates of both Serripes and Neptunea. These changes are likely to have profound impacts on the structure of the marine community, especially the benthos, and on subsistence hunting. There will be a longer open-water fishing season due to less ice, more crabs to fish, and faster growing clams (Serripes) will provide more food for bearded seals (ugruk). On the other hand, the reported changes in ice conditions do not bode well for traditional, ice-based seal hunting and new immigrant marine species may reduce the abundances of clams. While speculative, we feel our predictions, based on a combination of TEK and SEK, are robust, and should be useful for future local (town), regional (borough), and statewide planning, as well as for scientific modeling of ecosystem responses to climate change.
It is challenging to determine whether a deviation in environmental conditions at a given time is due to a shift to a new climate regime or to natural cycling. The 15–20 years of mollusk growth data clearly indicate a change in growth conditions in the middle of the 1990s (Figure 3). The SEK data set alone cannot discern if this change is part of a decadal climate oscillation, a fundamental change in climate affecting the near-shore ecosystem, or a combination of the two. The TEK shared by the Iñupiaq ecomonitors provide insight into ecosystem change not revealed by mollusks. The experts' knowledge of the ecosystem is typically very local, integrative, and is longer in duration than the time frame provided by the mollusks we studied. The perceived changes in climate and subsequently in the coastal ecosystem are outside the range of natural variation and are best understood by the older, more experienced fishers, who are less involved in wage labor, and these change perceptions appear to represent the beginnings of the diffusion of new cultural beliefs related to climate and ecosystem change. The TEK data indicate the perceived change is so different that it is “protocultural,” a recent shift in shared understanding that is making its way through the population.
Together, SEK and TEK provide more insight than either would alone; the mollusks indicate precisely when change occurred and the Iñupiaq tell us the change is not only a decadal oscillation. Recently the United States Arctic Research Commission recommended the incorporation of TEK into long-term monitoring of Arctic climate change (United States Arctic Research Commission, 2013). We have demonstrated that such a combination of scientific and TEK provides a much more holistic view of local climate change in one Arctic location than by relying solely on either approach. Application of this method across the Arctic would provide an assessment of the extent to which local ecosystems are affected by the changing Arctic climate even in the absence of continuous environmental monitoring with scientific instruments.
Conflict of Interest Statement
The authors declare that the research was conducted in the absence of any commercial or financial relationships that could be construed as a potential conflict of interest.
Acknowledgments
This work was funded by a grant from the US National Science Foundation (NSF) Office of Polar Programs (OPP-0222423) to William G. Ambrose Jr., Lisa M. Clough, David C. Griffith and Jeffrey C. Johnson, the Norwegian Research Council to Michael L. Carroll, the BBVA Foundation and Spanish Ministry of Education and Competitiveness grant MTM2012-37195 to Michael Greenacre, and with funds from the Howard Hughes Medical Institute through Bates College. Lisa M. Clough is now an employee of the US NSF, however any opinion, finding, and conclusions or recommendations expressed in this material are those of Lisa M. Clough and her coauthors, and do not necessarily reflect the views of the US NSF. We thank John Goodwin for piloting the boat for sample collection and for allowing us to collect snails from his crab traps and Gerald Goodwin, Stephen Jewett, Janice Lewis, Kate Meltzer, Melinda Reynolds and Terry Reynolds for field help and Greg Henkes, Jessica Edgerly and William Locke for laboratory help. William Locke drafted Figure 1. Comments from R. Bernard, E. Jones, J. Muratori, P. Renaud, and G. Scheldeman and the two Frontiers in Marine Science reviewers significantly improved the manuscript.
Supplementary Material
The Supplementary Material for this article can be found online at: http://www.frontiersin.org/journal/10.3389/fmars.2014.00040/abstract
References
Aanes, R., Saether, B.-E., Smith, F. M., Cooper, E. J., Wookery, P. A., and Øritsland, N. A. (2002). the Arctic Oscillation predicts effects of climate change in two trophic levels in a high-Arctic ecosystem. Ecol. Lett. 5, 445–453. doi: 10.1046/j.1461-0248.2002.00340.x
Ambrose, W. G. Jr., Carroll, M. L., Greenacre, M., Thorrold, S. R., and McMahon, K. (2006). Variation in bivalve growth in a Norwegian high-Arctic fjord: evidence for local- and large-scale climatic forcing. Global Chang. Biol. 12, 1595–1607. doi: 10.1111/j.1365-2486.2006.01181.x
Ambrose, W. G. Jr., and Renaud, P. E. (1995). Benthic response to water column productivity: evidence for benthic pelagic coupling in the Northeast Water Polynya. J. Geophys. Res. 100, 4411–4421. doi: 10.1029/94JC01982
Ambrose, W. G. Jr., Renaud, P. E., Locke, V. W. L., Cottier, F. R., Berge, J. R., Carroll, M. L., et al. (2012). Growth line deposition and variability in growth of two circumpolar bivalves (Serripes groenlandicus and Clinocardium ciliatum). Polar Biol. 35, 345–354. doi: 10.1007/s00300-011-1080-4
Arctic Climate Impact Assessment. (2005). Impacts of a Warming Arctic: Arctic Climate Impact Assessment. Cambridge, UK: Cambridge Univ. Press.
Benson, A. J., and Trites, A. W. (2002). Ecological effects of regime shifts in the Bering Sea and eastern Pacific Ocean. Fish Fisher. 3, 95–113. doi: 10.1046/j.1467-2979.2002.00078.x
Berkes, F., Colding, J., and Folke, C. (2000). Rediscovery of traditional ecological knowledge as adaptive management. Ecol. Appl. 10, 1251–1261. doi: 10.1890/1051-0761(2000)010[1251:ROTEKA]2.0.CO;2
Bestelmeyer, B. T., Ellison, A. M., Fraser, W. R., Gorman, K. B., Holbrook, S. J., Laney, C. M., et al. (2011). Analysis of abrupt transitions in ecological systems. Ecosphere 2, 129. doi: 10.1890/ES11-00216.1
Bland, J. M., and Altman, D. G. (1997). Cronbach's alpha. Br. Med. J. 314, 572. doi: 10.1136/bmj.314.7080.572
Pubmed Abstract | Pubmed Full Text | CrossRef Full Text | Google Scholar
Borgatti, S. P., Everett, M. G., and Freeman, L. C. (2002). Ucinet 6 for Windows: Software for Social Network Analysis. Harvard, MA; Analytic Technologies.
Born, E. W., Rysgaard, S., Ehlme, G., Sejr, M., Acquarone, M., and Levermann, N. (2003). Underwater observations of foraging free-living Atlantic walruses (Odobenus rosmarus rosmarus) and estimates of their food consumption. Polar Biol. 26, 348–357. doi: 10.1007/s00300-003-0486-z
Boster, J. S., and Johnson, J. (1989). Form or function: a comparison of expert and novice judgments of similarity among fish. Am. Anthropol. 91, 866–899. doi: 10.1525/aa.1989.91.4.02a00040
Burrows, M. T., Schoeman, D. S., Buckley, L. B., Moore, P., Poloczanska, E. S., Brander, K. M., et al. (2011). The pace of shifting climate in marine and terrestrial ecosystems. Science 334, 652–655. doi: 10.1126/science.1210288
Pubmed Abstract | Pubmed Full Text | CrossRef Full Text | Google Scholar
Butler, P. G., Wanamaker, A. D. Jr., Scourse, J. D., Richardson, C. A., and Reynolds, D. J. (2013). Variability of marine climate on the North Icelandic Shelf in a 1357-year crossdated Arctica islandica chronology. Palaeoceanogr. Palaeoclimatol. Palaeoecol. 373, 141–151. doi: 10.1016/j.palaeo.2012.01.016
Carroll, M. L., Ambrose, W. G. Jr., Levin, B. S., Locke, W. L., Henkes, G. A., Hop, H., et al. (2011a). Pan-Svalbard growth rate variability and environmental regulation in the Arctic bivalve Serripes groenlandicus. J. Mar. Syst. 88, 239–251. doi: 10.1016/j.jmarsys.2011.04.010
Carroll, M. L., Ambrose, W. G. Jr., Levin, B., Ratner, A., Ryan, S., and Henkes, G. A. (2011b). Climatic regulation of Clinocardium ciliatum (bivalvia) growth in the northwestern Barents Sea. Palaeoceanogr. Palaeoclimatol. Palaeoecol. 302, 10–20. doi: 10.1016/j.palaeo.2010.06.001
Carroll, M. L., Ambrose, W. G. Jr., Locke, W. L., Ryan, S. K., and Johnson, B. J. (2014). Bivalve growth rate and isotopic variability across the Barents Sea Polar Front. J. Mar. Syst. 130, 167–180. doi: 10.1016/j.jmarsys.2013.10.006
Carroll, M. L., Johnson, B., Henkes, G. A., McMahon, K. W., Voronkov, A., Ambrose, W. G. Jr., et al. (2009). Bivalves as indicators of environmental variation and potential anthropogenic impacts in the southern Barents Sea. Mar. Poll. Bull. 59, 193–206. doi: 10.1016/j.marpolbul.2009.02.022
Pubmed Abstract | Pubmed Full Text | CrossRef Full Text | Google Scholar
Carter, B. T. G., and Nielson, E. A. (2011). Exploring ecological changes in Cook Inlet beluga whale habitat though traditional and local ecological knowledge of contributing factors for population decline. Mar. Policy 35, 299–308. doi: 10.1016/j.marpol.2010.10.009
Caulkins, D. (2004). Identifying culture as a threshold of shared knowledge: a consensus analysis method. Int. J. Cross Cult. Manage. 4, 317–333. doi: 10.1177/1470595804047813
Coan, E. V., Valentich, P., and Bernard, F. R. (2000). Bivalve seashells of western North America. Santa Barbara, CA: Santa Barbara Museum of Natural History. Monograph 2, Studies in Biodiversity 2.
Davis, A., and Wagner, J. R. (2003). Who knows? On the importance of identifying “experts” when researching local ecological knowledge. Hum. Ecol. 31, 463–489. doi: 10.1023/A:1025075923297
Di Lorenzo, E., and Ohman, M. D. (2013). A double-integration hypothesis to explain ocean ecosystem response to climate forcing. Proc. Natl. Acad. Sci. U.S.A. 110, 2496–2499. doi: 10.1073/pnas.1218022110
Pubmed Abstract | Pubmed Full Text | CrossRef Full Text | Google Scholar
Doney, S. C., and Sailley, S. F. (2013). When an ecological regime shift is really just stochastic noise. Proc. NatL. Acad. Sci. U.S.A. 110, 2438–2439. doi: 10.1073/pnas.1222736110
Pubmed Abstract | Pubmed Full Text | CrossRef Full Text | Google Scholar
Ducklow, H. W., Doney, S. C., and Steinberg, D. K. (2009). Contributions of long-term research and time-series observations to marine ecology and biogeochemistry. Ann. Rev. Mar. Sci. 1, 279–302. doi: 10.1146/annurev.marine.010908.163801
Pubmed Abstract | Pubmed Full Text | CrossRef Full Text | Google Scholar
Dunton, K. H., Goodall, J. L., Schonberg, S. V., Grebmeier, J. M., and Maidment, D. R. (2005). Multi-decadal synthesis of benthic pelagic coupling in the western Arctic: role of cross-shelf advective processes. Deep-Sea Res. II 52, 3462–3477. doi: 10.1016/j.dsr2.2005.09.007
Feder, H. M., Jewett, S. C., and Blanchard, A. (2005). Southeastern Chukchi Sea (Alaska) epibenthos. Polar Biol. 28, 402–421. doi: 10.1007/s00300-004-0683-4
Feder, H. M., Naidu, A. S., Baskaran, M., Frost, K., Hameedi, M. J., Jewett, S. C., et al. (1991). Bering Strait-Hope Basin: Habitat Utilization and Ecological Characterization. Institute of Marine Science technical report 92-2. Fairbanks: University of Alaska.
Ferguson, S. H., Higdon, J. W., and Westdal, K. H. (2012). Prey items and predation behavior of killer whales (Orcinus orca) in Nunavut, Canada based on Inuit hunter interviews. Aquatic Biosyst. 8:3. doi: 10.1186/2046-9063-8-3
Pubmed Abstract | Pubmed Full Text | CrossRef Full Text | Google Scholar
Finley, K. J., and Evans, C. R. (1983). Summer diet of the bearded seal (Erignathus barbatus) in the Canadian high Arctic. Arctic 36, 82–89. doi: 10.14430/arctic2246
Fisher, K. I., and Stewart, R. E. A. (1997). Summer foods of atlantic walrus, odobenus rosmarus rosmarus, in northern Foxe Basin, North West Territories. Can. J. Zool. 75, 1166–1175. doi: 10.1139/z97-139
Freeman, L. C. (1977). A set of measures of centrality based on betweenness. Sociometry 40, 35–41. doi: 10.2307/3033543
García Quijano, C. (2007). Fishers' knowledge of marine species assemblages: bridging scientific and local ecological knowledge in southeastern Puerto Rico. Am. Anthropol. 109, 529–536. doi: 10.1525/aa.2007.109.3.529
Grebmeier, J. M., McRoy, C. P., and Feder, H. M. (1988). Pelagic-benthic coupling on the shelf of the northern Bering and Chukchi Seas. I. Food supply source and benthic biomass. Mar. Ecol. Prog. Ser. 48, 57–67. doi: 10.3354/meps048057
Grebmeier, J. M., Overland, J. E., Moore, S. E., Farley, E. V., Carmack, E. C., Cooper, L. W., et al. (2006). A major ecosystem shift in the Northern Bering Sea. Science 311, 1461–1464. doi: 10.1126/science.1121365
Pubmed Abstract | Pubmed Full Text | CrossRef Full Text | Google Scholar
Griffith, D. C. (2006). “Local knowledge, multiple livelihoods, and the use of natural and social resources in coastal North Carolina,” in Traditional Ecological Knowledge and Natural Resource Management, ed C. Menzies (Lincoln, NE: University of Nebraska Press), 153–174.
Gröcke, D. R., and Gillikin, D. P. (2008). Advances in mollusk sclerochronology and sclerochemistry: tools for understanding climate and environment. Geo-Marine Lett. 28, 265–268. doi: 10.1007/s00367-008-0108-4
Hovinen, J. E. H., Welcker, J., Descamps, S., Strøm, H., Jerstad, K., Berge, J., et al. (2014). Climate warming decreases the survival of the little auk (Alle alle), a high Arctic avian predator. Ecol. Evol. 4, 3127–3138. doi: 10.1002/ece3.1160
Pubmed Abstract | Pubmed Full Text | CrossRef Full Text | Google Scholar
Huntington, H. P. (2000). Using traditional ecological knowledge in science: methods and applications. Ecol. Appl. 10, 1270–1274. doi: 10.1890/1051-0761(2000)010[1270:UTEKIS]2.0.CO;2
Huntington, H. P., Callaghan, T. V., Fox Gearheard, S., and Krupnik, I. (2004). Matching traditional and scientific observations to detect environmental change: a discussion on Arctic Terrestrial Ecosystems. Ambio 33, 18–23.
Huntington, H. P., Gearhead, S., Mahoney, A. R., and Salomon, A. E. (2011). Integrating traditional and scientific knowledge through collaborative natural science field research: identifying elements for success. Arctic 64, 437–445. doi: 10.14430/arctic4143
Huntington, H. P., Goodstein, E., and Duskirechen, E. (2012). Towards a tipping point in responding to climate change. Ambio 41, 66–74. doi: 10.1007/s13280-011-0226-5
Johannes, R. E. (1981). Working with fishermen to improve coastaltropical fisheries and resource management. Bull. Mar. Sci. 31, 673–680.
Johannes, R. E. (1984). Marine conservation in relation to traditional lifestyles of tropical artisanal fishermen. Environmentalist 4, 30–35. doi: 10.1007/BF01907290
Johnson, J. C., and Weller, S. (2002). “Elicitation techniques for interviewing” in: Handbook of Interview Research, eds J. F. Gubrium and J. A. Holstein (Newbury Park: Sage), 491–514.
Johnson, M. A., Proshutinsky, A. Y., and Polyakov, I. V. (1999). Atmospheric patterns forcing two regimes of Arctic circulation: a return to anticyclonic conditions? Geophys. Res. Lett. 26, 1621–1624. doi: 10.1029/1999GL900288
Jones, D. S., Arthus, M. A., and Allard, D. J. (1989). Sclerochronological records of temperature and growth from shells of Mercenaria mercenaria from Narragansett Bay, Rhode Island. Mar. Biol. 102, 225–234. doi: 10.1007/BF00428284
Kafanov, A. (1980). Systematics of the subfamily Clinocardiinae Kafanov, 1975 (Bivalvia, Cardiidae). Malacologia 19, 297–328.
Khim, B.-K., Kranz, D. E., Cooper, L. W., and Grebmeier, J. M. (2003). Seasonal discharge to the western Chukchi Sea shelf identified in stable isotope profiles of mollusk shells. J. Geophys. Res. 108, 3300–3309. doi: 10.1029/2003JC001816
Kinder, T. H., Schumacher, J. D., Tripp, T. B., and Pashinski, D. (1977). The Physical Oceanography of Kotzebue Sound, Alaska, During Late Summer, 1976. Technical report M77-99. Seattle, WA: University of Washington.
Kortsch, S., Primicerio, R., Beuchel, F., Renaud, P. E., Rodrigues, J., Lønne, O. J., et al. (2012). Climate-driven shifts in Arctic marine benthos. Proc. Natl. Acad. Sci. U.S.A. 109, 14052–14057. doi: 10.1073/pnas.1207509109
Pubmed Abstract | Pubmed Full Text | CrossRef Full Text | Google Scholar
Koszteyn, J., Kwasniewski, S., Róż‘ycki, O., and Węslawski, J. M. (1990). Atlas of the Marine Fauna of Southern Spitzbergen. Poland: Institute of Oceanology.
Laidler, G. J. (2006). Inuit and scientific perspectives on the relationship between sea ice and climate change: the ideal complement? Clim. Chang. 78, 407–444. doi: 10.1007/s10584-006-9064-z
Le Fur, J., Guilavogui, A., and Teitelbaum, A. (2010). Contribution of local fishermen to improving knowledge of the marine ecosystem and resources in the Republic of Guinea, West Africa. Can. J. Fish. Aquat. Sci. 68, 1454–1469. doi: 10.1139/f2011-061
Lowry, L. F., Frost, K. J., and Burns, A. J. (1980). Feeding of bearded seals in the Bering and Chukchi Seas and tropic interactions with Pacific walruses. Arctic 33, 330–342. doi: 10.14430/arctic2566
Mahoney, A., Gearheard, S., Oshima, T., and Qillaq, T. (2009). Sea ice thickness measurement from a community-based observing network. Am. Bull. Meteoro. Sci. 90, 371–377. doi: 10.1175/2008BAMS2696.1
Maiolo, J., Johnson, J. C., and Griffith, D. C. (1992). Applications of social science theory to fisheries management: three examples. Soc. Nat. Res. 5, 391–407. doi: 10.1080/08941929209380801
Mann, R., Munroe, D. M., Powell, E. N., Hofmann, E. E., and Klinck, J. M. (2013). “Bivalve mollusks: barometers of climate change in Arctic marine systems,” in Responses of Arctic Marine Ecosystems to Climate Change, eds F. J. Mueter, D. M. S. Dickson, H. P. Huntington, J. R. Irvine, E. A. Logerwell, S. A. MacLean, et al. (Alaska Sea Grant, University of Alaska Fairbanks), 61–82.
Matua, N. J., and Hare, S. R. (2002). The pacific decadal oscillation. J. Ocean. 58, 35–44. doi: 10.1023/A:1015820616384
Menzies, C., and Butler, C. (2006). “Understanding ecological knowledge,” in Traditional Ecological Knowledge and Natural Resource Management, ed C. Menzies (Lincoln, NE: University Nebraska Press), 1–17.
Merkel, F. R., Jamieson, S. E., Falk, K., and Mosbech, A. (2007). The diet of common eiders winter in Nuuk, Southwest Greenland. Polar Biol. 390, 227–234. doi: 10.1007/s00300-006-0176-8
Moerlein, K. J., and Carothers, C. (2012). Total environment of change: impacts of climate change and social transitions on subsistence fisheries in Northwest Alaska. Ecol. Soc. 17, 10–19. doi: 10.5751/ES-04543-170110
Morison, J., Aagaard, K., and Steele, M (2000). Recent environmental changes in the Arctic: a review. Arctic 53, 359–371. doi: 10.14430/arctic867
Nicholas, T., Berkes, F., Jolly, D., Snow, N. B., and The Community of Sachs Harbour. (2004). Climate change and sea ice: local observations from the Canadian Western Arctic. Arctic 57, 68–79. doi: 10.14430/arctic484
Ottersen, G., Alheit, A., Drinkwater, K., Friedland, K., Hagen, E, and Stenseth, N. C. (2005). “The response of fish populations to ocean climate fluctuations” in: Marine Ecosystems and Climate Variation The North Atlantic A Comparative Perspective, eds N. C. Stenseth, G. Ottersen, J. W. Hurrell, and A. Belgrano (Oxford: Oxford University Press), 73–94.
Overland, J., Rodionov, S., Minobe, S., and Bond, N. (2008). North Pacific regime shifts: definitions, issues and recent transitions. Prog. Ocean. 77, 92–102. doi: 10.1016/j.pocean.2008.03.016
Overland, J., and Wang, M. (2005). The Arctic climate paradox: the recent decrease of the Arctic Oscillation. Geophys. Res. Lett. 32, 1–5. doi: 10.1029/2004GL021752
Overland, J. E., Alheit, J., Bakun, A., Hurrell, J. W., Mackas, D. L., and Miller, A. J. (2010). Climate controls on marine ecosystems and fish populations. J. Mar. Syst. 79, 305–315. doi: 10.1016/j.jmarsys.2008.12.009
Pershing, A. J., Greene, C. H., Planque, B., and Fromentin, J.-M. (2005). “The influence of climate variability on North Atlantic zooplankton populations” in Marine Ecosystems and Climate Variation: The North Atlantic A Comparative Perspective, eds N. C. Stenseth, G. Ottersen, J. W. Hurrell, and A. Belgrano (Oxford: Oxford University Press), 59–94. doi: 10.1093/acprof:oso/9780198507499.003.0005
Pinheiro, J. C., and Bates, D. M. (2000). Mixed-Effects Models in S and S-PLUS. New York, NY: Springer. doi: 10.1007/978-1-4419-0318-1
Post, E. (2004). “Time lags in terrestrial and marine environments,” in Marine Ecosystems and Climate Variation The North Atlantic A Comparative Perspective, eds N. C. Stenseth and G. Ottersen (Oxford: Oxford University Press), 165–167.
Richardson, C. A. (2001). Molluscs as archives of environmental change. Ocean. Mar. Biol. Ann. Rev. 39, 103–164.
Richardson, C. A., Saurel, C., Barroso, C. M., and Thain, J. (2005). Evaluation of the age of the red welk Neptunea antique using statoliths, opercula and element ratios in the shell. J. Exper. Mar. Biol. Ecol. 325, 55–64. doi: 10.1016/j.jembe.2005.04.024
Riseth, J. Å., Tømmervik, H., Helander-Renvall, E., Labba, N., Johansson, C., Malnes, E., et al. (2011). Sámi traditional ecological knowledge as a guide to science: snow, ice and reindeer pasture facing climate change. Polar Rec. 47, 202–217. doi: 10.1017/S0032247410000434
Romney, A. K., Batchelder, W., and Weller, S. (1987). Recent applications of cultural consensus theory. Am. Behav. Sci. 31, 163–177. doi: 10.1177/000276487031002003
Romney, A. K., Weller, S., and Batchelder, W. (1986). Culture as consensus: a theory of culture and informant accuracy. Am. Anthropol. 88, 13–338. doi: 10.1525/aa.1986.88.2.02a00020
Rysgaard, S., Nielsen, T., and Hansen, B. W. (1999). Seasonal variation innutrients, pelagic primary production and grazing in a high-Arctic marine ecosystem, Young Sound, Northeast Greenland. Mar. Ecol. Prog. Ser. 179, 13–25. doi: 10.3354/meps179013
Shackeroff, J. M., Campbell, L. M., and Crowder, L. B. (2011). Social-ecological guilds: putting people into marine historical ecology. Ecol. Soc. 16, 1–20.
Sjer, M., Blicher, M. E., and Rysgaard, S. (2009). Sea ice affects inter-annual and geographic variation in the growth of the Arctic cockle Clinocardium cilitium (Bivalvia) in Greenland. Mar. Ecol. Prog. Ser. 389, 149–158. doi: 10.3354/meps08200
Stenseth, N. C., Ottersen, G., Hurrell, J. W., Mysterud, A., Lima, M., Chan, K-S., et al. (2003). Studying climate effects on ecology through the use of climate indices: the North Atlantic Oscillation, El Niño Southern Oscillation, and beyond. Proc. R. Soc. Lond. B 270, 2087–2096. doi: 10.1098/rspb.2003.2415
Pubmed Abstract | Pubmed Full Text | CrossRef Full Text | Google Scholar
Sun, J., and Wang, H. (2006). Relationship between Arctic oscillation and pacific decadal oscillation on decadal timescale. Chinese Sci. Bull. 51, 75–79. doi: 10.1007/s11434-004-0221-3
Thompson, D. W. J., and Wallace, J. M. (1998). The Arctic Oscillation signature in the wintertime geopotential height and temperature fields. Geophys. Res. Lett. 25, 1297–1300. doi: 10.1029/98GL00950
Thompson, P. M., and Ollason, J. (2001). Lagged effects of ocean climate change on fulmar population dynamics. Nature 413, 417–420. doi: 10.1038/35096558
Pubmed Abstract | Pubmed Full Text | CrossRef Full Text | Google Scholar
Tunberg, B. G., and Nelson, W. G. (1998). Do climate oscillations influence cyclic patterns of soft bottom macrobenthic communities on the Swedish west coast? Mar. Ecol. Prog. Ser. 170, 85–94. doi: 10.3354/meps170085
United States Arctic Research Commission. (2013). Report on the Goals and Objective for Arctic Research 2013-2014 for the U. S. Arctic Research Program Plan. Washington, DC: U. S. Arctic Research Commission.
Wagner, F. J. E. (1977). Recent mollusk distribution patterns and palaeobathymetry, southeastern Beaufort Sea. Can. J. Earth Sci. 14, 2013–2028. doi: 10.1139/e77-173
Wanamaker, A. D. Jr., Hetzinger, S., and Halfar, J. (2011). Reconstructing mid- to high-latitude marine climate and ocean variability using bivalves, coralline algae, and marine sediment cores from the Northern Hemisphere. Paleogeogr. Paleoclimatol. Paleoecol. 302, 1–9. doi: 10.1016/j.palaeo.2010.12.024
Wassmann, P., Duarte, C. M., Agustí, S., and Sejr, M. K. (2011). Footprints of climate change in the Arctic marine ecosystem. Global Chang. Biol. 17, 1235–1249. doi: 10.1111/j.1365-2486.2010.02311.x
Weatherhead, E., Gearheard, S., and Barry, R. G. (2010). Changes in weather persistence: insight from Inuit knowledge. Global Environ. Chang. 20, 523–528. doi: 10.1016/j.gloenvcha.2010.02.002
Keywords: environmental change, scientific ecological knowledge, traditional ecological knowledge, sclerochronology, knowledge networks, Arctic
Citation: Ambrose WG Jr., Clough LM, Johnson JC, Greenacre M, Griffith DC, Carroll ML and Whiting A (2014) Interpreting environmental change in coastal Alaska using traditional and scientific ecological knowledge. Front. Mar. Sci. 1:40. doi: 10.3389/fmars.2014.00040
Received: 18 June 2014; Accepted: 01 September 2014;
Published online: 29 September 2014.
Edited by:
Dorte Krause-Jensen, Aarhus University, DenmarkReviewed by:
Brezo Martínez, Universidad Rey Juan Carlos, SpainMikael K. Sejr, Aarhus University, Denmark
Copyright © 2014 Ambrose, Clough, Johnson, Greenacre, Griffith, Carroll and Whiting. This is an open-access article distributed under the terms of the Creative Commons Attribution License (CC BY). The use, distribution or reproduction in other forums is permitted, provided the original author(s) or licensor are credited and that the original publication in this journal is cited, in accordance with accepted academic practice. No use, distribution or reproduction is permitted which does not comply with these terms.
*Correspondence: William G. Ambrose Jr., Department of Biology, Bates College, 44 Campus Ave., Lewiston, Maine 04240, USA e-mail: wambrose@bates.edu