New insights on early evolution of spiny-rayed fishes (Teleostei: Acanthomorpha)
 Wei-Jen Chen1*
  Francesco Santini2
  Giorgio Carnevale2
  Jhen-Nien Chen1
  Shu-Hui Liu1
  Sébastien Lavoué1 Richard L. Mayden3
- 1Institute of Oceanography, National Taiwan University, Taipei, Taiwan
- 2Dipartimento di Scienze della Terra, Università degli Studi di Torino, Torino, Italy
- 3Department of Biology, Saint-Louis University, St. Louis, Missouri, USA
The Acanthomorpha is the largest group of teleost fishes with about one third of extant vertebrate species. In the course of its evolution this lineage experienced several episodes of radiation, leading to a large number of descendant lineages differing profoundly in morphology, ecology, distribution and behavior. Although Acanthomorpha was recognized decades ago, we are only now beginning to decipher its large-scale, time-calibrated phylogeny, a prerequisite to test various evolutionary hypotheses explaining the tremendous diversity of this group. In this study, we provide new insights into the early evolution of the acanthomorphs and the euteleost allies based on the phylogenetic analysis of a newly developed dataset combining nine nuclear and mitochondrial gene markers. Our inferred tree is time-calibrated using 15 fossils, some of which have not been used before. While our phylogeny strongly supports a monophyletic Neoteleostei, Ctenosquamata (i.e., Acanthomorpha plus Myctophiformes), and Acanthopterygii, we find weak support (bootstrap value < 48%) for the traditionally defined Acanthomorpha, as well as evidence of non-monophyly for the traditional Paracanthopterygii, Beryciformes, and Percomorpha. We corroborate the new Paracanthopterygii sensu Miya et al. (2005) including Polymixiiformes, Zeiformes, Gadiformes, Percopsiformes, and likely the enigmatic Stylephorus chordatus. Our timetree largely agrees with other recent studies based on nuclear loci in inferring an Early Cretaceous origin for the acanthomorphs followed by a Late Cretaceous/Early Paleogene radiation of major lineages. This is in contrast to mitogenomic studies mostly inferring Jurassic or even Triassic ages for the origin of the acanthomorphs. We compare our results to those of previous studies, and attempt to address some of the issues that may have led to incongruence between the fossil record and the molecular clock studies, as well as between the different molecular timetrees.
Introduction
The Acanthomorpha, or spiny-rayed fishes, represent the largest group of teleost fishes, with estimates of diversity reaching close to 19,000 species (Nelson, 2006; Froese and Pauly, 2014). They represent about one third of extant vertebrate species, and occur in all aquatic habitats. Acanthomorphs dominate most marine ecosystems, ranging from the hyper-diverse tropical scleractinian coral reefs, to depauperate large pelagic ecosystems, to the extreme Antarctic polar seas (Clarke and Johnston, 1996; Nelson, 2006; Helfman et al., 2009). Acanthomorphs include also some of the most spectacular examples of explosive freshwater radiations, such as the African rift lakes cichlid flocks (Seehausen, 2006), the North American temperate water darters (Near et al., 2011), or the Lake Baikal sculpins (Sherbakov, 1999). Because of this tremendous diversity the Acanthomorpha includes several traditional fish model organisms for vertebrates, such as Medaka and pufferfishes (Chen et al., 2004), as well as groups that have been at the center of abundant research in evolutionary developmental biology, speciation and behavior (cichlids and sticklebacks) (e.g., Kocher, 2004; Shapiro et al., 2004; Seehausen et al., 2008; Huntingford and Ruiz-Gomez, 2009; Chen and Mayden, 2010; Jones et al., 2012; Muschick et al., 2012; Irschick et al., 2013).
Advancement of our understanding of the relationships and classification of the diverse Acanthomorpha has involved three important, post-Hennigian, morphological studies. Initially, this large taxonomic assemblage was first recognized by Rosen (1973), primarily on the basis of the presence, in many of its representatives, of true fin spines in the dorsal, anal, and pelvic fins (giving origin to the name spiny-rayed fishes). Additional morphological evidence for the monophyly of the acanthomorphs was later provided by Stiassny (1986) and Johnson and Patterson (1993). As recognized by Johnson and Patterson (1993), the Acanthomorpha includes the following main lineages: Lampriformes (= Lampridiformes) (including open-ocean and deep-sea taxa as oarfish, opahs, and ribbonfishes), Polymixiiformes (deep-sea beardfishes), Paracanthopterygii (cods, freshwater trout-perches, cusk-eels, anglerfishes, and toadfishes) and Acanthopterygii (the advanced acanthomorphs). The Atherinomorpha (silversides, medaka, etc., mostly inhabiting freshwater) and the most species-rich group, the Percomorpha (perch-like fishes), represent the two most diverse groups within the Acanthopterygii (Johnson and Patterson, 1993). Johnson and Patterson (1993) based their hypothesis on what was then the most comprehensive morphological study to examine higher-level relationships within the Acanthomorpha. This study included 39 characters scored for 16 representative taxa. They inferred that Lampriformes and Polymixiiformes are the basal most lineages relative to the other major acanthomorph groups.
The monophyly of the Acanthomorpha has been corroborated by higher-level molecular studies examining the relationships of teleost fishes (Dettaï and Lecointre, 2005; Betancur-R et al., 2013a; Near et al., 2013). In contrast, mitogenomic data consistently find acanthomorphs to be paraphyletic, as the non-acanthomorph Myctophiformes (lanternfishes) group with the lampriforms (e.g., Miya et al., 2003, 2005, 2007; Poulsen et al., 2013). Analyses of combined nuclear and mitochondrial loci for acanthomorphs by Chen et al. (2003) and Meynard et al. (2012) further corroborated the paraphyly of the acanthomorphs. More recently, analyses by Li et al. (2008) of a larger dataset of nuclear loci and reduced taxonomic sampling, as well as by the gene-tree and species tree analysis of 497 nuclear ultraconserved elements (Faircloth et al., 2013), revealed the group as paraphyletic.
Over the last decade, molecular studies have also started to test parts of the traditional acanthomorph tree, providing new insights into their evolution (Wiley et al., 2000; Chen et al., 2003, 2007, 2014b; Miya et al., 2003, 2005, 2013; Dettaï and Lecointre, 2005, 2008; Li et al., 2008, 2009; Chen and Mayden, 2010; Matschiner et al., 2011; Dornburg et al., 2012; Meynard et al., 2012; Wainwright et al., 2012; Near et al., 2012a, 2013; Betancur-R et al., 2013a,b; Santini et al., 2013b). Even though our understanding of the evolutionary relationships of the Acanthomorpha is still very much a work in progress, the results/hypotheses derived from molecular studies during the past decade have dramatically changed our understanding of the relationships of spiny-rayed fishes. Some of these inferences have suggested support for clades corresponding to groups that were supported in morphological studies at a time prior to the development of phylogenetic systematics. For instance, several studies, starting with Chen et al. (2003), have revealed a clade grouping Cuvier's labyrinth fishes and studies by both Near et al. (2012a) and Chen et al. (2014b) supported the placement of the pygmy sunfishes (North American endemic family Elassomatidae) within “perciform” fishes and close relatives to North American freshwater sunfishes (Centrarchidae). Other molecular results, dating back to the early 2000s, have revealed novel relationships with support for previously unrecognized groups, such as those suggesting a close relationship between Gadiformes (cods) and Zeioidei (John dories) (e.g., Wiley et al., 2000; Chen et al., 2003; Miya et al., 2003), and between Lophiiformes and Tetraodontiformes (e.g., Holcroft, 2004; Yamanoue et al., 2007). Other studies have provided support for novel phylogenetic relationships inconsistent with some “well-supported” groups based on morphology, such as the Pleuronectiformes (flatfishes) (e.g., Betancur-R et al., 2013a; Near et al., 2013; Campbell et al., 2013, 2014; but see Betancur-R et al., 2013b, for different results).
Although the species diversity of basal lineages of spiny-rayed fishes is very low when compared to that of extant percomorphs, their rich fossil record dates to the Early Cretaceous. The oldest acanthomorph fossil otoliths, assigned to the “genus Acanthomorphorum,” date from the early Aptian [Maestrazgo, Castellon Province, Early Cretaceous, 124–122 million years ago (Ma); Nolf, 2004], while the oldest skeletal material belonging to both stem (e.g., Muhichthys cordobai) and crown lineages of acanthomorphs (polymixiids, beryciforms) is known from Late Cretaceous deposits in Mexico (Albian-Cenomanian deposits of the Muhi Quarry, around 99.6 Ma; González-Rodríguez and Fielitz, 2008) and Lebanon (Hajula and Hakel, Cenomanian, Late Cretaceous, 98–94 Ma; Patterson, 1964; Gaudant, 1978; Gayet, 1980; Otero and Gayet, 1996). While the acanthomorph fossil record remains relatively sparse in deposits spanning the subsequent ~45 million years, the record supports the hypothesis of the existence of a vast radiation of percomorph/perciform fishes occurring between the Late Cretaceous and the early Eocene. About 75 families were already present in the famous Eocene Monte Bolca deposits (Ypresian) of coral reef fishes (Carnevale et al., 2014), with an overall diversity and disparity that rivals those seen in corresponding aquatic habitats today (Benton, 1993; Patterson, 1993a). Although it is not yet clear how rapidly this diversity may have originated during the interval spanning the Cenomanian deposits of Mexico and Lebanon (98–94 Ma) and the Ypresian Monte Bolca (50 Ma), paleontological data support a rapid burst of acanthomorph diversification (Friedman, 2010).
In spite of the fact that some new and major clades emerging from the acanthomorph radiation have been repeatedly identified in independent molecular studies, hypotheses as to the relationships of the earliest-evolving acanthomorph lineages remain controversial. Furthermore, the limited number of molecular timetrees published to date for teleosts have inferred dramatically different ages both for the crown acanthomorphs and for major subclades (Table 1). For example, the age proposed for the origin of the acanthomorphs varies from Permian (Azuma et al., 2008) to Cretaceous (Inoue et al., 2005; Santini et al., 2009; Betancur-R et al., 2013a; Near et al., 2013), an interval of over 120 million years.
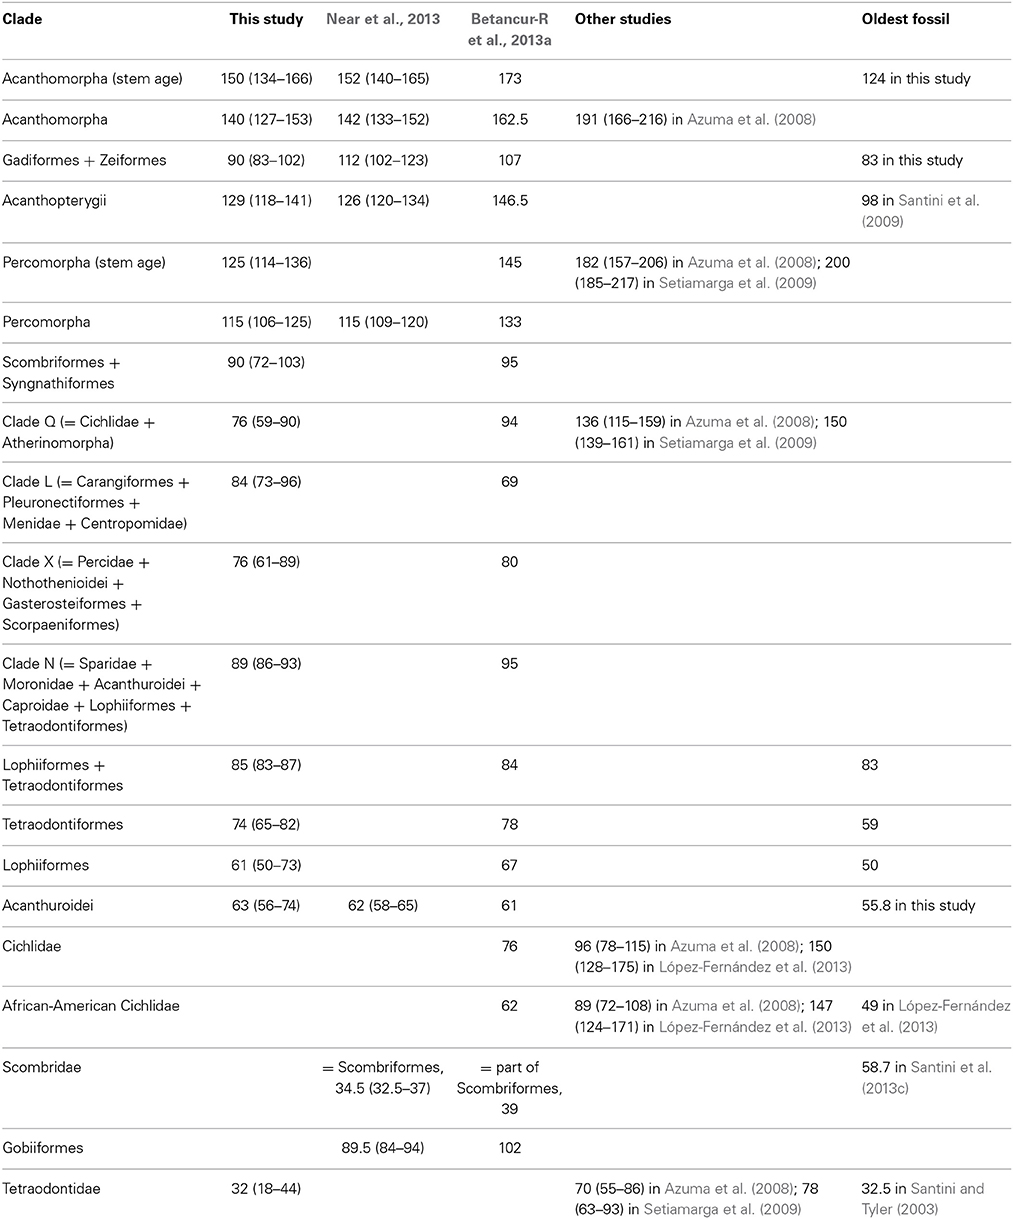
Table 1. Ages (in million years ago) estimated by this study, by recent published molecular timetrees and by the oldest fossil for the Acanthomorpha and for its major subclades.
Resolving the interrelationships of acanthomorphs, as well as their temporal evolution, requires broader taxonomic sampling, reliably referenced fossils, and additional characters (Chen and Mayden, 2010). As a step in this direction, this study investigates the early evolution of the Acanthomorpha through comprehensive phylogenetic analyses based on a multi-locus dataset (six nuclear gene and three mitochondrial loci, 6967 base pairs) for 74 taxa. Our taxonomic sampling includes milkfish (Chanos chanos; a distant outgroup from Otocephala; used to root the inferred trees), representative taxa from all major acanthomorph lineages, representative taxa from all of the most significant groups of Euteleostei, except Lepidogalaxias (dwarf pencilfish). Using 15 robust fossil calibration points and a relaxed Bayesian molecular clock approach an alternative hypothesis is provided for the timescale of both the origin and diversification of spiny-rayed fishes.
Materials and Methods
Sample Collection
Several samples were collected from demersal fish landings of bottom trawl catches from the Da-Shi port, in I-Lan County (Taiwan); specimens were identified using diagnostic morphological characters and several identification references, including Shen et al. (1993) and FAO species identification guides (Carpenter and Niem, 1999). Additional samples were obtained through tissue loans and gifts by collaborators and ichthyologic tissue collection (e.g., the University of Kansas Natural History Museum, three samples) (see Supplementary Table 1 in Supplementary Material in on-line Data Sheet 1 and Acknowledgment Section). This study was conducted within the ethical standards of animal use in research. Tissues samples were only from dead specimens; no live specimens were used.
DNA Data Collection
The DNA sequences used in this study (see Supplementary Table 1) were generated from six independent and phylogenetically informative nuclear genes (RAG1, recombination activation gene 1; RH, Rhodopsin; EGR1, 2B, and 3, early growth response protein genes 1, 2B, and 3; and 28S ribosomal RNA gene) (Chen et al., 2003, 2008; López et al., 2004; Sonnenberg et al., 2007). Three commonly used mitochondrial loci were also used in the analysis (COI, Cytochrome Oxidase subunit I gene; 12 and 16S, two subunit mitochondrial ribosomal RNA genes) (Kocher et al., 1989; Palumbi et al., 1991; Ward et al., 2005). Protocols for obtaining new DNA data follow those outlined in López et al. (2004) for RAG1, 12S, and 16S, Ward et al. (2005) for COI, Chen et al. (2003, 2007, 2008) for RAG1, RH, EGR1, 2B, and 3, and Chen et al. (2003) and Sonnenberg et al. (2007) for 28S (see Supplementary Table 2 for primers used in this study). Several sequences used in analyses that have been published in previous studies, notably in Campbell et al. (2013) and Chen et al. (2013, 2014b), were retrieved from NCBI Genbank (Supplementary Table 1). A total of 288 sequences were newly generated for this study and are available under GenBank accession no. KC441957-KC442244.
Phylogenetic Analyses
The newly obtained DNA sequences were edited using CodonCode Aligner Version 3.7.1.1 (by CodonCode Corp., Dedham, MA, USA), and were then compiled with other available sequences using Se-Al v2.0a11 (Rambaut, 1996). Sequences were initially aligned with the automatic multiple alignment program MUSCLE (Edgar, 2004) using an on-line server at https://www.ebi.ac.uk/Tools/msa/muscle/, and were then adjusted manually based on inferred amino acid translations using Se-Al v2.0a11 (Rambaut, 1996). The initial alignment of the combined dataset involved 8345 bp. Regions with large segments of insertion/deletion showing high dissimilarity in sequence length were present (e.g., tandem repeats in EGR genes; loop regions in ribosomal RNA genes) were discarded in order to avoid invalid assertions of homology and were not used in any phylogenetic analyses. Some additional positions located at the 5′- and 3′- extremities of certain gene fragments showing a large amount of missing data were trimmed. The final alignment used for the phylogenetic analyses included 6967 bp (Supplementary Table 3). Descriptive statistics of sequence comparisons and a χ2test of homogeneity for base frequencies across individuals (conducted for each gene and codon position separately) were performed using PAUP* version 4.0 (Swofford, 2002); these results are provided in Supplementary Table 3.
Phylogenetic analyses were conducted with combined and nuclear gene only datasets using a partitioned Maximum Likelihood (ML) approach, as implemented in RAxML (Stamatakis, 2006). A mixed model (with GTR+G nucleotide substitution model) (Yang, 1994) was used for the combined analyses, permitting independent estimates of individual models of nucleotide substitution for each gene partition. Several partition schemes were examined to determine if our inferences were sensitive to the systematic errors that are known to result from model over-parameterization associated with excessive partitioning (Li et al., 2008). As investigating the monophyly and phylogenetic relationships of acanthomorph fishes and use of a broad array of outgroups of Euteolostei is likely to represent a difficult and complex phylogenetic problem, due to the existence of several rapid bursts of diversification that have likely given rise to the extant diversity of this group, investigating the influence of different partitioning and weighting schemes on phylogenetic analyses is a key step in determining how much confidence can be placed in the results of different approaches to data analysis. The following schemes were used: unpartitioned data matrix; two partitions segregating protein coding and ribosomal RNAs; partitioning by gene; partitioning by gene but treating all three mitochondrial gene as a single partition; partitioning by gene and by codon position for each protein-coding gene; and finally, best-fit partitioning schemes identified with Partition Finder (Lanfear et al., 2012).
Because tests of the stationarity of base composition revealed a bias in base composition at the third codon position in each gene sequence (Supplementary Table 3), we felt it important to compile a down-weighted (or RY coding) matrix in addition to a normal (or no coding) matrix for analyses as suggested by Chen and Mayden (2009) to avoid such noise in phylogenetic reconstruction. Accordingly, nucleotides at the third codon position in protein-coding genes were coded as purines (R) or pyrimidines (Y).
Each heuristic search was conducted with 500 separate runs using the default algorithm of the program and with a maximum parsimonious tree as the starting tree for each run. The ML tree was selected among suboptimal trees in each run by comparing likelihood scores under the GTR+G model. The analyses were performed through the RAxML-HPC (Stamatakis, 2006) on an Apple computer with the graphical interface raxmlGUI 0.93 (Silvestro and Michalak, 2011). To evaluate the robustness of the internal branches of the ML tree, 1000 bootstrap replications (BS) (Felsenstein, 1985) were calculated for each data set under the GTR+G model. Differences in tree topologies among analyses were assessed visually.
Divergence Time Estimation
The concatenated alignment was analyzed under a number of partitions schemes: (1) nine separate partitions, one for each of the individual loci, with each locus being assigned the GTR+G model, selected by jModeltest (Posada, 2008) as the best model with the only exception in COI, for which modeltest selected HKY+G (Hasegawa et al., 1985); (2) seven separate partitions were used for the six nuclear loci, each treated as individual partitions and assigned models selected by jModeltest, while mitochondrial loci were treated as a unique partition and assigned a GTR+G model of sequence evolution; (3) two partitions, one including all nuclear loci, and the other including all mitochondrial loci, and both being assigned a GTR+G model; (4) one partition, with all loci treated as a single partition with a GTR+G model. Analyses were run using uncorrelated lognormal priors in BEAST 1.7.4 (Drummond et al., 2012). A birth-death prior was assigned to rates of cladogenesis, and analyses were run for each partition scheme with both uniform and exponential hyperpriors to verify their influence on dating estimates. After a thorough review of the paleontological literature, minimum ages and soft upper bound age estimates were assigned to 15 nodes in the molecular phylogeny using 22 fossil calibrations (Table 2, Appendix I in on-line Data Sheet 2). For each partition scheme, analyses were run with and without a fossil calibration point assigned to the root of the tree. For each dataset two analyses were run for 50–80 million generations each, with sampling every 2500 generations. Tracer 1.5 (Drummond et al., 2012) was used to inspect trace files and ensure that the ESS values for all parameters were greater than 200, indicating that the chains had reached convergence. For each partition scheme 8–20% of the first trees were discarded as burnin and the remaining trees were merged from separate analyses using Log Combiner to reconstruct a timetree using Tree Annotator (Drummond et al., 2012).
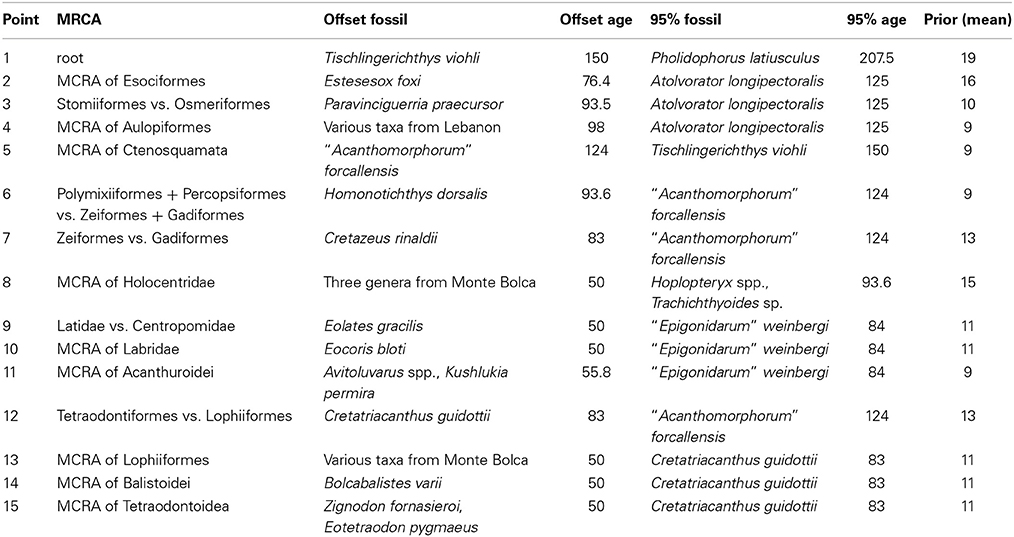
Table 2. Fossil calibration points used in this study (age in million year ago; MRCA, most recent common ancestor).
Results
Phylogenetic Analyses
Maximum likelihood (ML) analyses of the four data matrices (with or without mitochondrial genes, and with or without the RY coding for the third codon positions) with alternative partition schemes produced highly congruent topologies; yet acanthomorphs do not appear to be monophyletic in most of the 22 analyses (Figure 1; Table 3). Only three analyses [combined dataset without RY recoding, partitioned by gene and by codon positions for protein-coding genes (Figure 1A), and combined and nuclear gene only datasets without RY recoding partitioned as suggested by Partition Finder (Table 3)] resulted in a monophyletic Acanthomorpha; however, the monophyly was challenged with very low nodal support [bootstrap (BSP) of 47 and 43%, respectively] (Figure 1; Table 3). All combined data analyses recover, with high support (≥ 86% BSP), the Ctenosquamata (Rosen, 1973), a clade formed by Acanthomorpha + Myctophiformes (lanternfishes). When the RY coding was applied, the Myctophiformes appear as the sister taxon to Lampriformes with strong support (≥ 72% BSP or 84% BSP in average from six RY coding analyses from combined data set) (Figure 1B; Table 3), and together this group forms the sister group to a large group containing Polymixiiformes, Zeiformes, Gadiformes, and Percopsiformes, with two of these lineages being original members of the Paracanthopterygii as outlined by Rosen and Patterson (1969). While support for this redefined paracanthopterygian clade is relatively high among the analyses (≥ 75% BSP or 88% BSP in average from combined data set) (Figure 1; Table 3), relationships among lampriforms, myctophiforms, paracanthopterygians, and acanthopterygians are not, with BSP < 73% on all critical nodes. However, the monophyly of several major acanthomorph subclades is more strongly supported in all sets of analyses. The Acanthopterygii, which includes the traditional “Percomorpha” (morphology-defined) as well as three additional former paracanthopterygians, the Ophidiiformes, Batrachoidiformes and Lophiiformes, receives 100% BSP support in all analyses. We did not recover the monophyly of the “Berycomorpha,” as suggested by mitogenomic data (Miya et al., 2005), as the Trachichthyoidei and a group formed by Stephanoberyciformes + Berycoidei + Holocentroidei appear to be sequential sister taxa to all remaining acanthopterygians. The recently recognized Percomorpha (defined mainly based on molecule-based studies), whose monophyly is supported by a 100% BSP in all analyses, includes Atherinomorpha, Ophidiiformes, Batrachoidiformes, as well as all the major clades inferred by the earlier molecular studies, such as clades L, N, Q, and X of Chen et al. (2003, 2007), Dettaï and Lecointre (2005, 2008) and Li et al. (2009). Clade Q (= Clade VII in Near et al., 2013) includes the Atherinomorpha (Medaka, guppies, needlefishes), as well as the cichlids, and corresponds to the recent Ovalentaria of Wainwright et al. (2012). Clade L (= Clade VI in Near et al., 2013) or Carangimorpha sensu Li et al. (2009) includes Carangidae (jacks and pompanos) and several percoid families, such as Centropomidae (snooks and Nile perches), Menidae (moonfishes), and Pleuronectiformes (flatfishes) which is resolved as non-monophyletic (as also recovered in Betancur-R et al., 2013a; Campbell et al., 2013; Near et al., 2013). Clade X (= Clade XIII in Near et al., 2013) or Serraniformes sensu Li et al. (2009) and Lautrédou et al. (2012) includes representatives of the Scorpaeniformes (rockfishes and lionfishes) and Gasterosteiformes (sticklebacks), as well as Nothothenioidei (Antarctic acanthomorphs) and Percidae (true perches and darters). All three major percomorph subclades (Q, L, X) receive 100% BSP support in all analyses. The fourth large subclade (clade N) sensu Chen et al. (2007) (= Clade XIV in Near et al., 2013) is poorly supported in our analyses (< 73% BSP or 51% in average). This clade includes some of the major groups of reef fishes, such as Acanthuridae (surgeonfishes), as well as pufferfishes, triggerfishes and allies (Tetraodontiformes), as well as major temperate water lineages, such as Sparidae (seabreams and porgies), and Moronidae (temperate sea basses), and deep-sea taxa such as Lophiiformes (frogfishes, goosefishes and monkfishes) (Figure 1).
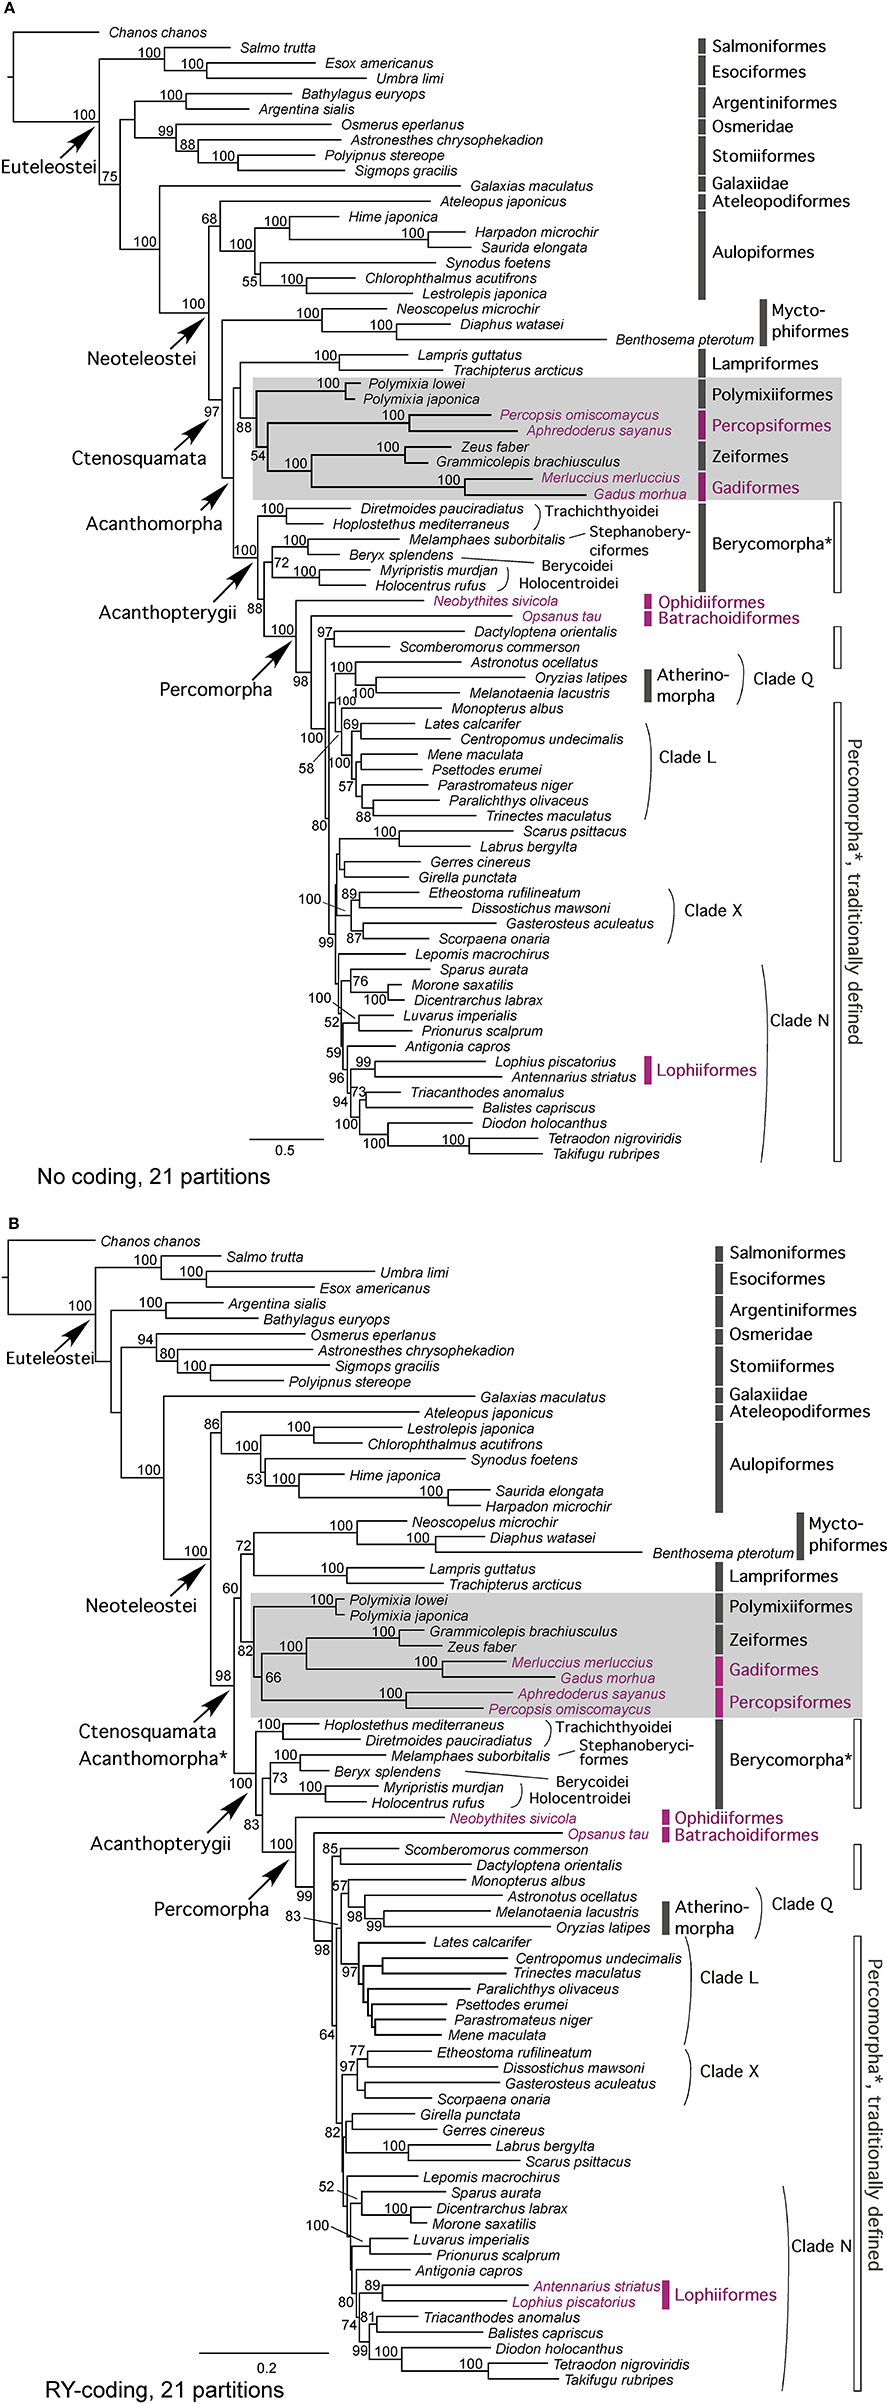
Figure 1. Phylogenetic tree depicting evolutionary relationships of acanthomorph fishes and their putative sister-taxa within the Euteleostei. Relationships were inferred using partitioned maximum-likelihood (RAxML) analysis of 6967 aligned nucleotides from nine genes based on no weighting (A) and RY coding (B) data matrices that were partitioned by gene and codon positions (21 partitions) under a GTR+G model of nucleotide evolution. Their ML score is −137523.0340 and 88770.9708, respectively. Chanos chanos (Otocephala: Gonorynchiformes) was selected as the outgroup to root the tree. Branch lengths are proportional to number of substitutions under the GTR+G model. Numbers on branches are ML bootstrap values (1000 replicates); those below 50% are not shown. *indicates the taxonomic assemblages do not appear to be monophyletic in the tree. Traditional paracanthopterygian lineages are highlighted in rose color. New Paracanthopterygii is indicated by gray rectangle box. Clades L (Carangimorpha) (= Clade VI in Near et al., 2013), Q (Ovalentaria) (= Clade VII in Near et al., 2013), X (Serraniformes) (= Clade XIII in Near et al., 2013) and N (= Clade XIV in Near et al., 2013) are the major acanthomorph clades inferred by the earlier molecular studies (Chen et al., 2003, 2007; Dettaï and Lecointre, 2005, 2008; Li et al., 2009) that were corroborated in more recent studies (Lautrédou et al., 2012; Wainwright et al., 2012; Betancur-R et al., 2013a; Campbell et al., 2013; Near et al., 2013).
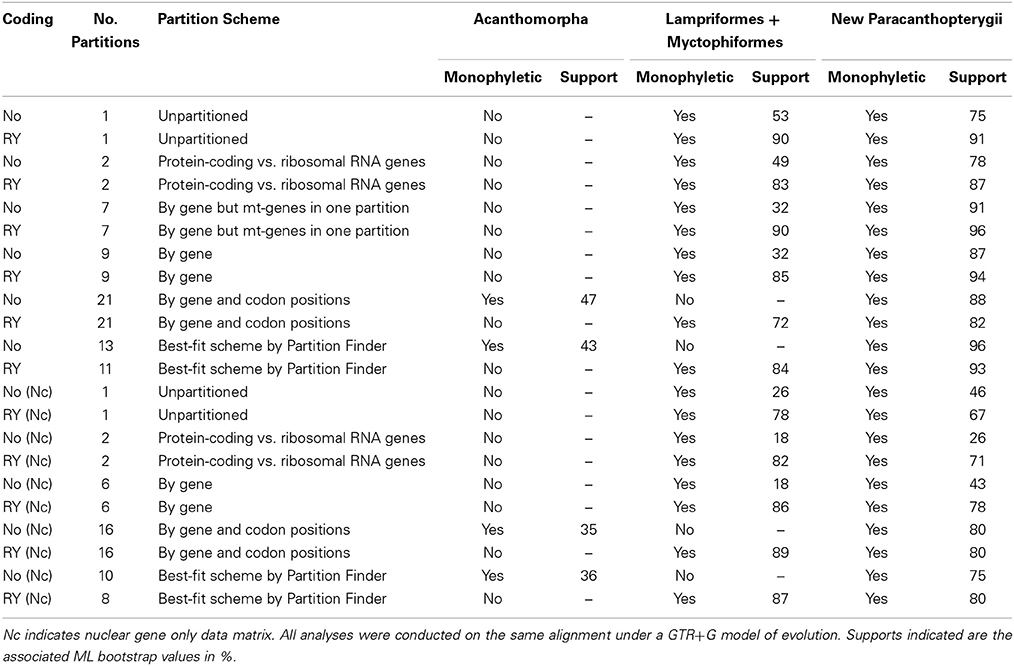
Table 3. Summary of the 22 unpartitioned and partitioned RAxML analyses conducted based on four data matrices with and without mitochondrial genes, and with and without RY coding of the third codon positions for protein coding genes for this study.
Molecular Dating
The topologies recovered by the various Bayesian analyses are highly congruent with the ML trees, recovering all the same major acanthomorph and percomorph subclades. All Bayesian topologies recover a clade inclusive of lampriforms, myctophiforms and the re-defined paracanthopterygians. Changing partition schemes and hyperpriors does not have an effect on age estimates, as all topologies with the same number of calibration points (e.g., with or without a fossil prior on the root of the tree) result in inferred ages that are within a 2% range of each other for virtually every node. The presence or absence of a prior on the root appears to greatly influence the age of the deepest nodes in the tree, but does not impact either the estimated age of the Ctenosquamata or any of the nodes within it (Figure 2; Supplementary Figure 1). Thus, for the purpose of this paper, only inferred ages from analysis in which all nine loci are treated as individual partitions and a fossil prior is assigned to the root of the tree are presented (Figure 2) and discussed.
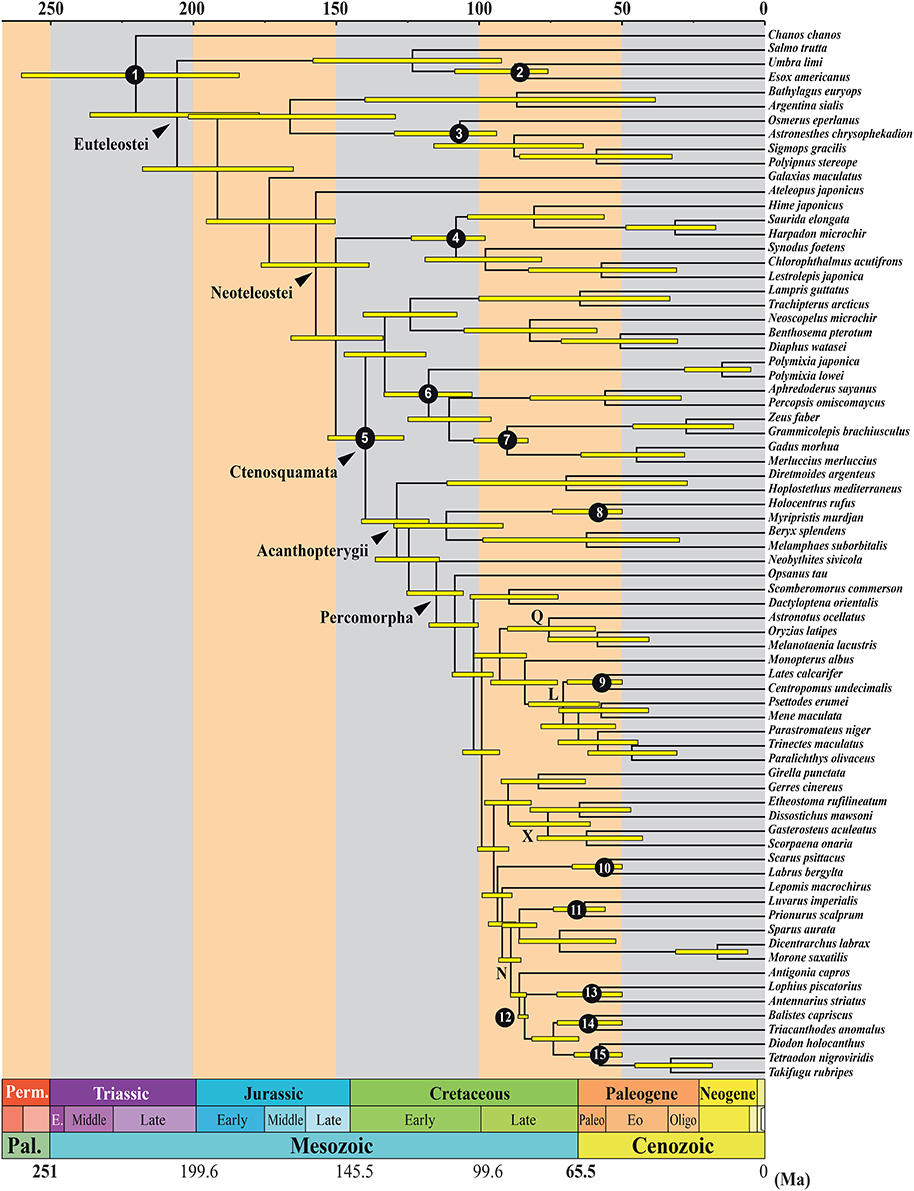
Figure 2. Time-calibrated phylogenetic tree of acanthomorphs and related lineages obtained when each of the nine loci is treated as an individual partition and a fossil prior is applied to the root. Nodes whose minimum age and soft upper bound were estimated using fossil calibration points indicated by numbers 1–15 (see Table 2 for description of fossil calibrations). Clades L, Q, X, and N are the major acanthomorph clades (see details in the Result Section or Figure 1 legend). Ma, million years ago.
The stem age of the ctenosquamates (acanthomorphs + myctophiforms), which marks their separation from their sister group aulopiforms, is estimated at 150 Ma (133–166 Ma, 95% highest posterior density, HPD). The crown age of the ctenosquamates, with the split of the paracanthopterygian + lampriforms + myctophiforms from the acanthopterygians, is estimated at 140 Ma (126–153 Ma, 95% HPD). All major lineages within this first acanthomorph clade appear to have originated during the Cretaceous. The divergence between lampriforms and myctophiforms is estimated to date to 124 Ma (108–141 Ma, 95% HPD), that between polymixiiforms and remaining paracanthopterygians to 118 Ma (103–134 Ma, 95% HPD), the percopsiforms at 111 Ma (96–125 Ma, 95% HPD) and zeiforms and gadiforms separating at 90 Ma (83–102 Ma, 95% HPD). The acanthopterygians are estimated to have originated around 129 Ma (118–141 Ma, 95% HPD), with the split between Trachichthyoidei and the remaining acanthopterygians. The remaining berycomorphs lineage is estimated to have diverged near 125 Ma (114–136 Ma, 95% HPD). The percomorphs are estimated to have diverged near 115 Ma (106–125 Ma, 95% HPD). All the major percomorph subclades appear to have originated during the Late Cretaceous, with clade Q having diverged about 93 Ma (84–102 Ma, 95% HPD), clade L diverging near 84 Ma (73–96 Ma, 95% HPD) and clade X diverging from its closest relatives around 90 Ma (82–98 Ma, 95% HPD). Clade N also dates to the Late Cretaceous, with an estimated age of 92 Ma (87–97 Ma, 95% HPD). Notable splits that were shown to have occurred during the Late Cretaceous, including the holocentroid/berycoid+stephanoberyciform split, are estimated to have dated to 112 Ma (92–130 Ma, 95% HPD); the cichlids/atherinomorph divergence at 76 Ma (59–90 Ma, 95% HPD); and the lophiiform/tetraodontiform divergence at 84 Ma (83–87 Ma, 95% HPD).
Discussion
Euteleost and Acanthomorph Phylogeny
This study used a combination of new and traditionally used loci to investigate the phylogenetic relationships of the basal acanthomorph lineages and their allied groups in the Euteleostei. While our acanthomorph topologies (full dataset and RY coding for third codon position with six alternative partition schemes; nuclear gene only dataset with and without RY coding for third codon position with five alternative partition schemes) are in close agreement (Figures 1, 3A, and Table 3), and mostly recover the same large clades observed in other molecular studies (Chen et al., 2003, 2007, 2014b; Miya et al., 2003, 2005, 2013; Dettaï and Lecointre, 2008; Li et al., 2009; Wainwright et al., 2012; Near et al., 2012b, 2013; Betancur-R et al., 2013a), a few discordances are observed. Given the focus of this study on the early evolution of the Acanthomorpha, we herein restrict our discussion to the non-monophyly of the Acanthomorpha, the phylogenetic position of the Polymixiiformes relative to other acanthomorphs, and the inter-relationships among main euteleost lineages. A summary for the comparison between the recently published “bony fish” tree of life (Betancur-R et al., 2013a) and our study is presented in Figure 3.
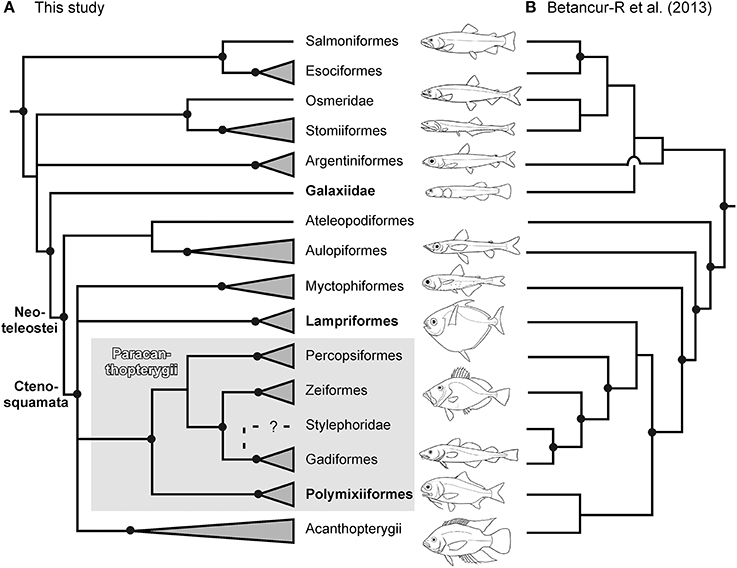
Figure 3. A summary of the new hypothesis (strict consensus tree from Figures 1A,B) (A) (this study) for the evolutionary relationships among the main lineages of euteleost fishes. This is compared with the most recent hypothesis (B) (Betancur-R et al., 2013a) that was based on one mitochondrial and 20 nuclear genes. Solid points on nodes indicate statistically robust nodes with bootstrap values ≥ 80%.
The monophyly of the acanthomorphs is only supported in two of six likelihood analyses of the full dataset, but is not supported in the likelihood analyses with RY coding for the third codon position or in the Bayesian analyses (Figures 1, 2; Table 3). When the monophyly of acanthomorphs is not supported, the results reveal the Lampriformes as most closely related to Myctophiformes (Figure 1B; Table 3); the Lampriformes/Myctophiformes clade is inferred as sister to a clade (new Paracanthopterygii) formed by the former paracanthopterygian orders Gadiformes, Percopsiformes plus Zeiformes and Polymixiiformes. The results were not challenged when a reduced or nuclear gene only dataset was used in analyses (Table 3). The finding of the paraphyly of acanthomorphs, without inclusion of Myctophiformes is in agreement with the findings of mitogenomic studies (Miya et al., 2003, 2005, 2007; Poulsen et al., 2013), as well as studies based on both combined nuclear and mitochondrial loci (e.g., Chen et al., 2003; Meynard et al., 2012) and data from multi-nuclear loci (Li et al., 2008). This topology, however, conflicts with two of the most recently published studies (Betancur-R et al., 2013a; Near et al., 2013) (Figure 3), both of which revealed a monophyletic acanthomorph group, with Lampriformes being either sister to the new Paracanthopterygii, exclusive of Polymixiiformes (Betancur-R et al., 2013a; Figure 3B), or to the Acanthopterygii (Near et al., 2013).
While the analyses from our and others using mitogenomic data consistently find Polymixiiformes within the new Paracanthopterygii (Miya et al., 2003, 2005, 2007; Poulsen et al., 2013), these relationships are not supported in studies using datasets of nuclear loci that share a similar molecular sampling (Li et al., 2008; Near et al., 2012b, 2013; Betancur-R et al., 2013a) (Figure 3). Indeed, three different hypotheses for the sister-group relationship of the Polymixiiformes were proposed by the latter three studies. Different taxonomic sampling and proportion of missing sequences in data matrices used in analyses may be the root cause for these inconsistences, even though these studies share a similar molecular sampling.
Finally, although acanthomorphs plus myctophiforms form a clade (Ctenosquamata) within the monophyletic Neoteleostei (Figure 3), major differences exist as to the relationships among the main euteleost lineages (including Neoteleostei) as inferred from our analyses when compared with those in other molecular studies. In all our phylogenetic analyses the basal-most lineage of Euteleostei is the “protacanthopterygian” members from Esociforms (pikes) and Salmoniforms (salmons). Osmeridae (smelts) (originally belonging to “Protacanthopterygii”) and deep-sea stomiiforms (formerly included in the Neoteleostei) form a strongly supported clade. This result was found in an earlier molecular investigation of esociform phylogeny and its relationship to Euteleostei using mitochondrial ribosomal and nuclear RAG1 DNA sequence data (López et al., 2004), a finding recently corroborated by nuclear-gene-based studies (Li et al., 2008; Near et al., 2012b, 2013; Betancur-R et al., 2013a). Another “osmeriform” group, Galaxias (Galaxiidae), is placed outside of this clade and appears to be more closely related to neoteleosts than to other osmeriforms and “Protacanthopterygii” sensu Nelson (2006), including the traditional groups Argentiniformes, Osmeriformes, Salmoniformes, and Esociformes (Figure 3A). This finding was not supported in Betancur-R et al. (2013a) (Figure 3B), but was supported in Near et al. (2012b), a study sharing similar gene sampling. Finally, the sister-taxon of the Ctenosquamata (acanthomorphs + myctophiforms) remains unresolved; hypotheses of sister group relationships have included Ateleopodiformes (jellynose) in a mito-genomic study (Poulsen et al., 2013), Aulopiformes (lizardfishes and the allies) in Betancur-R et al. (2013a) (Figure 3B) and Near et al. (2012b), or the former two lineages together (this study; Figure 3A). Overall, these findings of alternative hypotheses of phylogenetic relationships within the euteleost tree, including the problematic placement of the enigmatic Lepidogalaxias (Osmeriformes) (not sampled in this study), clearly deserve further investigation.
Acanthomorph Evolutionary Timescale and Comparison with Previous Studies
Both dating analyses with and without a fossil prior on the root of the tree produce very similar timescales for the acanthomorphs (including myctophiforms), which appear to have split from their sister taxon ~ 150 Ma; at ~ 140 Ma, near the Jurassic/Cretaceous limit, an increased rate of diversification is hypothesized to have occurred in the lineage. Our age estimates in diversification appear younger than those hypothesized in some studies dating cladogenetic events [the crown acanthomorphs + myctophiforms is dated at ~173 Ma in Betancur-R et al. (2013a), 200 Ma or greater in several mitogenomic studies (Yamanoue et al., 2006; Azuma et al., 2008; Setiamarga et al., 2009)], but are in close agreement with the hypothesized age estimates of 152 Ma as inferred by Near et al. (2013) for the ctenosquamates, and 142 Ma for their acanthomorphs (Figure 2; Table 1). Our age estimates for the crown percomorphs (115 Ma) similarly match those inferred by Near et al. (2013), but are younger than those inferred by Betancur-R et al. (2013a) (133 Ma) (Figure 2; Table 1).
While the ages for the deepest nodes within acanthomorphs tend to agree with these inferred by the large phylogenetic studies of Betancur-R et al. (2013a) and Near et al. (2013), the ages of many of the acanthomorph lineages do not (Table 1). For example, the split between lophiiforms and tetraodontiforms is dated herein at ~ 85 Ma, in close agreement with the estimated minimum age for the oldest fossil that can be assigned to this node (~ 83 Ma, see Appendix I), but was estimated to be only ~ 60 Ma by Near et al. (2013), an age considerably younger than the fossil record of this clade (Tyler and Sorbini, 1996; Santini and Tyler, 2003, 2004). The split between sparids and moronids is dated at ~ 75 Ma in our tree and is in close agreement with the otolith fossil record for moronids (73–74 Ma; Nolf and Dockery, 1990); Near et al. (2013) infer an age of ~ 65 Ma for the split between these two lineages, and only ~ 23 Ma for the crown of the sparids, a group with a rich record of crown fossils dating to at least 52 Ma (Santini et al., 2014).
The age inferred herein for the split between cichlids and atherinomorphs (~ 75 Ma) is in close agreement with estimates by Near et al. (2013), but strongly conflicts with estimates from the two mitogenomic studies that infer a Late Jurassic to Early Cretaceous age [136 Ma in Azuma et al. (2008) or 150 Ma in Setiamarga et al. (2009)], as well as with the 94 Ma estimate of Betancur-R et al. (2013a). While our study does not include sampling to permit testing hypotheses concerning the evolution of cichlids, the Late Cretaceous age for the split between cichlids and atherinomorphs significantly postdates the break-up of Gondwana, which would have to invoke the argument that the current geographic distribution of cichlids might be explained by either divergences before the breakup or some degree of dispersal, perhaps during the early breakup of Gondwana. This hypothesis is different from that of several studies employing geological events as calibration points and estimated much older ages for the exclusively freshwater cichlid radiation [96 Ma in Azuma et al. (2008); 150 Ma in López-Fernández et al. (2013)].
Previous Fossil Calibrations
The selection of calibration points for molecular clock studies is perhaps the most critical step in dating analyses, and the one where systematic errors are most likely to occur. Selection of incorrect calibration points can occur in different ways: (1) fossils are assigned to the wrong lineage, (2) stem fossils are used to set the minimum age of crown groups, and/or (3) incorrect stratigraphic data or geological ages are used. We add an additional concern in dating analyses, which is (4) failure to include reliable fossils that date a group. These can all introduce significant sources of error and may account for some disagreement existing between the paleontological record and some molecular clock studies, or between the various molecular timetrees.
A case of erroneous assignment of fossils is that of Yamanoue et al. (2006). This study incorrectly assigned a 161 Ma old fossil that was originally classified as incertae sedis within Acanthopterygii to Gadiformes, two groups that only date to about ~61 Ma in the fossil record (Patterson, 1993b). The most common example of mis-assigned fossils involves the use of stem fossils as crown calibrations. For example, Davis and Fielitz (2010) incorrectly used Pholidophorus bechei, which they had previously and correctly identified as a stem teleost, to date the minimum age of their crown teleost group, thus adding ~45 Ma to the age of this clade. An example of the third kind of error is represented by some of the calibration points in Near et al. (2012b), which were subsequently used in Betancur-R et al. (2013a) and Near et al. (2013). Two fossils from these studies (their calibrations 14, Cretazeus rinaldii, and 20, Gasterorhamphosus zuppichinii) are from the Calcari di Melissano area in the Lecce province, southern Italy, a location that has so far yielded a rich record of fossil acanthomorphs (e.g., Sorbini, 1981; Sorbini and Bannikov, 1991; Tyler and Sorbini, 1996; Tyler et al., 2000). While earlier studies placed the age of this deposit around the Campanian-Maastrichtian boundary (~ 70.6 Ma) based on a cursory analysis of the nannoplankton content, more recent stratigraphic studies have pushed the age of the formation to a time interval ranging from the Coniacian to the basal part of the Campanian, with a minimum age of at least 83 Ma (Schlüter et al., 2008). This would make the minimum age for these calibration points older than the upper bound of 80.9 Ma used in Near et al. (2012b, 2013), further indicating that it is likely that these studies significantly underestimated the ages of nodes to which these fossils were assigned.
Failure to include available and valid calibration points is potentially the most common kind of error, due to uncertainty surrounding the phylogenetic placement of many fossil acanthomorphs. While acanthomorph fishes have an excellent fossil record, the quality of this record varies dramatically among the various clades, and is directly related to the ecology of some groups that are found in habitats that are not conducive to fossilization, a fossil record not yet having been revised, or fossils not having been included in phylogenetic analyses together with extant taxa to determine proper placements. For this reason, while it is easy to assign fossil calibration to certain groups (e.g., Lophiiformes, Tetraodontiformes), it is much more difficult to do so in other clades, even though they possess a rich fossil record (e.g., “Carangiformes”). Therefore, it is not surprising that large sections of the acanthomorph tree do not include any fossils in any of the recently published large-scale studies (Betancur-R et al., 2013a; Near et al., 2013). Other branches of the tree, however, contain groups whose fossil record has been extensively studied, and it is thus surprising that this record has not been put to better use in time-tree analyses, especially in cases in which molecular trees may be inferring ages that are too young to be realistic based on a good assessment of fossil evidence. One of the most dramatic examples of this is likely the evolution of African-American cichlids. In spite of a rich fossil record that may align to extant groups dating back to Middle Eocene, ~ 48.6 Ma, and faunas that have been extensively described (e.g., Murray, 2001; Malabarba and Malabarba, 2008; Malabarba et al., 2010, 2014), no fossil cichlids were included in the Near et al. (2012b, 2013) or Friedman et al. (2013) studies. This led the authors to infer an unrealistically young age of only ~ 46 Ma for the split between African and American cichlids, and ~29 Ma for the crown of American cichlids. Moreover, these practices are problematic because based on this age, Near et al. (2013) identified African-American cichlids as one of the five most rapidly radiating acanthomorph lineages. While African-American cichlids are one of the most species-rich acanthomorph clades, their explosive diversification rate inferred by Near et al. (2013) is likely a product of inferences of ages of clades that are much too young.
Similarly, the studies by Near et al. (2012b, 2013) failed to include calibration points for their “scombriforms,” another group that was identified as one of their most rapidly radiating groups. “Scombriforms” are recovered with a crown age of only 34.5 Ma, yet the otolith fossil record indicates an age for the group of at least 79.7 Ma for the entire clade, and the skeletal fossil record of crown scombrids is at least 58.7 Ma old (Santini et al., 2013c). In spite of the rich scombrid fossil record (e.g., Monsch, 2005), surprisingly no scombrid fossils were used in either of the studies by Near et al. (2013) or Betancur-R et al. (2013a), both of which recover unrealistically young ages for this group [e.g., 23 Ma for the split between tunas and allies in Betancur-R et al. (2013a), even though the fossil record of tuna-like fishes is ~ 40 Ma]. Other groups represented in the Betancur-R et al. (2013a) tree also appear to have much younger ages than the fossil record suggests [e.g., Sphyraenidae, ~ 25 Ma, vs. ~ 50 Ma of Sphyraena bolcensis from the Eocene of Monte Bolca; Istiophoroidei, ~ 30 Ma vs. ~ 55 Ma of the Early Eocene Hemingwaya sarissa Fierstine and Monsch, 2002; Monsch and Bannikov, 2011], suggesting the need to strengthen the collaboration between acanthomorph paleontologists and molecular phylogeneticists in future studies.
The Paleobiological Scenario of Acanthomorph Origin and Evolution
The Early Cretaceous origin of the acanthomorph body plan was marked by a complex series of modifications in the feeding, locomotion, and protection systems (see Patterson, 1964). As a result of these, acanthomorph fishes are the most diverse teleosts in terms of feeding strategies associated with the protrusible mouth and superiority in their maneuverability (Rosen, 1982). Most of the morphological innovations characteristic of this group (dorsal-, anal-and pelvic-fin spines; scales armed with ctenii or prickles; bones of the opercular series bearing spines, etc.), however, likely evolved as features that ultimately served a defensive function. Beginning from the Cretaceous, several taxa are also characterized by thickened and strongly ornamented head bones and a dense dermal cover of heavily ossified, overlapping shields, forming a strong armor protecting the whole body (e.g., Tyler and Sorbini, 1996; González-Rodríguez et al., 2013). On the other hand, the elaborate maneuverability of the body may be considered, at least in part, a trait of a defensive system of the acanthomorphs. Overall, the fossil evidence seems to support such a hypothesis because during the earliest phases of their evolutionary history, the acanthomorphs were characterized by a conspicuously developed defensive system. The origin of the elaborate acanthomorph body plan can be interpreted in terms of a rapid evolution of features that in the end could be deemed as adaptive anti-predatory features. It is interesting to note that this evolutionary event(s) took place during a period of profound ecological reorganization of the tropical marine ecosystems, characterized by a predator-prey escalation (see Vermeij, 1977; Harper, 2003). This late Mesozoic reorganization of the shallow marine ecosystems, commonly known as Mesozoic Marine Revolution, has been recognized largely on the record of benthic conchiferous animals and their durophagous predators (e.g., Vermeij, 1977, 1987); moreover, comparable modifications also affected sessile invertebrates and their associated grazing and bioeroding predators. Vermeij (1987) proposed that the remarkable increased levels of predation and competition led to the evolution of an increased variety of defensive adaptations, both morphological and behavioral. Considered from this perspective, the Early Cretaceous origin of acanthomorphs can be presented as another hypothesized example of the restructuring of the shallow marine ecosystems in the late Mesozoic with the rise of specific, primarily defensive, morphological adaptations.
Concluding Remarks
The main goal of this study was to investigate the early evolution of acanthomorphs and their phylogenetic relationships to other euteleosts using a combination of traditional (RAG1, RH and 28S loci, as well as the mitochondrial COI, 12S and 16S genes) (e.g., Chen et al., 2003, 2007; Holcroft, 2004; López et al., 2004; Dettaï and Lecointre, 2005, 2008; Li et al., 2009) and new markers (nuclear EGR1, 2B, and 3 genes). The EGR1, 2B, and 3 loci were originally developed for the Cypriniform tree of Life project (Chen et al., 2008) and have successfully been used on a number of studies investigating lower teleost groups (e.g., Santini et al., 2013a; Chen et al., 2014a). In this study, we demonstrate their appropriateness for investigating higher-level phylogenetic relationships among acanthomorphs.
Our phylogenetic study and others based on multi-locus data (e.g., Betancur-R et al., 2013a; Near et al., 2013; see also review in Chen and Mayden, 2010) indicate that, while Ctenosquamata (Acanthomorpha plus Myctophiformes), Acanthopterygii, and Atherinomorpha are supported as monophyletic, the traditionally defined Paracanthopterygii, Berycomorpha (=Beryciformes), and Percomopha are not resolved as monophyletic. While this study adds to the growing evidence supporting the major clades that have been repeatedly identified by recent molecular studies, the monophyly of the Acanthomorpha, as well as the relationship among Lampriformes, the new Paracanthopterygii, and Acanthopterygii remain uncertain. The new Paracanthopterygii (= Paracanthopterygii sensu Miya et al., 2005 based on mitogenomic results) is herein defined as the clade including Polymixiiformes, Zeiformes, Gadiformes, Percopsiformes, and possibly the enigmatic Stylephorus chordatus (not sampled) (Figure 3), previously shown to be the sister-taxon to the Gadiformes (Miya et al., 2007). The newly defined clade was not challenged when only nuclear gene data were included in analyses (Table 3). This indicates that the result is not biased toward the mitochondrial genes. Indeed, the phylogenetic signals in mitochondrial data are additive in the combined data analyses, revealed by a higher bootstrap support from the latter analyses (Table 3).
Our new timetree largely agrees with other recent studies inferring an Early Cretaceous age for the origin of the acanthomorphs (e.g., Betancur-R et al., 2013a; Near et al., 2013); however, analyses herein infer older ages for times of appearance and subsequent radiations of some major subclades, including the lophiiform-tetraodontiform grouping. Our new timetree of acanthomorph evolution is in much closer agreement with the fossil record than most previous studies. Finally, we point out that incorrect calibration due to inappropriate assignment of ages to fish-bearing fossil strata, or to biases in sequence evolution, may be the root cause for some groups to appear much younger in molecular timetrees by Betancur-R et al. (2013a) and Near et al. (2013) than indicated by current fossil record.
Conflict of Interest Statement
The authors declare that the research was conducted in the absence of any commercial or financial relationships that could be construed as a potential conflict of interest.
Acknowledgments
We thank Kwang-Tsao Shao, Samuel Iglésia, and University of Kansas Natural History Museum (via Andy Bentley) for the loan or gift of tissue samples. We acknowledge the referees for their constructive comments. This work was supported by research grants from Taiwanese National Science Council NSC 99-2611-M-002-001-MY2 and MOST 102-2923-B-002-001-MY3 (to Wei-Jen Chen) and in part by USA NSF grants DEB-1021840 and EF 0431326 (to Richard L. Mayden). Francesco Santini was supported by a Lagrange visiting fellowship by ISI, Fondazione CRT. Giorgio Carnevale was supported by ex-60% grants of the Università degli Studi di Torino.
Supplementary Material
The Supplementary Material for this article can be found online at: http://www.frontiersin.org/journal/10.3389/fmars.2014.00053/abstract
References
Azuma, Y., Kumazawa, Y., Miya, M., Mabuchi, K., and Nishida, M. (2008). Mitogenomic evaluation of the historical biogeography of cichlids toward reliable dating of teleostean divergences. BMC Evol. Biol. 8:e215. doi: 10.1186/1471-2148-8-215
Pubmed Abstract | Pubmed Full Text | CrossRef Full Text | Google Scholar
Betancur-R, R., Broughton, R. E., Wiley, E. O., Carpenter, K., López, J. A., Li, C., et al. (2013a). The Tree of Life and a new classification of bony fishes. PLoS Curr. 5:ecurrents.tol.53ba26640df0ccaee75bb165c8c26288. doi: 10.1371/currents.tol.53ba26640df0ccaee75bb165c8c26288
Pubmed Abstract | Pubmed Full Text | CrossRef Full Text | Google Scholar
Betancur-R, R., Li, C., Munroe, T. A., Ballesteros, J. A., and Ortí, G. (2013b). Addressing gene tree discordance and non-stationarity to resolve a multi-locus phylogeny of the flatfishes (Teleostei: Pleuronectiformes). Syst. Biol. 62, 763–785. doi: 10.1093/sysbio/syt039
Pubmed Abstract | Pubmed Full Text | CrossRef Full Text | Google Scholar
Campbell, M. A., Chen, W.-J., and López, J. A. (2013). Are flatfishes (Pleuronectiformes) monophyletic? Mol. Phylogenet. Evol. 69, 664–673. doi: 10.1016/j.ympev.2013.07.011
Pubmed Abstract | Pubmed Full Text | CrossRef Full Text | Google Scholar
Campbell, M. A., Chen, W.-J., and López, J. A. (2014). Molecular data do not provide unambiguous support for the monophyly of flatfishes (Pleuronectiformes): a reply to Betancur-R and Ortí. Mol. Phylogenet. Evol. 75, 149–153. doi: 10.1016/j.ympev.2014.02.011
Pubmed Abstract | Pubmed Full Text | CrossRef Full Text | Google Scholar
Carnevale, G., Bannikov, A. F., Marramà, G., Tyler, J. C., and Zorzin, R. (2014). “The Pesciara-Monte Postale fossil-lagerstätte: 2. Fishes and other vertebrates,” in The Bolca Fossil-Lagerstätten: A Window into the Eocene World, eds C. A. Papazzoni, L. Giusberti, G. Carnevale, G. Roghi, D. Bassi, and R. Zorzin (Modena: Rend. Soc. Paleont. It), 37–63.
Carpenter, K. E., and Niem, V. H. (eds.). (1999). “FAO species identification guide for fishery purposes. the living marine resources of the western central pacific,” in Batoid Fishes, Chimaeras and Bony Fishes Part 1. FAO, Vol. 3 (Rome), 1397–2068.
Chen, J.-N. J., López, J. A., Lavoué, S., Miya, M., and Chen, W.-J. (2014a). Phylogeny of the Elopomorpha (Teleostei): evidence from six nuclear and mitochondrial markers. Mol. Phylogenet. Evol. 70, 152–161. doi: 10.1016/j.ympev.2013.09.002
Pubmed Abstract | Pubmed Full Text | CrossRef Full Text | Google Scholar
Chen, W.-J., Bonillo, C., and Lecointre, G. (2003). Repeatability of clades as a criterion of reliability: a case study for molecular phylogeny of Acanthomorpha (Teleostei) with larger number of taxa. Mol. Phylogenet. Evol. 26, 262–288. doi: 10.1016/S1055-7903(02)00371-8
Pubmed Abstract | Pubmed Full Text | CrossRef Full Text | Google Scholar
Chen, W.-J., Lavoué, S., Beheregaray, L. B., and Mayden, R. L. (2014b). Historical biogeography of a new antitropical clade of temperate freshwater fishes. J. Biogeogr. 49, 1806–1818. doi: 10.1111/jbi.12333
Chen, W.-J., Lavoué, S., and Mayden, R. L. (2013). Evolutionary origin and early biogeography of otophysan fishes (Ostariophysi: Teleostei). Evolution 67, 2218–2239. doi: 10.1111/evo.12104
Pubmed Abstract | Pubmed Full Text | CrossRef Full Text | Google Scholar
Chen, W.-J., and Mayden, R. L. (2009). Molecular systematics of the Cyprinoidea (Teleostei: Cypriniformes), the World's largest clade of freshwater fishes: further evidence from six nuclear genes. Mol. Phylogenet. Evol. 52, 544–549. doi: 10.1016/j.ympev.2009.01.006
Chen, W.-J., and Mayden, R. L. (2010). A phylogenomic perspective on the new era of ichthyology. Bioscience 60, 421–432. doi: 10.1525/bio.2010.60.6.6
Chen, W.-J., Miya, M., Saitoh, K., and Mayden, R. L. (2008). Phylogenetic utility of two existing and four novel nuclear gene loci in reconstruction tree of life of ray-finned fishes: the order Cypriniformes (Ostariophysi) as a case study. Gene 423, 125–134. doi: 10.1016/j.gene.2008.07.016
Pubmed Abstract | Pubmed Full Text | CrossRef Full Text | Google Scholar
Chen, W.-J., Ortí, G., and Meyer, A. (2004). Novel evolutionary relationship among four fish model systems. Trends Genet. 20, 424–431. doi: 10.1016/j.tig.2004.07.005
Pubmed Abstract | Pubmed Full Text | CrossRef Full Text | Google Scholar
Chen, W.-J., Ruiz-Carus, R., and Ortí, G. (2007). Relationships among four genera of mojarras (Teleostei: Perciformes: Gerreidae) from the western Atlantic and their tentative placement among percomorph fishes. J. Fish Biol. 70, 202–218. doi: 10.1111/j.1095-8649.2007.01395.x
Clarke, A., and Johnston, I. A. (1996). Evolution and adaptive radiation of Antarctic fishes. Trends Ecol. Evol. 11, 212–218. doi: 10.1016/0169-5347(96)10029-X
Pubmed Abstract | Pubmed Full Text | CrossRef Full Text | Google Scholar
Davis, M. P., and Fielitz, C. (2010). Estimating divergence times of lizardfishes and their allies (Euteleostei: Aulopiformes) and the timing of deep-sea adaptations. Mol. Phylogenet. Evol. 57, 1194–1208. doi: 10.1016/j.ympev.2010.09.003
Pubmed Abstract | Pubmed Full Text | CrossRef Full Text | Google Scholar
Dettaï, A., and Lecointre, G. (2005). Further support for the clades obtained by multiple molecular phylogenies in the acanthomorph bush. C. R. Biol. 328, 674–689. doi: 10.1016/j.crvi.2005.04.002
Pubmed Abstract | Pubmed Full Text | CrossRef Full Text | Google Scholar
Dettaï, A., and Lecointre, G. (2008). New insights into the organization and evolution of vertebrate IRBP genes and utility of IRBP gene sequences for the phylogenetic study of the Acanthomorpha (Actinopterygii: Teleostei). Mol. Phylogenet. Evol. 48, 258–269. doi: 10.1016/j.ympev.2008.04.003
Pubmed Abstract | Pubmed Full Text | CrossRef Full Text | Google Scholar
Dornburg, A., Moore, J. A., Webster, R., Warren, D. L., Brandley, M. C., Inglesias, T. L., et al. (2012). Molecular phylogenetics of squirrelfishes and soldierfishes (Teleostei: Beryciformes: Holocentridae): reconciling more than 100 years of taxonomic confusion. Mol. Phylogenet. Evol. 65, 727–738. doi: 10.1016/j.ympev.2012.07.020
Pubmed Abstract | Pubmed Full Text | CrossRef Full Text | Google Scholar
Drummond, A. J., Suchard, M. A., Xie, D., and Rambaut, A. (2012). Bayesian phylogenetics with BEAUti and the BEAST 1.7. Mol. Biol. Evol. 29, 1969–1973. doi: 10.1093/molbev/mss075
Pubmed Abstract | Pubmed Full Text | CrossRef Full Text | Google Scholar
Edgar, R. C. (2004). MUSCLE: multiple sequence alignment with high accuracy and high throughput. Nucleic Acids Res. 32, 1792–1797. doi: 10.1093/nar/gkh340
Pubmed Abstract | Pubmed Full Text | CrossRef Full Text | Google Scholar
Faircloth, B. C., Sorenson, L., Santini, F., and Alfaro, M. E. (2013). A phylogenomic perspective on the radiation of ray-finned fishes based upon targeted sequencing of ultraconserved elements (UCEs). PLoS ONE 8:e65923. doi: 10.1371/journal.pone.0065923
Pubmed Abstract | Pubmed Full Text | CrossRef Full Text | Google Scholar
Felsenstein, J. (1985). Confidence limits on phylogenies: an approach using the bootstrap. Evolution 39, 783–791. doi: 10.2307/2408678
Fierstine, H. L., and Monsch, K. A. (2002). Redescription and phylogenetic relationships of the family Blochiidae (Perciformes: Scombroidei), Middle Eocene, Monte Bolca, Italy. St. Ric. Giac. Terz. Bolca 9, 121–163.
Friedman, M. (2010). Explosive morphological diversification of spiny-finned teleosts in the aftermath of the end-Cretaceous extinction. Proc. R. Soc. B Biol. Sci. 277, 1675–1683. doi: 10.1098/rspb.2009.2177
Pubmed Abstract | Pubmed Full Text | CrossRef Full Text | Google Scholar
Friedman, M., Keck, B. P., Dornburg, A., Eytan, R. I., Martin, C. H., Hulsey, C. D., et al. (2013). Molecular and fossil evidence place the origin of cichlid fishes long after Gondwanan rifting. Proc. R. Soc. B Biol. Sci. 280, 20131733. doi: 10.1098/rspb.2013.1733
Pubmed Abstract | Pubmed Full Text | CrossRef Full Text | Google Scholar
Froese, R., and Pauly, D. (2014). FishBase. Available online at: http://www.fishbase.org
Gaudant, M. (1978). Contribution à l′étude anatomique et systématique de l′ichtyo-faune cénomanienne du Portugal. Première partie: les Acanthopterygii. Com. Serv. Geol. Portugal 63, 105–149.
Gayet, M. (1980). Contribution à l′étude anatomique et systématique des poissons cénomaniens du Liban, anciennement placés dans les acanthoptérygiens. Mém. Mus. Natn. Hist. Nat. Sér. C 44, 1–149.
González-Rodríguez, K., and Fielitz, C. (2008). “A new species of acanthomorph fish from the Upper Cretaceous Muhi quarry, Hidalgo, central Mexico,” in Mesozoic Fishes 4 – Homology and Phylogeny, eds G. Arratia, H.-P. Schultze, and M. H. V. Wilson (München: Verlag Dr. Friedrich Pfeil), 399–411.
González-Rodríguez, K., Schultze, H.-P., and Arratia, G. (2013). “Miniature armored acanthomorph teleosts from the Albian/Cenomanian (Cretaceous) of Mexico,” in Mesozoic Fishes 5 – Global Diversity and Evolution, eds G. Arratia, H.-P. Schultze, and M. H. V. Wilson (München: Verlag Dr. Friedrich Pfeil), 457–487.
Harper, E. M. (2003). “The Mesozoic marine revolution,” in Predator-Prey Interactions in the Fossil Record, eds P. H. Kelley, M. Kowalewski, and T. A. Hansen (New York, NY: Kluwer Academic/Plenum Publishers), 433–455. doi: 10.1007/978-1-4615-0161-9_19
Hasegawa, M., Kishino, H., and Yano, T. (1985). Dating of the human-ape splitting by a molecular clock of mitochondrial DNA. J. Mol. Evol. 22, 160–174. doi: 10.1007/BF02101694
Pubmed Abstract | Pubmed Full Text | CrossRef Full Text | Google Scholar
Helfman, G. S., Collete, B. B., Facey, D. E., and Bowen, B. W. (2009). The Diversity of Fishes. Oxford: Blackwell Science.
Holcroft, N. I. (2004). A molecular test of alternative hypotheses of tetraodontiform (Acanthomorpha: Tetraodontiformes) sister group relationships using data from the RAG1 gene. Mol. Phylogenet. Evol. 32, 749–760. doi: 10.1016/j.ympev.2004.04.002
Pubmed Abstract | Pubmed Full Text | CrossRef Full Text | Google Scholar
Huntingford, F. A., and Ruiz-Gomez, M. L. (2009). Three-spined sticklebacks Gasterosteus aculeatus as a model for exploring behavioural biology. J. Fish Biol. 75, 1943–1976. doi: 10.1111/j.1095-8649.2009.02420.x
Pubmed Abstract | Pubmed Full Text | CrossRef Full Text | Google Scholar
Inoue, J. G., Miya, M., Venkatesh, B., and Nishida, M. (2005). The mitochondrial genome of Indonesian coelacanth Latimeria menadoensis (Sarcopterygii: Coelacanthiformes) and divergence time estimation between the two coelacanths. Gene 349, 22–235. doi: 10.1016/j.gene.2005.01.008
Pubmed Abstract | Pubmed Full Text | CrossRef Full Text | Google Scholar
Irschick, D. J., Albertson, R. C., Brennan, P., Podos, J., Johnson, N. A., Patek, S., et al. (2013). Evo-devo beyond morphology: from genes to resource use. Trends Ecol. Evol. 28, 267–273. doi: 10.1016/j.tree.2012.12.004
Pubmed Abstract | Pubmed Full Text | CrossRef Full Text | Google Scholar
Johnson, G. D., and Patterson, C. (1993). Percomorph phylogeny: a survey of acanthomorphs and a new proposal. Bull. Mar. Sci. 52, 554–626.
Jones, F. C., Grabherr, M. G., Chan, Y. F., Russell, P., Mauceli, E., Johnson, J., et al. (2012). The genomic basis of adaptive evolution in threespine sticklebacks. Nature 484, 55–61. doi: 10.1038/nature10944
Pubmed Abstract | Pubmed Full Text | CrossRef Full Text | Google Scholar
Kocher, T. D. (2004). Adaptive evolution and explosive speciation: the cichlid fish model. Nat. Rev. Genet. 5, 288–298. doi: 10.1038/nrg1316
Pubmed Abstract | Pubmed Full Text | CrossRef Full Text | Google Scholar
Kocher, T. D., Thomas, W. K., Meyer, A., Edwards, S. V., Pääbo, S., Villablanca, F. X., et al. (1989). Dynamics of mitochondrial DNA evolution in animals: amplification and sequencing with conserved primers. Proc. Natl. Acad. Sci. U.S.A. 86, 6196–6200. doi: 10.1073/pnas.86.16.6196
Pubmed Abstract | Pubmed Full Text | CrossRef Full Text | Google Scholar
Lanfear, R., Calcott, B., Ho, S. Y. W., and Guindon, S. (2012). PartitionFinder: combined selection of partitioning schemes and substitution models for phylogenetic analyses. Mol. Biol. Evol. 29, 1695–1701. doi: 10.1093/molbev/mss020
Pubmed Abstract | Pubmed Full Text | CrossRef Full Text | Google Scholar
Lautrédou, A. C., Hinsinger, D. D., Gallut, C., Cheng, C. H., Berkani, M., Ozouf-Costaz, C., et al. (2012). Phylogenetic footprints of an Antarctic radiation: the Trematominae (Notothenioidei, Teleostei). Mol. Phylogenet. Evol. 65, 87–101. doi: 10.1016/j.ympev.2012.05.032
Pubmed Abstract | Pubmed Full Text | CrossRef Full Text | Google Scholar
Li, B., Dettaï, A., Cruaud, C., Couloux, A., Desoutter-Meniger, M., and Lecointre, G. (2009). RNF213, a new nuclear marker for acanthomorph phylogeny. Mol. Phyl. Evol. 50, 345–363. doi: 10.1016/j.ympev.2008.11.013
Pubmed Abstract | Pubmed Full Text | CrossRef Full Text | Google Scholar
Li, C., Lu, G., and Ortí, G. (2008). Optimal data parititioning and a test case for ray-finned fishes (Actinopterygii) based on ten nuclear loci. Syst. Biol. 57, 519–539. doi: 10.1080/10635150802206883
Pubmed Abstract | Pubmed Full Text | CrossRef Full Text | Google Scholar
López, J. A., Chen, W.-J., and Ortí, G. (2004). Esociform phylogeny. Copeia 2004, 449–464. doi: 10.1643/CG-03-087R1
López-Fernández, H., Arbour, J. H., Winemiller, K. O., and Honeycutt, R. L. (2013). Testing for ancient adaptive radiations in neotropical cichlid fishes. Evolution 67, 1321–1337. doi: 10.1111/evo.12038
Pubmed Abstract | Pubmed Full Text | CrossRef Full Text | Google Scholar
Malabarba, M. C., and Malabarba, L. R. (2008). A new cichlid Tremembichthys garciae (Actinopterygii, Perciformes) from the Eocene-Oligocene of eastern Brazil. Rev. Bras. Paleontol. 11, 59–68. doi: 10.4072/rbp.2008.1.06
Malabarba, M. C., Malabarba, L. R., and del Papa, C. (2010). Gymnogeophagus eocenicus n sp. (Perciformes: Cichlidae), and Eocene cichlid from the lumbrera formation in Argentina. J. Vert. Paleont. 30, 341–350. doi: 10.1080/02724631003618348
Malabarba, M. C., Malabarba, L. R., and López-Fernández, H. (2014). On the Eocene cichlids from the lumbrera formation: additions and implications for the Neotropical ichthyofauna. J. Vert. Paleont. 34, 49–58. doi: 10.1080/02724634.2013.830021
Matschiner, M., Hanel, R., and Salzburger, W. (2011). On the origin and trigger of the notothenioid adaptive radiation. PLoS ONE 6:e18911. doi: 10.1371/journal.pone.0018911
Pubmed Abstract | Pubmed Full Text | CrossRef Full Text | Google Scholar
Meynard, C. N., Mouillot, D., Mouquet, N., and Douzery, E. J. (2012). A phylogenetic perspective on the evolution of Mediterranean teleost fishes. PLoS ONE 7:e36443. doi: 10.1371/journal.pone.0036443
Pubmed Abstract | Pubmed Full Text | CrossRef Full Text | Google Scholar
Miya, M., Friedman, M., Satoh, T. P., Takeshima, H., Sado, T., Iwasaki, W., et al. (2013). Evolutionary origin of the Scombridae (tunas and mackerels): members of a paleogene adaptive radiation with 14 other pelagic fish families. PLoS ONE 8:e73535. doi: 10.1371/journal.pone.0073535
Pubmed Abstract | Pubmed Full Text | CrossRef Full Text | Google Scholar
Miya, M., Holcroft, N. I., Satoh, T. P., Yamaguchi, M., Nishida, M., and Wiley, E. O. (2007). Mitochondrial genome and a nuclear gene indicate a novel phylogenetic position of deep-sea tube-eye fish (Stylephoridae). Ichthyol. Res. 54, 323–332. doi: 10.1007/s10228-007-0408-0
Miya, M., Satoh, T. P., and Nishida, M. (2005). The phylogenetic position of toadfishes (order Batrachoidiformes) in the higher ray-finned fish as inferred from partitioned Bayesian analysis of 102 whole mitochondrial genome sequences. Biol. J. Linn. Soc. 85, 289–306. doi: 10.1111/j.1095-8312.2005.00483.x
Miya, M., Takeshima, H., Endo, H., Ishiguro, N. B., Inoue, J. G., Mukai, T., et al. (2003). Major patterns of higher teleostean phylogenies: a new perspective based on 100 complete mitochondrial DNA sequences. Mol. Phylogenet. Evol. 26, 121–138. doi: 10.1016/S1055-7903(02)00332-9
Pubmed Abstract | Pubmed Full Text | CrossRef Full Text | Google Scholar
Monsch, K. A. (2005). Revision of the scombroid fishes from the Cenozoic of England. Trans. R. Soc. Edin. Earth Sci. 95, 445–490. doi: 10.1017/S0263593300001164
Monsch, K. A., and Bannikov, A. F. (2011). New taxonomic synopses and revision of the scombroid fishes (Scombroidei, Perciformes), including billfishes, from the Cenozoic of territories of the former USSR. Trans. R. Soc. Edin. Earth Sci. 102, 253–300. doi: 10.1017/S1755691011010085
Murray, A. M. (2001). The oldest fossil cichlids (Teleostei: Perciformes): indication of a 45 million-year-old species flock. Proc. R. Soc. Lond. B 268, 679–684. doi: 10.1098/rspb.2000.1570
Pubmed Abstract | Pubmed Full Text | CrossRef Full Text | Google Scholar
Muschick, M., Indermaur, A., and Salzburger, W. (2012). Convergent evolution within an adaptive radiation of cichlid fishes. Curr. Biol. 22, 2362–2368. doi: 10.1016/j.cub.2012.10.048
Pubmed Abstract | Pubmed Full Text | CrossRef Full Text | Google Scholar
Near, T. J., Bossu, C. M., Bradburd, G. S., Carlson, R. L., Harrington, R. C., Hollingsworth, P. R., et al. (2011). Phylogeny and temporal diversification of darters (Percidae: Etheostomatinae). Syst. Biol. 60, 565–595. doi: 10.1093/sysbio/syr052
Pubmed Abstract | Pubmed Full Text | CrossRef Full Text | Google Scholar
Near, T. J., Dornburg, A., Eytan, R. I., Keck, B., and Smith, W. L. (2013). Phylogeny and tempo of diversification in the superradiation of spiny-rayed fishes. Proc. Natl. Acad. Sci. U.S.A. 110, 12738–12743. doi: 10.1073/pnas.1304661110
Pubmed Abstract | Pubmed Full Text | CrossRef Full Text | Google Scholar
Near, T. J., Eytan, R. I., Dornburg, A., Kuhn, K. L., Moore, J. A., et al. (2012b). Resolution of ray-finned fish phylogeny and timing of diversification. Proc. Natl. Acad. Sci. U.S.A. 109, 13698–13703. doi: 10.1073/pnas.1206625109
Pubmed Abstract | Pubmed Full Text | CrossRef Full Text | Google Scholar
Near, T. J., Sandel, M., Kuhn, K. L., Unmack, P. J., Wainwright, P. C., and Smith, W. L. (2012a). Nuclear gene-inferred phylogenies resolve the relationships of the enigmatic pygmy sunfishes, Elassoma (Teleostei: Percomorpha). Mol. Phylogenet. Evol. 63, 388–395. doi: 10.1016/j.ympev.2012.01.011
Pubmed Abstract | Pubmed Full Text | CrossRef Full Text | Google Scholar
Nolf, D. (2004). Otolithes de poissons aptiens du Maestrazgo (province de Castellon, Espagne orientale). Bull. Inst. Roy. Sci. Nat. Belg. Sci. Terre 74, 101–120.
Nolf, D., and Dockery, D. T. (1990). Fish otoliths from the Coffee Sand (Campanian) of Northeastern Mississippi. Missis. Geol. 10, 1–14.
Otero, O., and Gayet, M. (1996). Anatomy and phylogeny of the Aipichthyoidea nov. of the Cenomanian Tethys and their place in the Acanthomorpha (Teleostei). N. Jb. Geol. Paläont. Abh. 202, 313–344.
Palumbi, S., Martin, A., Romano, S., McMillan, W. O., Stice, L., and Grabowski, G. (1991). The Simple Fool's Guide do PCR, v. 2.0. Honolulu: University of Hawaii.
Patterson, C. (1964). A review of Mesozoic acanthopterygian fishes, with special reference to those of the English Chalk. Phil. Trans. R. Soc. Lond. B Biol. Sci. 247, 213–482. doi: 10.1098/rstb.1964.0003
Patterson, C. (1993a). An overview of the early fossil record of acanthomorphs. Bull. Mar. Sci. 52, 29–59.
Patterson, C. (1993b). “Osteichthyes: Teleostei,” in The Fossil Record 2, ed M. J. Benton (London: Chapman and Hall), 621–656.
Posada, D. (2008). jModelTest: phylogenetic model averaging. Mol. Biol. Evol. 25, 1253–1256. doi: 10.1093/molbev/msn083
Pubmed Abstract | Pubmed Full Text | CrossRef Full Text | Google Scholar
Poulsen, J. Y., Byrkjedal, I., Willassen, E., Rees, D., Takeshima, H., Satoh, T. P., et al. (2013). Mitogenomic sequences and evidence from unique gene rearrangements corroborate evolutionary relationships of myctophiformes (Neoteleostei). BMC Evol. Biol. 13:e111. doi: 10.1186/1471-2148-13-111
Pubmed Abstract | Pubmed Full Text | CrossRef Full Text | Google Scholar
Rambaut, A. (1996). Sequence Alignment Editor Version 1.0 a1. Available online at: http://tree.bio.ed.ac.uk/software/seal/
Rosen, D. E. (1973). “Interrelationships of higher teleostean fishes,” in Interrelationships of Fishes, eds R. Greenwood, S. Miles, and C. Patterson (London: Academic Press), 397–513.
Rosen, D. E. (1982). Teleostean interrelationships, morphological function and evolutionary inference. Am. Zool. 22, 261–273.
Rosen, D. E., and Patterson, C. (1969). The structure and relationships of the paracanthopterygian fishes. Bull. Am. Mus. Nat. Hist. 141, 357–474.
Santini, F., Carnevale, G., and Sorenson, L. (2013c). First molecular scombrid timetree (Scombridae, Percomorpha) shows recent radiation of tunas following invasion of pelagic habitat. It. J. Zool. 80, 210–221. doi: 10.1080/11250003.2013.775366
Santini, F., Harmon, L. J., Carnevale, G., and Alfaro, M. E. (2009). Did genome duplication drive the origin of teleosts? A comparative study of diversification in ray-finned fishes. BMC Evol. Biol. 9:e194. doi: 10.1186/1471-2148-9-194
Pubmed Abstract | Pubmed Full Text | CrossRef Full Text | Google Scholar
Santini, F., Kong, X., Sorenson, L., Carnevale, G., Mehta, R. S., and Alfaro, M. E. (2013a). A multi-locus molecular timescale for the origin and diversification of eels (Order: Anguilliformes). Mol. Phylogenet. Evol. 69, 884–894. doi: 10.1016/j.ympev.2013.06.016
Pubmed Abstract | Pubmed Full Text | CrossRef Full Text | Google Scholar
Santini, F., Sorenson, L., and Alfaro, M. E. (2013b). A new phylogeny of tetraodontiform fishes (Tetraodontiformes, Acanthomorpha) based on 22 loci. Mol. Phylogenet. Evol. 69, 177–187. doi: 10.1016/j.ympev.2013.05.014
Pubmed Abstract | Pubmed Full Text | CrossRef Full Text | Google Scholar
Santini, F., Sorenson, L., and Carnevale, G. (2014). First multi-locus timetree of seabreams and porgies (Percomorpha: Sparidae). It. J. Zool. 81, 55–71. doi: 10.1080/11250003.2013.878960
Santini, F., and Tyler, J. C. (2003). A phylogeny of the families of fossil and extant tetraodontiform fishes (Acanthomorpha, Tetraodontiformes), Upper Cretaceous to Recent. Zool. J. Linn. Soc. 139, 565–617. doi: 10.1111/j.1096-3642.2003.00088.x
Santini, F., and Tyler, J. C. (2004). The importance of even highly incomplete fossil taxa in reconstructing the phylogenetic relationships of the Tetraodontiformes (Acanthomorpha: Pisces). Integr. Comp. Biol. 44, 349–357. doi: 10.1093/icb/44.5.349
Pubmed Abstract | Pubmed Full Text | CrossRef Full Text | Google Scholar
Schlüter, M., Steuber, T., and Parente, M. (2008). Chronostratigraphy of Campanian-Maastrichtian platform carbonates and rudist associations of Salento (Apulia, Italy). Cret. Res. 29, 100–114. doi: 10.1016/j.cretres.2007.04.005
Seehausen, O. (2006). African cichlid fish: a model system in adaptive radiation research. Proc. R. Soc. Lond. B 273, 1987–1998. doi: 10.1098/rspb.2006.3539
Pubmed Abstract | Pubmed Full Text | CrossRef Full Text | Google Scholar
Seehausen, O., Terai, Y., Magalhaes, I. S., Carleton, K. L., Mrosso, H. D., Miyagi, R., et al. (2008). Speciation through sensory drive in cichlid fish. Nature 455, 620–626. doi: 10.1038/nature07285
Pubmed Abstract | Pubmed Full Text | CrossRef Full Text | Google Scholar
Setiamarga, D. H. E., Miya, M., Yamanoue, Y., Azuma, Y., and Inoue, J. G. (2009). Divergence time of the two regional medaka populations in Japan as a new time scale for comparative genomics of vertebrates. Biol. Lett. 5, 812–816. doi: 10.1098/rsbl.2009.0419
Pubmed Abstract | Pubmed Full Text | CrossRef Full Text | Google Scholar
Shapiro, M. D., Marks, M. E., Peichel, C. L., Blackman, B. K., Nereng, K. S., Jonsson, B., et al. (2004). Genetic and developmental basis of evolutionary pelvic reduction in threespine sticklebacks. Nature 428, 717–723. doi: 10.1038/nature02415
Pubmed Abstract | Pubmed Full Text | CrossRef Full Text | Google Scholar
Shen, S. C., Lee, S. C., Shao, K. T., Chen, C. T., Mok, H. K., and Chen, C. H. (1993). Fishes of Taiwan. Taipei: Department of Zoology, National Taiwan University (in Chinese).
Sherbakov, D. Y. (1999). Molecular phylogenetic studies on the origin of biodiversity in Lake Baikal. Trends Ecol. Evol. 14, 92–95. doi: 10.1016/S0169-5347(98)01543-2
Silvestro, D., and Michalak, I. (2011). RaxmlGUI: a graphical front-end for RAxML. Org. Div. Evol. 12, 335–337. doi: 10.1007/s13127-011-0056-0
Sonnenberg, R., Nolte, A. W., and Tautz, D. (2007). An evaluation of LSU rDNA D1-D2 sequences for their use in species identification. Front. Zool. 4:6. doi: 10.1186/1742-9994-4-6
Pubmed Abstract | Pubmed Full Text | CrossRef Full Text | Google Scholar
Sorbini, L. (1981). The Cretaceous fishes of Nardò. I° Order Gasterosteiformes (Pisces). Boll. Mus. Civ. Stor. Nat. Verona 8, 1–27.
Sorbini, L., and Bannikov, A. F. (1991). The Cretaceous fishes of Nardo. II. An enigmatic spinyrayed fish. Boll. Soc. Paleontol. Ital. 30, 239–249.
Stamatakis, A. (2006). RAxML-VI-HPC: maximum likelihood-based phylogenetic analyses with thousands of taxa and mixed models. Bioinformatics 22, 2688–2690. doi: 10.1093/bioinformatics/btl446
Pubmed Abstract | Pubmed Full Text | CrossRef Full Text | Google Scholar
Stiassny, M. L. J. (1986). The limits and relationships of the acanthomorph teleosts. J. Zool. Lond. B 1, 411–460. doi: 10.1111/j.1096-3642.1986.tb00644.x
Pubmed Abstract | Pubmed Full Text | CrossRef Full Text | Google Scholar
Swofford, D. L. (2002). PAUP*. Phylogenetic Analysis Using Parsimony (*and Other Methods). Version 4. Sunderland, MA: Sinauer Associates.
Tyler, J. C., Bronzi, P., and Ghiandoni, A. (2000). The Cretaceous fishes of Nardò. 11°. A new genus and species of Zeiformes, Cretazeus rinaldii, the earliest record of the order. Boll. Mus. Civ. Stor. Nat. Verona 24, 11–28.
Tyler, J. C., and Sorbini, L. (1996). New superfamily and three new families of tetraodontiform fishes from the Upper Cretaceous: the earliest and most morphologically primitive plectognaths. Smithson. Contrib. Paleobiol. 82, 1–59. doi: 10.5479/si.00810266.82.1
Vermeij, G. J. (1977). The Mesozoic marine revolution: evidence from snails, predators and grazers. Paleobiology 3, 245–258.
Vermeij, G. J. (1987). Evolution and Escalation: An Ecological History of Life. Princeton, NJ: Princeton University Press.
Wainwright, P. C., Smith, W. L., Price, S. A., Tang, K. L., Sparks, J. S., Ferry, L. A., et al. (2012). The evolution of pharyngognathy: a phylogenetic and functional appraisal of the pharyngeal jaw key innovation in labroid fishes and beyond. Syst. Biol. 61, 1001–1027. doi: 10.1093/sysbio/sys060
Pubmed Abstract | Pubmed Full Text | CrossRef Full Text | Google Scholar
Ward, R. D., Zemlak, T. S., Innes, B. H., Last, P. R., and Hebert, P. D. N. (2005). DNA barcoding Australia's fish species. Philos. T. R. Soc. B 360, 1847–1857. doi: 10.1098/rstb.2005.1716
Pubmed Abstract | Pubmed Full Text | CrossRef Full Text | Google Scholar
Wiley, E. O., Johnson, G. D., and Dimmick, W. W. (2000). The interrelationships of acanthomorph fishes: a total evidence approach using molecular and morphological data. Biochem. Syst. Ecol. 28, 319–350. doi: 10.1016/S0305-1978(99)00069-1
Pubmed Abstract | Pubmed Full Text | CrossRef Full Text | Google Scholar
Yamanoue, Y., Miya, M., Inoue, J. G., Matsuura, K., and Nishida, M. (2006). The mitochondrial genome of spotted green pufferfish Tetraodon nigroviridis (Teleostei: Tetraodontiformes) and divergence time estimation among model organisms in fishes. Genes Gen. Syst. 81, 29–39. doi: 10.1266/ggs.81.29
Pubmed Abstract | Pubmed Full Text | CrossRef Full Text | Google Scholar
Yamanoue, Y., Miya, M., Matsuura, K., Yagishita, N., Mabuchi, K., Sakai, H., et al. (2007). Phylogenetic position of tetraodontiform fishes within the higher teleosts: bayesian inferences based on 44 whole mitochondrial genome sequences. Mol. Phylogenet. Evol. 45, 89–101. doi: 10.1016/j.ympev.2007.03.008
Pubmed Abstract | Pubmed Full Text | CrossRef Full Text | Google Scholar
Yang, Z. (1994). Maximum likelihood phylogenetic estimation from DNA sequences with variable rates over sites: approximate methods. J. Mol. Evol. 39, 306–314. doi: 10.1007/BF00160154
Pubmed Abstract | Pubmed Full Text | CrossRef Full Text | Google Scholar
Keywords: Acanthomorpha, Euteleostei, multiple loci, nuclear gene, new Paracanthopterygii, Lampriformes, Ctenosquamata, timetree
Citation: Chen W-J, Santini F, Carnevale G, Chen J-N, Liu S-H, Lavoué S and Mayden RL (2014) New insights on early evolution of spiny-rayed fishes (Teleostei: Acanthomorpha). Front. Mar. Sci. 1:53. doi: 10.3389/fmars.2014.00053
Received: 17 June 2014; Accepted: 27 September 2014;
Published online: 16 October 2014.
Edited by:
Tito Monteiro Da Cruz Lotufo, University of São Paulo, BrazilReviewed by:
Richard E. Broughton, University of Oklahoma, USAChristine Thacker, Natural History Museum of LA County, USA
Copyright © 2014 Chen, Santini, Carnevale, Chen, Liu, Lavoué and Mayden. This is an open-access article distributed under the terms of the Creative Commons Attribution License (CC BY). The use, distribution or reproduction in other forums is permitted, provided the original author(s) or licensor are credited and that the original publication in this journal is cited, in accordance with accepted academic practice. No use, distribution or reproduction is permitted which does not comply with these terms.
*Correspondence: Wei-Jen Chen, Institute of Oceanography, National Taiwan University, No. 1 Sec. 4 Roosevelt Road, Taipei 10617, Taiwan e-mail: wjchen.actinops@gmail.com